
Global Chemotherapy Drug Market
Market Size in USD Million
 USD
47,028.67 Million
USD
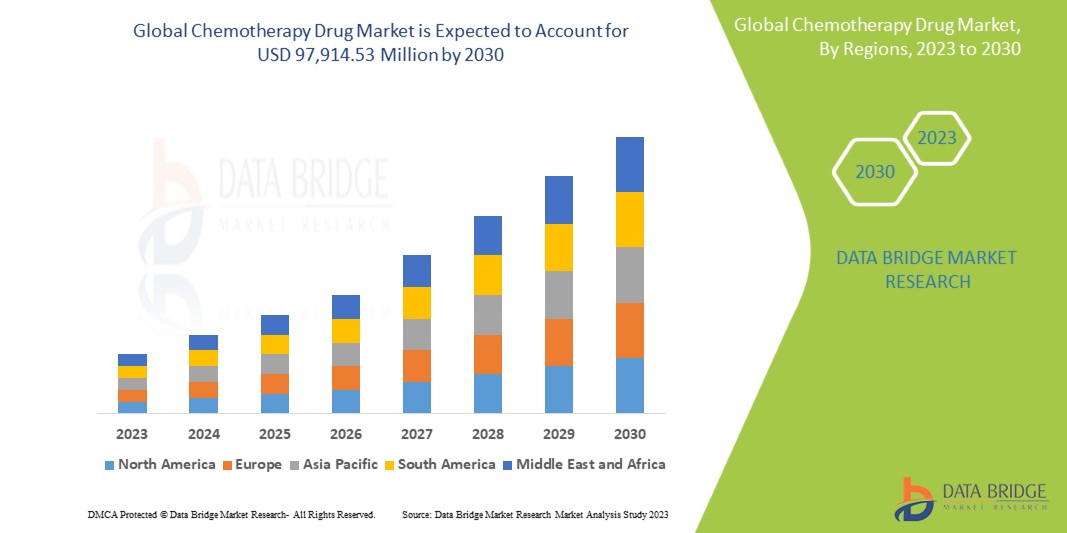
97,914.53 Million
2022
2030
USD
47,028.67 Million
USD
97,914.53 Million
2022
2030
| 2023 - 2030 | |
| USD 47,028.67 Million | |
| USD 97,914.53 Million | |
| % | |
|
Chemotherapy Drug Market Analysis and Size
Cancer is the second biggest cause of mortality worldwide, according to the World Health Organization (WHO), with an estimated 9.6 million deaths in 2018. As cancer rates rise, so will demand for chemotherapy medications. Chemotherapy is a type of cancer treatment in which medications are used to kill a large number of rapidly developing cells in the body. Chemotherapy is effective in reducing the number of cancer cells in the body, slowing cancer progression, and shrinking tumors.
Data Bridge Market Research analyses that the chemotherapy drug market which was USD 47,028.67 million in 2022, would rocket up to USD 97,914.53 million by 2030, and is expected to undergo a CAGR of 9.6% during the forecast period. This indicates the market value. “Oncology/Cancer” dominates the indication segment of the chemotherapy drug market due to the growing demand for better methods for treatment in patients. In addition to the insights on market scenarios such as market value, growth rate, segmentation, geographical coverage, and major players, the market reports curated by the Data Bridge Market Research also include depth expert analysis, patient epidemiology, pipeline analysis, pricing analysis, and regulatory framework.
Report Scope and Market Segmentation
|
Report Metric |
Details |
|
Forecast Period |
2023 to 2030 |
|
Base Year |
2022 |
|
Historic Years |
2021 (Customizable to 2015-2020) |
|
Quantitative Units |
Revenue in USD Million, Volumes in Units, and Pricing in USD |
|
Segments Covered |
Type (Alkylating Agents, Anti-metabolites, Plant Alkaloids and Terpenoids, Podophyllotoxin, Taxanes, Topoisomerase Inhibitor, Anti-Tumour Antibiotics, Hormones, Monoclonal Antibodies, Others), Indication (Oncology/Cancer, Bone Marrow Diseases, Immune System Disorders, Others), Dosage Forms (Capsule, Tablets, Injections, Others), Route of Administration (Oral, Parenteral, Others), End-Users (Hospitals, Specialty Clinics, Homecare, Others), Distribution Channel (Hospital Pharmacy, Retail Pharmacy, Online Pharmacy, Others) |
|
Countries Covered |
U.S., Canada, Mexico, Germany, Italy, U.K., France, Spain, Netherland, Belgium, Switzerland, Turkey, Russia, Rest of Europe, Japan, China, India, South Korea, Australia, Singapore, Malaysia, Thailand, Indonesia, Philippines, Rest of Asia-Pacific, Brazil, Argentina, Rest of South America, South Africa, Saudi Arabia, U.A.E., Egypt, Israel, Rest of Middle East & Africa |
|
Market Players Covered |
F. Hoffmann-La Roche Ltd. (Switzerland), Mylan N.V. (U.S.), Teva Pharmaceutical Industries Ltd.(Ireland), Sanofi (France), Pfizer Inc. (U.S.), GlaxoSmithKline plc (U.K.), Novartis AG (Switzerland), Bayer AG (Germany), Eli Lilly and Company (U.S.), Merck & Co., Inc. (U.S.), Allergan (Ireland), AstraZeneca (U.K.), Johnson & Johnson Private Limited (U.S.), Cipla Inc. (U.S.), Abbott (U.S.), AbbVie Inc. (U.S.), Merck KGaA (Germany), LEO Pharma A/S (Denmark), Bausch Health Companies Inc. (Canada), Sun Pharmaceutical Industries Ltd. (India), Aurobindo Pharma (India), Lupin (India), Hikma Pharmaceuticals PLC (U.K.), Fresenius Kabi AG (Germany), Amneal Pharmaceuticals LLC. (U.S.) |
|
Market Opportunities |
|
Market Definition
Chemotherapy is the most common type of cancer treatment drug. Chemotherapy is used to slow or stop the growth of cancer cells. Chemotherapy primarily targets malignant cells that are rapidly developing. Chemotherapy is the use of a chemical substance to stop cancer cells from growing. Chemotherapy medications come in a variety of forms. Adriamycin, Taxotere, Ellence, Paraplatin, Taxol, Cytoxan, Navelbine, Ixempra, Xeloda, Abraxane, Gemzar, and Halaven are some of the chemotherapy medications commonly used for adjuvant and neoadjuvant chemo. All of these chemotherapy medicines target various stages of the cell cycle. Drugs can be given as monotherapy or in combination therapy during chemotherapy.
Global Chemotherapy Drug Market Dynamics
Drivers
- Increasing prevalence of cancer
The rising prevalence of cancer is estimated to enhance the chemotherapy drug market's growth rate. Cancer is the greatest cause of mortality worldwide, according to the World Health Organization (WHO), accounting for approximately 10 million deaths in 2020, or nearly one in every six deaths. Around 400 000 children are diagnosed with cancer every year. Cervical cancer is the most frequent cancer in 23 of the world's countries. Chemotherapy is the most common cancer treatment, and it is often used in conjunction with other cancer treatments. Neo-adjuvant chemotherapy is chemotherapy provided before surgery and radiation therapy to shrink the tumor cell, whereas adjuvant chemotherapy is chemotherapy administered after surgery or radiation therapy to shrink the tumor cell.
- Increasing investment for healthcare infrastructure
Another significant factor influencing the growth rate of chemotherapy drug market is the rising healthcare expenditure which helps in improving its infrastructure. Also, various government organizations aims to improve the healthcare infrastructure by increasing funding and this will further influence the market dynamics.
Furthermore, rising geriatric population and rise in demand for advanced cancer drugs will expand the chemotherapy drug market. In addition, growing awareness about chemotherapy coupled with increasing number of patients undergoing chemotherapy and radiotherapy treatments are estimated to enhance the market’s growth rate.
Opportunities
- Development of innovative technology
Chemotherapy has played a critical role in prolonging the lives of cancer patients for a few years longer than they would have lived otherwise. The most recent advancement in the chemotherapy field involves injecting cancer-fighting medications (customized nanoparticles) into contaminated areas without harming healthy cells. This method has been shown to eliminate malignant cells while maintaining healthy tissue. Doctors use photon lasers to track when these nanoparticles (with tubes and pores) are released in a patient's body and study the duration and spread of these medications to kill malignant cells. The University of California, Los Angeles, is now conducting a clinical trial of this approach, which has shown to be beneficial in treating lower-stage cancer patients and is set to enter the chemotherapeutic market in the near future.
- Increase in the number of research and development activities
The chemotherapy drug market's growth is fueled by an increase in the number of research and development activities. This will provide beneficial opportunities for the chemotherapy drug market growth.
Restraints/Challenges
- Toxicity and Side Effects
Chemotherapy drugs often have significant toxic effects on healthy cells in the body, leading to a range of side effects such as nausea, fatigue, hair loss, and immune system suppression. Reducing these side effects while maintaining effectiveness is a major challenge.
- High Development Costs
The research and development of new chemotherapy drugs are costly and time-consuming. Many potential drugs do not make it through the development pipeline due to issues with safety and efficacy.
This chemotherapy drug market report provides details of new recent developments, trade regulations, import-export analysis, production analysis, value chain optimization, market share, the impact of domestic and localized market players, analyses opportunities in terms of emerging revenue pockets, changes in market regulations, strategic market growth analysis, market size, category market growths, application niches and dominance, product approvals, product launches, geographic expansions, technological innovations in the market. To gain more info on the Chemotherapy Drug market contact Data Bridge Market Research for an analyst brief, our team will help you make an informed market decision to achieve market growth.
Recent Developments
- In May 2022, Gland Pharma had announced the launch of Bortezomib for Injection in US market. Bortezomib for injection is employed for treating certain types of cancer including multiple myeloma and mantle cell lymphoma.
Global Chemotherapy Drug Market Scope
The Chemotherapy Drug market is segmented on the basis of type, indication, dosage forms, route of administration, end-users and distribution channel. The growth amongst these segments will help you analyze meagre growth segments in the industries and provide the users with a valuable market overview and market insights to help them make strategic decisions for identifying core market applications.
Type
- Alkylating Agents
- Anti-metabolites
- Plant Alkaloids and Terpenoids
- Podophyllotoxin
- Taxanes
- Topoisomerase Inhibitor
- Anti-Tumour Antibiotics
- Hormones
- Monoclonal Antibodies
- Others
Indication
- Oncology/Cancer
- Bone Marrow Diseases
- Immune System Disorders
- Others
Dosage Forms
- Capsule
- Tablets
- Injections
- Others
Route of Administration
- Oral
- Parenteral
- Intravenous
- Subcutaneous
- Others
- Others
End-Users
- Hospitals
- Specialty Clinics
- Homecare
- Others
Distribution Channel
- Hospital Pharmacy
- Retail Pharmacy
- Online Pharmacy
- Others
Global Chemotherapy Drug Market Regional Analysis/Insights
The global Chemotherapy Drug market is analyzed and market size insights and trends are provided by country, indication, type, dosage forms, route of administration, end-users and distribution channel as referenced above.
The countries covered in the Chemotherapy Drug market report are U.S., Canada, Mexico, Germany, Italy, U.K., France, Spain, Netherland, Belgium, Switzerland, Turkey, Russia, rest of Europe, Japan, China, India, South Korea, Australia, Singapore, Malaysia, Thailand, Indonesia, Philippines, rest of Asia-Pacific, Brazil, Argentina, rest of South America, South Africa, Saudi Arabia, U.A.E., Egypt, Israel, rest of Middle East & Africa.
North America is expected to dominate the market due to the presence of key manufacture of the product and rising geriatric population in this region. In addition, high research and development expenditure and presence of skilled professionals will further propel the market’s growth rate in this region.
Asia-Pacific is expected to witness significant growth during the forecast period of 2023 to 2030 due to the increased government awareness programs and rising healthcare expenditure in this region. Also, growing number of generic drugs will further cushion the market’s growth rate in this region.
The country section of the report also provides individual market impacting factors and changes in regulation in the market domestically that impact the current and future trends of the market. Data points like down-stream and upstream value chain analysis, technical trends, and porter's five forces analysis, case studies are some of the pointers used to forecast the market scenario for individual countries. Also, the presence and availability of global brands and their challenges faced due to large or scarce competition from local and domestic brands, the impact of domestic tariffs, and trade routes are considered while providing forecast analysis of the country data.
Healthcare Infrastructure Growth Installed Base and New Technology Penetration
The chemotherapy drug market also provides you with a detailed market analysis for every country's growth in healthcare expenditure for capital equipment, installed base of different kinds of products for the chemotherapy drug market, the impact of technology using lifeline curves and changes in healthcare regulatory scenarios and their impact on the chemotherapy drug market.
Competitive Landscape and Chemotherapy Drug Market Share Analysis
The chemotherapy drug market competitive landscape provides details by competitors. Details included are company overview, company financials, revenue generated, market potential, investment in research and development, new market initiatives, global presence, production sites and facilities, production capacities, company strengths and weaknesses, product launch, product width, and breadth, application dominance. The above data points provided are only related to the companies' focus related to the chemotherapy drug market.
Some of the major players operating in the chemotherapy drug market are:
- F. Hoffmann-La Roche Ltd. (Switzerland)
- Mylan N.V. (U.S.)
- Teva Pharmaceutical Industries Ltd. (Ireland)
- Sanofi (France)
- Pfizer Inc. (U.S.)
- GlaxoSmithKline plc (U.K.)
- Novartis AG (Switzerland)
- Bayer AG (Germany)
- Eli Lilly and Company (U.S.)
- Merck & Co., Inc. (U.S.)
- Allergan (Ireland)
- AstraZeneca (U.K.)
- AbbVie Inc. (U.S.)
- Johnson & Johnson Private Limited (U.S.)
- Cipla Inc. (U.S.)
- Abbott (U.S.)
- Merck KGaA (Germany)
- LEO Pharma A/S (Denmark)
- Bausch Health Companies Inc. (Canada)
- Sun Pharmaceutical Industries Ltd. (India)
- Aurobindo Pharma (India)
- Lupin (India)
- Hikma Pharmaceuticals PLC (U.K.)
- Fresenius Kabi AG (Germany)
- Amneal Pharmaceuticals LLC. (U.S.)
SKU-

- Interactive Data Analysis Dashboard
- Company Analysis Dashboard for high growth potential opportunities
- Research Analyst Access for customization & queries
- Competitor Analysis with Interactive dashboard
- Latest News, Updates & Trend analysis
- Harness the Power of Benchmark Analysis for Comprehensive Competitor Tracking
Table of Content
1 INTRODUCTION
1.1 OBJECTIVES OF THE STUDY
1.2 MARKET DEFINITION
1.3 OVERVIEW OF GLOBAL CHEMOTHERAPY DRUG MARKET
1.4 CURRENCY AND PRICING
1.5 LIMITATION
1.6 MARKETS COVERED
2 MARKET SEGMENTATION
2.1 KEY TAKEAWAYS
2.2 ARRIVING AT THE GLOBAL CHEMOTHERAPY DRUG MARKET SIZE
2.2.1 VENDOR POSITIONING GRID
2.2.2 TECHNOLOGY LIFE LINE CURVE
2.2.3 TRIPOD DATA VALIDATION MODEL
2.2.4 MARKET GUIDE
2.2.5 MULTIVARIATE MODELLING
2.2.6 TOP TO BOTTOM ANALYSIS
2.2.7 CHALLENGE MATRIX
2.2.8 APPLICATION COVERAGE GRID
2.2.9 STANDARDS OF MEASUREMENT
2.2.10 VENDOR SHARE ANALYSIS
2.2.11 DATA POINTS FROM KEY PRIMARY INTERVIEWS
2.2.12 DATA POINTS FROM KEY SECONDARY DATABASES
2.3 GLOBAL CHEMOTHERAPY DRUG MARKET: RESEARCH SNAPSHOT
2.4 ASSUMPTIONS
3 EXECUTIVE SUMMARY
4 PREMIUM INSIGHTS
4.1 PESTEL ANALYSIS
4.2 PORTER’S FIVE FORCES MODEL
5 INDUSTRY INSIGHTS
5.1 PATENT ANALYSIS
5.1.1 PATENT LANDSCAPE
5.1.2 USPTO NUMBER
5.1.3 PATENT EXPIRY
5.1.4 EPIO NUMBER
5.1.5 PATENT STRENGTH AND QUALITY
5.1.6 PATENT CLAIMS
5.1.7 PATENT CITATIONS
5.1.8 PATENT LITIGATION AND LICENSING
5.1.9 FILE OF PATENT
5.1.10 PATENT RECEIVED CONTRIES
5.1.11 TECHNOLOGY BACKGROUND
5.2 DRUG TREATMENT RATE BY MATURED MARKETS
5.3 DEMOGRAPHIC TRENDS: IMPACTS ON ALL INCIDENCE RATES
5.4 PATIENT FLOW DIAGRAM
5.5 KEY PRICING STRATEGIES
5.6 KEY PATIENT ENROLLMENT STRATEGIES
5.7 INTERVIEWS WITH SPECIALIST
5.8 OTHER KOL SNAPSHOTS
6 EPIDEMIOLOGY
6.1 INCIDENCE OF ALL BY GENDER
6.2 TREATMENT RATE
6.3 MORTALITY RATE
6.4 DRUG ADHERENCE AND THERAPY SWITCH MODEL
6.5 PATIENT TREATMENT SUCCESS RATES
7 MERGERS AND ACQUISITION
7.1 LICENSING
7.2 COMMERCIALIZATION AGREEMENTS
8 REGULATORY FRAMEWORK
8.1 REGULATORY APPROVAL PROCESS
8.2 GEOGRAPHIES’ EASE OF REGULATORY APPROVAL
8.3 REGULATORY APPROVAL PATHWAYS
8.4 LICENSING AND REGISTRATION
8.5 POST-MARKETING SURVEILLANCE
8.6 GOOD MANUFACTURING PRACTICES (GMPS) GUIDELINES
9 PIPELINE ANALYSIS
9.1 CLINICAL TRIALS AND PHASE ANALYSIS
9.2 DRUG THERAPY PIPELINE
9.3 PHASE III CANDIDATES
9.4 PHASE II CANDIDATES
9.5 PHASE I CANDIDATES
9.6 OTHERS (PRE-CLINICAL AND RESEARCH)
TABLE 1 GLOBAL CLINICAL TRIAL MARKET FOR CHEMOTHERAPY DRUG MARKET
Company Name Therapeutic Area
XX XX
XX XX
XX XX
XX XX
XX XX
XX XX
Sources: Press Releases, Annual Reports, SEC Filings, Investor Presentations, Other Government Sources, Analysis Based on Inputs from Secondary, Expert Interviews
TABLE 2 DISTRIBUTION OF PRODUCTS AND PROJECTS BY PHASE CHEMOTHERAPY DRUG MARKET
Phase Number of Projects
Preclinical/Research Projects XX
Clinical Development XX
Phase I XX
Phase II XX
Phase III XX
U.S. Filed/Approved But Not Yest Marketed XX
Total XX
Sources: Press Releases, Annual Reports, SEC Filings, Investor Presentations, Other Government Sources, Analysis Based on Inputs from Secondary, Expert Interviews
TABLE 3 DISTRIBUTION OF PROJECTS BY THERAPEUTIC AREA AND PHASE CHEMOTHERAPY DRUG MARKET
Therapeutic Area Preclinical/ Research Project
XX XX
XX XX
XX XX
XX XX
XX XX
Total Projects XX
Sources: Press Releases, Annual Reports, SEC Filings, Investor Presentations, Other Government Sources, Analysis Based on Inputs from Secondary, Expert Interviews
TABLE 4 DISTRIBUTION OF PROJECTS BY SCIENTIFIC APPROACH AND PHASE CHEMOTHERAPY DRUG MARKET
Technology Preclinical/ Research Project
XX XX
XX XX
XX XX
XX XX
XX XX
Total Projects XX
Sources: Press Releases, Annual Reports, SEC Filings, Investor Presentations, Other Government Sources, Analysis Based on Inputs from Secondary, Expert Interviews
FIGURE 1 TOP ENTITIES BASED ON R&D GLANCE FOR CHEMOTHERAPY DRUG MARKET
Sources: Press Releases, Annual Reports, SEC Filings, Investor Presentations, Other Government Sources, Analysis Based on Inputs from Secondary, Expert Interviews
10 MARKETED DRUG ANALYSIS
10.1 DRUG
10.1.1 BRAND NAME
10.1.2 GENERICS NAME
10.2 THERAPEUTIC INDIACTION
10.3 PHARACOLOGICAL CLASS OF THE DRUG
10.4 DRUG PRIMARY INDICATION
10.5 MARKET STATUS
10.6 MEDICATION TYPE
10.7 DRUG DOSAGES FORM
10.8 DOSAGES AVAILABILITY
10.9 PACKAGING TYPE
10.1 DRUG ROUTE OF ADMINISTRATION
10.11 DOSING FREQUENCY
10.12 DRUG INSIGHT
10.13 AN OVERVIEW OF THE DRUG DEVELOPMENT ACTIVITIES SUCH AS REGULATORY MILSTONE, SAFETY DATA AND EFFICACY DATA, MARKET EXCLUSIVITY DATA.
10.13.1 FORECAST MARKET OUTLOOK
10.13.2 CROSS COMPETITION
10.13.3 THERAPEUTIC PORTFOLIO
10.13.4 CURRENT DEVELOPMENT SCENARIO
11 MARKET ACCESS
11.1 10-YEAR MARKET FORECAST
11.2 CLINICAL TRIAL RECENT UPDATES
11.3 ANNUAL NEW FDA APPROVED DRUGS
11.4 DRUGS MANUFACTURER AND DEALS
11.5 MAJOR DRUG UPTAKE
11.6 CURRENT TREATMENT PRACTICES
11.7 IMPACT OF UPCOMING THERAPY
12 R & D ANALYSIS
12.1 COMPARATIVE ANALYSIS
12.2 DRUG DEVELOPMENTAL LANDSCAPE
12.3 IN-DEPTH INSIGHTS ON REGULATORY MILESTONES
12.4 THERAPEUTIC ASSESSMENT
12.5 ASSET-BASED COLLABORATIONS AND PARTNERSHIPS
13 MARKET OVERVIEW
13.1 DRIVERS
13.2 RESTRAINTS
13.3 OPPORTUNITIES
13.4 CHALLENGES
14 GLOBAL CHEMOTHERAPY DRUG MARKET, BY TYPE
14.1 OVERVIEW
14.2 MARKETED / APPROVED DRUGS
14.2.1 CYTOTOXIC DRUGS
14.2.1.1. BY TYPE
14.2.1.1.1. ALKYLATING AGENT
14.2.1.1.1.1 CISPLATIN
14.2.1.1.1.2 CHLORAMBUCIL
14.2.1.1.1.3 CYCLOPHOSPHAMIDE
14.2.1.1.1.4 MELPHALAN
14.2.1.1.1.5 CARBOPLATIN
14.2.1.1.1.6 OTHERS
14.2.1.1.2. ANTIMETABOLITES
14.2.1.1.2.1 AZACITIDINE
14.2.1.1.2.2 METHOTREXATE
14.2.1.1.2.3 FLUOROURACIL
14.2.1.1.2.4 FLUDARABINE
14.2.1.1.2.5 GEMCITABINE
14.2.1.1.2.6 CYTARABINE
14.2.1.1.2.7 OTHERS
14.2.1.1.3. TOPOISOMERASE INHIBITORS (I AND II)
14.2.1.1.3.1 IRINOTECAN
14.2.1.1.3.2 ETOPOSIDE
14.2.1.1.3.3 TOPOTECAN
14.2.1.1.3.4 OTHERS
14.2.1.1.4. ANTIMITOTIC DRUGS
14.2.1.1.4.1 CABAZITAXEL
14.2.1.1.4.2 VINCRISTINE
14.2.1.1.4.3 VINBLASTINE
14.2.1.1.4.4 OTHERS
14.2.1.1.5. OTHERS
14.2.1.2. BY DRUG TYPE
14.2.1.2.1. BRANDED
14.2.1.2.2. GENERICS
14.2.2 TARGETED DRUGS
14.2.2.1. BY TYPE
14.2.2.1.1. MONOCLONAL ANTIBODIES
14.2.2.1.1.1 TRASTUZUMAB
14.2.2.1.1.2 OFATUMUMAB
14.2.2.1.1.3 OBINUTUZUMAB
14.2.2.1.1.4 RITUXIMAB
14.2.2.1.1.5 ALEMTUZUMAB
14.2.2.1.1.6 BEVACIZUMAB
14.2.2.1.1.7 OTHERS
14.2.2.1.2. TYROSINE KINASE INHIBITORS
14.2.2.1.2.1 IMATINIB
14.2.2.1.2.2 DASATINIB
14.2.2.1.2.3 NILOTINIB
14.2.2.1.2.4 BOSUTINIB
14.2.2.1.2.5 SUNITINIB
14.2.2.1.2.6 PONATINIB
14.2.2.1.2.7 OTHERS
14.2.2.1.3. PROTEASOME INHIBITOR
14.2.2.1.3.1 CARFILZOMIB
14.2.2.1.3.2 BORTEZOMIB
14.2.2.1.3.3 OTHERS
14.2.2.1.4. OTHERS
14.2.2.2. BY DRUG TYPE
14.2.2.2.1. BRANDED
14.2.2.2.2. GENERICS
14.2.3 HORMONAL DRUGS
14.2.3.1. BY TYPE
14.2.3.1.1. OVARIAN FUNCTION BLOCKERS
14.2.3.1.1.1 GOSERELIN
14.2.3.1.1.2 LEUPRORELIN
14.2.3.1.1.3 TRIPTORELIN
14.2.3.1.2. ESTROGEN PRODUCTION BLOCKERS
14.2.3.1.2.1 AROMATASE INHIBITORS (AIS)
14.2.3.1.2.2 ANASTROZOLE
14.2.3.1.2.3 EXEMESTANE
14.2.3.1.2.4 LETROZOLE
14.2.3.1.3. ESTROGEN’S EFFECTS BLOCKERS
14.2.3.1.4. SELECTIVE ESTROGEN RECEPTOR MODULATORS (SERMS)
14.2.3.1.5. TAMOXIFEN (NOLVADEX)
14.2.3.1.6. TOREMIFENE (FARESTON)
14.2.3.1.7. FULVESTRANT (FASLODEX)
14.2.3.1.8. OTHER ANTIESTROGEN DRUGS
14.2.3.1.9. OTHERS
14.2.3.2. BY DRUG TYPE
14.2.3.2.1. BRANDED
14.2.3.2.2. GENERICS
14.2.4 ANTI-TUMOUR ANTIBIOTICS
14.2.4.1. ANTHRACYCLINES
14.2.4.1.1. EPIRUBICIN
14.2.4.1.2. MITOXANTRONE
14.2.4.1.3. VALRUBICIN
14.2.4.1.4. DAUNORUBICIN
14.2.4.1.5. DOXORUBICIN
14.2.4.1.6. IDARUBICIN
14.2.4.1.7. OTHERS
14.2.4.2. MISCELLANEOUS
14.2.4.2.1. BLEOMYCIN
14.2.4.2.2. DACTINOMYCIN
14.2.4.2.3. MITOMYCIN C
14.2.4.3. OTHERS
14.2.5 PLANT ALKALOIDS AND TERPENOIDS
14.2.5.1. CAMPTOTHECIN
14.2.5.2. ROHITUKINE
14.2.5.3. HARRINGTONINE
14.2.5.4. ACRONYCIN
14.2.5.5. THALICARPINE
14.2.5.6. ELLIPTICINE
14.2.5.7. USAMBARENSINE
14.2.5.8. MATRINES
14.2.5.9. OTHERS
14.2.6 TAXANES
14.2.6.1. PACLITAXEL
14.2.6.1.1. TAXOL
14.2.6.1.2. ANZATAX
14.2.6.1.3. PAXENE
14.2.6.1.4. ABRAXANE
14.2.6.2. DOCETAXEL
14.2.6.2.1. TAXOTERE
14.2.6.2.2. OTHERS
14.2.6.3. CABAZITAXEL
14.2.6.3.1. JEVTANA
14.2.6.3.2. OTHERS
14.2.7 PODOPHYLLOTOXIN
14.3 PIPELINE DRUGS
14.3.1 AMG 193
14.3.2 VERU 111
14.3.3 MBM-02
14.3.4 JZP351
14.3.5 MK-5890
14.3.6 UBLITUXIMAB
14.3.7 OFATUMUMAB (OMB 157)
14.3.8 BAT4706
14.3.9 BAT7104
14.3.10 ABP 798
14.3.11 OTHERS
15 GLOBAL CHEMOTHERAPY DRUG MARKET, BY DRUGS TYPE
15.1 OVERVIEW
15.2 BRANDED
15.2.1 PLATINOL AQ
15.2.2 LEUKERAN
15.2.3 CYTOXAN
15.2.4 ONUREG
15.2.5 ALKERAN IV
15.2.6 EVOMELA
15.2.7 ONXOL
15.2.8 PACLITAXEL NOVAPLUS
15.2.9 CYTOSAR-U
15.2.10 TARABINE PFS
15.2.11 OTHERS
15.3 GENERICS
16 GLOBAL CHEMOTHERAPY DRUG MARKET, BY ROUTE OF ADMINISTRATION
16.1 OVERVIEW
16.2 ORAL
16.2.1 TABLETS
16.2.2 CAPSULE
16.2.3 OTHERS
16.3 PARENTERAL
16.3.1 INTRAVENOUS
16.3.2 INTRAMUSCULAR
16.3.3 OTHERS
16.4 OTHERS
17 GLOBAL CHEMOTHERAPY DRUG MARKET, BY POPULATION TYPE
17.1 OVERVIEW
17.2 PEDIATRIC
17.3 ADULTS
17.4 GERIATRIC
18 GLOBAL CHEMOTHERAPY DRUG MARKET, BY GENDER
18.1 OVERVIEW
18.2 MALE
18.2.1 PEDIATRIC
18.2.2 ADULTS
18.2.3 GERIATRIC
18.3 FEMALE
18.3.1 PEDIATRIC
18.3.2 ADULTS
18.3.3 GERIATRIC
19 GLOBAL CHEMOTHERAPY DRUG MARKET, BY APPLICATION
19.1 OVERVIEW
19.2 ONCOLOGY/CANCER
19.2.1 LUNG CANCER
19.2.2 BREAST CANCER
19.2.3 COLORECTAL CANCER
19.2.4 PROSTATE CANCER
19.2.5 BLOOD CANCER
19.2.5.1. LEUKEMIA
19.2.5.2. NON-HODGKIN LYMPHOMA
19.2.5.3. HODGKIN LYMPHOMA
19.2.5.4. MULTIPLE MYELOMA
19.2.5.5. OTHERS
19.2.6 BLADDER CANCER
19.2.7 ENDOMETRIAL CANCER
19.2.8 KIDNEY CANCER
19.2.9 LIVER CANCER
19.2.10 PANCREATIC CANCER
19.2.11 THYROID CANCER
19.3 BONE MARROW DISEASES
19.4 IMMUNE SYSTEM DISORDERS
19.5 OTHERS
20 GLOBAL CHEMOTHERAPY DRUG MARKET, BY END USER
20.1 OVERVIEW
20.2 HOSPITALS
20.2.1 BY TYPE
20.2.1.1. PUBLIC
20.2.1.2. PRIVATE
20.2.2 BY LEVEL
20.2.2.1. TIER 1
20.2.2.2. TIER 2
20.2.2.3. TIER 3
20.3 SPECIALITY CLINICS
20.3.1 PUBLIC
20.3.2 PRIVATE
20.4 HOME HEALTHCARE
20.5 ONCOLOGY CENTRES
20.6 AMBUALTORY SURGICAL CENTERS
20.7 RESEARCH AND ACADEMIC INSTITUTES
20.7.1 GOVERNMENT
20.7.2 PRIVATE
20.8 OTHERS
21 GLOBAL CHEMOTHERAPY DRUG MARKET, BY DISTRIBUTION CHANNEL
21.1 OVERVIEW
21.2 DIRECT TENDER
21.3 RETAIL SALES
21.3.1 ONLINE
21.3.1.1. COMPANY WEBISTE
21.3.1.2. E-PHARMACY
21.3.1.3. OTHERS
21.3.2 OFFLINE
21.3.2.1. HOSPITAL PHARMACY
21.3.2.2. MEDICINE STORES
21.3.2.3. OTHERS
21.4 OTHERS
22 GLOBAL CHEMOTHERAPY DRUG MARKET, SWOT AND DBMR ANALYSIS
23 GLOBAL CHEMOTHERAPY DRUG MARKET, COMPANY LANDSCAPE
23.1 COMPANY SHARE ANALYSIS: GLOBAL
23.2 COMPANY SHARE ANALYSIS: NORTH AMERICA
23.3 COMPANY SHARE ANALYSIS: EUROPE
23.4 COMPANY SHARE ANALYSIS: ASIA-PACIFIC
23.5 MERGERS & ACQUISITIONS
23.6 NEW PRODUCT DEVELOPMENT & APPROVALS
23.7 EXPANSIONS
23.8 REGULATORY CHANGES
23.9 PARTNERSHIP AND OTHER STRATEGIC DEVELOPMENTS
24 GLOBAL CHEMOTHERAPY DRUG MARKET, BY REGION
GLOBAL CHEMOTHERAPY DRUG MARKET, (ALL SEGMENTATION PROVIDED ABOVE IS REPRESENTED IN THIS CHAPTER BY COUNTRY)
24.1 NORTH AMERICA
24.1.1 U.S.
24.1.2 CANADA
24.1.3 MEXICO
24.2 EUROPE
24.2.1 GERMANY
24.2.2 U.K.
24.2.3 ITALY
24.2.4 FRANCE
24.2.5 SPAIN
24.2.6 RUSSIA
24.2.7 SWITZERLAND
24.2.8 TURKEY
24.2.9 BELGIUM
24.2.10 NETHERLANDS
24.2.11 DENMARK
24.2.12 SWEDEN
24.2.13 POLAND
24.2.14 NORWAY
24.2.15 FINLAND
24.2.16 REST OF EUROPE
24.3 ASIA-PACIFIC
24.3.1 JAPAN
24.3.2 CHINA
24.3.3 SOUTH KOREA
24.3.4 INDIA
24.3.5 SINGAPORE
24.3.6 THAILAND
24.3.7 INDONESIA
24.3.8 MALAYSIA
24.3.9 PHILIPPINES
24.3.10 AUSTRALIA
24.3.11 NEW ZEALAND
24.3.12 VIETNAM
24.3.13 TAIWAN
24.3.14 REST OF ASIA-PACIFIC
24.4 SOUTH AMERICA
24.4.1 BRAZIL
24.4.2 ARGENTINA
24.4.3 REST OF SOUTH AMERICA
24.5 MIDDLE EAST AND AFRICA
24.5.1 SOUTH AFRICA
24.5.2 EGYPT
24.5.3 BAHRAIN
24.5.4 UNITED ARAB EMIRATES
24.5.5 KUWAIT
24.5.6 OMAN
24.5.7 QATAR
24.5.8 SAUDI ARABIA
24.5.9 REST OF MEA
24.6 KEY PRIMARY INSIGHTS: BY MAJOR COUNTRIES
25 GLOBAL CHEMOTHERAPY DRUG MARKET, COMPANY PROFILE
25.1 MARKETED MANUFACTURES
25.1.1 BRISTOL MYERS SQUIBB
25.1.1.1. COMPANY OVERVIEW
25.1.1.2. REVENUE ANALYSIS
25.1.1.3. GEOGRAPHIC PRESENCE
25.1.1.4. PRODUCT PORTFOLIO
25.1.1.5. RECENT DEVELOPMENTS
25.1.2 PFIZER INC.
25.1.2.1. COMPANY OVERVIEW
25.1.2.2. REVENUE ANALYSIS
25.1.2.3. GEOGRAPHIC PRESENCE
25.1.2.4. PRODUCT PORTFOLIO
25.1.2.5. RECENT DEVELOPMENTS
25.1.3 ASTRAZENECA
25.1.3.1. COMPANY OVERVIEW
25.1.3.2. REVENUE ANALYSIS
25.1.3.3. GEOGRAPHIC PRESENCE
25.1.3.4. PRODUCT PORTFOLIO
25.1.3.5. RECENT DEVELOPMENTS
25.1.4 BIOGEN + GENENTECH, INC. (F. HOFFMANN-LA ROCHE LTD)
25.1.4.1. COMPANY OVERVIEW
25.1.4.2. REVENUE ANALYSIS
25.1.4.3. GEOGRAPHIC PRESENCE
25.1.4.4. PRODUCT PORTFOLIO
25.1.4.5. RECENT DEVELOPMENTS
25.1.5 SANDOZ AG (NOVARTIES AG)
25.1.5.1. COMPANY OVERVIEW
25.1.5.2. REVENUE ANALYSIS
25.1.5.3. GEOGRAPHIC PRESENCE
25.1.5.4. PRODUCT PORTFOLIO
25.1.5.5. RECENT DEVELOPMENTS
25.1.6 CELLTRION HEALTHCARE CO., LTD.
25.1.6.1. COMPANY OVERVIEW
25.1.6.2. REVENUE ANALYSIS
25.1.6.3. GEOGRAPHIC PRESENCE
25.1.6.4. PRODUCT PORTFOLIO
25.1.6.5. RECENT DEVELOPMENTS
25.1.7 FRESENIUS HEALTH CARE GROUP
25.1.7.1. COMPANY OVERVIEW
25.1.7.2. REVENUE ANALYSIS
25.1.7.3. GEOGRAPHIC PRESENCE
25.1.7.4. PRODUCT PORTFOLIO
25.1.7.5. RECENT DEVELOPMENTS
25.1.8 BAXTER
25.1.8.1. COMPANY OVERVIEW
25.1.8.2. REVENUE ANALYSIS
25.1.8.3. GEOGRAPHIC PRESENCE
25.1.8.4. PRODUCT PORTFOLIO
25.1.8.5. RECENT DEVELOPMENTS
25.1.9 LUPIN
25.1.9.1. COMPANY OVERVIEW
25.1.9.2. REVENUE ANALYSIS
25.1.9.3. GEOGRAPHIC PRESENCE
25.1.9.4. PRODUCT PORTFOLIO
25.1.9.5. RECENT DEVELOPMENTS
25.1.10 ADVACARE PHARMA
25.1.10.1. COMPANY OVERVIEW
25.1.10.2. REVENUE ANALYSIS
25.1.10.3. GEOGRAPHIC PRESENCE
25.1.10.4. PRODUCT PORTFOLIO
25.1.10.5. RECENT DEVELOPMENTS
25.1.11 EXELIXIS, INC. + IPSEN PHARMA
25.1.11.1. COMPANY OVERVIEW
25.1.11.2. REVENUE ANALYSIS
25.1.11.3. GEOGRAPHIC PRESENCE
25.1.11.4. PRODUCT PORTFOLIO
25.1.11.5. RECENT DEVELOPMENTS
25.1.12 JOHNSON & JOHNSON SERVICES, INC.
25.1.12.1. COMPANY OVERVIEW
25.1.12.2. REVENUE ANALYSIS
25.1.12.3. GEOGRAPHIC PRESENCE
25.1.12.4. PRODUCT PORTFOLIO
25.1.12.5. RECENT DEVELOPMENTS
25.1.13 ASTELLAS PHARMA INC.
25.1.13.1. COMPANY OVERVIEW
25.1.13.2. REVENUE ANALYSIS
25.1.13.3. GEOGRAPHIC PRESENCE
25.1.13.4. PRODUCT PORTFOLIO
25.1.13.5. RECENT DEVELOPMENTS
25.1.14 AMNEAL PHARMACEUTICALS LLC.
25.1.14.1. COMPANY OVERVIEW
25.1.14.2. REVENUE ANALYSIS
25.1.14.3. GEOGRAPHIC PRESENCE
25.1.14.4. PRODUCT PORTFOLIO
25.1.14.5. RECENT DEVELOPMENTS
25.1.15 BOEHRINGER INGELHEIM INTERNATIONAL GMBH
25.1.15.1. COMPANY OVERVIEW
25.1.15.2. REVENUE ANALYSIS
25.1.15.3. GEOGRAPHIC PRESENCE
25.1.15.4. PRODUCT PORTFOLIO
25.1.15.5. RECENT DEVELOPMENTS
25.1.16 CIPLA
25.1.16.1. COMPANY OVERVIEW
25.1.16.2. REVENUE ANALYSIS
25.1.16.3. GEOGRAPHIC PRESENCE
25.1.16.4. PRODUCT PORTFOLIO
25.1.16.5. RECENT DEVELOPMENTS
25.1.17 CHEPLAPHARM ARZNEIMITTEL GMBH
25.1.17.1. COMPANY OVERVIEW
25.1.17.2. REVENUE ANALYSIS
25.1.17.3. GEOGRAPHIC PRESENCE
25.1.17.4. PRODUCT PORTFOLIO
25.1.17.5. RECENT DEVELOPMENTS
25.1.18 ELI LILLY AND COMPANY
25.1.18.1. COMPANY OVERVIEW
25.1.18.2. REVENUE ANALYSIS
25.1.18.3. GEOGRAPHIC PRESENCE
25.1.18.4. PRODUCT PORTFOLIO
25.1.18.5. RECENT DEVELOPMENTS
25.1.19 JAZZ PHARMACEUTICALS, INC.
25.1.19.1. COMPANY OVERVIEW
25.1.19.2. REVENUE ANALYSIS
25.1.19.3. GEOGRAPHIC PRESENCE
25.1.19.4. PRODUCT PORTFOLIO
25.1.19.5. RECENT DEVELOPMENTS
25.1.20 THYMOORGAN PHARMAZIE GMBH (HIKMA PHARMACEUTICALS PLC)
25.1.20.1. COMPANY OVERVIEW
25.1.20.2. REVENUE ANALYSIS
25.1.20.3. GEOGRAPHIC PRESENCE
25.1.20.4. PRODUCT PORTFOLIO
25.1.20.5. RECENT DEVELOPMENTS
25.1.21 VITARIS INC.
25.1.21.1. COMPANY OVERVIEW
25.1.21.2. REVENUE ANALYSIS
25.1.21.3. GEOGRAPHIC PRESENCE
25.1.21.4. PRODUCT PORTFOLIO
25.1.21.5. RECENT DEVELOPMENTS
25.1.22 TEVA PHARMACEUTICAL INDUSTRIES LTD.
25.1.22.1. COMPANY OVERVIEW
25.1.22.2. REVENUE ANALYSIS
25.1.22.3. GEOGRAPHIC PRESENCE
25.1.22.4. PRODUCT PORTFOLIO
25.1.22.5. RECENT DEVELOPMENTS
25.1.23 SUN PHARMACEUTICAL INDUSTRIES LIMITED
25.1.23.1. COMPANY OVERVIEW
25.1.23.2. REVENUE ANALYSIS
25.1.23.3. GEOGRAPHIC PRESENCE
25.1.23.4. PRODUCT PORTFOLIO
25.1.23.5. RECENT DEVELOPMENTS
25.2 PIPELINE MANUFACTURES
25.2.1 AMGEN INC.
25.2.1.1. COMPANY OVERVIEW
25.2.1.2. REVENUE ANALYSIS
25.2.1.3. GEOGRAPHIC PRESENCE
25.2.1.4. PRODUCT PORTFOLIO
25.2.1.5. RECENT DEVELOPMENTS
25.2.2 GSK PLC
25.2.2.1. COMPANY OVERVIEW
25.2.2.2. REVENUE ANALYSIS
25.2.2.3. GEOGRAPHIC PRESENCE
25.2.2.4. PRODUCT PORTFOLIO
25.2.2.5. RECENT DEVELOPMENTS
25.2.3 BIO-THERA PHARMACEUTICALS CO., LTD.
25.2.3.1. COMPANY OVERVIEW
25.2.3.2. REVENUE ANALYSIS
25.2.3.3. GEOGRAPHIC PRESENCE
25.2.3.4. PRODUCT PORTFOLIO
25.2.3.5. RECENT DEVELOPMENTS
25.2.4 AMGEN AND ALLERGAN PLC. (ABBVIE)
25.2.4.1. COMPANY OVERVIEW
25.2.4.2. REVENUE ANALYSIS
25.2.4.3. GEOGRAPHIC PRESENCE
25.2.4.4. PRODUCT PORTFOLIO
25.2.4.5. RECENT DEVELOPMENTS
25.2.5 PROTHERAGEN INC.
25.2.5.1. COMPANY OVERVIEW
25.2.5.2. REVENUE ANALYSIS
25.2.5.3. GEOGRAPHIC PRESENCE
25.2.5.4. PRODUCT PORTFOLIO
25.2.5.5. RECENT DEVELOPMENTS
25.2.6 NOVARTIS AG
25.2.6.1. COMPANY OVERVIEW
25.2.6.2. REVENUE ANALYSIS
25.2.6.3. GEOGRAPHIC PRESENCE
25.2.6.4. PRODUCT PORTFOLIO
25.2.6.5. RECENT DEVELOPMENTS
25.2.7 MERCK & CO., INC.
25.2.7.1. COMPANY OVERVIEW
25.2.7.2. REVENUE ANALYSIS
25.2.7.3. GEOGRAPHIC PRESENCE
25.2.7.4. PRODUCT PORTFOLIO
25.2.7.5. RECENT DEVELOPMENTS
25.2.8 VERU INC.
25.2.8.1. COMPANY OVERVIEW
25.2.8.2. REVENUE ANALYSIS
25.2.8.3. GEOGRAPHIC PRESENCE
25.2.8.4. PRODUCT PORTFOLIO
25.2.8.5. RECENT DEVELOPMENTS
25.2.9 MATRIX BIOMED, INC.
25.2.9.1. COMPANY OVERVIEW
25.2.9.2. REVENUE ANALYSIS
25.2.9.3. GEOGRAPHIC PRESENCE
25.2.9.4. PRODUCT PORTFOLIO
25.2.9.5. RECENT DEVELOPMENTS
25.2.10 TG THERAPEUTICS, INC.
25.2.10.1. COMPANY OVERVIEW
25.2.10.2. REVENUE ANALYSIS
25.2.10.3. GEOGRAPHIC PRESENCE
25.2.10.4. PRODUCT PORTFOLIO
25.2.10.5. RECENT DEVELOPMENTS
26 RELATED REPORTS
27 CONCLUSION
28 QUESTIONNAIRE
29 ABOUT DATA BRIDGE MARKET RESEARCH
Data collection and base year analysis are done using data collection modules with large sample sizes. The stage includes obtaining market information or related data through various sources and strategies. It includes examining and planning all the data acquired from the past in advance. It likewise envelops the examination of information inconsistencies seen across different information sources. The market data is analysed and estimated using market statistical and coherent models. Also, market share analysis and key trend analysis are the major success factors in the market report. To know more, please request an analyst call or drop down your inquiry.
The key research methodology used by DBMR research team is data triangulation which involves data mining, analysis of the impact of data variables on the market and primary (industry expert) validation. Data models include Vendor Positioning Grid, Market Time Line Analysis, Market Overview and Guide, Company Positioning Grid, Patent Analysis, Pricing Analysis, Company Market Share Analysis, Standards of Measurement, Global versus Regional and Vendor Share Analysis. To know more about the research methodology, drop in an inquiry to speak to our industry experts.
Data Bridge Market Research is a leader in advanced formative research. We take pride in servicing our existing and new customers with data and analysis that match and suits their goal. The report can be customized to include price trend analysis of target brands understanding the market for additional countries (ask for the list of countries), clinical trial results data, literature review, refurbished market and product base analysis. Market analysis of target competitors can be analyzed from technology-based analysis to market portfolio strategies. We can add as many competitors that you require data about in the format and data style you are looking for. Our team of analysts can also provide you data in crude raw excel files pivot tables (Fact book) or can assist you in creating presentations from the data sets available in the report.


