
Global Convenience And Frozen Food Market
Market Size in USD Billion
 USD
283.63 Billion
USD
419.05 Billion
2025
2033
USD
283.63 Billion
USD
419.05 Billion
2025
2033
| 2026 - 2033 | |
| USD 283.63 Billion | |
| USD 419.05 Billion | |
| % | |
|
Convenience and Frozen Food Market Overview
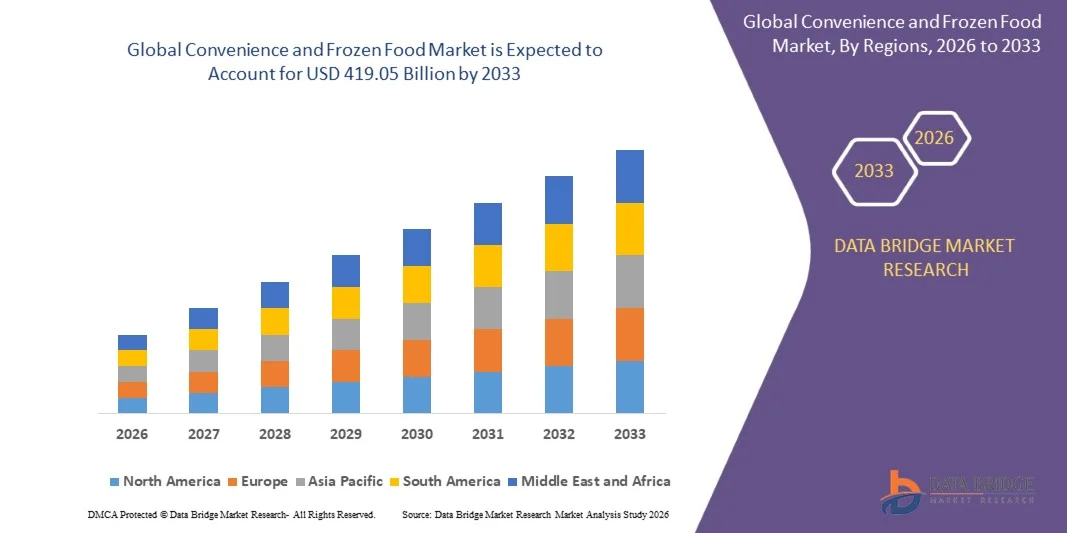
The Convenience and Frozen Food Market was valued at USD 283.63 Billion in 2025 and is projected to reach USD 419.05 Billion by 2033, growing at a CAGR of 5.00% from 2026 to 2033. The market is experiencing consistent growth driven by rising demand for ready-to-eat meals, increasing urbanization, and growing preference for time-saving food solutions among working populations. Expanding cold chain infrastructure, rapid growth of organized retail, and increasing penetration of e-commerce grocery platforms are further supporting market growth across global regions.
The growing global shift toward convenience-oriented consumption patterns, coupled with increasing demand for high-protein frozen foods and packaged meal solutions, is significantly reshaping the food industry landscape. Changing lifestyles, rising disposable incomes, and increasing acceptance of frozen foods as a fresh-quality alternative are encouraging higher adoption across households and food service sectors. In addition, continuous product innovation in clean-label, organic, and premium frozen food categories is further accelerating long-term market expansion.
Key Market Trends & Insights
- Europe dominated the Convenience and Frozen Food Market with the largest revenue share of 40% in 2025, supported by strong consumption of packaged and frozen food products, high urbanization levels, and well-established retail and cold chain infrastructure
- The retail segment led the market with a 60% share in 2025, driven by strong supermarket and hypermarket penetration along with rising household consumption of packaged food products
- Asia-Pacific is expected to be the fastest-growing region at a CAGR of 7.98% from 2026 to 2033, fueled by rising urbanization, increasing disposable incomes, and expanding middle-class populations across countries such as China, India, Japan, and South Korea
- Ready-to-eat is the fastest-growing type, projected to register a CAGR of 13.5% from 2026 to 2033, supported by increasing consumer preference for instant consumption meals with minimal preparation time
- The frozen foods segment dominated the type category with a 44% revenue share in 2025, led by strong demand for minimally perishable food products and increasing reliance on bulk household purchases
- Meat and seafood products accounted for 41.8% of the market in 2025, preferred by strong consumer preference for high-protein diets and increasing awareness of nutritional benefits associated with protein-rich food consumption
- The convenience foods and ready meals segment is the fastest-growing product category, with a CAGR of 12.8% from 2026 to 2033, driven by rising demand for time-saving meal solutions among working populations. Increasing urbanization and fast-paced lifestyles are accelerating the shift toward pre-cooked and ready-to-eat options
Market Size & Forecast
- Global Market Value (2025): USD 283.63 Billion
- Expected Market Value (2033): USD 419.05 Billion
- Forecast CAGR (2026–2033): 5.00%
- Leading Region in 2025: Europe
- Fastest Growing Region: Asia-Pacific
Report Scope and Convenience and Frozen Food Market Segmentation
|
Attributes |
Convenience and Frozen Food Key Market Insights |
|
Segments Covered |
|
|
Countries Covered |
North America · U.S. · Canada · Mexico Europe · Germany · France · U.K. · Netherlands · Switzerland · Belgium · Russia · Italy · Spain · Turkey · Rest of Europe Asia-Pacific · China · Japan · India · South Korea · Singapore · Malaysia · Australia · Thailand · Indonesia · Philippines · Rest of Asia-Pacific Middle East and Africa · Saudi Arabia · U.A.E. · South Africa · Egypt · Israel · Rest of Middle East and Africa South America · Brazil · Argentina · Rest of South America |
|
Key Market Players |
· General Mills Inc (U.S.) · Conagra Brands, Inc (U.S.) · Unilever (U.K.) · Kellogg Co (U.S.) · The Kraft Heinz Company (U.S.) · Associated British Foods plc (U.K.) · Tyson Foods, Inc (U.S.) · Bakkavor Group plc (U.K.) · MTR Foods Pvt Ltd (India) · Amy’s Kitchen, Inc (U.S.) · Cargill, Incorporated (U.S.) · McCain Foods Limited (Canada) · Ajinomoto Foods North America (U.S.) · Vandemoortele NV (Belgium) · Lantmännen Unibake (Denmark) · Nestlé S.A. (Switzerland) · EUROPASTRY, S.A. (Spain) · Grupo Bimbo (Mexico) · JBS Foods (Brazil) · Omar International Pvt. Ltd. (Pakistan) · BAKKAVOR GROUP PLC (U.K.) |
|
Market Opportunities |
· Expansion of Plant-Based Frozen Food Products · Growth of E-Commerce and Quick-Commerce Food Delivery Platforms · Increasing Premiumization and Clean-Label Frozen Food Innovations |
|
Value Added Data Infosets |
In addition to the insights on market scenarios such as market value, growth rate, segmentation, geographical coverage, and major players, the market reports curated by the Data Bridge Market Research also include in-depth expert analysis, pricing analysis, brand share analysis, consumer survey, demography analysis, supply chain analysis, value chain analysis, raw material/consumables overview, vendor selection criteria, PESTLE Analysis, Porter Analysis, and regulatory framework. |
Convenience and Frozen Food Market Trends
Trend: Rising Demand for Ready-to-Eat and Frozen Meal Convenience
Convenience and Frozen Food Market Trends reflect a strong shift toward ready-to-eat and frozen meal consumption driven by fast-paced urban lifestyles and increasing demand for time-saving food solutions. Consumers are increasingly preferring frozen meals, instant snacks, and pre-cooked food products that require minimal preparation while maintaining taste and nutritional value. The expansion of modern retail infrastructure and deep-freeze supply chains is further enabling wider availability of such products across urban and semi-urban regions.
Major companies such as Nestlé S.A. and McCain Foods Limited are continuously expanding their frozen meal portfolios, including ready meals and frozen potato-based products, to meet rising global convenience demand across retail and food service channels.
Convenience and Frozen Food Market Dynamics
Key Market Driver: Urbanization and Expanding Cold Chain Infrastructure
Rapid urbanization and growing reliance on packaged food products are significantly driving the Convenience and Frozen Food market, supported by strong expansion of cold chain logistics and refrigerated storage networks. Increasing working population density in urban centers is accelerating demand for easy-to-prepare frozen and convenience foods across households and food service outlets. Governments and private players are investing in cold chain modernization to reduce food wastage and improve distribution efficiency for perishable products.
Companies such as McCain Foods Limited and Grupo Bimbo are leveraging advanced cold storage and distribution systems to strengthen product reach and ensure consistent supply of frozen and packaged food products across global markets.
Key Restraint/Challenge: Health Concerns and Perception of Preservatives
Health concerns related to preservatives, sodium content, and artificial additives remain a key challenge for the Convenience and Frozen Food market, affecting consumer perception in several regions. Despite improvements in freezing and preservation technologies, many consumers still associate frozen foods with lower nutritional quality compared to fresh alternatives. Regulatory scrutiny on food labeling and ingredient transparency is also increasing across developed markets, pushing manufacturers to reformulate products.
Companies such as Conagra Brands, Inc. and Kellogg Co have responded by expanding clean-label frozen offerings and reducing artificial ingredients to address consumer concerns and improve brand trust in the frozen food segment.
Key Market Opportunity: Growth of E-Commerce and Quick-Commerce Food Delivery Platforms
The rapid expansion of e-commerce grocery platforms and quick-commerce delivery services is creating significant growth opportunities for the Convenience and Frozen Food market. Online retail channels are improving accessibility of frozen meals, snacks, and ready-to-eat products through faster delivery and wider product assortment. Increasing smartphone penetration and digital payment adoption are further supporting the shift toward online food purchasing.
Companies such as Unilever and The Kraft Heinz Company are strengthening partnerships with online grocery platforms to expand frozen and convenience food distribution, enabling faster consumer reach and driving higher product penetration in urban markets.
Convenience and Frozen Food Market Scope
The convenience and frozen food market is segmented on the basis of product, type, consumption, and distribution channel.
- By Product
On the basis of product, the Convenience and Frozen Food Market is segmented into fruits and vegetables, dairy products, bakery products, meat and seafood products, convenience foods and ready meals, and others. The meat and seafood products segment dominated the market with the largest share of 41.8% in 2025, driven by strong consumer preference for high-protein diets and increasing awareness of nutritional benefits associated with protein-rich food consumption. Rising demand for frozen, processed, and ready-to-cook meat and seafood options is further supported by urbanization and shifting dietary patterns toward convenient meal solutions. The segment also benefits from continuous improvements in cold chain logistics, advanced freezing and vacuum packaging technologies, and wider supermarket penetration that ensure product freshness and longer shelf life.
The Convenience Foods and Ready Meals segment is projected to register the fastest growth at a CAGR of 12.8% from 2026 to 2033, driven by rising demand for time-saving meal solutions among working populations. Increasing urbanization and fast-paced lifestyles are accelerating the shift toward pre-cooked and ready-to-eat options. Expansion of premium packaged meal offerings and improved taste profiles is further enhancing adoption. Growing investments by food manufacturers in innovative packaging and flavor diversification are supporting segment expansion across global markets.
- By Type
On the basis of type, the Convenience and Frozen Food Market is segmented into raw material, half-cooked, canned foods, frozen foods, chilled foods, ready-to-eat, and others. The Frozen Foods segment dominated the market with a share of 44% in 2025, supported by strong demand for minimally perishable food products and increasing reliance on bulk household purchases. The segment benefits from advanced freezing technologies that maintain texture and nutritional value over extended periods. Expansion of supermarket freezer sections and organized distribution networks further reinforces adoption. Consistent demand across households and food retailers sustains its leading position.
The Ready-To-Eat segment is projected to register the fastest growth at a CAGR of 13.5% from 2026 to 2033, driven by increasing consumer preference for instant consumption meals with minimal preparation time. Rising workforce participation and shrinking cooking time in urban households are accelerating segment growth. Continuous innovation in flavor profiles and healthier formulations is improving product acceptance. Expanding e-commerce penetration and direct-to-consumer food delivery platforms are further boosting availability across diverse regions.
- By Consumption
On the basis of consumption, the Convenience and Frozen Food Market is segmented into food service and retail. The Retail segment dominated the market with the largest share of 60% in 2025, driven by strong supermarket and hypermarket penetration along with rising household consumption of packaged food products. The segment benefits from increasing consumer preference for stocked household food supplies and frequent grocery purchases. Expansion of organized retail chains across urban and semi-urban regions further strengthens demand. High visibility and product accessibility continue to reinforce its leading position.
The Food Service segment is projected to register the fastest growth at a CAGR of 12.5% from 2026 to 2033, driven by rising consumption of convenience meals across restaurants, quick-service outlets, and institutional catering. Increasing demand for standardized and time-efficient food preparation is supporting adoption. Growth of cloud kitchens and delivery-focused food businesses is further accelerating segment expansion. Rising urban dining-out frequency continues to strengthen long-term growth momentum.
- By Distribution Channel
On the basis of distribution channel, the Convenience and Frozen Food Market is segmented into offline and online channels. The Offline segment dominated the market with a share of 32.2% in 2025, supported by strong supermarket, grocery store, and hypermarket networks across developed and emerging economies. The segment benefits from consumer preference for physical product inspection and immediate purchase availability. Established cold storage logistics within retail outlets further enhance product accessibility. High trust in traditional purchasing channels continues to maintain dominance.
The Online segment is projected to register the fastest growth at a CAGR of 14% from 2026 to 2033, driven by increasing adoption of e-grocery platforms and rapid digital transformation in food retail. Rising smartphone penetration and improved last-mile delivery infrastructure are strengthening online accessibility. Expanding discounts, subscription models, and personalized recommendations are further encouraging digital purchases. Continuous growth of quick-commerce platforms is significantly accelerating segment expansion across urban markets.
Convenience and Frozen Food Market Regional Analysis
Europe dominated the convenience and frozen food market and accounted for the largest revenue share of 40% in 2025, supported by strong consumption of packaged and frozen food products, high urbanization levels, and well-established retail and cold chain infrastructure. The region benefits from a mature food processing industry and widespread consumer preference for ready-to-eat and frozen meal solutions that support fast-paced lifestyles. Rising demand for high-protein frozen foods, dairy-based convenience products, and bakery items further strengthens market penetration. In addition, continuous innovation in sustainable packaging, product preservation, and premium frozen meal offerings continues to reinforce Europe’s leadership position in the global market.
U.K. Convenience and Frozen Food Market Insight
The U.K. Convenience and Frozen Food market is witnessing steady growth, driven by increasing consumer reliance on ready meals and expanding demand for time-saving food solutions. Rising workforce participation and urban living patterns are supporting strong adoption of frozen and convenience food products across households. The market also benefits from advanced supermarket infrastructure and strong presence of private-label frozen food brands offering affordable options. Furthermore, growing emphasis on healthier frozen alternatives and plant-based convenience meals is shaping product innovation and supporting sustained market expansion in the country.
Germany Convenience and Frozen Food Market Insight
The Germany Convenience and Frozen Food market is expanding steadily due to rising demand for high-quality packaged food products and strong consumer focus on convenience without compromising nutritional value. The country’s well-developed retail networks and advanced cold chain logistics systems ensure consistent product availability and freshness. Increasing preference for organic frozen meals, dairy-based convenience foods, and bakery products is further driving consumption. In addition, growing investments in sustainable packaging and energy-efficient food processing technologies are enhancing market development across Germany.
North America Convenience and Frozen Food Market Insight
The North America Convenience and Frozen Food market is expanding steadily, driven by high consumption of packaged meals, strong demand for protein-rich frozen products, and widespread retail penetration across the region. Increasing preference for quick meal solutions among working populations and busy households is supporting sustained market growth. The region also benefits from advanced cold storage infrastructure and strong presence of major food manufacturers offering diverse frozen product portfolios. In addition, rising adoption of e-grocery platforms and online food delivery services is further accelerating market accessibility and consumption.
U.S. Convenience and Frozen Food Market Insight
The U.S. Convenience and Frozen Food market is witnessing strong growth due to rising demand for ready-to-eat meals, frozen meat and seafood products, and premium convenience food offerings. Increasing urbanization, changing dietary habits, and growing preference for high-protein and portion-controlled meals are driving market expansion. The presence of leading food processing companies and continuous product innovation in frozen meal categories further strengthens market growth. In addition, expanding retail chains and rapid growth of online grocery platforms are significantly enhancing product availability across the country.
Asia-Pacific Convenience and Frozen Food Market Insight
The Asia-Pacific Convenience and Frozen Food market is expected to register the fastest growth rate of 7.98% during the forecast period of 2026–2033, driven by rising urbanization, increasing disposable incomes, and expanding middle-class populations across countries such as China, India, Japan, and South Korea. Growing adoption of Western-style diets and increasing demand for ready-to-eat and frozen meal solutions are significantly boosting market expansion. Rapid development of cold chain logistics infrastructure and expansion of organized retail networks are further supporting product accessibility. In addition, increasing penetration of e-commerce and quick-commerce platforms is accelerating regional market growth.
Japan Convenience and Frozen Food Market Insight
The Japan Convenience and Frozen Food market is witnessing stable growth, driven by high demand for portion-controlled meals and strong cultural acceptance of packaged convenience foods. An aging population and shrinking household sizes are further increasing reliance on ready-to-eat and frozen meal options. The market benefits from advanced food processing technologies and strong retail distribution networks ensuring product quality and freshness. In addition, continuous innovation in premium frozen meals and health-focused convenience foods is supporting steady market expansion.
China Convenience and Frozen Food Market Insight
The China Convenience and Frozen Food market is growing rapidly, driven by increasing urban population, rising working-class consumers, and strong expansion of modern retail and e-commerce platforms. Demand for frozen meat, seafood, and ready-to-eat meals is increasing significantly due to busy lifestyles and shifting dietary habits. The country also benefits from large-scale investments in cold chain logistics and food processing infrastructure that enhance distribution efficiency. In addition, strong domestic production capacity and continuous innovation in packaged food products are positioning China as one of the fastest-growing markets globally.
Convenience and Frozen Food Market Share
The convenience and frozen food industry is primarily led by well-established companies, including:
- General Mills Inc (U.S.)
- Conagra Brands, Inc (U.S.)
- Unilever (U.K.)
- Kellogg Co (U.S.)
- The Kraft Heinz Company (U.S.)
- Associated British Foods plc (U.K.)
- Tyson Foods, Inc (U.S.)
- Bakkavor Group plc (U.K.)
- MTR Foods Pvt Ltd (India)
- Amy’s Kitchen, Inc (U.S.)
- Cargill, Incorporated (U.S.)
- McCain Foods Limited (Canada)
- Ajinomoto Foods North America (U.S.)
- Vandemoortele NV (Belgium)
- Lantmännen Unibake (Denmark)
- Nestlé S.A. (Switzerland)
- EUROPASTRY, S.A. (Spain)
- Grupo Bimbo (Mexico)
- JBS Foods (Brazil)
- Omar International Pvt. Ltd. (Pakistan)
- BAKKAVOR GROUP PLC (U.K.)
Latest Developments in Convenience and Frozen Food Market
- In June 2025, Conagra Brands expanded its frozen food portfolio by launching more than 50 new products across meals, vegetables, and plant-based categories, significantly strengthening its position in the Convenience and Frozen Food Market. This expansion enhances product diversification and aligns with rising consumer demand for healthier and more convenient frozen meal options, thereby intensifying competition in the premium frozen food segment. The move also supports category growth by improving accessibility of innovative and ready-to-cook offerings across retail channels
- In 2025, Conagra Brands advanced its frozen food modernization strategy by working toward the removal of artificial FD&C colors from its U.S. frozen food portfolio by the end of the year. This initiative positively impacts the market by accelerating the shift toward clean-label and transparent ingredient sourcing, which is becoming a key purchase driver among health-conscious consumers. It also strengthens brand positioning in the premium frozen food segment by improving trust and perceived product quality across retail shelves
- In 2025, Nomad Foods expanded its innovation pipeline and efficiency initiatives within its European frozen food business, focusing on portfolio renewal and operational improvements. This development strengthens market competitiveness by increasing the availability of differentiated frozen food products tailored to evolving consumer preferences. It also supports long-term category growth in Europe by improving production efficiency and enabling faster introduction of new frozen meal solutions across key retail markets
- In 2025, Kraft Heinz continued restructuring its global packaged food portfolio, with increased strategic focus on higher-growth convenience and frozen food categories through divestments and portfolio optimization. This shift impacts the market by redirecting capital toward faster-growing frozen meal and convenience segments, thereby increasing innovation and competitive intensity. It also supports consolidation trends in the industry, encouraging stronger investment in premium frozen product development and brand repositioning
SKU-

- Interactive Data Analysis Dashboard
- Company Analysis Dashboard for high growth potential opportunities
- Research Analyst Access for customization & queries
- Competitor Analysis with Interactive dashboard
- Latest News, Updates & Trend analysis
- Harness the Power of Benchmark Analysis for Comprehensive Competitor Tracking
Data collection and base year analysis are done using data collection modules with large sample sizes. The stage includes obtaining market information or related data through various sources and strategies. It includes examining and planning all the data acquired from the past in advance. It likewise envelops the examination of information inconsistencies seen across different information sources. The market data is analysed and estimated using market statistical and coherent models. Also, market share analysis and key trend analysis are the major success factors in the market report. To know more, please request an analyst call or drop down your inquiry.
The key research methodology used by DBMR research team is data triangulation which involves data mining, analysis of the impact of data variables on the market and primary (industry expert) validation. Data models include Vendor Positioning Grid, Market Time Line Analysis, Market Overview and Guide, Company Positioning Grid, Patent Analysis, Pricing Analysis, Company Market Share Analysis, Standards of Measurement, Global versus Regional and Vendor Share Analysis. To know more about the research methodology, drop in an inquiry to speak to our industry experts.
Data Bridge Market Research is a leader in advanced formative research. We take pride in servicing our existing and new customers with data and analysis that match and suits their goal. The report can be customized to include price trend analysis of target brands understanding the market for additional countries (ask for the list of countries), clinical trial results data, literature review, refurbished market and product base analysis. Market analysis of target competitors can be analyzed from technology-based analysis to market portfolio strategies. We can add as many competitors that you require data about in the format and data style you are looking for. Our team of analysts can also provide you data in crude raw excel files pivot tables (Fact book) or can assist you in creating presentations from the data sets available in the report.


