
Global Counterfeit Drug Detection Device Market
Market Size in USD Billion
 USD
1.74 Billion
USD
2.53 Billion
2025
2033
USD
1.74 Billion
USD
2.53 Billion
2025
2033
| 2026 - 2033 | |
| USD 1.74 Billion | |
| USD 2.53 Billion | |
| % | |
|
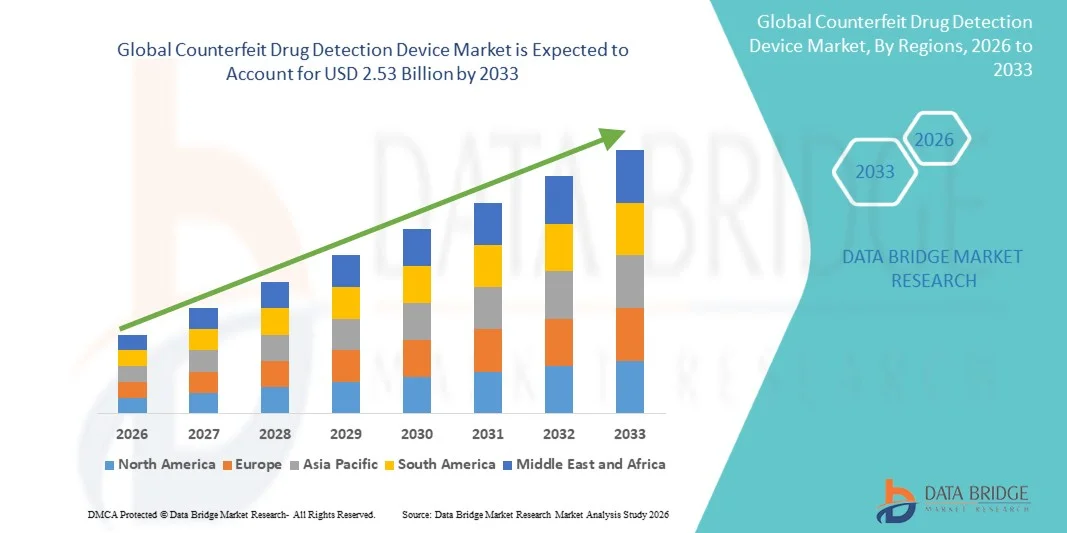
Counterfeit Drug Detection Device Market Size
- The global counterfeit drug detection device market size was valued at USD 1.74 billion in 2025 and is expected to reach USD 2.53 billion by 2033, at a CAGR of 4.80% during the forecast period
- The counterfeit drug detection devices, enabling rapid identification and verification of pharmaceutical authenticity through technologies such as spectroscopy, RFID, and handheld analyzers, are increasingly becoming essential tools in strengthening drug supply chain security across pharmaceutical manufacturing, distribution, and regulatory environments
- Furthermore, the rising prevalence of counterfeit and substandard medicines, coupled with increasing regulatory enforcement and growing adoption of advanced tracking and authentication technologies, is accelerating the uptake of Counterfeit Drug Detection Device solutions, thereby significantly boosting the industry's growth
Counterfeit Drug Detection Device Market Analysis
- Counterfeit drug detection devices, including portable analyzers, spectroscopy-based systems, and authentication tools, are increasingly vital components of modern pharmaceutical security systems due to their ability to rapidly detect falsified medicines, ensure supply chain integrity, and support regulatory compliance across healthcare and pharmaceutical industries
- The escalating demand for counterfeit drug detection devices is primarily fueled by the rising global burden of counterfeit medicines, increasing regulatory scrutiny, and growing adoption of advanced verification technologies such as AI-based detection systems and blockchain-integrated traceability solutions
- North America dominated the counterfeit drug detection device market with the largest revenue share of 37.9% in 2025, driven by strong regulatory enforcement by agencies, advanced healthcare infrastructure, and early adoption of pharmaceutical authentication technologies, particularly in the U.S.
- Asia-Pacific is expected to be the fastest growing region in the counterfeit drug detection device market during the forecast period due to expanding pharmaceutical manufacturing, increasing incidence of counterfeit drugs, and strengthening government initiatives for drug safety and traceability
- The counterfeit chemical composition detection devices segment dominated the largest market revenue share of 56.3% in 2025, driven by the rising need for accurate verification of active pharmaceutical ingredients (APIs) and detection of substandard or falsified drugs
Report Scope and Counterfeit Drug Detection Device Market Segmentation
|
Attributes |
Counterfeit Drug Detection Device Key Market Insights |
|
Segments Covered |
|
|
Countries Covered |
North America
Europe
Asia-Pacific
Middle East and Africa
South America
|
|
Key Market Players |
|
|
Market Opportunities |
|
|
Value Added Data Infosets |
In addition to the insights on market scenarios such as market value, growth rate, segmentation, geographical coverage, and major players, the market reports curated by the Data Bridge Market Research also include in-depth expert analysis, patient epidemiology, pipeline analysis, pricing analysis, and regulatory framework. |
Counterfeit Drug Detection Device Market Trends
“Advancements in Rapid, Portable, and AI-Enabled Drug Authentication Technologies”
- A significant and accelerating trend in the global Counterfeit Drug Detection Device market is the growing adoption of advanced technologies such as spectroscopy, blockchain-based traceability systems, and AI-powered analytical platforms to improve drug authentication accuracy and speed
- For instance, modern handheld detection devices equipped with Raman spectroscopy and near-infrared (NIR) technology are increasingly being used in pharmacies and regulatory checkpoints to quickly verify drug composition and identify falsified or substandard medicines
- AI integration in counterfeit detection systems enables faster pattern recognition, improved anomaly detection, and enhanced predictive analytics, helping authorities identify suspicious pharmaceutical batches more efficiently
- In addition, blockchain-enabled pharmaceutical tracking solutions are being adopted to ensure end-to-end drug supply chain transparency, allowing stakeholders to trace medicines from manufacturers to end-users and reduce the risk of counterfeiting
- The integration of portable detection devices with cloud-based databases is further enabling real-time verification and centralized monitoring across healthcare supply chains, improving decision-making and regulatory enforcement
- This trend is significantly reshaping pharmaceutical safety expectations, as governments and healthcare providers increasingly prioritize rapid, accurate, and scalable authentication technologies to combat counterfeit drugs globally
Counterfeit Drug Detection Device Market Dynamics
Driver
“Rising Prevalence of Counterfeit Medicines and Strengthening Regulatory Enforcement”
- The increasing global circulation of counterfeit and substandard drugs is a major driver fueling demand for Counterfeit Drug Detection Devices, as healthcare systems prioritize patient safety and drug authenticity
- For instance, regulatory agencies such as the World Health Organization (WHO) and national drug authorities have reported growing incidents of falsified antibiotics, oncology drugs, and life-saving medications, particularly in emerging economies
- Governments across regions are strengthening pharmaceutical regulations and enforcement mechanisms, leading to increased deployment of drug verification technologies at manufacturing units, hospitals, and border control checkpoints
- The growing complexity of global pharmaceutical supply chains is further increasing the risk of drug diversion and counterfeiting, encouraging pharmaceutical companies to invest in advanced authentication and tracking solutions
- In addition, rising awareness among healthcare professionals and patients regarding the dangers of counterfeit medicines is accelerating adoption of detection technologies across pharmacies and clinical settings
- Expanding pharmaceutical trade and e-commerce drug distribution channels are also contributing to higher demand for reliable verification tools to ensure medicine safety and regulatory compliance
Restraint/Challenge
“High Equipment Costs, Limited Infrastructure, and Technical Complexity”
- One of the key challenges in the Counterfeit Drug Detection Device market is the high cost of advanced detection systems, which limits adoption among small healthcare facilities, pharmacies, and resource-constrained regions
- For instance, sophisticated spectroscopy-based devices and integrated laboratory-grade systems often require significant capital investment, making them less accessible in developing healthcare markets
- Limited infrastructure, particularly in rural and low-income regions, further restricts the widespread deployment of advanced drug authentication technologies
- In addition, the need for trained personnel to operate and interpret results from complex detection systems poses an operational challenge, especially in under-resourced healthcare settings
- Variability in drug formulations and packaging standards across different manufacturers can also impact detection accuracy, requiring continuous calibration and system updates
- Addressing these challenges through cost reduction strategies, portable device innovation, workforce training programs, and scalable deployment models will be essential for broader market penetration and sustained industry growth
Counterfeit Drug Detection Device Market Scope
The market is segmented on the basis of product, modality, end use, drug assessment, and therapeutic assessment.
• By Product
On the basis of product, the Counterfeit Drug Detection Device market is segmented into counterfeit chemical composition detection devices and counterfeit packaging and labelling detection devices. The counterfeit chemical composition detection devices segment dominated the largest market revenue share of 56.3% in 2025, driven by the rising need for accurate verification of active pharmaceutical ingredients (APIs) and detection of substandard or falsified drugs. These devices are widely adopted in pharmaceutical manufacturing, regulatory inspections, and quality control laboratories due to their high precision and reliability. Increasing prevalence of counterfeit medicines globally significantly boosts demand. Growing regulatory pressure from health authorities enhances adoption of advanced detection technologies. Rising investments in pharmaceutical quality assurance systems further support segment growth. Technological advancements in spectroscopy and chromatography-based devices improve detection accuracy. Expanding global drug distribution networks increase the risk of counterfeit infiltration, strengthening usage. In addition, rising awareness among pharmaceutical companies regarding patient safety supports adoption. The need for compliance with stringent regulatory frameworks further drives market penetration. These factors collectively ensure the dominance of the chemical composition detection segment.
The counterfeit packaging and labelling detection devices segment is expected to witness the fastest CAGR of 10.8% from 2026 to 2033, driven by increasing sophistication in counterfeit packaging techniques. Growing need for authentication of labels, barcodes, and tamper-evident packaging supports adoption. Rising global trade of pharmaceutical products increases exposure to falsified packaging. Advancements in optical recognition, AI-based imaging, and serialization technologies enhance detection capabilities. Increasing regulatory mandates for track-and-trace systems further accelerate demand. Pharmaceutical companies are increasingly investing in packaging security solutions. Growing concerns over drug diversion and grey market sales also contribute to growth. Expanding e-pharmacy and online drug distribution channels further increase risks of counterfeit packaging. Integration of digital authentication systems improves verification efficiency. These factors position packaging and labelling detection devices as the fastest-growing product segment.
• By Modality
On the basis of modality, the Counterfeit Drug Detection Device market is segmented into portable devices, handheld devices, and benchtop devices. The benchtop devices segment dominated the largest market revenue share of 49.1% in 2025, driven by their high accuracy, advanced analytical capabilities, and widespread use in laboratories and pharmaceutical quality control facilities. These systems provide detailed chemical and structural analysis of drug samples, ensuring high reliability in counterfeit detection. Increasing demand for precise laboratory-grade testing supports adoption. Growing regulatory requirements for pharmaceutical validation further strengthen usage. Expanding pharmaceutical R&D activities globally contribute to segment growth. Technological advancements in spectroscopic and chromatographic systems improve performance. In addition, benchtop devices offer multi-parameter testing capabilities, enhancing efficiency. Rising investments in centralized drug testing facilities further support demand. Their ability to handle bulk sample testing increases operational efficiency. These factors collectively ensure dominance of benchtop devices.
The portable devices segment is expected to witness the fastest CAGR of 11.4% from 2026 to 2033, driven by increasing demand for on-site and rapid drug verification. These devices are widely used in field inspections, customs checkpoints, and pharmacy audits. Growing concerns over counterfeit drugs in supply chains support adoption. Technological advancements in miniaturization and sensor accuracy enhance device performance. Increasing need for real-time decision-making in drug authentication further boosts demand. Rising use in remote and underserved regions supports market expansion. Expanding regulatory inspections at border checkpoints increases deployment. Integration of AI and mobile connectivity improves usability and efficiency. The growing pharmaceutical distribution network strengthens requirement for portable testing solutions. These factors position portable devices as the fastest-growing modality segment.
• By End Use
On the basis of end use, the Counterfeit Drug Detection Device market is segmented into pharmaceutical companies, drug testing laboratories, research organizations, and others. The pharmaceutical companies segment dominated the largest market revenue share of 45.7% in 2025, driven by the critical need to ensure drug safety, compliance, and quality assurance throughout manufacturing and distribution processes. Pharmaceutical firms invest heavily in counterfeit detection technologies to protect brand integrity and patient safety. Increasing regulatory scrutiny from global health authorities strengthens adoption. Rising incidents of counterfeit medicines in global supply chains further support demand. Expanding production of generic and branded drugs increases quality control requirements. Technological advancements in in-house testing systems improve efficiency. Growing focus on GMP (Good Manufacturing Practices) compliance enhances usage. In addition, pharmaceutical companies integrate advanced detection systems into production lines. Rising investment in R&D and quality assurance infrastructure further drives growth. These factors collectively ensure dominance of pharmaceutical companies.
The drug testing laboratories segment is expected to witness the fastest CAGR of 10.9% from 2026 to 2033, driven by increasing outsourcing of drug quality testing and regulatory verification processes. Rising demand for independent validation of pharmaceutical products supports growth. Expanding number of accredited laboratories globally strengthens market adoption. Increasing complexity of drug formulations requires advanced analytical capabilities. Growing regulatory mandates for third-party testing further boost demand. Technological advancements in laboratory automation improve efficiency. Rising concerns over counterfeit and substandard drugs enhance testing frequency. Expanding clinical trial activities also contribute to demand. In addition, increasing collaboration between pharmaceutical companies and testing labs supports market expansion. These factors position drug testing laboratories as the fastest-growing end-use segment.
• By Drug Assessment
On the basis of drug assessment, the Counterfeit Drug Detection Device market is segmented into oral pills, injectables, inhalables, topical formulations, and eye drops. The oral pills segment dominated the largest market revenue share of 52.6% in 2025, driven by the high global consumption of oral solid dosage forms across therapeutic areas. Oral medications are the most widely prescribed drug form, increasing the need for counterfeit detection. Rising prevalence of chronic diseases requiring long-term medication supports demand. Expanding pharmaceutical manufacturing and distribution networks further strengthen usage. Increasing risk of counterfeit tablets in global supply chains drives adoption. Technological advancements in pill authentication systems improve accuracy. Regulatory agencies emphasize strict quality checks for oral formulations. Growing OTC drug consumption further boosts demand. In addition, ease of sampling and testing supports widespread application. These factors collectively ensure dominance of the oral pills segment.
The injectables segment is expected to witness the fastest CAGR of 11.2% from 2026 to 2033, driven by increasing demand for high-risk sterile drugs requiring stringent quality control. Injectables are more susceptible to life-threatening counterfeit risks, necessitating advanced detection methods. Rising use in oncology, vaccines, and emergency care supports growth. Increasing regulatory scrutiny on injectable drug safety enhances adoption. Technological advancements in analytical testing improve detection efficiency. Expanding biologics and biosimilars market further boosts demand. Growing hospital and clinical usage increases testing requirements. Rising awareness of patient safety strengthens regulatory compliance. In addition, complex manufacturing processes necessitate robust authentication systems. These factors position injectables as the fastest-growing drug assessment segment.
• By Therapeutic Assessment
On the basis of therapeutic assessment, the Counterfeit Drug Detection Device market is segmented into alimentary, anti-infectives, blood agents, cardiovascular, central nervous system, cytostatics, dermatological, genitourinary, hormones, metabolism, musculoskeletal, respiratory, and others. The anti-infectives segment dominated the largest market revenue share of 38.9% in 2025, driven by the high global consumption of antibiotics, antivirals, and antifungal drugs. These medicines are widely used in both hospital and community settings, increasing exposure to counterfeit risks. Rising prevalence of infectious diseases globally significantly boosts demand. Expanding pharmaceutical distribution networks further increases vulnerability to falsified drugs. Regulatory agencies prioritize monitoring of anti-infective medicines due to public health impact. Technological advancements in drug authentication systems enhance detection accuracy. Increasing awareness of antimicrobial resistance strengthens quality control measures. Growing hospital procurement of anti-infective drugs supports market dominance. In addition, large-scale global trade in antibiotics increases counterfeit risk. These factors collectively ensure dominance of the anti-infectives segment.
The central nervous system (CNS) segment is expected to witness the fastest CAGR of 10.7% from 2026 to 2033, driven by increasing prevalence of neurological and psychiatric disorders. Rising demand for antidepressants, antiepileptics, and pain management drugs supports growth. CNS drugs are often high-value targets for counterfeiters, increasing need for detection systems. Expanding awareness of mental health conditions further boosts demand. Technological advancements in drug verification improve accuracy. Increasing regulatory focus on controlled substances enhances compliance. Growing pharmaceutical innovation in neurology strengthens pipeline expansion. Rising hospital prescriptions for CNS therapies support usage. In addition, patient safety concerns drive strict authentication protocols. These factors position the CNS segment as the fastest-growing therapeutic assessment segment.
Counterfeit Drug Detection Device Market Regional Analysis
- North America dominated the counterfeit drug detection device market with the largest revenue share of approximately 37.9% in 2025
- Driven by strong regulatory enforcement by agencies, advanced healthcare infrastructure, and early adoption of pharmaceutical authentication technologies, particularly in the U.S. The region benefits from well-established drug safety frameworks, high investments in pharmaceutical security solutions, and widespread implementation of advanced verification systems across the healthcare supply chain
- The increasing emphasis on regulatory compliance, supply chain transparency, and patient safety is further strengthening market growth in North America, as pharmaceutical companies, hospitals, and regulatory bodies continue to adopt sophisticated drug authentication technologies to combat counterfeit medicines and ensure drug integrity
U.S. Counterfeit Drug Detection Device Market Insight
The U.S. counterfeit drug detection device market captured the largest revenue share within North America in 2025, supported by stringent regulatory oversight from agencies such as the FDA, strong pharmaceutical R&D ecosystem, and early adoption of advanced drug authentication technologies. The country is witnessing increasing deployment of spectroscopy-based detection systems, serialization technologies, and blockchain-enabled drug tracking solutions to ensure end-to-end pharmaceutical traceability. In addition, growing concerns over counterfeit oncology drugs, antibiotics, and high-value biologics are further accelerating adoption across healthcare institutions and supply chain networks.
Europe Counterfeit Drug Detection Device Market Insight
The Europe counterfeit drug detection device market is projected to expand at a substantial CAGR throughout the forecast period, driven by strict pharmaceutical regulations, increasing cross-border drug trade monitoring, and rising focus on patient safety. Regulatory frameworks such as the EU Falsified Medicines Directive are encouraging widespread adoption of drug verification and serialization technologies across pharmacies, hospitals, and distribution channels.
U.K. Counterfeit Drug Detection Device Market Insight
The U.K. counterfeit drug detection device market is anticipated to grow at a noteworthy CAGR during the forecast period, supported by strong regulatory compliance requirements, increasing digitalization of pharmaceutical supply chains, and rising awareness of drug authenticity verification. The expansion of online pharmaceutical sales is further driving demand for reliable drug authentication solutions.
Germany Counterfeit Drug Detection Device Market Insight
The Germany counterfeit drug detection device market is expected to expand at a considerable CAGR during the forecast period, fueled by robust pharmaceutical manufacturing standards, strong emphasis on drug safety regulations, and increasing adoption of advanced tracking and verification technologies. Germany’s focus on precision healthcare and supply chain transparency is promoting the integration of authentication systems across pharmaceutical distribution networks.
Asia-Pacific Counterfeit Drug Detection Device Market Insight
The Asia-Pacific counterfeit drug detection device market is expected to be the fastest growing region during the forecast period, driven by expanding pharmaceutical manufacturing, increasing incidence of counterfeit drugs, and strengthening government initiatives for drug safety and traceability. Rapid healthcare infrastructure development, growing export-oriented pharmaceutical production, and rising awareness of drug quality standards are further accelerating regional market growth.
Japan Counterfeit Drug Detection Device Market Insight
The Japan counterfeit drug detection device market is gaining momentum due to the country’s advanced healthcare system, strong regulatory framework, and high adoption of pharmaceutical quality assurance technologies. Increasing focus on patient safety and the need for reliable drug authentication in hospitals and pharmacies are driving steady market growth.
China Counterfeit Drug Detection Device Market Insight
The China counterfeit drug detection device market accounted for the largest market revenue share in Asia Pacific in 2025, attributed to rapid expansion of pharmaceutical manufacturing, increasing government initiatives to combat counterfeit drugs, and growing adoption of advanced drug traceability systems. The country’s large domestic drug market, coupled with strong investment in healthcare technology and regulatory strengthening, is significantly driving demand for detection and authentication solutions.
Counterfeit Drug Detection Device Market Share
The Counterfeit Drug Detection Device industry is primarily led by well-established companies, including:
- Thermo Fisher Scientific Inc. (U.S.)
- Agilent Technologies, Inc. (U.S.)
- Bruker Corporation (U.S.)
- PerkinElmer Inc. (U.S.)
- Abbott (U.S.)
- Roche Diagnostics (Switzerland)
- Shimadzu Corporation (Japan)
- Waters Corporation (U.S.)
- Sartorius AG (Germany)
- Bio-Rad Laboratories, Inc. (U.S.)
- Siemens Healthineers AG (Germany)
- Danaher Corporation (U.S.)
- Merck KGaA (Germany)
- HORIBA Ltd. (Japan)
- Mettler-Toledo International Inc. (U.S.)
- GE Healthcare (U.S.)
- BD (U.S.)
- Labcorp (U.S.)
- Eurofins Scientific (Luxembourg)
- Mindray Medical International (China)
Latest Developments in Global Counterfeit Drug Detection Device Market
- In July 2021, industry reports highlighted rapid innovation in counterfeit drug detection devices, noting that devices have advanced from large laboratory setups to portable, battery-operated handheld scanners that improve on-site counterfeit screening and broaden adoption. This reflected growing technological advancement in the market
- In December 2023, Nynomic AG completed the acquisition of Art Photonics GmbH, enhancing its fiber-optic based detection capabilities that contribute to improved counterfeit drug identification technology. This acquisition strengthened technical capabilities in optical detection methods
- In December 2025, the Government of Maharashtra (India) sanctioned ₹9.6 crore to procure eight handheld counterfeit drug detection devices equipped with Raman analyzers and digital software to strengthen counterfeit drug monitoring in public hospitals, demonstrating real-world deployment of detection technology
SKU-

- Interactive Data Analysis Dashboard
- Company Analysis Dashboard for high growth potential opportunities
- Research Analyst Access for customization & queries
- Competitor Analysis with Interactive dashboard
- Latest News, Updates & Trend analysis
- Harness the Power of Benchmark Analysis for Comprehensive Competitor Tracking
Data collection and base year analysis are done using data collection modules with large sample sizes. The stage includes obtaining market information or related data through various sources and strategies. It includes examining and planning all the data acquired from the past in advance. It likewise envelops the examination of information inconsistencies seen across different information sources. The market data is analysed and estimated using market statistical and coherent models. Also, market share analysis and key trend analysis are the major success factors in the market report. To know more, please request an analyst call or drop down your inquiry.
The key research methodology used by DBMR research team is data triangulation which involves data mining, analysis of the impact of data variables on the market and primary (industry expert) validation. Data models include Vendor Positioning Grid, Market Time Line Analysis, Market Overview and Guide, Company Positioning Grid, Patent Analysis, Pricing Analysis, Company Market Share Analysis, Standards of Measurement, Global versus Regional and Vendor Share Analysis. To know more about the research methodology, drop in an inquiry to speak to our industry experts.
Data Bridge Market Research is a leader in advanced formative research. We take pride in servicing our existing and new customers with data and analysis that match and suits their goal. The report can be customized to include price trend analysis of target brands understanding the market for additional countries (ask for the list of countries), clinical trial results data, literature review, refurbished market and product base analysis. Market analysis of target competitors can be analyzed from technology-based analysis to market portfolio strategies. We can add as many competitors that you require data about in the format and data style you are looking for. Our team of analysts can also provide you data in crude raw excel files pivot tables (Fact book) or can assist you in creating presentations from the data sets available in the report.


