
Global Dairy Desserts Market
Market Size in USD Billion
 USD
29.65 Billion
USD
41.42 Billion
2025
2033
USD
29.65 Billion
USD
41.42 Billion
2025
2033
| 2026 - 2033 | |
| USD 29.65 Billion | |
| USD 41.42 Billion | |
| % | |
|
Global Dairy Desserts Market Overview
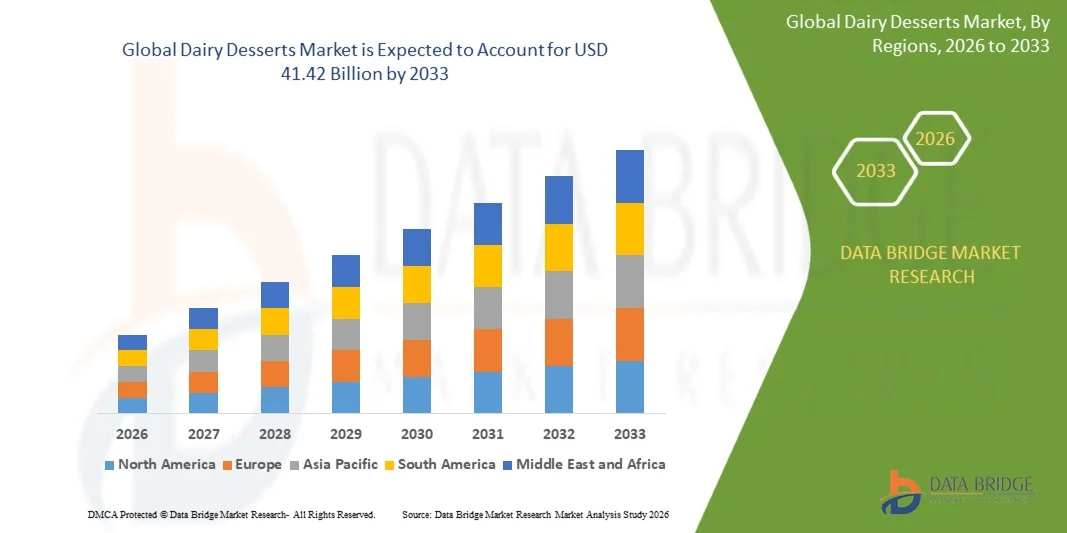
The global dairy desserts market was valued at USD 29.65 billion in 2025 and is projected to reach USD 41.42 billion by 2033, growing at a CAGR of 4.27% from 2026 to 2033. The market is witnessing steady growth driven by rising consumer preference for indulgent and convenient dessert options, increasing demand for premium and flavored dairy products, and expanding retail penetration across supermarkets, hypermarkets, and online channels.
The growing inclination toward ready-to-eat and on-the-go dessert formats, combined with rising disposable incomes and urbanization, is significantly boosting consumption of dairy-based desserts such as yogurts, puddings, custards, ice creams, and dairy-based snack cups. In addition, manufacturers are focusing on product innovation, including low-fat, sugar-free, probiotic-rich, and plant-blended dairy dessert variants to cater to evolving health-conscious consumer preferences. Expansion of cold chain logistics and aggressive branding strategies by key dairy companies are further strengthening market growth across both developed and emerging economies.
Key Market Trends & Insights
- Europe dominated the global dairy desserts market with the largest revenue share 34.8% in 2025, supported strong consumption of premium dairy products, well-established dairy processing industry, and high demand for indulgent yet functional dessert formats across countries such as Germany, France, Italy, and the U.K.
- Asia-Pacific is expected to be the fastest-growing region at a CAGR from 2026 to 2033, fueled by rapid urbanization, rising disposable incomes, and increasing westernization of dietary habits in countries such as China, India, Japan, and South Korea
- The Ice-Creams segment held the largest market revenue share of approximately 42.5% in 2025 driven by strong consumer preference for indulgent frozen desserts, wide product availability across retail chains, and continuous innovation in flavors, formats, and premium offerings such as gelato and artisanal ice creams.
- The Yoghurt segment is projected to register the fastest growth at a CAGR of 6.1% from 2026 to 2033, driven by increasing demand for high-protein, probiotic-rich, and low-fat dairy dessert alternatives. Rising health consciousness, expanding functional food trends, and strong adoption of Greek yogurt-based dessert variants across Europe and North America are accelerating segment expansion.
- The Store Based segment held the largest market revenue share of approximately 78.3% in 2025 driven by strong penetration of supermarkets, hypermarkets, convenience stores, and specialty dairy outlets, which offer wide product variety, refrigeration infrastructure, and immediate product availability.
- The Non-Store Based segment is projected to register the fastest growth at a CAGR of 7.4% from 2026 to 2033, driven by rapid expansion of e-commerce grocery platforms, increasing consumer preference for doorstep delivery, and growing adoption of quick-commerce services for chilled and frozen food products in urban areas.
- The Plastic segment held the largest market revenue share of approximately 55.6% in 2025 driven by its cost-effectiveness, lightweight nature, superior moisture resistance, and suitability for mass packaging of ice-creams, yoghurts, and custards across retail and foodservice channels.
- The Glass segment is projected to register the fastest growth at a CAGR of 6.8% from 2026 to 2033, driven by rising demand for premium and sustainable packaging formats, increasing consumer preference for recyclable materials, and strong adoption in high-end dairy dessert and artisanal product categories.
- The Ruminants segment held the largest market revenue share of approximately 82.4% in 2025 driven by the dominance of milk production from cattle and buffalo, which serves as the primary raw material source for dairy dessert manufacturing globally.
- The Pet Food segment is projected to register the fastest growth at a CAGR of 7.2% from 2026 to 2033, driven by increasing humanization of pets, rising demand for dairy-based nutritional treats, and growing inclusion of functional dairy ingredients in premium pet food formulations across developed markets.
Market Size & Forecast
- Global Market Value (2025): USD 29.65 Billion
- Expected Market Value (2033): USD 41.42 Billion
- Forecast CAGR (2026–2033): 4.27%
- Leading Region in 2025: Europe
- Fastest Growing Region: Asia-Pacific
Report Scope and Dairy Desserts Market Segmentation
|
Attributes |
Dairy Desserts Key Market Insights |
|
Segments Covered |
· By Type: Ice-Creams, Yoghurt, Custards, and Others · By Distribution Channel: Store Based and Non-Store Based · By Packaging Material: Paper, Metal, Plastic, Glass, and Others · By Livestock: Poultry, Ruminants, Swine, Aquaculture, Pet Food, and Others |
|
Countries Covered |
North America · U.S. · Canada · Mexico Europe · Germany · France · U.K. · Netherlands · Switzerland · Belgium · Russia · Italy · Spain · Turkey · Rest of Europe Asia-Pacific · China · Japan · India · South Korea · Singapore · Malaysia · Australia · Thailand · Indonesia · Philippines · Rest of Asia-Pacific Middle East and Africa · Saudi Arabia · U.A.E. · South Africa · Egypt · Israel · Rest of Middle East and Africa South America · Brazil · Argentina · Rest of South America |
|
Key Market Players |
• DANONE (France) |
|
Market Opportunities |
• Expansion Of Functional And Probiotic Dairy Desserts |
|
Value Added Data Infosets |
In addition to the insights on market scenarios such as market value, growth rate, segmentation, geographical coverage, and major players, the market reports curated by the Data Bridge Market Research also include in-depth expert analysis, pricing analysis, brand share analysis, consumer survey, demography analysis, supply chain analysis, value chain analysis, raw material/consumables overview, vendor selection criteria, PESTLE Analysis, Porter Analysis, and regulatory framework. |
Global Dairy Desserts Market Trends
Trend: Growth In Premiumization, Functional Nutrition, And Clean Label Dairy Dessert Innovation
Increasing consumer demand for indulgent yet healthier dessert options is reshaping the global dairy desserts market, with strong emphasis on premium ingredients, functional nutrition, and clean label formulations across developed and emerging economies. Rising health awareness is encouraging manufacturers to reduce sugar content, eliminate artificial additives, and introduce protein-rich, probiotic-enriched, and low-fat dairy dessert variants without compromising taste and texture.
In modern retail and foodservice channels, manufacturers are expanding offerings such as Greek yogurt-based desserts, high-protein puddings, and fortified dairy snack cups to meet the rising demand for convenient nutrition. For instance, Greek yogurt consumption in Europe has increased significantly over the past decade, with countries such as the U.K. and Germany witnessing strong adoption of high-protein dairy snacks among health-conscious consumers. In industrial production, companies are leveraging advanced fermentation and formulation technologies to enhance shelf life and improve texture stability in refrigerated dairy desserts while maintaining clean label standards. The rapid expansion of organized retail and e-commerce grocery platforms is also increasing accessibility of premium dairy dessert products across urban markets. In addition, increasing innovation in plant-dairy hybrid desserts is gaining traction in markets such as the U.S. and Japan, where consumers seek lactose-reduced alternatives without sacrificing creaminess or flavor
Global Dairy Desserts Market Dynamics
Key Market Driver: Rising Demand For Indulgent Yet Functional Food Products
The global dairy desserts market is being strongly driven by increasing consumer preference for indulgent food products that also offer functional health benefits such as improved digestion, high protein content, and reduced sugar intake. Busy urban lifestyles and rising disposable incomes are pushing consumers toward ready-to-eat dessert options that combine convenience with nutrition.
Food manufacturers are increasingly introducing probiotic yogurts, protein-enriched puddings, and fortified dairy desserts targeting fitness-conscious and millennial consumers. For instance, major dairy producers in Europe and North America are expanding Greek yogurt-based dessert portfolios, which have shown strong growth due to their high protein content and perceived health benefits. In addition, increasing penetration of cold chain logistics and refrigerated retail formats is supporting wider availability of dairy desserts in supermarkets, convenience stores, and online grocery platforms, thereby accelerating market expansion
Key Restraint/Challenge: Short Shelf Life And Rising Lactose Intolerance Concerns
Despite strong demand growth, the dairy desserts market faces challenges related to short product shelf life, cold chain dependency, and rising consumer concerns regarding lactose intolerance. Dairy-based desserts require continuous refrigeration, increasing storage and transportation costs, particularly in emerging markets with limited cold chain infrastructure.
In addition, increasing prevalence of lactose intolerance, particularly in Asia-Pacific regions such as China and India, is limiting consumption of traditional dairy-based desserts and pushing manufacturers to reformulate products or introduce lactose-free alternatives. Price sensitivity in developing economies further restricts adoption of premium dairy dessert products, especially in rural and semi-urban areas where awareness of functional dairy products remains limited.
Key Market Opportunity: Expansion Of Premium, Functional, And Plant-Blend Dairy Desserts
The increasing demand for premium and functional dairy desserts is creating significant growth opportunities for manufacturers focusing on innovation, product differentiation, and health-oriented formulations. Rising interest in high-protein diets, gut health, and clean label foods is encouraging the development of fortified dairy desserts with added vitamins, minerals, and probiotics.
Companies are increasingly launching hybrid products combining dairy and plant-based ingredients to cater to flexitarian consumers seeking lactose-reduced or dairy-alternative options. For instance, plant-dairy blended yogurts and almond-milk-based puddings are gaining traction in North America and Europe due to growing vegan and lactose-sensitive consumer segments. In addition, advancements in food processing technologies and flavor enhancement techniques are enabling manufacturers to improve taste profiles while maintaining nutritional value. Expansion of organized retail chains and online grocery platforms is further supporting the global accessibility of innovative dairy dessert products across Asia-Pacific and Middle Eastern markets
Global Dairy Desserts Market Scope
The market is segmented on the basis of type, distribution channel, packaging material, and livestock.
- By Type
On the basis of type, the dairy desserts market is segmented into Ice-Creams, Yoghurt, Custards, and Others. The Ice-Creams segment held the largest market revenue share of approximately 42.5% in 2025 driven by strong consumer preference for indulgent frozen desserts, wide product availability across retail chains, and continuous innovation in flavors, formats, and premium offerings such as gelato and artisanal ice creams. High seasonal demand in both developed and emerging markets further supports segment dominance.
The Yoghurt segment is projected to register the fastest growth at a CAGR of 6.1% from 2026 to 2033, driven by increasing demand for high-protein, probiotic-rich, and low-fat dairy dessert alternatives. Rising health consciousness, expanding functional food trends, and strong adoption of Greek yogurt-based dessert variants across Europe and North America are accelerating segment expansion.
- By Distribution Channel
On the basis of distribution channel, the dairy desserts market is segmented into Store Based and Non-Store Based. The Store Based segment held the largest market revenue share of approximately 78.3% in 2025 driven by strong penetration of supermarkets, hypermarkets, convenience stores, and specialty dairy outlets, which offer wide product variety, refrigeration infrastructure, and immediate product availability.
The Non-Store Based segment is projected to register the fastest growth at a CAGR of 7.4% from 2026 to 2033, driven by rapid expansion of e-commerce grocery platforms, increasing consumer preference for doorstep delivery, and growing adoption of quick-commerce services for chilled and frozen food products in urban areas.
- By Packaging Material
On the basis of packaging material, the dairy desserts market is segmented into Paper, Metal, Plastic, Glass, and Others. The Plastic segment held the largest market revenue share of approximately 55.6% in 2025 driven by its cost-effectiveness, lightweight nature, superior moisture resistance, and suitability for mass packaging of ice-creams, yoghurts, and custards across retail and foodservice channels.
The Glass segment is projected to register the fastest growth at a CAGR of 6.8% from 2026 to 2033, driven by rising demand for premium and sustainable packaging formats, increasing consumer preference for recyclable materials, and strong adoption in high-end dairy dessert and artisanal product categories.
- By Livestock
On the basis of livestock, the dairy desserts market is segmented into Poultry, Ruminants, Swine, Aquaculture, Pet Food, and Others. The Ruminants segment held the largest market revenue share of approximately 82.4% in 2025 driven by the dominance of milk production from cattle and buffalo, which serves as the primary raw material source for dairy dessert manufacturing globally.
The Pet Food segment is projected to register the fastest growth at a CAGR of 7.2% from 2026 to 2033, driven by increasing humanization of pets, rising demand for dairy-based nutritional treats, and growing inclusion of functional dairy ingredients in premium pet food formulations across developed markets.
Global Dairy Desserts Market Regional Analysis
- Europe dominated the dairy desserts market with the largest revenue share of 34.8% in 2025, driven by strong consumption of premium dairy products, well-established dairy processing industry, and high demand for indulgent yet functional dessert formats across countries such as Germany, France, Italy, and the U.K.
- Consumers in the region highly value product quality, clean label ingredients, and nutritional enhancements such as high-protein, low-fat, and probiotic-enriched dairy desserts, supporting strong adoption across retail and foodservice channels.
- This widespread consumption is further supported by advanced cold chain infrastructure, high disposable incomes, and a strong culture of yogurt and fermented dairy intake, establishing Europe as a key hub for premium dairy dessert innovation.
U.K. Dairy Desserts Market Insight
The U.K. dairy desserts market captured a significant revenue share in 2025 within Europe, driven by increasing demand for convenient, ready-to-eat dessert options and rising health-conscious consumption patterns. Consumers are increasingly shifting toward high-protein yogurts, low-sugar puddings, and functional dairy snacks. The growing popularity of Greek yogurt-based desserts and premium ice creams, combined with strong supermarket penetration and private-label expansion, is further supporting market growth. In addition, rising preference for indulgent yet portion-controlled desserts is strengthening demand across urban populations.
Germany Dairy Desserts Market Insight
The Germany dairy desserts market is expected to witness steady growth from 2026 to 2033, driven by strong demand for high-quality dairy products, increasing preference for organic and natural ingredients, and growing consumption of yogurt-based desserts. German consumers place high importance on nutritional value and clean label formulations, encouraging manufacturers to develop low-sugar and additive-free dairy dessert offerings. Expansion of retail chains and rising demand for functional foods such as probiotic yogurts are further supporting market growth.
North America Dairy Desserts Market Insight
The North America dairy desserts market is expected to witness strong growth from 2026 to 2033, driven by rising demand for premium ice creams, flavored yogurts, and convenience-based dessert products across the U.S. and Canada. Increasing health awareness is boosting consumption of protein-rich and low-fat dairy desserts, particularly Greek yogurt and functional snack formats. For instance, the U.S. remains a key market for frozen desserts, with strong innovation in artisanal and low-sugar ice cream categories supported by major dairy brands and retail expansion.
U.S. Dairy Desserts Market Insight
The U.S. dairy desserts market is expected to witness the fastest growth rate from 2026 to 2033, attributed to high consumption of ice creams, yogurts, and pudding-based desserts, along with strong product innovation across functional and indulgent categories. The rising trend of health-focused snacking is driving demand for high-protein and probiotic-rich dairy desserts. In addition, widespread availability through supermarkets, convenience stores, and online grocery platforms is significantly supporting market expansion, along with strong brand penetration and continuous product diversification.
Asia-Pacific Dairy Desserts Market Insight
The Asia-Pacific dairy desserts market is expected to witness the fastest growth rate from 2026 to 2033, driven by rapid urbanization, rising disposable incomes, and increasing westernization of dietary habits in countries such as China, India, Japan, and South Korea. Growing awareness of packaged dairy products and expanding cold chain infrastructure are further boosting consumption. For instance, increasing demand for flavored yogurts and premium ice creams in China and India is significantly accelerating market growth, supported by strong retail expansion and e-commerce penetration.
Japan Dairy Desserts Market Insight
The Japan dairy desserts market is expected to witness steady growth from 2026 to 2033 due to strong consumer preference for convenient, portion-controlled, and premium-quality dessert products. The market is driven by increasing demand for yogurt-based desserts, low-fat ice creams, and functional dairy snacks enriched with probiotics. Japan’s aging population and focus on digestive health are further supporting adoption of functional dairy desserts across retail channels.
China Dairy Desserts Market Insight
The China dairy desserts market accounted for the largest market revenue share in Asia Pacific in 2025, attributed to rapid urbanization, expanding middle-class population, and increasing demand for packaged and premium dairy products. Rising consumption of yogurt drinks, ice creams, and flavored dairy snacks is strongly supported by expanding e-commerce platforms and cold chain logistics. In addition, domestic dairy manufacturers are rapidly innovating in flavored and functional dessert categories, further strengthening market expansion across urban and semi-urban regions.
Global Dairy Desserts Market Share
The Dairy Desserts industry is primarily led by well-established companies, including:
• DANONE (France)
• General Mills Inc. (U.S.)
• Nestlé Group (Switzerland)
• The Kraft Heinz Company (U.S.)
• Unilever (U.K./Netherlands)
• DANA DAIRY GROUP (U.S.)
• LACTALIS (France)
• Britannia Industries (India)
• GCMMF (India)
• Mother Dairy Fruit & Vegetable Pvt. Ltd. (India)
• Parag Milk Foods (India)
• The WhiteWave Foods Company (U.S.)
• Parmalat S.p.A. (Italy)
• Royal FrieslandCampina N.V. (Netherlands)
• Silver Pail (Ireland)
• Agropur Cooperative (Canada)
• LION (Australia)
• Coolhull Farm (Ireland)
Latest Developments in Global Dairy Desserts Market
- In July 2025, Britannia Industries Limited introduced NIC Bourbon Ice Cream, a product innovation combining NIC chocolate ice cream with Britannia Bourbon biscuit crumbs. This development strengthens premium dessert offerings and enhances brand differentiation in India’s fast-growing impulse ice cream segment, boosting competitive intensity in the dairy desserts market
- In April 2025, Kwality Wall’s launched the Dairy Factory slow-churned ice cream range in India, expanding its portfolio with chocolate, butterscotch, mango, and vanilla variants. This product expansion enhances premium positioning and responds to rising demand for creamier, texture-rich ice creams, strengthening penetration in organized retail and frozen dessert channels
- In February 2025, Lotte Wellfood established a new ice cream manufacturing facility in Pune, India, with an annual capacity of 50 million liters and an initial investment of USD 57.42 million, with further expansion planned up to USD 300 million. This facility increases production capacity, strengthens local supply chains, and significantly boosts competition in India’s premium frozen dessert market
- In November 2024, Lactalis invested approximately USD 45 million across dairy processing plants in Minas Gerais, Brazil, to expand dulce de leche and fermented milk production capacity. This expansion enhances manufacturing efficiency, strengthens regional market share, and supports growing demand for value-added dairy desserts in South America
- In March 2024, Walmart announced a USD 350 million investment in a new dairy processing facility in Texas, expected to begin operations in 2026, serving around 750 stores and creating nearly 400 jobs. This vertical integration strategy improves supply chain control, reduces procurement costs, and strengthens Walmart’s private-label dairy dessert offerings in the U.S. market
SKU-

- Interactive Data Analysis Dashboard
- Company Analysis Dashboard for high growth potential opportunities
- Research Analyst Access for customization & queries
- Competitor Analysis with Interactive dashboard
- Latest News, Updates & Trend analysis
- Harness the Power of Benchmark Analysis for Comprehensive Competitor Tracking
Global Dairy Desserts Market, Supply Chain Analysis and Ecosystem Framework
To support market growth and help clients navigate the impact of geopolitical shifts, DBMR has integrated in-depth supply chain analysis into its Global Dairy Desserts Market research reports. This addition empowers clients to respond effectively to global changes affecting their industries. The supply chain analysis section includes detailed insights such as Global Dairy Desserts Market consumption and production by country, price trend analysis, the impact of tariffs and geopolitical developments, and import and export trends by country and HSN code. It also highlights major suppliers with data on production capacity and company profiles, as well as key importers and exporters. In addition to research, DBMR offers specialized supply chain consulting services backed by over a decade of experience, providing solutions like supplier discovery, supplier risk assessment, price trend analysis, impact evaluation of inflation and trade route changes, and comprehensive market trend analysis.
Data collection and base year analysis are done using data collection modules with large sample sizes. The stage includes obtaining market information or related data through various sources and strategies. It includes examining and planning all the data acquired from the past in advance. It likewise envelops the examination of information inconsistencies seen across different information sources. The market data is analysed and estimated using market statistical and coherent models. Also, market share analysis and key trend analysis are the major success factors in the market report. To know more, please request an analyst call or drop down your inquiry.
The key research methodology used by DBMR research team is data triangulation which involves data mining, analysis of the impact of data variables on the market and primary (industry expert) validation. Data models include Vendor Positioning Grid, Market Time Line Analysis, Market Overview and Guide, Company Positioning Grid, Patent Analysis, Pricing Analysis, Company Market Share Analysis, Standards of Measurement, Global versus Regional and Vendor Share Analysis. To know more about the research methodology, drop in an inquiry to speak to our industry experts.
Data Bridge Market Research is a leader in advanced formative research. We take pride in servicing our existing and new customers with data and analysis that match and suits their goal. The report can be customized to include price trend analysis of target brands understanding the market for additional countries (ask for the list of countries), clinical trial results data, literature review, refurbished market and product base analysis. Market analysis of target competitors can be analyzed from technology-based analysis to market portfolio strategies. We can add as many competitors that you require data about in the format and data style you are looking for. Our team of analysts can also provide you data in crude raw excel files pivot tables (Fact book) or can assist you in creating presentations from the data sets available in the report.


