
Global Digital Scent Technology Market
Market Size in USD Billion
 USD
1.22 Billion
USD
2.51 Billion
2024
2032
USD
1.22 Billion
USD
2.51 Billion
2024
2032
| 2025 - 2032 | |
| USD 1.22 Billion | |
| USD 2.51 Billion | |
| % | |
|
Digital Scent Technology Market Size
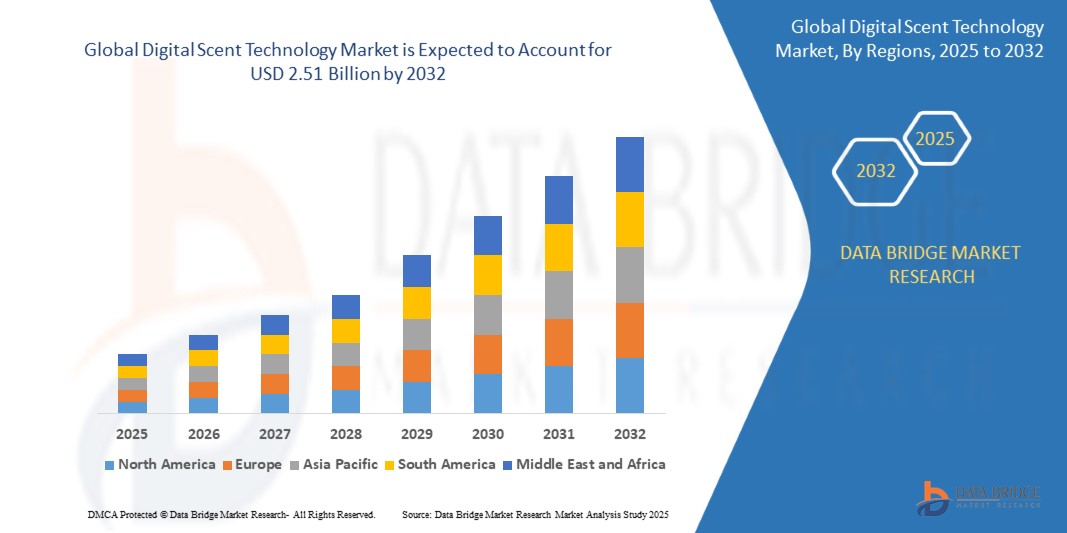
- The global digital scent technology market size was valued at USD 1.22 billion in 2024 and is expected to reach USD 2.51 billion by 2032, at a CAGR of 9.40% during the forecast period
- The market growth is largely fuelled by the increasing demand for enhanced sensory experiences in gaming, virtual reality, and online retail environments, as well as advancements in scent-generating hardware and biosensors
- The integration of digital scent technology into consumer electronics, healthcare diagnostics, and smart home systems is also contributing significantly to the expanding market scope
Digital Scent Technology Market Analysis
- The market is witnessing notable innovation in scent synthesizers and e-nose technology, which is expanding use cases across industries such as entertainment, defense, marketing, and medical diagnostics
- Healthcare applications are expanding, with digital scent technology being used for non-invasive diagnostics such as breath analysis through electronic nose (e-nose) devices, enabling early disease detection
- North America dominated the digital scent technology market with the largest revenue share of 37.6% in 2024, driven by the rapid adoption of advanced sensor technologies and their integration into healthcare, military, and consumer electronics applications
- Asia-Pacific region is expected to witness the highest growth rate in the global digital scent technology market, driven by rapid urbanization, growing consumer electronics adoption, and expanding manufacturing capabilities in countries such as China, Japan, and South Korea
- The e-nose segment dominated the market with the largest market revenue share of 61.4% in 2024, driven by its increasing deployment in medical diagnostics, food safety testing, and air quality monitoring. The ability of e-nose devices to detect and analyze volatile organic compounds in real time has led to widespread use in healthcare and environmental sectors. This segment continues to gain traction due to growing demand for portable, non-invasive diagnostic tools and improvements in sensor sensitivity and selectivity
Report Scope and Digital Scent Technology Market Segmentation
|
Attributes |
Digital Scent Technology Key Market Insights |
|
Segments Covered |
|
|
Countries Covered |
North America
Europe
Asia-Pacific
Middle East and Africa
South America
|
|
Key Market Players |
|
|
Market Opportunities |
|
|
Value Added Data Infosets |
In addition to the market insights such as market value, growth rate, market segments, geographical coverage, market players, and market scenario, the market report curated by the Data Bridge Market Research team includes in-depth expert analysis, import/export analysis, pricing analysis, production consumption analysis, and pestle analysis. |
Digital Scent Technology Market Trends
“Increasing Integration of Digital Scents in Virtual Reality Platforms”
- Virtual reality developers are increasingly embedding digital scent emitters into headsets and immersive environments to offer users a more lifelike and emotionally resonant experience, especially in gaming, simulation, and therapy settings where realism is critical to user satisfaction and engagement
- These systems are designed to synchronize scent release with visual and auditory cues, helping create a full-sensory experience that enhances immersion, memory recall, and behavioral responses, thereby elevating the value of content and increasing user retention
- For instance, OVR Technology launched its ION device that emits real-time scent cues during VR interactions, enabling over 30 different aromas to be incorporated seamlessly into virtual simulations ranging from battlefield scenarios to virtual perfume trials
- This trend is further supported by rising demand from the entertainment, education, and wellness sectors for sensory-enriched content that delivers deeper interaction, emotional depth, and personalized engagement through technology
- As VR adoption expands globally, especially in gaming, military training, and healthcare therapy, the integration of digital scent will likely become a key differentiator, transforming how users connect with digital environments on a multi-sensory level
Digital Scent Technology Market Dynamics
Driver
“Rising Adoption of E-Nose Technology in Medical Diagnostics”
- The growing use of electronic nose (e-nose) devices in healthcare is a significant market driver, as they offer a non-invasive, cost-effective solution for detecting diseases by analyzing volatile organic compounds (VOCs) in patients’ breath or bodily emissions with high sensitivity and real-time results
- E-nose systems are being implemented for early-stage detection of conditions such as lung cancer, kidney disease, tuberculosis, and even viral infections such as COVID-19, helping reduce diagnostic delays and enabling earlier, more effective treatment plans across global health systems
- For instance, Owlstone Medical has developed breath biopsy technology that uses e-nose principles to identify chemical biomarkers associated with diseases, allowing clinicians to diagnose illnesses at the molecular level without relying on invasive procedures or lab-based diagnostics
- Healthcare providers are increasingly investing in scent-based biosensing as part of broader digital health transformations, especially in telemedicine, mobile diagnostics, and resource-limited settings where conventional lab infrastructure is unavailable or expensive
- This driver is expected to strengthen the market through 2032 as demand rises for accurate, real-time diagnostic solutions that support patient monitoring, chronic disease management, and proactive public health strategies
Restraint/Challenge
“Technical Complexity and Lack of Standardization”
- One of the major challenges limiting the digital scent technology market is the high technical complexity involved in accurately replicating and transmitting scents, which requires precise control over molecular combinations, release timing, storage mechanisms, and user-specific intensity adjustments
- The absence of universal standards for scent encoding, interoperability, and device calibration across manufacturers makes it difficult for companies to scale operations, create compatible solutions, or integrate scent functionality into mass-market applications such as smartphones, wearables, or online platforms
- For instance, companies attempting to launch scent modules for mobile gaming or social media often encounter reliability issues related to scent consistency, limited scent libraries, or difficulty ensuring synchronized performance across different devices and environmental conditions
- These limitations increase production costs, hinder consumer adoption, and reduce the feasibility of scent features in mainstream applications, forcing many developers to restrict their offerings to niche verticals such as high-end VR or medical research
- Overcoming this restraint will require collaborative industry efforts focused on standardization, miniaturization, and development of more efficient scent cartridges and diffusion systems that can perform reliably across platforms and user environments
Digital Scent Technology Market Scope
The market is segmented on the basis of type, product type, and application.
• By Type
On the basis of type, the digital scent technology market is segmented into e-nose and scent synthesizer. The e-nose segment dominated the market with the largest market revenue share of 61.4% in 2024, driven by its increasing deployment in medical diagnostics, food safety testing, and air quality monitoring. The ability of e-nose devices to detect and analyze volatile organic compounds in real time has led to widespread use in healthcare and environmental sectors. This segment continues to gain traction due to growing demand for portable, non-invasive diagnostic tools and improvements in sensor sensitivity and selectivity.
The scent synthesizer segment is expected to witness the fastest growth rate from 2025 to 2032, supported by rising adoption in immersive entertainment, marketing, and VR/AR platforms. Scent synthesizers enhance user experience by releasing controlled aromas that complement multimedia content, making them increasingly popular in digital storytelling and brand experience campaigns. The innovation in compact, programmable scent cartridges is further driving demand in gaming and consumer electronics.
• By Product Type
On the basis of product type, the digital scent technology market is segmented into quality control product, smelling screen, music and video game, mobile phone, medical diagnostics product, explosives detector, and others. The medical diagnostics product segment held the largest revenue share in 2024, primarily due to the increasing use of digital scent-enabled tools in breath analysis and early disease detection. Devices such as digital breath analyzers are transforming point-of-care diagnostics by enabling real-time, odor-based medical assessments with minimal invasiveness.
The smelling screen segment is expected to witness the fastest growth rate from 2025 to 2032, attributed to the rising demand for sensory-enhanced content in media and gaming. Smelling screens are being adopted by content creators and advertisers to deliver memorable, multisensory experiences that boost audience engagement. These devices are also gaining interest for educational and training simulations, where scent realism plays a critical role in scenario authenticity.
• By Application
On the basis of application, the market is segmented into entertainment, marketing, food and beverage, communication, healthcare, military and defense, and education. The healthcare segment accounted for the largest market revenue share in 2024 due to its early adoption of e-nose devices for clinical diagnostics, hospital hygiene monitoring, and chronic disease management. Hospitals and research institutions continue to embrace digital scent tools for their ability to improve diagnostic accuracy and reduce testing time.
The entertainment segment is expected to witness the fastest growth rate from 2025 to 2032, led by the integration of scent emitters into virtual reality setups, gaming consoles, and cinematic experiences. The push toward immersive media and the evolution of interactive digital environments are fueling the demand for scent-enabled devices in home and commercial entertainment applications.
Digital Scent Technology Market Regional Analysis
- North America dominated the digital scent technology market with the largest revenue share of 37.6% in 2024, driven by the rapid adoption of advanced sensor technologies and their integration into healthcare, military, and consumer electronics applications
- The region benefits from a strong presence of key players and high investments in research and development focused on expanding the applications of e-nose and scent synthesizer technologies across commercial and defense sectors
- High demand for non-invasive diagnostics and immersive digital experiences, along with regulatory support for innovation in medical devices and military detection systems, are further accelerating market penetration across the U.S. and Canada
U.S. Digital Scent Technology Market Insight
The U.S. digital scent technology market captured the largest revenue share in 2024 within North America, propelled by advancements in artificial intelligence and sensor miniaturization, which are enabling scalable deployment of scent-based solutions. E-nose systems are increasingly being used in hospitals and diagnostic centers for breath-based disease detection, and in military operations for explosives identification. Furthermore, the U.S. entertainment industry is driving demand for scent-enabled virtual reality and gaming systems to enhance user engagement and emotional impact, helping sustain the country's leadership in this market.
Europe Digital Scent Technology Market Insight
The Europe digital scent technology market is expected to witness the fastest growth rate from 2025 to 2032, supported by regulatory initiatives promoting innovation in healthcare and food safety. The adoption of e-nose devices is increasing in food and beverage quality control and environmental monitoring across countries such as Germany, France, and the Netherlands. European consumers and institutions are also showing interest in multisensory technology integration for marketing, education, and immersive training. Partnerships between universities, tech startups, and industrial labs are helping expand the technology’s practical applications and commercial feasibility.
U.K. Digital Scent Technology Market Insight
The U.K. digital scent technology market is expected to witness the fastest growth rate from 2025 to 2032, driven by the increasing implementation of scent-based diagnostic tools and air quality sensors. The country’s healthcare providers are actively exploring non-invasive diagnostic technologies to improve early disease detection. In addition, U.K.-based research institutions and tech companies are investing in scent synthesizers for use in education, interactive media, and marketing. The rise of immersive learning tools and interactive exhibitions in museums and retail environments is also supporting market expansion.
Germany Digital Scent Technology Market Insight
The Germany digital scent technology market is expected to witness the fastest growth rate from 2025 to 2032, due to the country’s leadership in industrial automation and environmental innovation. E-nose technologies are gaining traction in industrial safety, automotive manufacturing, and public health monitoring. Germany’s emphasis on precision engineering and sustainability is driving interest in scent-based pollution detection and quality control solutions. Companies and research institutions are also exploring ways to integrate digital scent with smart home systems and wearable health devices.
Asia-Pacific Digital Scent Technology Market Insight
The Asia-Pacific digital scent technology market is expected to witness the fastest growth rate from 2025 to 2032, driven by growing demand from healthcare, consumer electronics, and military sectors in China, Japan, and India. Rising investments in digital health and AI-enhanced diagnostics, combined with the popularity of immersive technologies in gaming and entertainment, are supporting the expansion of scent technology in the region. Government initiatives promoting smart manufacturing and innovation ecosystems are also fostering growth opportunities for startups and established players.
Japan Digital Scent Technology Market Insight
The Japan digital scent technology market is expected to witness the fastest growth rate from 2025 to 2032, due to the country's advanced robotics industry, aging population, and appetite for high-tech, sensory-rich experiences. The integration of scent into care robots and healthcare tools for elderly support is gaining attention, while entertainment and retail brands are adopting scent technologies to personalize consumer experiences. Japan’s investment in education and digital engagement tools is further boosting applications in virtual learning and immersive media.
China Digital Scent Technology Market Insight
The China digital scent technology market accounted for the largest market revenue share in Asia Pacific in 2024, fueled by the country’s expanding tech ecosystem and strong consumer interest in next-generation electronics. Major advancements in e-nose deployment are being made in sectors such as food safety inspection, health diagnostics, and environmental monitoring. China's push toward smart city development and high adoption of sensory-based marketing tools in retail and e-commerce are accelerating market growth. Local manufacturers and research institutions continue to innovate scent-enabled devices, contributing to broader market accessibility.
Digital Scent Technology Market Share
The Digital Scent Technology industry is primarily led by well-established companies, including:
- Alpha MOS (France)
- Electronic Sensor Technology (U.S.)
- The eNose Company (Netherlands)
- Sensigent (U.S.)
- Aromajoin Corporation (Japan)
- AIRSENSE Analytics GmbH (Germany)
- Owlstone Inc. (U.K.)
- Smiths Detection Group Ltd. (U.K.)
- ScentSational Technologies LLC. (U.S.)
- Teledyne FLIR LLC (U.S.)
- Aryballe Technologies (France)
- Inhalio, Inc. (U.S.)
- E-Nose Pty Ltd (Australia)
- MUI Robotics Co., Ltd. (South Korea)
- OVR Technology (U.S.)
- Olorama Technology Ltd. (Spain)
- AerNos, Inc. (U.S.)
- OW Smell Made Digital (Netherlands)
- SmartNanotubes Technologies GmbH (Germany)
- Breathomix (Netherlands)
Latest Developments in Global Digital Scent Technology Market
- In January 2023, Teledyne FLIR LLC announced a strategic integration by merging the Extech online store into the FLIR platform. This development aims to enhance user experience by providing test and measurement professionals with a single, unified portal for product information, downloads, and support services. The consolidation simplifies the customer journey, improves accessibility, and reinforces FLIR’s position as a comprehensive solutions provider in the measurement technology space, likely boosting customer retention and operational efficiency in the digital scent technology ecosystem
- In January 2023, Aryballe Technologies introduced the Digital Olfaction Hub, a cloud-based innovation designed to transform how odor data is analyzed and utilized. This launch enables faster access to digital olfaction data and delivers advanced analytical tools to research and development teams. By enhancing workflow efficiency and enabling scalable olfactory insights, this platform strengthens Aryballe’s competitive edge while supporting broader adoption of digital scent technologies across healthcare, food, and industrial sectors
SKU-

- Interactive Data Analysis Dashboard
- Company Analysis Dashboard for high growth potential opportunities
- Research Analyst Access for customization & queries
- Competitor Analysis with Interactive dashboard
- Latest News, Updates & Trend analysis
- Harness the Power of Benchmark Analysis for Comprehensive Competitor Tracking
Data collection and base year analysis are done using data collection modules with large sample sizes. The stage includes obtaining market information or related data through various sources and strategies. It includes examining and planning all the data acquired from the past in advance. It likewise envelops the examination of information inconsistencies seen across different information sources. The market data is analysed and estimated using market statistical and coherent models. Also, market share analysis and key trend analysis are the major success factors in the market report. To know more, please request an analyst call or drop down your inquiry.
The key research methodology used by DBMR research team is data triangulation which involves data mining, analysis of the impact of data variables on the market and primary (industry expert) validation. Data models include Vendor Positioning Grid, Market Time Line Analysis, Market Overview and Guide, Company Positioning Grid, Patent Analysis, Pricing Analysis, Company Market Share Analysis, Standards of Measurement, Global versus Regional and Vendor Share Analysis. To know more about the research methodology, drop in an inquiry to speak to our industry experts.
Data Bridge Market Research is a leader in advanced formative research. We take pride in servicing our existing and new customers with data and analysis that match and suits their goal. The report can be customized to include price trend analysis of target brands understanding the market for additional countries (ask for the list of countries), clinical trial results data, literature review, refurbished market and product base analysis. Market analysis of target competitors can be analyzed from technology-based analysis to market portfolio strategies. We can add as many competitors that you require data about in the format and data style you are looking for. Our team of analysts can also provide you data in crude raw excel files pivot tables (Fact book) or can assist you in creating presentations from the data sets available in the report.


