
Global Distributed Energy Resources Management System Derms Market
Market Size in USD Million
 USD
944.12 Million
USD
3,052.81 Million
2024
2032
USD
944.12 Million
USD
3,052.81 Million
2024
2032
| 2025 - 2032 | |
| USD 944.12 Million | |
| USD 3,052.81 Million | |
| % | |
|
What is the Global Distributed Energy Resources Management System (DERMS) Market Size and Growth Rate?
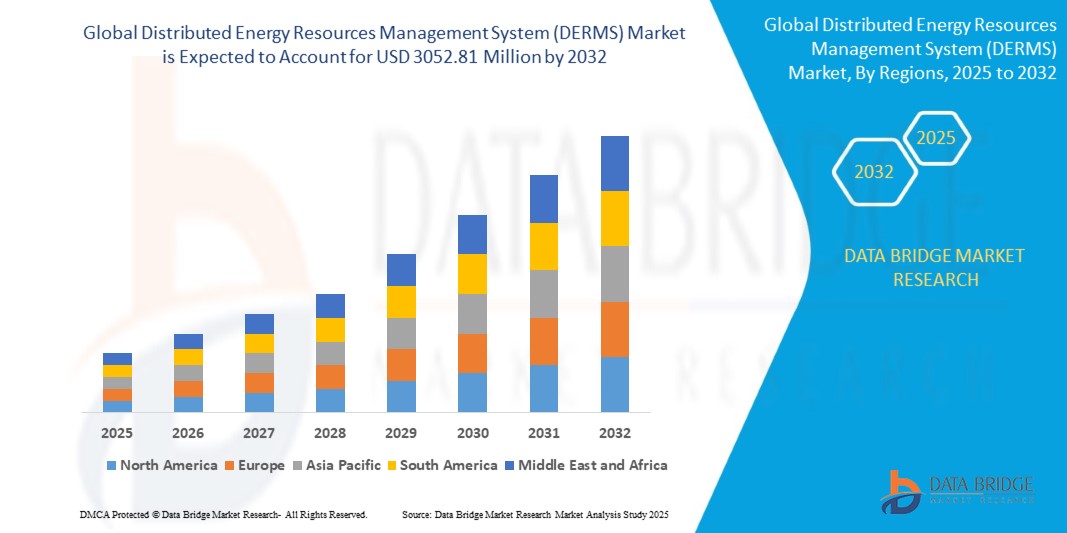
- The global distributed energy resources management system (DERMS) market size was valued at USD 944.12 million in 2024 and is expected to reach USD 3052.81 million by 2032, at a CAGR of 20.10% during the forecast period
- The growing demand for renewable energy generation is the major that is expected to drive the market. On the other hand, regulatory issues related to DERs may act as restraining factors. The growing awareness for clean energy and renewables proves to be an opportunity. However, the threat to utilities from reductions in revenue could prove to be a challenge
What are the Major Takeaways of Distributed Energy Resources Management System (DERMS) Market?
- Various data center companies have invested highly in hyper-scale data centers, which will be expected to generate lucrative market growth opportunities. Last year, Equinix announced plans to construct around 32 hyper-scale data centers in a few major markets in Europe
- With a total capacity of around 600 megawatts and above USD 6.9 billion in investment, the company goals to gain a better position in the rising landscape of hyper-scale data centers. Such growth in the region's data centers will increase the demand for the region's HCI market
- North America dominated the distributed energy resources management system (DERMS) market with the largest revenue share of 36.14% in 2024, driven by strong investments in grid modernization, renewable integration, and regulatory support for decentralized energy
- Asia-Pacific distributed energy resources management system market is poised to grow at the fastest CAGR of 12.03% from 2025 to 2032, propelled by accelerating urbanization, rapid renewable energy expansion, and grid modernization efforts
- The Solar PV segment dominated the distributed energy resources management system market with the largest market revenue share of 41.6% in 2024, driven by its wide-scale adoption in both residential and utility-scale applications
Report Scope and Distributed Energy Resources Management System (DERMS) Market Segmentation
|
Attributes |
Distributed Energy Resources Management System (DERMS) Key Market Insights |
|
Segments Covered |
|
|
Countries Covered |
North America
Europe
Asia-Pacific
Middle East and Africa
South America
|
|
Key Market Players |
|
|
Market Opportunities |
|
|
Value Added Data Infosets |
In addition to the insights on market scenarios such as market value, growth rate, segmentation, geographical coverage, and major players, the market reports curated by the Data Bridge Market Research also include in-depth expert analysis, pricing analysis, brand share analysis, consumer survey, demography analysis, supply chain analysis, value chain analysis, raw material/consumables overview, vendor selection criteria, PESTLE Analysis, Porter Analysis, and regulatory framework. |
What is the Key Trend in the Distributed Energy Resources Management System (DERMS) Market?
“AI-Driven Optimization and Grid Intelligence Integration”
- A prominent trend reshaping the global distributed energy resources management system market is the increasing integration of artificial intelligence (AI) and machine learning (ML) technologies to enhance grid performance, optimize energy distribution, and enable predictive maintenance of distributed assets
- For instance, Siemens AG has introduced AI-powered DERMS platforms that utilize real-time data analytics to optimize the balance between supply and demand in decentralized energy grids. These platforms help in automated decision-making, load forecasting, and real-time anomaly detection
- AI integration allows distributed energy resources management system to intelligently coordinate distributed energy resources (DERs) such as rooftop solar, battery storage, electric vehicles, and demand response systems. By analyzing usage patterns, weather data, and grid conditions, DERMS can automatically dispatch resources to maximize efficiency and stability
- This smart coordination is especially critical in regions adopting net-zero energy goals, where intermittent renewable sources are becoming a larger part of the grid. AI-enhanced DERMS enables seamless integration of renewables while ensuring grid reliability
- Major players such as AutoGrid and Schneider Electric are investing heavily in AI-powered DERMS solutions that integrate edge analytics and cloud computing to support dynamic, decentralized energy networks
- This trend is expected to accelerate, as utilities and grid operators increasingly seek resilient, autonomous, and intelligent energy management systems to meet evolving energy demands and decarbonization goals
What are the Key Drivers of Distributed Energy Resources Management System (DERMS) Market?
- Growing adoption of renewable energy sources such as solar and wind is driving the need for distributed energy resources management system to manage variable energy generation across decentralized networks
- For instance, in March 2024, GE Vernova announced a collaboration with a U.S. utility to deploy its GridOS DERMS platform to manage over 500 MW of distributed energy capacity, helping improve grid stability and renewable integration
- As energy demand fluctuates and DER penetration increases, utilities require DERMS to coordinate and optimize the performance of thousands of individual assets, ensuring grid reliability and reducing operational costs
- Policies and regulations supporting grid modernization, carbon neutrality, and energy decentralization in North America, Europe, and Asia-Pacific are further encouraging the deployment of DERMS solutions
- Enhanced capabilities such as real-time monitoring, automated dispatch, and grid balancing make DERMS essential for utilities transitioning to distributed and customer-centric energy models
- Furthermore, increasing investment in smart grids, coupled with technological advancements in IoT and edge computing, is making distributed energy resources management system more scalable and efficient, driving widespread market adoption
Which Factor is Challenging the Growth of the Distributed Energy Resources Management System (DERMS) Market?
- One of the primary challenges hindering the growth of the DERMS market is the lack of standardization and interoperability between various DER technologies and grid management platforms
- Utilities often operate legacy infrastructure with proprietary protocols, making seamless integration of distributed energy resources management system with existing systems and third-party devices complex and costly.
- For instance, many utilities face difficulties integrating energy storage systems from different vendors into a single DERMS platform due to data format inconsistencies, communication protocol mismatches, or security concerns
- Inconsistent data standards, regulatory frameworks, and communication architectures across regions make it difficult to deploy a unified DERMS strategy at scale
- In addition, the high initial investment cost of full-scale DERMS platforms, combined with a limited number of trained personnel to manage such systems, acts as a deterrent for smaller utilities and grid operators, especially in emerging economies
- To overcome these challenges, there is a growing need for open-source protocols, industry collaboration, and training programs to promote interoperability, reduce integration costs, and ensure skilled workforce availability for distributed energy resources management system deployment
How is the Distributed Energy Resources Management System (DERMS) Market Segmented?
The market is segmented on the basis of technology, software, and end-user.
• By Technology
On the basis of technology, the distributed energy resources management system (DERMS) market is segmented into Solar PV, Wind, CHP (Combined Heat & Power), Energy Storage, and Others. The Solar PV segment dominated the distributed energy resources management system market with the largest market revenue share of 41.6% in 2024, driven by its wide-scale adoption in both residential and utility-scale applications. The growing emphasis on clean energy transitions, declining solar module costs, and supportive government incentives have propelled the deployment of solar PV systems, necessitating efficient distributed energy resources management system platforms to manage decentralized generation.
The Energy Storage segment is anticipated to witness the fastest growth rate of 22.8% from 2025 to 2032, fueled by the rising need for grid flexibility, peak shaving, and load balancing. As battery storage systems become integral to DER planning, DERMS software is increasingly being deployed to manage charge/discharge cycles, monitor performance, and enhance grid responsiveness.
• By Software
On the basis of software, the distributed energy resources management system (DERMS) market is segmented into Analytics, Virtual Power Plants, and Management & Control. The Management & Control segment held the largest market revenue share in 2024, accounting for 44.3%, as utilities prioritize real-time monitoring, device orchestration, and grid balancing functionalities. These solutions are essential for ensuring system reliability, reducing outages, and supporting grid modernization.
The Analytics segment is expected to witness the fastest CAGR from 2025 to 2032, driven by the increasing demand for data-driven insights, predictive maintenance, and load forecasting. Advanced analytics within DERMS allows utilities to optimize operations, improve energy efficiency, and forecast consumption and generation trends with higher accuracy.
• By End-User
On the basis of end-user, the distributed energy resources management system (DERMS) market is segmented into Infrastructure, Power, Oil & Gas, Automotive, Aerospace, Mining, Marine, Water & Waste Water, Food & Beverages, Semi-conductors, Pulp & Paper, CPG, HPC, Entertainment, Life Sciences, and Others. The Power segment accounted for the largest market revenue share of 37.9% in 2024, driven by the global transition towards decentralized and renewable power generation. Utilities and independent power producers (IPPs) are leveraging distributed energy resources management system to manage distributed generation assets, grid congestion, and demand response programs effectively.
The Infrastructure segment is projected to grow at the fastest CAGR from 2025 to 2032, supported by increasing urbanization, smart city initiatives, and the need for sustainable energy systems across public and private infrastructure. DERMS enables seamless integration of DERs in buildings, campuses, and transport networks to ensure energy efficiency and system-wide coordination.
Which Region Holds the Largest Share of the Distributed Energy Resources Management System (DERMS) Market?
- North America dominated the distributed energy resources management system (DERMS) market with the largest revenue share of 36.14% in 2024, driven by strong investments in grid modernization, renewable integration, and regulatory support for decentralized energy. Utilities and energy providers in the region are adopting DERMS to manage increasing volumes of distributed energy assets such as rooftop solar, battery storage, and EV charging infrastructure
- The region's advanced digital infrastructure, mature utility sector, and push for decarbonization further encourage the deployment of distributed energy resources management system solutions to enhance grid reliability, flexibility, and resilience
- These efforts are bolstered by federal and state-level incentives promoting DER aggregation and demand response programs, positioning North America as a leader in distributed energy resources management system adoption
U.S. Distributed Energy Resources Management System (DERMS) Market Insight
The U.S. DERMS market captured the largest revenue share in 2024 within North America, driven by federal mandates for clean energy, aggressive electrification goals, and the rapid growth of distributed generation. Utilities are increasingly deploying distributed energy resources management system to orchestrate diverse assets and support bidirectional power flows on the grid. The proliferation of rooftop solar, smart meters, and home energy storage systems is accelerating demand for intelligent distributed energy resources management system platforms. In addition, the Inflation Reduction Act and grid reliability initiatives are playing a vital role in expanding distributed energy resources management system integration across both investor-owned and municipal utilities.
Europe Distributed Energy Resources Management System (DERMS) Market Insight
The Europe distributed energy resources management system market is projected to grow at a substantial CAGR during the forecast period, fueled by the EU’s Green Deal, carbon neutrality goals, and increasing renewable penetration. European countries are prioritizing smart grid upgrades and distributed energy coordination to support decarbonization. DERMS is being adopted widely in microgrid development, energy communities, and flexibility markets. The growing need for interoperability, grid balancing, and decentralized power generation in residential and commercial sectors is boosting demand for DERMS platforms across the region.
U.K. Distributed Energy Resources Management System (DERMS) Market Insight
The U.K. distributed energy resources management system market is anticipated to grow at a noteworthy CAGR during the forecast period due to its ambitious net-zero targets and growing adoption of decentralized renewable energy sources. Energy regulators are encouraging grid operators to invest in flexible and scalable DERMS solutions to manage variability from solar, wind, and EVs. The growth of virtual power plants and community energy schemes is also expanding the role of DERMS, with increased focus on demand-side flexibility, energy trading, and grid decarbonization.
Germany Distributed Energy Resources Management System (DERMS) Market Insight
The Germany distributed energy resources management system market is expected to expand at a considerable CAGR during the forecast period, supported by strong policies on energy transition, energy efficiency, and sector coupling. As one of Europe’s largest renewable energy producers, Germany is leveraging DERMS to manage fluctuations in distributed solar and wind generation. The integration of DERMS with smart inverters, battery systems, and heat pumps is gaining momentum. With a highly developed infrastructure and progressive energy regulations, Germany is emerging as a hub for advanced DERMS deployment.
Which Region is the Fastest Growing in the Distributed Energy Resources Management System (DERMS) Market?
Asia-Pacific distributed energy resources management system market is poised to grow at the fastest CAGR of 12.03% from 2025 to 2032, propelled by accelerating urbanization, rapid renewable energy expansion, and grid modernization efforts. Countries such as China, Japan, and India are investing heavily in distributed generation and storage, creating strong demand for DERMS to manage grid complexities. Government incentives, rising energy demand, and increasing electrification of transport and buildings are also contributing to market growth. APAC’s strong manufacturing base and favorable economics further enhance DERMS affordability and adoption.
Japan Distributed Energy Resources Management System (DERMS) Market Insight
The Japan distributed energy resources management system market is gaining traction due to the country’s advanced energy policies, high grid reliability standards, and growing need for renewable integration. With significant investments in solar, energy storage, and smart homes, utilities are turning to DERMS to ensure stable grid operations. The emphasis on automation, energy efficiency, and disaster resilience is boosting DERMS deployment, particularly in urban centers and smart city initiatives. Japan’s aging infrastructure and population are also driving demand for reliable, low-maintenance energy solutions.
China Distributed Energy Resources Management System (DERMS) Market Insight
The China distributed energy resources management system market accounted for the largest revenue share in Asia-Pacific in 2024, supported by aggressive solar and wind deployments and the government's commitment to a carbon-neutral future. The country’s push for smart grid development and integration of EV infrastructure is fueling rapid DERMS adoption. State Grid and other utilities are increasingly investing in real-time control platforms to manage massive distributed generation portfolios. In addition, domestic technology innovation and low-cost DER components are positioning China as a leading DERMS market globally.
Which are the Top Companies in Distributed Energy Resources Management System (DERMS) Market?
The distributed energy resources management system (DERMS) industry is primarily led by well-established companies, including:
- Google (U.S.)
- IBM Corporation (U.S.)
- Amazon (U.S.)
- Microsoft (U.S.)
- VMware, Inc. (U.S.)
- Hewlett Packard Enterprise Development LP (U.S.)
- Dell Inc (U.S.)
- Huawei Technologies Co., Ltd. (China)
- FUJITSU (Japan)
- Nutanix (U.S.)
- NetApp (U.S.)
- Quantum Corporation (U.S.)
- Scale Computing (U.S.)
- DataCore Software (U.S.)
- Maxta (U.S.)
- SANGFOR TECHNOLOGIES (China)
- SAP SE (Germany)
What are the Recent Developments in Global Distributed Energy Resources Management System (DERMS) Market?
- In November 2022, Oracle deployed its Advanced Distribution Management System to support FirstEnergy, an Ohio-based utility, in handling power outages across its six-state electric network. Oracle's implementation of its Utilities Network Management System (NMS) enhanced operational efficiency and control across FirstEnergy’s 10 electric utilities. This move significantly strengthened FirstEnergy's ability to monitor and manage grid performance during outages
- In November 2022, Awesense Wireless Inc. partnered with Kitu Systems Inc. to fast-track the rollout of Distributed Energy Resource Management Systems (DERMS) for electric utilities. The collaboration targets key challenges such as outdated data models and limited real-time visibility. This partnership is a strategic step towards enabling smarter and more resilient energy infrastructure
- In October 2022, Generac’s DERMS solution was selected by Dominion Energy Virginia to enhance grid reliability and energy distribution. The system is capable of managing diverse distributed resources, including rooftop solar panels, smart thermostats, EVs, and home battery storage. This selection marks Generac’s rising influence in smart grid technology integration
- In September 2022, Itron integrated its IoT systems with Samsung's SmartThings Energy platform to upgrade DERMS capabilities for utility providers. The integration offers consumers real-time insights into energy usage from meters and behind-the-meter devices. This collaboration aims to improve energy transparency and user engagement in smart energy ecosystems
- In May 2022, GE Digital joined forces with Opus One Solutions to develop a modular DERMS platform for utility companies. The software supports data insights, operational controls, and market integration to optimize distributed energy resources. This innovation empowers utilities to better align technical performance with economic objectives
SKU-

- Interactive Data Analysis Dashboard
- Company Analysis Dashboard for high growth potential opportunities
- Research Analyst Access for customization & queries
- Competitor Analysis with Interactive dashboard
- Latest News, Updates & Trend analysis
- Harness the Power of Benchmark Analysis for Comprehensive Competitor Tracking
Global Distributed Energy Resources Management System Derms Market, Supply Chain Analysis and Ecosystem Framework
To support market growth and help clients navigate the impact of geopolitical shifts, DBMR has integrated in-depth supply chain analysis into its Global Distributed Energy Resources Management System Derms Market research reports. This addition empowers clients to respond effectively to global changes affecting their industries. The supply chain analysis section includes detailed insights such as Global Distributed Energy Resources Management System Derms Market consumption and production by country, price trend analysis, the impact of tariffs and geopolitical developments, and import and export trends by country and HSN code. It also highlights major suppliers with data on production capacity and company profiles, as well as key importers and exporters. In addition to research, DBMR offers specialized supply chain consulting services backed by over a decade of experience, providing solutions like supplier discovery, supplier risk assessment, price trend analysis, impact evaluation of inflation and trade route changes, and comprehensive market trend analysis.
Data collection and base year analysis are done using data collection modules with large sample sizes. The stage includes obtaining market information or related data through various sources and strategies. It includes examining and planning all the data acquired from the past in advance. It likewise envelops the examination of information inconsistencies seen across different information sources. The market data is analysed and estimated using market statistical and coherent models. Also, market share analysis and key trend analysis are the major success factors in the market report. To know more, please request an analyst call or drop down your inquiry.
The key research methodology used by DBMR research team is data triangulation which involves data mining, analysis of the impact of data variables on the market and primary (industry expert) validation. Data models include Vendor Positioning Grid, Market Time Line Analysis, Market Overview and Guide, Company Positioning Grid, Patent Analysis, Pricing Analysis, Company Market Share Analysis, Standards of Measurement, Global versus Regional and Vendor Share Analysis. To know more about the research methodology, drop in an inquiry to speak to our industry experts.
Data Bridge Market Research is a leader in advanced formative research. We take pride in servicing our existing and new customers with data and analysis that match and suits their goal. The report can be customized to include price trend analysis of target brands understanding the market for additional countries (ask for the list of countries), clinical trial results data, literature review, refurbished market and product base analysis. Market analysis of target competitors can be analyzed from technology-based analysis to market portfolio strategies. We can add as many competitors that you require data about in the format and data style you are looking for. Our team of analysts can also provide you data in crude raw excel files pivot tables (Fact book) or can assist you in creating presentations from the data sets available in the report.


