
Global District Cooling Market
Market Size in USD Billion
CAGR :
% 
 USD
30.15 Billion
USD
62.32 Billion
2024
2032
USD
30.15 Billion
USD
62.32 Billion
2024
2032
| 2025 –2032 | |
| USD 30.15 Billion | |
| USD 62.32 Billion | |
| % | |
|
District Cooling Market Analysis
The global district cooling market is experiencing significant growth due to the increasing demand for energy-efficient cooling solutions and the rising adoption of sustainable infrastructure. District cooling, which involves the centralized production and distribution of cooling energy, offers an environmentally friendly alternative to traditional air conditioning methods by reducing energy consumption and greenhouse gas emissions. This market is driven by urbanization, particularly in emerging economies, where rapid development of cities and commercial infrastructure is boosting the need for efficient cooling systems. Technological advancements, such as the integration of renewable energy sources and the use of advanced materials in cooling plants, are further enhancing the effectiveness and sustainability of district cooling systems.
In addition, the growing awareness of climate change and energy conservation is encouraging both private and public sectors to invest in district cooling infrastructure. The U.A.E., Qatar, and other Middle Eastern countries are leading the way in adopting district cooling solutions, with several mega-projects underway to supply cooling to residential, commercial, and industrial areas. In the future, smart cooling technologies and the expansion of district cooling networks are expected to accelerate market growth, providing long-term energy savings.
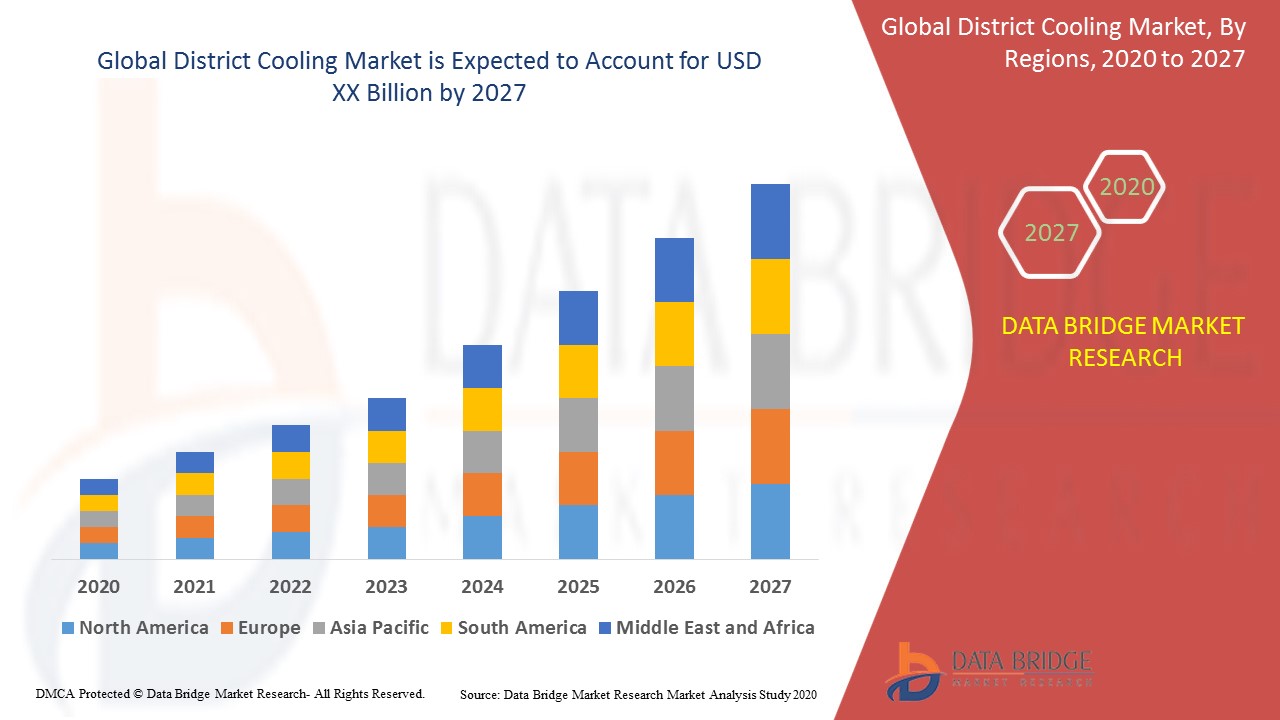
District Cooling Market Size
Global district cooling market size was valued at USD 30.15 billion in 2024 and is projected to reach USD 62.32 billion by 2032, with a CAGR of 9.50% during the forecast period of 2025 to 2032. In addition to the insights on market scenarios such as market value, growth rate, segmentation, geographical coverage, and major players, the market reports curated by the Data Bridge Market Research also include import export analysis, production capacity overview, production consumption analysis, price trend analysis, climate change scenario, supply chain analysis, value chain analysis, raw material/consumables overview, vendor selection criteria, PESTLE Analysis, Porter Analysis, and regulatory framework.
District Cooling Market Trends
“Integration of Renewable Energy Sources”
The district cooling market is witnessing a significant trend toward the integration of renewable energy sources to reduce carbon footprints and enhance sustainability. As governments and industries increasingly focus on energy-efficient and environmentally friendly solutions, district cooling systems are evolving by incorporating solar, geothermal, and waste heat recovery technologies. For instance, in the U.A.E., the Mohammed bin Rashid Al Maktoum Solar Park is being leveraged to power district cooling networks, reducing reliance on conventional energy sources. This trend helps in curbing greenhouse gas emissions and improves the economic viability of district cooling systems by lowering operational costs. In addition, the integration of smart technologies, such as IoT-based monitoring systems, is enhancing the efficiency of district cooling networks by allowing real-time data analysis and optimized energy usage. This combination of renewable energy and advanced technology is expected to drive the growth of the district cooling market, offering sustainable solutions for urban centers across the globe.
Report Scope and Market Segmentation
|
Attributes |
District Cooling Key Market Insights |
|
Segmentation |
|
|
Countries Covered |
U.S., Canada, Mexico, Germany, France, U.K., Netherlands, Switzerland, Belgium, Russia, Italy, Spain, Turkey, Rest of Europe, China, Japan, India, South Korea, Singapore, Malaysia, Australia, Thailand, Indonesia, Philippines, Rest of Asia-Pacific, Saudi Arabia, U.A.E., South Africa, Egypt, Israel, Rest of Middle East and Africa, Brazil, Argentina, Rest of South America |
|
Key Market Players |
Emicool (U.A.E.), Engie (France), Tabreed (U.A.E.), Vattenfall (Sweden), Siemens (Germany), Veolia (France), Helen Ltd (Finland), Ramboll Group A/S (Denmark), Fortum (Finland), Emirates Central Cooling Systems Corporation PJSC (U.A.E.), Sucuri Inc. (U.S.), Keppel Ltd (Singapore), SP Group (Singapore), Stellar Energy International (U.S.), SHINRYO CORPORATION (Japan), Cetetherm (Sweden), AtkinsRéalis (U.K.), ADC Energy Systems (U.A.E.), Wien Energie GmbH (Austria), Gothenburg Energy (Sweden), LOGSTOR Denmark Holding ApS (Denmark), Danfoss (Denmark), Marafeq Qatar (Qatar), DC Pro Engineering (U.A.E.), and PAL Technologies Ltd. (U.K.) |
|
Market Opportunities |
|
|
Value Added Data Infosets |
In addition to the insights on market scenarios such as market value, growth rate, segmentation, geographical coverage, and major players, the market reports curated by the Data Bridge Market Research also include import export analysis, production capacity overview, production consumption analysis, price trend analysis, climate change scenario, supply chain analysis, value chain analysis, raw material/consumables overview, vendor selection criteria, PESTLE Analysis, Porter Analysis, and regulatory framework. |
District Cooling Market Definition
District cooling refers to a centralized cooling system that provides chilled water or air to multiple buildings or facilities within a specific area, such as a city, industrial complex, or large development. The chilled water is typically produced in a central cooling plant, which uses large-scale refrigeration systems, and is then distributed through insulated pipes to individual buildings for air conditioning and cooling purposes.
District Cooling Market Dynamics
Drivers
- Rising Urbanization and Population Growth
Rising urbanization and population growth, especially in hot climates, are major drivers for the district cooling market. As more people migrate to cities and urban populations swell, the demand for cooling solutions intensifies. In rapidly growing metropolitan areas such as Dubai and Singapore, which are known for their hot climates, the expansion of commercial and residential developments has increased the need for energy-efficient and large-scale cooling systems. Traditional air conditioning systems, which are energy-intensive and costly, are no longer sustainable for large developments. District cooling provides a more effective solution by centralizing the cooling process, reducing overall energy consumption, and ensuring consistent temperature regulation across vast areas. For instance, the district cooling system implemented in the Downtown Dubai area serves thousands of residents and businesses, offering a sustainable and cost-effective alternative to individual AC units. This trend of rising urbanization and the growing demand for large-scale cooling infrastructure is significantly contributing to the growth of the district cooling market.
- Environmental Sustainability and Energy Efficiency
Environmental sustainability and energy efficiency are driving significant demand for district cooling systems. As governments and businesses worldwide focus on reducing carbon emissions and improving energy use, district cooling systems offer a more eco-friendly alternative to traditional air conditioners. Unlike individual cooling units, district cooling centralizes the cooling process, which leads to a more efficient distribution of energy and reduces overall electricity consumption. For instance, in the U.A.E., the city of Masdar has integrated district cooling to minimize environmental impact, as it is part of the country's commitment to sustainability. The system allows the city to cut down on energy use and CO2 emissions, aligning with the U.A.E.'s goal to reduce its carbon footprint. In addition, district cooling reduces the need for refrigerants, which are often harmful to the environment. This focus on environmental sustainability and energy efficiency is attracting governments and large corporations and real estate developers who are prioritizing green and cost-effective solutions, making district cooling an increasingly attractive option.
Opportunities
- Increasing Advancements in Cooling Technologies
Advancements in cooling technologies are opening new market opportunities for district cooling by improving its performance and energy efficiency. Innovations such as the integration of renewable energy sources, including solar power, waste heat recovery system, and energy storage systems, are significantly enhancing the sustainability and cost-effectiveness of district cooling systems. For instance, in Saudi Arabia, the King Abdullah University of Science and Technology (KAUST) uses solar-powered district cooling systems to reduce energy consumption and carbon emissions. By incorporating renewable energy, district cooling plants can lower operational costs while aligning with global sustainability goals. Furthermore, advanced refrigeration technologies and energy-efficient chillers are improving the overall performance of district cooling systems, allowing them to deliver more cooling with less energy. These innovations make district cooling an attractive option for large urban developments and businesses seeking eco-friendly and cost-efficient solutions, thus positioning the technology as a key player in the rapidly evolving cooling market.
- Increasing Government Regulations and Incentives
Government regulations and incentives play a crucial role in driving the adoption of district cooling, making it an attractive option for developers and businesses. In regions such as the Middle East and Asia-Pacific, governments are introducing policies that encourage energy-efficient solutions, such as district cooling, to reduce carbon emissions and promote sustainability. For instance, in the U.A.E., the Dubai government has implemented regulations that mandate the use of district cooling in certain new developments, especially in commercial and residential sectors. These regulations, along with financial incentives and subsidies for adopting energy-efficient technologies, make district cooling a cost-effective and environmentally-friendly choice for developers. As cities such as Dubai continue to expand, the push for sustainable, energy-efficient solutions in the construction sector has made district cooling an increasingly appealing option. This government support is contributing to the growth of the market, as more regions recognize the long-term environmental and economic benefits of implementing district cooling systems.
Restraints/Challenges
- High Initial Capital Investment
High initial capital investment is a significant challenge for the district cooling market, as the infrastructure required, such as pipelines, cooling plants, and energy storage systems, demands substantial upfront costs. For instance, building the infrastructure for a district cooling network in a city such as Dubai requires a multi-million-dollar investment due to the scale of the cooling plants and extensive pipelines needed to reach multiple buildings. This financial burden can deter investors and developers, especially in regions where capital availability is limited or where there is uncertainty about the long-term return on investment. In addition, in emerging markets where district cooling technology is less established, the lack of financial resources and confidence in the payback period can hinder adoption. The high initial investment costs, coupled with the complexity of installation and system integration, remain one of the major barriers to widespread implementation, making it a key challenge for the growth of the district cooling market.
- Competition from Alternative Cooling Solutions
Competition from alternative cooling solutions poses a significant challenge to the district cooling market, as traditional methods such as individual air conditioners and decentralized cooling systems remain widely used, especially in regions with low-density urbanization. For instance, in suburban areas or rural locations where buildings are more spread out, individual air conditioning units or small-scale cooling systems are often more practical and cost-effective for consumers. As these traditional cooling solutions continue to evolve, becoming more energy-efficient and affordable due to technological advancements, such as the development of smart AC units and inverter technology, they present strong competition to district cooling systems, which require significant infrastructure. The convenience, lower installation costs, and flexibility of decentralized systems make them an attractive option for many consumers, further limiting the market share for district cooling. This growing competition from individual cooling systems, combined with their ability to adapt to varying demand, poses a challenge for district cooling systems to establish a competitive edge, particularly in areas with less concentrated populations.
This market report provides details of new recent developments, trade regulations, import-export analysis, production analysis, value chain optimization, market share, impact of domestic and localized market players, analyses opportunities in terms of emerging revenue pockets, changes in market regulations, strategic market growth analysis, market size, category market growths, application niches and dominance, product approvals, product launches, geographic expansions, technological innovations in the market. To gain more info on the market contact Data Bridge Market Research for an Analyst Brief, our team will help you take an informed market decision to achieve market growth.
Impact and Current Market Scenario of Raw Material Shortage and Shipping Delays
Data Bridge Market Research offers a high-level analysis of the market and delivers information by keeping in account the impact and current market environment of raw material shortage and shipping delays. This translates into assessing strategic possibilities, creating effective action plans, and assisting businesses in making important decisions.
Apart from the standard report, we also offer in-depth analysis of the procurement level from forecasted shipping delays, distributor mapping by region, commodity analysis, production analysis, price mapping trends, sourcing, category performance analysis, supply chain risk management solutions, advanced benchmarking, and other services for procurement and strategic support.
Expected Impact of Economic Slowdown on the Pricing and Availability of Products
When economic activity slows, industries begin to suffer. The forecasted effects of the economic downturn on the pricing and accessibility of the products are taken into account in the market insight reports and intelligence services provided by DBMR. With this, our clients can typically keep one step ahead of their competitors, project their sales and revenue, and estimate their profit and loss expenditures.
Global District Cooling Market Scope
The market is segmented on the basis of production technique, usage, and application. The growth amongst these segments will help you analyze meagre growth segments in the industries and provide the users with a valuable market overview and market insights to help them make strategic decisions for identifying core market applications.
Production Technique
- Electric Chillers
- Heat Pumps
- Absorption Chillers
- Free Cooling
- Others
Usage
- Storage
- Production
- Distribution
Application
- Commercial
- Residential
- Industrial
Global District Cooling Market Regional Analysis
The market is analyzed and market size insights and trends are provided by country, production technique, usage, and application as referenced above.
The countries covered in the market are U.S., Canada, Mexico, Germany, France, U.K., Netherlands, Switzerland, Belgium, Russia, Italy, Spain, Turkey, rest of Europe, China, Japan, India, South Korea, Singapore, Malaysia, Australia, Thailand, Indonesia, Philippines, rest of Asia-Pacific, Saudi Arabia, U.A.E., South Africa, Egypt, Israel, rest of Middle East and Africa, Brazil, Argentina, and rest of South America.
Asia-Pacific is anticipated to experience the highest growth rate during the forecast period from 2025 to 2032. This growth can be attributed to the rapid increase in industrial activities, particularly within the IT sector, coupled with the surge in high-end commercial operations across the region. The region's expanding economies and technological advancements are expected to drive demand for various services and infrastructure. As a result, Asia-Pacific is set to remain a dominant force in terms of market expansion during this period.
The country section of the report also provides individual market impacting factors and changes in regulation in the market domestically that impacts the current and future trends of the market. Data points such as down-stream and upstream value chain analysis, technical trends and porter's five forces analysis, case studies are some of the pointers used to forecast the market scenario for individual countries. Also, the presence and availability of global brands and their challenges faced due to large or scarce competition from local and domestic brands, impact of domestic tariffs and trade routes are considered while providing forecast analysis of the country data.
Global District Cooling Market Share
The market competitive landscape provides details by competitors. Details included are company overview, company financials, revenue generated, market potential, investment in research and development, new market initiatives, global presence, production sites and facilities, production capacities, company strengths and weaknesses, product launch, product width and breadth, application dominance. The above data points provided are only related to the companies' focus related to market.
District Cooling Market Leaders Operating in the Market Are:
- Emicool (U.A.E.)
- Engie (France)
- Tabreed (U.A.E.)
- Vattenfall (Sweden)
- Siemens (Germany)
- Veolia (France)
- Helen Ltd (Finland)
- Ramboll Group A/S (Denmark)
- Fortum (Finland)
- Emirates Central Cooling Systems Corporation PJSC (U.A.E.)
- Sucuri Inc. (U.S.)
- Keppel Ltd (Singapore)
- SP Group (Singapore)
- Stellar Energy International (U.S.)
- SHINRYO CORPORATION (Japan)
- Cetetherm (Sweden)
- AtkinsRéalis (U.K.)
- ADC Energy Systems (U.A.E.)
- Wien Energie GmbH (Austria)
- Gothenburg Energy (Sweden)
- LOGSTOR Denmark Holding ApS (Denmark)
- Danfoss (Denmark)
- Marafeq Qatar (Qatar)
- DC Pro Engineering (U.A.E.)
- PAL Technologies Ltd. (U.K.)
Latest Developments in District Cooling Market
- In June 2023, Emirates Central Cooling Systems Corporation PJSC awarded multiple contracts to construct an advanced district cooling plant and expand its cooling network in Jumeirah, Dubai. The new plant, with a capacity of 48,000 refrigeration tons (RT), is scheduled to begin operations by the third quarter of 2024
- In March 2023, Danfoss successfully completed the acquisition of BOCK GmbH, a global leader in CO2 and low-GWP compressors used in cooling and heating applications. This acquisition strengthens Danfoss' role as a key provider of environmentally-friendly cooling and heating solutions
- In August 2022, ENOWA formed a partnership with ITOCHU, a Japan-based company specializing in domestic and international trade, and France’s Veolia to develop a desalination plant powered by renewable energy for district cooling at OXAGON
- In February 2022, Tabreed announced its collaboration with Gascool, an Egyptian energy and cooling company, and Marakez, a Saudi real estate developer, to provide district cooling services for the D5M mall in New Katameya, East Cairo. This marks Tabreed's debut into the Egyptian market, which holds significant potential for future growth
- In December 2021, ENGIE and RATP were selected to operate Europe's largest district cooling network. The partnership will expand the network by adding 20 new plants, 10 storage facilities, and 158 kilometers of distribution lines, generating an estimated USD 2.7 billion in revenue over two decades while reducing 300,000 metric tons of greenhouse gas emissions
SKU-
Get online access to the report on the World's First Market Intelligence Cloud

- Interactive Data Analysis Dashboard
- Company Analysis Dashboard for high growth potential opportunities
- Research Analyst Access for customization & queries
- Competitor Analysis with Interactive dashboard
- Latest News, Updates & Trend analysis
- Harness the Power of Benchmark Analysis for Comprehensive Competitor Tracking
Global District Cooling Market, Supply Chain Analysis and Ecosystem Framework
To support market growth and help clients navigate the impact of geopolitical shifts, DBMR has integrated in-depth supply chain analysis into its Global District Cooling Market research reports. This addition empowers clients to respond effectively to global changes affecting their industries. The supply chain analysis section includes detailed insights such as Global District Cooling Market consumption and production by country, price trend analysis, the impact of tariffs and geopolitical developments, and import and export trends by country and HSN code. It also highlights major suppliers with data on production capacity and company profiles, as well as key importers and exporters. In addition to research, DBMR offers specialized supply chain consulting services backed by over a decade of experience, providing solutions like supplier discovery, supplier risk assessment, price trend analysis, impact evaluation of inflation and trade route changes, and comprehensive market trend analysis.
Research Methodology
Data collection and base year analysis are done using data collection modules with large sample sizes. The stage includes obtaining market information or related data through various sources and strategies. It includes examining and planning all the data acquired from the past in advance. It likewise envelops the examination of information inconsistencies seen across different information sources. The market data is analysed and estimated using market statistical and coherent models. Also, market share analysis and key trend analysis are the major success factors in the market report. To know more, please request an analyst call or drop down your inquiry.
The key research methodology used by DBMR research team is data triangulation which involves data mining, analysis of the impact of data variables on the market and primary (industry expert) validation. Data models include Vendor Positioning Grid, Market Time Line Analysis, Market Overview and Guide, Company Positioning Grid, Patent Analysis, Pricing Analysis, Company Market Share Analysis, Standards of Measurement, Global versus Regional and Vendor Share Analysis. To know more about the research methodology, drop in an inquiry to speak to our industry experts.
Customization Available
Data Bridge Market Research is a leader in advanced formative research. We take pride in servicing our existing and new customers with data and analysis that match and suits their goal. The report can be customized to include price trend analysis of target brands understanding the market for additional countries (ask for the list of countries), clinical trial results data, literature review, refurbished market and product base analysis. Market analysis of target competitors can be analyzed from technology-based analysis to market portfolio strategies. We can add as many competitors that you require data about in the format and data style you are looking for. Our team of analysts can also provide you data in crude raw excel files pivot tables (Fact book) or can assist you in creating presentations from the data sets available in the report.

