
Global Electric Ships Market
Market Size in USD Billion
 USD
4.79 Billion
USD
8.93 Billion
2025
2033
USD
4.79 Billion
USD
8.93 Billion
2025
2033
| 2026 - 2033 | |
| USD 4.79 Billion | |
| USD 8.93 Billion | |
| % | |
|
What is the Global Electric Ships Market Size and Growth Rate?
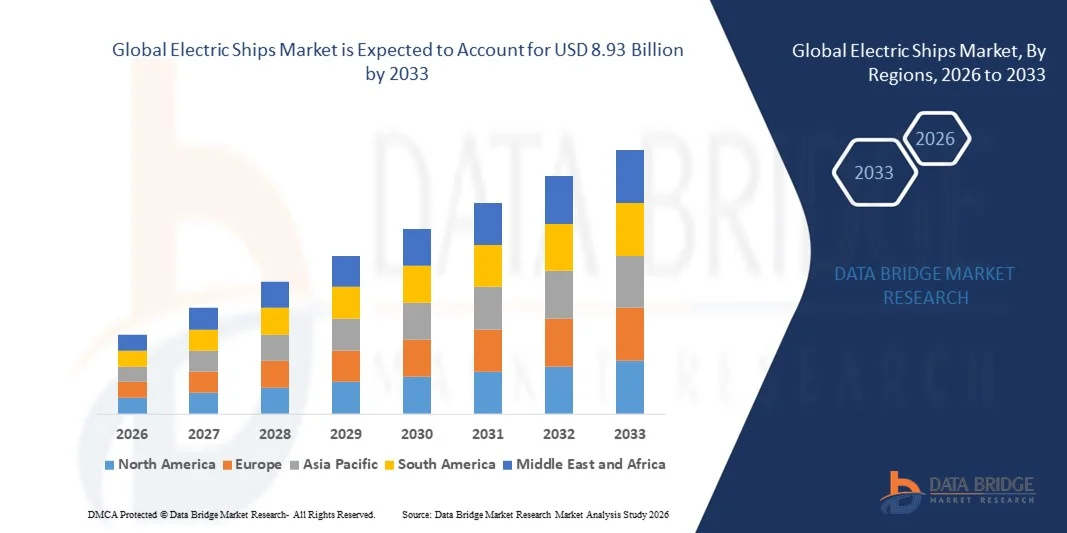
- As per Data Bridge Market Research Analysis the global electric ships market size was valued at USD 4.79 billion in 2025 and is expected to reach USD 8.93 billion by 2033, at a CAGR of 8.10% during the forecast period
- The rise in the number of retro fit applications and higher emphasis on emission reduction act as the major factors driving the growth of electric ships market
- The increase in the investment in the development of various power sources for the shipping industry for the purpose of aligning themselves toward the goal of reducing carbon emission and expansion of marine tourism industry accelerate the market growth
Market Size & Forecast
- Global Market Value (2025): USD 4.79 Billion
- Expected Market Value (2033): USD 8.93 Billion
- Forecast CAGR (2026–2033): 8.10%
What are the Major Takeaways of Electric Ships Market?
- The rise in the design and development of ships causing surge in automation and decline in energy consumption and adoption of hybrid and electric propulsion technologies for retrofitting ships further influence the market
- In addition, implementation of sulfur 2020 rule, development of lithium-ion batteries, growth in commercial aircraft and surge in disposable income of people positively affect the electric ships market
- North America dominated the Electric Ships market with a 38.7% revenue share in 2025, driven by strong naval modernization programs, growing adoption of hybrid-electric ferries, and increasing investments in sustainable maritime transport across the U.S. and Canada
- Asia-Pacific is projected to register the fastest CAGR of 6.89% from 2026 to 2033, driven by rapid shipbuilding expansion, increasing maritime trade, and strong government mandates for emission reduction across China, Japan, South Korea, and India
- The Hybrid segment dominated the market with a 58.6% share in 2025, owing to its operational flexibility, extended sailing range, and lower emissions compared to conventional vessels
Report Scope and Electric Ships Market Segmentation
|
Attributes |
Electric Ships Key Market Insights |
|
Segments Covered |
|
|
Countries Covered |
North America
Europe
Asia-Pacific
Middle East and Africa
South America
|
|
Key Market Players |
|
|
Market Opportunities |
|
|
Value Added Data Infosets |
In addition to the insights on market scenarios such as market value, growth rate, segmentation, geographical coverage, and major players, the market reports curated by the Data Bridge Market Research also include in-depth expert analysis, pricing analysis, brand share analysis, consumer survey, demography analysis, supply chain analysis, value chain analysis, raw material/consumables overview, vendor selection criteria, PESTLE Analysis, Porter Analysis, and regulatory framework. |
What is the Key Trend in the Electric Ships Market?
Increasing Shift Toward Fully Electric and Hybrid Propulsion Systems for Sustainable Maritime Operations
- The Electric Ships market is witnessing strong adoption of battery-electric and hybrid propulsion systems designed to reduce carbon emissions, fuel consumption, and operational noise in commercial and defense vessels
- Shipbuilders are integrating advanced lithium-ion battery systems, shore charging infrastructure, and intelligent energy management platforms to enhance vessel efficiency and regulatory compliance
- Growing environmental regulations from international maritime bodies are accelerating the transition toward zero-emission ferries, inland vessels, and short-sea shipping fleets
- For instance, companies such as Wärtsilä, KONGSBERG, Siemens, and BAE Systems are expanding electric propulsion and integrated power system capabilities
- Increasing demand for energy-efficient naval vessels and smart ships equipped with digital monitoring systems is further driving electrification
- As decarbonization becomes central to maritime strategy, electric propulsion technologies will remain critical for sustainable and cost-effective shipping operations
What are the Key Drivers of Electric Ships Market?
- Rising global focus on reducing greenhouse gas emissions and achieving net-zero maritime targets is significantly driving electric ship adoption
- For instance, in 2025, leading players such as General Electric and MAN Energy Solutions expanded investments in hybrid propulsion and marine battery technologies
- Growing fuel costs and stricter emission norms are encouraging fleet operators to shift toward energy-efficient electric and hybrid vessels
- Advancements in battery energy density, fast-charging systems, and onboard power electronics are improving vessel range and performance
- Increasing development of electric ferries, offshore support vessels, and defense ships is expanding market opportunities
- Supported by government incentives, green shipping initiatives, and port electrification programs, the Electric Ships market is expected to witness strong long-term growth
Which Factor is Challenging the Growth of the Electric Ships Market?
- High initial capital investment associated with battery systems, charging infrastructure, and retrofitting existing vessels limits widespread adoption
- For instance, during 2024–2025, fluctuations in lithium and critical mineral prices increased battery manufacturing costs for several marine technology providers
- Limited battery range and long charging times remain technical constraints for large ocean-going vessels
- Inadequate shore-side charging infrastructure in developing regions slows market penetration
- Safety concerns related to thermal management and battery lifecycle maintenance create operational challenges
- To address these issues, companies are focusing on advanced battery chemistries, modular energy storage systems, and strategic partnerships to enhance scalability and accelerate global adoption of electric ships
How is the Electric Ships Market Segmented?
The market is segmented on the basis of type, power (kW), range (km), system, ship type, mode of operation, and end-use.
- By Type
On the basis of type, the Electric Ships market is segmented into Fully Electric and Hybrid. The Hybrid segment dominated the market with a 58.6% share in 2025, owing to its operational flexibility, extended sailing range, and lower emissions compared to conventional vessels. Hybrid propulsion systems enable optimized fuel consumption, battery-assisted peak shaving, and compliance with stringent maritime emission norms. They are widely deployed in ferries, offshore support vessels, and patrol ships where reliability and endurance are critical.
The Fully Electric segment is projected to grow at the fastest CAGR from 2026 to 2033, driven by rising investments in zero-emission maritime transport, advancements in battery density, and increasing deployment of short-distance electric ferries and inland waterway vessels.
- By Power (kW)
On the basis of power, the market is segmented into <75 kW, 75–150 kW, 151–745 kW, 746–7,560 kW, and >7,560 kW. The 746–7,560 kW segment dominated the market with a 34.2% share in 2025, as it supports medium-to-large commercial vessels, ferries, and offshore ships requiring high propulsion capacity and stable onboard power supply. This range balances efficiency, operational strength, and scalability for hybrid-electric retrofits.
The >7,560 kW segment is expected to grow at the fastest CAGR from 2026 to 2033, fueled by increasing electrification of large commercial ships, naval vessels, and cruise liners demanding high-capacity propulsion and integrated power systems.
- By Range (km)
On the basis of range, the Electric Ships market is segmented into <50 km, 50–100 km, 101–1,000 km, and >1,000 km. The 101–1,000 km segment dominated the market with a 41.5% share in 2025, driven by its suitability for intercity ferries, coastal transport, and regional cargo movement. This range supports balanced battery sizing and hybrid integration for optimized voyage efficiency.
The >1,000 km segment is projected to grow at the fastest CAGR from 2026 to 2033, supported by technological improvements in high-capacity energy storage systems, fuel-cell integration, and growing demand for long-haul zero-emission maritime transport.
- By System
On the basis of system, the market is segmented into Energy Storage Systems, Power Conversion, Power Generation, and Power Distribution Systems. The Energy Storage Systems segment dominated the market with a 37.9% share in 2025, due to the critical role of lithium-ion batteries, solid-state batteries, and hybrid storage modules in enabling vessel electrification. Growing focus on battery safety, lifecycle management, and higher energy density strengthens segment demand.
The Power Conversion segment is expected to grow at the fastest CAGR from 2026 to 2033, driven by increasing integration of advanced inverters, converters, and power management software for optimized propulsion control and energy efficiency.
- By Ship Type
On the basis of ship type, the Electric Ships market is segmented into Commercial and Defense. The Commercial segment dominated the market with a 69.4% share in 2025, supported by rapid electrification of ferries, cruise vessels, cargo ships, and offshore service vessels to reduce carbon emissions and operating costs. Government incentives and green shipping regulations further accelerate adoption.
The Defense segment is projected to grow at the fastest CAGR from 2026 to 2033, driven by increasing demand for silent propulsion, enhanced onboard power for advanced systems, and naval modernization programs.
- By Mode of Operation
On the basis of mode of operation, the market is segmented into Manned, Remotely Operated, and Autonomous. The Manned segment dominated the market with a 63.8% share in 2025, as most commercial and defense vessels continue to operate under conventional onboard crew systems integrated with electric propulsion technologies.
The Autonomous segment is expected to grow at the fastest CAGR from 2026 to 2033, supported by advancements in AI-based navigation, smart sensors, satellite communication, and regulatory progress toward unmanned maritime operations.
- By End-Use
On the basis of end-use, the Electric Ships market is segmented into Newbuild and Line Fit and Retrofit. The Newbuild segment dominated the market with a 61.7% share in 2025, driven by rising investments in next-generation electric vessels designed with integrated propulsion, digital monitoring, and optimized battery layouts from inception.
The Line Fit and Retrofit segment is projected to grow at the fastest CAGR from 2026 to 2033, as shipowners increasingly upgrade existing fleets with hybrid-electric systems to comply with emission standards and extend vessel lifecycles.
Which Region Holds the Largest Share of the Electric Ships Market?
- North America dominated the Electric Ships market with a 38.7% revenue share in 2025, driven by strong naval modernization programs, growing adoption of hybrid-electric ferries, and increasing investments in sustainable maritime transport across the U.S. and Canada. Strict emission regulations, port electrification initiatives, and rising deployment of battery-powered inland and coastal vessels continue to fuel regional demand
- Leading shipbuilders and marine technology providers are investing in advanced propulsion systems, high-capacity battery modules, and integrated power management platforms, strengthening North America’s technological leadership. Government funding for green shipping corridors and defense fleet electrification further accelerates adoption
- Strong R&D capabilities, presence of established marine engineering firms, and high defense spending reinforce long-term regional dominance in electric and hybrid vessel development
U.S. Electric Ships Market Insight
The U.S. is the largest contributor in North America, supported by naval electrification programs, commercial ferry modernization, and growing demand for low-emission port operations. Increasing deployment of hybrid patrol boats, offshore support vessels, and electric ferries strengthens market growth. Investments in advanced lithium-ion battery systems, integrated onboard power distribution, and autonomous vessel technologies further accelerate adoption across commercial and defense maritime sectors.
Canada Electric Ships Market Insight
Canada contributes significantly due to rising investments in sustainable marine transportation, coastal ferry electrification, and Arctic-compatible hybrid vessels. Government-backed clean energy initiatives and partnerships between shipyards and battery technology providers are expanding deployment. Growing focus on reducing marine emissions and modernizing aging fleets supports steady market penetration.
Asia-Pacific Electric Ships Market
Asia-Pacific is projected to register the fastest CAGR of 6.89% from 2026 to 2033, driven by rapid shipbuilding expansion, increasing maritime trade, and strong government mandates for emission reduction across China, Japan, South Korea, and India. Rising production of electric ferries, hybrid cargo ships, and battery-powered inland vessels accelerates regional demand. Expanding port infrastructure, green shipping corridors, and technological advancements in marine batteries further boost market growth.
China Electric Ships Market Insight
China leads the Asia-Pacific market due to its dominant shipbuilding industry, large-scale battery manufacturing capacity, and strong government support for electric mobility. Deployment of electric river ferries, coastal cargo vessels, and hybrid patrol ships continues to rise, supported by domestic innovation and cost-efficient production capabilities.
Japan Electric Ships Market Insight
Japan demonstrates steady growth driven by advanced marine engineering expertise and focus on zero-emission coastal transport. Development of hybrid propulsion systems, fuel-cell-integrated vessels, and smart ship technologies strengthens long-term adoption across commercial fleets.
India Electric Ships Market Insight
India is emerging as a high-growth market supported by inland waterway development projects and government initiatives promoting electric ferries. Expanding shipyard modernization and increasing focus on sustainable maritime logistics enhance future demand.
South Korea Electric Ships Market Insight
South Korea contributes significantly through advanced shipbuilding capabilities and innovation in high-capacity marine batteries and propulsion systems. Strong export-oriented ship manufacturing and investments in smart, eco-friendly vessels support sustained regional growth.
Which are the Top Companies in Electric Ships Market?
The Electric Ships industry is primarily led by well-established companies, including:
- Wärtsilä (Finland)
- KONGSBERG (Norway)
- General Electric (U.S.)
- VARD (Norway)
- Siemens (Germany)
- Leclanché SA (Switzerland)
- BAE Systems (U.K.)
- Norwegian Electric Systems (Norway)
- MAN Energy Solutions (Germany)
- Corvus Energy (Canada)
- Echandia (Sweden)
- General Dynamics Electric Boat (U.S.)
- Anglo Belgian Corporation (Belgium)
- SCHOTTEL Group (Germany)
- Danfoss (Denmark)
- Eco Marine Power (Japan)
- AKASOL AG (Germany)
- EST-Floattech (Netherlands)
- Saft (France)
- Duffy Electric Boat Company (U.S.)
- Vision Marine Technologies (Canada)
What are the Recent Developments in Global Electric Ships Market?
- In August 2025, GE Vernova Naval Systems secured a USD 10.4 million contract from the U.S. Navy to develop and prototype a megawatt-scale hybrid modular multi-level converter (HMMC) designed to enhance naval propulsion and onboard power distribution capabilities, strengthening next-generation electric naval architecture development
- In August 2025, Corvus Energy was chosen to deliver the energy storage system for the world’s first fully electric offshore construction vessel, which will operate entirely on battery-based propulsion without hybrid support, marking a significant milestone in zero-emission offshore vessel deployment
- In July 2025, SCHOTTEL received a contract from French maritime service provider Louis Dreyfus Armateurs (LDA) to provide eight SRP 430 D Rudder Propeller Dynamic units for two service operation vessels being constructed for Vattenfall, reinforcing demand for advanced propulsion technologies in offshore wind support fleets
- In July 2025, Kongsberg was awarded a contract to modernize the Norwegian Coastal Administration’s hybrid vessel OV Bøkfjord by integrating electric Rim-Drive azimuth thrusters and upgrading its hybrid propulsion infrastructure, accelerating the transition toward more energy-efficient coastal vessels
- In June 2025, Wärtsilä obtained a contract from Vertom Group to supply hybrid propulsion solutions for four 10,700 DWT tween-decker vessels under construction at Chowgule Shipyards in India, incorporating Wärtsilä 25 engines, electric drive systems, controllable pitch propellers (CPP), thrusters, and EcoControl systems to enable battery-only sailing under specific operational conditions, supporting sustainable maritime operations expansion
SKU-

- Interactive Data Analysis Dashboard
- Company Analysis Dashboard for high growth potential opportunities
- Research Analyst Access for customization & queries
- Competitor Analysis with Interactive dashboard
- Latest News, Updates & Trend analysis
- Harness the Power of Benchmark Analysis for Comprehensive Competitor Tracking
Data collection and base year analysis are done using data collection modules with large sample sizes. The stage includes obtaining market information or related data through various sources and strategies. It includes examining and planning all the data acquired from the past in advance. It likewise envelops the examination of information inconsistencies seen across different information sources. The market data is analysed and estimated using market statistical and coherent models. Also, market share analysis and key trend analysis are the major success factors in the market report. To know more, please request an analyst call or drop down your inquiry.
The key research methodology used by DBMR research team is data triangulation which involves data mining, analysis of the impact of data variables on the market and primary (industry expert) validation. Data models include Vendor Positioning Grid, Market Time Line Analysis, Market Overview and Guide, Company Positioning Grid, Patent Analysis, Pricing Analysis, Company Market Share Analysis, Standards of Measurement, Global versus Regional and Vendor Share Analysis. To know more about the research methodology, drop in an inquiry to speak to our industry experts.
Data Bridge Market Research is a leader in advanced formative research. We take pride in servicing our existing and new customers with data and analysis that match and suits their goal. The report can be customized to include price trend analysis of target brands understanding the market for additional countries (ask for the list of countries), clinical trial results data, literature review, refurbished market and product base analysis. Market analysis of target competitors can be analyzed from technology-based analysis to market portfolio strategies. We can add as many competitors that you require data about in the format and data style you are looking for. Our team of analysts can also provide you data in crude raw excel files pivot tables (Fact book) or can assist you in creating presentations from the data sets available in the report.


