
Global Food Drink Packaging Market
Market Size in USD Billion
 USD
566.52 Billion
USD
799.49 Billion
2024
2032
USD
566.52 Billion
USD
799.49 Billion
2024
2032
| 2025 - 2032 | |
| USD 566.52 Billion | |
| USD 799.49 Billion | |
| % | |
|
Food Drink Packaging Market Size
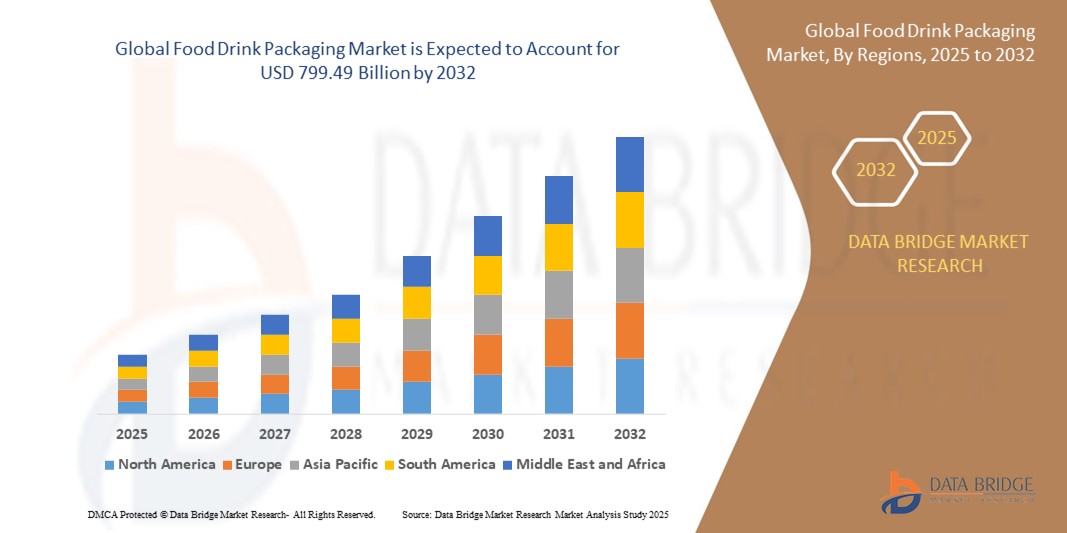
- The global food drink packaging market size was valued at USD 566.52 billion in 2024 and is expected to reach USD 799.49 billion by 2032, at a CAGR of 4.40% during the forecast period
- The market growth is largely fueled by consumers are increasingly becoming environmentally conscious, prompting food and beverage companies to adopt sustainable packaging options such as biodegradable plastics, compostable materials, and recyclable paperboard
- This trend has created a need for packaging that not only preserves freshness and extends shelf life but is also portable, lightweight, and user-friendly. Innovations in resealable, single-serve, and microwave-safe packaging formats are helping food and beverage brands meet evolving consumer expectations
Food Drink Packaging Market Analysis
- The market's expansion is significantly influenced by the increasing demand for sustainable and eco-friendly packaging solutions as consumers are actively seeking products that align with their values regarding environmental responsibility and long-term impact on the planet
- This shift is driven by heightened environmental awareness among consumers and regulatory pressures to reduce plastic waste which has encouraged manufacturers to adopt recyclable, biodegradable, or compostable packaging materials while also improving brand image and meeting evolving packaging standards
- Asia-Pacific dominates the food drink packaging market with the largest revenue share of 40.05% in 2024, driven by widespread adoption of advanced packaging technologies that enhance product safety and shelf life. companies in the region are increasingly investing in smart packaging solutions such as modified atmosphere packaging and active packaging to meet consumer demands and reduce food waste.
- North America is expected to be the fastest growing region in the Food Drink Packaging market during the forecast period due to increasing urbanization and rising disposable incomes
- The plastics segment dominates the largest market revenue share of approximately 68%, driven by its lightweight nature, cost-effectiveness, and versatility in design and color customization. Plastics offer excellent barrier properties and are highly compatible with different mascara formulas, making them the preferred choice for manufacturers and consumers alike
Report Scope and Food Drink Packaging Market Segmentation
|
Attributes |
Food Drink Packaging Key Market Insights |
|
Segments Covered |
|
|
Countries Covered |
North America
Europe
Asia-Pacific
Middle East and Africa
South America
|
|
Key Market Players |
|
|
Market Opportunities |
|
|
Value Added Data Infosets |
In addition to the insights on market scenarios such as market value, growth rate, segmentation, geographical coverage, and major players, the market reports curated by the Data Bridge Market Research also include import export analysis, production capacity overview, production consumption analysis, price trend analysis, climate change scenario, supply chain analysis, value chain analysis, raw material/consumables overview, vendor selection criteria, PESTLE Analysis, Porter Analysis, and regulatory framework. |
Food Drink Packaging Market Trends
“Rising Shift Toward Eco-Friendly Food Packaging”
- The market is steadily leaning toward biodegradable and compostable packaging materials as sustainability becomes a core priority in packaging decisions
- Plant-based materials such as cornstarch, sugarcane fiber, and mushroom roots are being explored as alternatives to traditional plastic packaging
- Brands are also experimenting with edible packaging formats, which eliminate waste and appeal to eco-conscious consumers
- Biodegradable adhesives and inks are being developed to ensure the entire package, not just the main material, meets compostable standards
- Smart features such as freshness indicators are being combined with eco-friendly designs to enhance functionality without harming the environment
- For instance, a food tech company recently introduced food trays made entirely from agricultural waste and natural polymers, offering a durable and fully compostable solution for packaging fresh produce
- In conclusion, this growing focus on biodegradable solutions signals a long-term transformation in how food and beverage products are packaged, aligning with consumer values and shaping the future of the packaging industry
Food Drink Packaging Market Dynamics
Driver
“Rising Demand for Convenience and Ready-to-Eat Foods”
- Growing consumer preference for convenience and ready-to-eat food products is driving demand for packaging that preserves freshness, ensures portability, and extends shelf life such as resealable pouches and microwave-safe containers
- Busy lifestyles and time constraints are fueling the need for easy-to-access and minimal preparation packaging, supporting takeaway and home delivery models that rely on durable, tamper-evident containers
- Packaging innovations such as single-serve packs and easy-open cans enhance user experience and food safety, making them popular among both consumers and food service providers
- For instance, companies such as Nestlé and PepsiCo have expanded their range of resealable and portion-controlled packaging in recent years to cater to on-the-go consumption trends
- Manufacturers are investing in packaging materials that balance functionality with sustainability and aesthetics to meet evolving consumer expectations and regulatory guidelines
- In conclusion, the widespread adoption of convenience-focused packaging is significantly contributing to the consistent growth of the global food and drink packaging market, highlighting its importance in the industry’s future development
Restraint/Challenge
“High Cost of Advanced Packaging Technologies”
- High costs of advanced and sustainable packaging technologies limit widespread adoption despite their benefits such as biodegradable films and antimicrobial coatings
- Specialized materials, research and development, and new production infrastructure investments significantly increase operational expenses for manufacturers
- Small and medium-sized enterprises often face prohibitive costs transitioning from conventional packaging to eco-friendly alternatives due to limited capital and scale
- Compliance with evolving packaging regulations and certifications adds complexity and further financial burden on manufacturers trying to innovate
- For instance, many startups and mid-sized companies report delays in adopting sustainable packaging because of fluctuating material costs and lack of affordable supply chains
- In price-sensitive markets, balancing innovation with affordability remains challenging, creating a gap between environmental goals and commercial viability
- In conclusion, this financial barrier slows the overall market transformation, particularly for companies operating with tight margins or in highly competitive sectors
Food Drink Packaging Market Scope
The global food and drink packaging market is segmented on the basis of material, technology, equipment, and application.
• By Material
On the basis of material, the food and drink packaging market is segmented into metal, glass and wood, paper and paperboard, plastics, and others. The plastics segment dominates the largest market revenue share of approximately 60% in 2024, driven by its versatility, cost-effectiveness, and excellent barrier properties that help preserve food freshness and extend shelf life. Plastics also offer design flexibility and lightweight benefits, making them preferred for various packaging formats.
The paper and paperboard segment is anticipated to witness the fastest growth rate of around 11% from 2025 to 2032, fueled by increasing environmental concerns and consumer demand for sustainable and recyclable packaging alternatives. Innovations in coated and laminated paperboard improve durability and barrier performance, making it more competitive with plastics.
• By Technology
On the basis of technology, the food and drink packaging market is segmented into controlled, active, intelligent, aseptic, biodegradable, and others. The controlled technology segment held the largest market revenue share in 2024, owing to its effectiveness in maintaining food quality by regulating gas composition within the package, thus extending freshness and shelf life.
The biodegradable technology segment is expected to witness the fastest CAGR from 2025 to 2032, propelled by rising regulatory mandates and consumer preference for eco-friendly packaging. Biodegradable materials such as polylactic acid and starch-based polymers are increasingly adopted for packaging fresh and convenience foods.
• By Equipment
On the basis of equipment, the food and drink packaging market is segmented into form-fill-seal, filling and dosing, cartooning, case packaging, wrapping and bundling, labelling and coding, inspecting, detecting, and check weighing machines, and others. The form-fill-seal equipment segment dominated the market, accounting for the largest revenue share due to its efficiency in packaging liquids, powders, and solids with speed and minimal waste.
The labelling and coding segment is expected to witness the fastest growth rate from 2025 to 2032, driven by growing demand for product traceability, branding, and compliance with food safety regulations. Advanced labelling technologies enable high-quality printing and serialization for supply chain transparency.
• By Application
On the basis of application, the food and drink packaging market is segmented into dairy and dairy products, bakery products, confectionery products, poultry, seafood and meat products, convenience foods, fruits and vegetables, and others. The convenience foods segment accounted for the largest market revenue share in 2024, driven by rising consumer demand for ready-to-eat and on-the-go meal options requiring safe, portable, and durable packaging.
The fruits and vegetables segment is expected to witness the fastest CAGR from 2025 to 2032, fueled by increasing consumption of fresh produce and innovations in breathable and biodegradable packaging that enhance shelf life and reduce spoilage.
Food Drink Packaging Market Regional Analysis
- Asia-Pacific dominates the food drink packaging market with the largest revenue share of 40.05% in 2024, driven by widespread adoption of advanced packaging technologies that enhance product safety and shelf life. companies in the region are increasingly investing in smart packaging solutions such as modified atmosphere packaging and active packaging to meet consumer demands and reduce food waste
- The region benefits from strong demand for sustainable and recyclable packaging solutions fueled by increasing consumer awareness and regulatory pressure. Environmental regulations and growing focus on reducing plastic pollution are encouraging manufacturers to develop eco-friendly materials and circular packaging systems
- Rapid growth in e-commerce and home delivery services is further boosting the need for innovative, convenient packaging formats that ensure product integrity during transit. As more consumers opt for online grocery shopping, companies are adopting durable, tamper-evident, and easy-to-handle packaging to maintain freshness and enhance user experience.
U.S. Food and Drink Packaging Market Insight
The U.S. food and drink packaging market captured the largest revenue share of 78% in North America in 2024, driven by strong consumer demand for convenience and sustainability. Increasing preference for eco-friendly packaging materials and innovative formats that extend product shelf life is reshaping the market. Rising adoption of smart packaging solutions that provide real-time freshness monitoring and tamper evidence further fuels market growth. Moreover, the expanding retail and e-commerce sectors are accelerating demand for versatile and secure packaging designs suited for online delivery.
Europe Food and Drink Packaging Market Insight
The Europe food and drink packaging market is projected to grow steadily throughout the forecast period, supported by strict regulatory frameworks targeting reduction in plastic waste and carbon footprint. Growing consumer awareness around environmental impact encourages the use of recyclable and biodegradable packaging materials. The surge in demand for convenient, on-the-go food packaging formats and increasing urbanization are also key contributors. Both new product launches and packaging redesigns to meet sustainability goals are shaping the competitive landscape in Europe.
U.K. Food and Drink Packaging Market Insight
The U.K. food and drink packaging market is anticipated to expand at a healthy rate during the forecast period, fueled by growing consumer focus on health, safety, and sustainability. Stringent packaging regulations and commitments to reduce single-use plastics boost the adoption of innovative, eco-conscious packaging solutions. The rise of online grocery shopping and meal kit delivery services is increasing demand for protective, tamper-evident, and resealable packaging formats. The U.K. market benefits from well-established packaging supply chains and strong innovation hubs.
Germany Food and Drink Packaging Market Insight
Germany’s food and drink packaging market is expected to experience significant growth, driven by high consumer demand for sustainable packaging and advanced preservation technologies. Investments in biodegradable and compostable materials, as well as intelligent packaging systems that track product freshness, support the market’s expansion. Germany’s focus on circular economy principles and stringent waste management policies fosters innovation in recyclable packaging solutions. Demand from the organic food segment and rising e-commerce penetration also positively influence the market.
Asia-Pacific Food and Drink Packaging Market Insight
The Asia-Pacific food and drink packaging market is poised to grow at the fastest CAGR of around 22% from 2025 to 2032, driven by rapid urbanization, rising disposable incomes, and increasing health awareness. Countries such as China, India, Japan, and South Korea are witnessing strong adoption of convenient and sustainable packaging solutions. Government initiatives promoting sustainable packaging and investments in packaging machinery further boost market growth. The region’s expanding processed and convenience foods sector is a major driver of packaging demand.
Japan Food and Drink Packaging Market Insight
Japan’s food and drink packaging market is gaining traction due to the country’s emphasis on food safety, quality, and sustainability. The aging population and busy urban lifestyle drive demand for ready-to-eat meals and innovative packaging that enhances convenience and extends shelf life. Japan’s advanced technology ecosystem supports the development of smart packaging features such as freshness indicators and anti-counterfeit solutions. Packaging manufacturers are focusing on lightweight and eco-friendly designs aligned with consumer preferences.
China Food and Drink Packaging Market Insight
China accounted for the largest market revenue share in Asia-Pacific in 2024, propelled by rapid urbanization, a growing middle class, and rising demand for packaged convenience foods. The country is a major hub for both production and consumption of innovative food packaging materials and technologies. Efforts to reduce plastic waste and increase recycling rates are driving growth in biodegradable and recyclable packaging segments. Strong domestic manufacturing capabilities and government policies encouraging sustainable packaging solutions continue to support market expansion.
Food Drink Packaging Market Share
The food drink packaging industry is primarily led by well-established companies, including:
- Amcor plc (Australia)
- Ball Corporation (U.S.)
- Crown (U.S.)
- WestRock Company (U.S.)
- Sealed Air (U.S.)
- Silgan Holdings Inc. (U.S.)
- Tetra Pak International S.A. (Switzerland)
- Toyo Seikan Group Holdings, Ltd. (Japan)
- Parksons Packaging Ltd. (India)
- Cellpack AG Packaging (Switzerland)
- CLONDALKIN GROUP (Netherlands)
- Constantia Flexibles (Austria)
- Huhtamaki (Finland)
- Mondi (U.K.)
- Sonoco Products Company (U.S.)
Latest Developments in Global Food Drink Packaging Market
- In October 2023, CPMC Holdings Limited unveiled plans to construct a new beverage can plant in Hungary, forming a joint venture with ORG to establish Europe's second China-owned facility. The two-piece beverage can plant signifies a significant expansion in the beverage cans market, enhancing production capacity in Europe
- In March 2023, SIG enabled Casalasco Società Agricola to introduce its food products in aseptic carton packs featuring full-barrier packaging materials, ensuring product freshness and quality preservation
- In January 2023, Cascades launched eco-friendly packaging tailored for fresh fruits and vegetables, introducing closed baskets made from recycled and recyclable corrugated cardboard, catering specifically to the produce sector
- In May 2022, UFlexIndia launched FLEXCOAT AQUABAN Coating for Corrugation Boxes, a water-repellent solution for kraft paper used in corrugated boxes. This FDA-compliant coating preserves box integrity during transit and adverse weather conditions, particularly benefiting perishable goods
- In April 2022, Zomato initiated '100% Plastic Neutral Deliveries' in April 2022, aiming to deliver over ten crore orders in sustainable packaging within three years. Collaborations with government initiatives, social enterprises, and startups will drive innovation in restaurant industry packaging solutions
SKU-

- Interactive Data Analysis Dashboard
- Company Analysis Dashboard for high growth potential opportunities
- Research Analyst Access for customization & queries
- Competitor Analysis with Interactive dashboard
- Latest News, Updates & Trend analysis
- Harness the Power of Benchmark Analysis for Comprehensive Competitor Tracking
Table of Content
1 INTRODUCTION
1.1 OBJECTIVES OF THE STUDY
1.2 MARKET DEFINITION
1.3 OVERVIEW OF GLOBAL FOOD AND DRINK PACKAGING MARKET
1.4 CURRENCY AND PRICING
1.5 LIMITATION
1.6 MARKETS COVERED
2 MARKET SEGMENTATION
2.1 KEY TAKEAWAYS
2.2 ARRIVING AT THE GLOBAL FOOD AND DRINK PACKAGING MARKET SIZE
2.3 VENDOR POSITIONING GRID
2.4 MARKETS COVERED
2.5 GEOGRAPHIC SCOPE
2.6 YEARS CONSIDERED FOR THE STUDY
2.7 RESEARCH METHODOLOGY
2.8 TECHNOLOGY LIFE LINE CURVE
2.9 MULTIVARIATE MODELLING
2.1 PRIMARY INTERVIEWS WITH KEY OPINION LEADERS
2.11 DBMR MARKET POSITION GRID
2.12 MARKET APPLICATION COVERAGE GRID
2.13 DBMR MARKET CHALLENGE MATRIX
2.14 IMPORT AND EXPORT DATA
2.15 SECONDARY SOURCES
2.16 GLOBAL FOOD AND DRINK PACKAGING MARKET : RESEARCH SNAPSHOT
2.17 ASSUMPTIONS
3 MARKET OVERVIEW
3.1 DRIVERS
3.2 RESTRAINTS
3.3 OPPORTUNITIES
3.4 CHALLENGES
4 EXECUTIVE SUMMARY
5 PREMIUM INSIGHTS
5.1 VALUE CHAIN ANALYSIS
5.2 SUPPLY CHAIN ANALYSIS
5.3 IMPORT-EXPORT ANALYSIS
5.4 PORTER’S FIVE FORCES ANALYSIS
5.4.1 BARGAINING POWER OF SUPPLIERS
5.4.2 BARGAINING POWER OF BUYERS/CONSUMERS
5.4.3 THREAT OF NEW ENTRANTS
5.4.4 THREAT OF SUBSTITUTE PRODUCTS
5.4.5 INTENSITY OF COMPETITIVE RIVALRY
5.5 RAW MATERIAL SOURCING ANALYSIS
5.6 OVERVIEW OF TECHNOLOGICAL INNOVATIONS
5.7 INDUSTRY TRENDS AND FUTURE PERSPECTIVE
5.8 GROWTH STRATEGIES ADOPTED BY KEY MARKET PLAYERS
5.9 FACTORS INFLUENCING PURCHASING DECISION OF END-USERS
6 IMPACT OF ECONOMIC SLOW DOWN ON MARKET
6.1 IMPACT ON PRICE
6.2 IMPACT ON SUPPLY CHAIN
6.3 IMPACT ON SHIPMENT
6.4 IMPACT ON COMPANY’S STRATEGIC DECISIONS
7 REGULATORY FRAMEWORK AND GUIDELINES
8 PRICING INDEX (PRICE AT B2B END & PRICES AT FOB)
9 PRODUCTION CAPACITY OF KEY MANUFACTURERES
10 BRAND OUTLOOK
10.1 COMPARATIVE BRAND ANALYSIS
10.2 PRODUCT VS BRAND OVERVIEW
11 GLOBAL FOOD AND DRINK PACKAGING MARKET, BY PRODUCT TYPE, 2022-2031, (USD MILLION) (MILLION UNITS)
11.1 OVERVIEW
11.2 POUCHES
11.2.1 POUCHES, BY TYPE
11.2.1.1. STAND UP POUCHES
11.2.1.2. GUSSETED POUCHES (SIDE GUSSET AND BOTTOM GUSSET)
11.2.1.3. PILLOW POUCHES
11.2.1.4. 3 SIDE SEAL POUCHES
11.2.1.5. OTHERS
11.2.2 POUCHES, BY APPLICATION
11.2.2.1. PLAIN MILK (WHITE MILK)
11.2.2.2. FLAVOURED MILK
11.2.2.3. RTD SMOOTHIES
11.2.2.4. RTD TEAS
11.2.2.5. DRINKABLE YOGURT
11.2.2.6. BUTTERMILK
11.2.2.7. RTD SHAKES
11.2.2.8. RTD COFFEE
11.2.2.9. OTHERS
11.3 TETRA PACKS
11.3.1 TETRA PACKS, BY APPLICATION
11.3.1.1. PLAIN MILK (WHITE MILK)
11.3.1.2. FLAVOURED MILK
11.3.1.3. RTD SMOOTHIES
11.3.1.4. RTD TEAS
11.3.1.5. DRINKABLE YOGURT
11.3.1.6. BUTTERMILK
11.3.1.7. RTD SHAKES
11.3.1.8. RTD COFFEE
11.3.1.9. OTHERS
11.4 BOTTLES
11.4.1 BOTTLES, BY APPLICATION
11.4.1.1. PLAIN MILK (WHITE MILK)
11.4.1.2. FLAVOURED MILK
11.4.1.3. RTD SMOOTHIES
11.4.1.4. RTD TEAS
11.4.1.5. DRINKABLE YOGURT
11.4.1.6. BUTTERMILK
11.4.1.7. RTD SHAKES
11.4.1.8. RTD COFFEE
11.4.1.9. OTHERS
11.5 CANS
11.5.1 CANS, BY APPLICATION
11.5.1.1. PLAIN MILK (WHITE MILK)
11.5.1.2. FLAVOURED MILK
11.5.1.3. RTD SMOOTHIES
11.5.1.4. RTD TEAS
11.5.1.5. DRINKABLE YOGURT
11.5.1.6. BUTTERMILK
11.5.1.7. RTD SHAKES
11.5.1.8. RTD COFFEE
11.5.1.9. OTHERS
11.6 CONVERTED ROLL STOCK
11.7 GUSSETED BOX
11.8 CORRUGATED BOX
11.9 OTHERS (IF ANY)
12 GLOBAL FOOD AND DRINK PACKAGING MARKET, BY PRODUCT CATEGORY, 2022-2031, (USD MILLION)
12.1 OVERVIEW
12.2 RIGID PACKAGING
12.3 FLEXIBLE PACKAGING
13 GLOBAL FOOD AND DRINK PACKAGING MARKET, BY MATERIAL, 2022-2031, (USD MILLION)
13.1 OVERVIEW
13.2 GLASS
13.3 PAPER AND PAPERBOARD
13.4 PLASTIC
13.5 METAL
13.6 OTHERS
14 GLOBAL FOOD AND DRINK PACKAGING MARKET, BY APPLICATION, 2022-2031, (USD MILLION)
14.1 OVERVIEW
14.2 FOOD
14.2.1 DAIRY PRODUCTS
14.2.1.1. MILK
14.2.1.2. YOGURT
14.2.1.3. CHEESE
14.2.1.4. CLARIFIED BUTTER
14.2.1.5. COTTAGE CHEESE
14.2.1.6. OTHERS
14.2.2 POULTRY PRODUCTS
14.2.2.1. CHICKEN
14.2.2.2. TURKEY
14.2.2.3. OTHERS
14.2.3 SEAFOOD
14.2.4 BAKERY AND CONFECTIONERY
14.2.4.1. BREADS AND ROLLS
14.2.4.2. COOKIES AND BISCUITS
14.2.4.3. CAKES AND DESSERTS
14.2.4.4. OTHERS
14.2.5 SNACKS
14.2.5.1. CHIPS
14.2.5.2. PEANUTS
14.2.5.3. POPCORNS
14.2.5.4. OTHERS
14.2.6 OTHERS
14.3 BEVERAGES
14.3.1 ALCOHOLIC BEVERAGES
14.3.2 ALCOHOLIC BEVERGES, BY TYPE
14.3.2.1. BEER
14.3.2.1.1. BEER, BY TYPE
14.3.2.1.1.1 ALE BEER
14.3.2.1.1.1.1. ALE, BY TYPE
A. BLOND ALE
B. BROWN ALE
C. PALE ALE
D. SOUR ALE
14.3.2.1.1.2 LAGER BEER
14.3.2.1.1.3 STOUT BEER
14.3.2.1.1.4 PORTER BEER
14.3.2.1.1.5 WHEAT BEER
14.3.2.1.1.6 PILSNER
14.3.2.1.1.7 OTHERS
14.3.2.2. WINE
14.3.2.2.1. WINE, BY TYPE
14.3.2.2.1.1 RED WINE
14.3.2.2.1.1.1. RED WINE, BY TYPE
A. FULL-BODIED RED WINES
B. MEDIUM-BODIED RED WINES
C. LIGHT-BODIED RED WINES
14.3.2.2.1.2 WHITE WINE
14.3.2.2.1.3 DESSERT WINE
14.3.2.2.1.3.1. LIGHTLY SWEET DESSERT WIN
14.3.2.2.1.3.2. RICHLY SWEET DESSERT WINE
14.3.2.2.1.3.3. WINE
14.3.2.2.1.4 ROSE WINE
14.3.2.2.1.5 OTHERS
14.3.2.2.2. WINE, BY CATEGORY
14.3.2.2.2.1 STILL WINE
14.3.2.2.2.2 SPARKLING WINE
14.3.2.3. WHISKEY
14.3.2.3.1. WHISKEY, BY TYPE
14.3.2.3.1.1 RYE WHISKEY
14.3.2.3.1.2 RYE MALT WHISKEY
14.3.2.3.1.3 MALT WHISKEY
14.3.2.3.1.4 WHEAT WHISLEY
14.3.2.3.1.5 CORN WHISKEY
14.3.2.3.1.6 OTHERS
14.3.2.4. RUM
14.3.2.4.1. RUM, BY TYPE
14.3.2.4.1.1 WHITE RUM
14.3.2.4.1.2 DARK RUM
14.3.2.5. VODKA
14.3.2.6. TEQUILA
14.3.2.6.1. TEQUILA, BY TYPE
14.3.2.6.1.1 TEQUILA BLANCO
14.3.2.6.1.2 TEQUILA JOVEN
14.3.2.6.1.3 TEQUILA REPOSADO
14.3.2.6.1.4 OTHERS
14.3.2.7. GIN
14.3.2.8. BOTTLED COCKTAIL
14.3.2.8.1. BOTTLED COCKTAIL, BY ALCOHOL BY VOLUME % (ABV %)
14.3.2.8.1.1 3% ABV
14.3.2.8.1.2 5% ABV
14.3.2.8.1.3 6% BV
14.3.2.8.1.4 7% ABV
14.3.2.8.1.5 8% ABV
14.3.2.8.1.6 OTHERS
14.3.2.9. MALT-BASED DRINKS
14.3.2.10. OTHERS (IF ANY)
14.3.3 NON-ALCOHOLIC BEVERAGES
14.3.3.1. NON-ALCOHOLIC BEVERGES, BY TYPE
14.3.3.1.1. RTD TEA
14.3.3.1.1.1 RTD TEA, BY TYPE
14.3.3.1.1.1.1. GREEN TEA
14.3.3.1.1.1.2. BLACK TEA
14.3.3.1.1.1.3. MATCHA
14.3.3.1.1.1.4. HERBAL TEA
14.3.3.1.1.1.5. FERMENTED TEA
14.3.3.1.1.1.6. OTHERS
14.3.3.1.2. RTD COFFEE
14.3.3.1.3. JUICE BASED BEVERAGES
14.3.3.1.4. CARBONATED BEVERAGES
14.3.3.1.4.1 DIET DRINKS
14.3.3.1.4.2 FRUIT FLAVORED CARBONATES
14.3.3.1.4.3 OTHERS
14.3.3.1.5. SPORTS & ENERGY BEVERAGE
14.3.3.1.5.1 SPORTS BEVERAGE, BY TYPE
14.3.3.1.5.1.1. ISOTONIC
14.3.3.1.5.1.2. HYPERTONIC
14.3.3.1.5.1.3. HYPOTONIC
14.3.3.1.5.2 ENERGY BEVERAGE, BY TYPE
14.3.3.1.5.2.1. ENERGY DRIN BEVERAGE K, BY TYPE
A. STILL
B. CARBONATED
14.3.3.1.6. CBD INFUSED RTD BEVERGES
14.3.3.1.7. PLANT-BASED MILK BEVERAGES
14.3.3.1.7.1 PLANT-BASED MILK, BY TYPE
14.3.3.1.7.1.1. SOY
14.3.3.1.7.1.2. ALMOND
14.3.3.1.7.1.3. CASHEW
14.3.3.1.7.1.4. COCONUT
14.3.3.1.7.1.5. PEA
14.3.3.1.7.1.6. OATS
14.3.3.1.7.1.7. OTHERS
14.3.3.1.8. WHEY PROTEIN BEVERAGES
14.3.3.1.9. PROTEIN SHAKES
14.3.3.1.10. OTHERS
15 GLOBAL FOOD AND DRINK PACKAGING MARKET, BY DISTRIBUTION CHANNEL, 2022-2031, (USD MILLION)
15.1 OVERVIEW
15.2 DIRECT
15.3 INDIRECT
16 GLOBAL FOOD AND DRINK PACKAGING MARKET, BY GEOGRAPHY, 2022-2031 (USD MILLION)
Global FOOD AND DRINK PACKAGINGMarket, (ALL SEGMENTATION PROVIDED ABOVE IS REPRESENTED IN THIS CHAPTER BY COUNTRY)
16.1 NORTH AMERICA
16.1.1 U.S.
16.1.2 CANADA
16.1.3 MEXICO
16.2 EUROPE
16.2.1 GERMANY
16.2.2 U.K.
16.2.3 ITALY
16.2.4 FRANCE
16.2.5 SPAIN
16.2.6 SWITZERLAND
16.2.7 RUSSIA
16.2.8 TURKEY
16.2.9 BELGIUM
16.2.10 NETHERLANDS
16.2.11 SWITZERLAND
16.2.12 DENMARK
16.2.13 NORWAY
16.2.14 FINLAND
16.2.15 SWEDEN
16.2.16 REST OF EUROPE
16.3 ASIA-PACIFIC
16.3.1 JAPAN
16.3.2 CHINA
16.3.3 SOUTH KOREA
16.3.4 INDIA
16.3.5 SINGAPORE
16.3.6 THAILAND
16.3.7 INDONESIA
16.3.8 MALAYSIA
16.3.9 PHILIPPINES
16.3.10 AUSTRALIA
16.3.11 NEW ZEALAND
16.3.12 HONG KONG
16.3.13 TAIWAN
16.3.14 REST OF ASIA-PACIFIC
16.4 SOUTH AMERICA
16.4.1 BRAZIL
16.4.2 ARGENTINA
16.4.3 REST OF SOUTH AMERICA
16.5 MIDDLE EAST AND AFRICA
16.5.1 SOUTH AFRICA
16.5.2 EGYPT
16.5.3 SAUDI ARABIA
16.5.4 UNITED ARAB EMIRATES
16.5.5 ISRAEL
16.5.6 BAHRAIN
16.5.7 KUWAIT
16.5.8 OMAN
16.5.9 QATAR
16.5.10 REST OF MIDDLE EAST AND AFRICA
17 GLOBAL FOOD AND DRINK PACKAGING MARKET, COMPANY LANDSCAPE
17.1 COMPANY SHARE ANALYSIS: GLOBAL
17.2 COMPANY SHARE ANALYSIS: NORTH AMERICA
17.3 COMPANY SHARE ANALYSIS: EUROPE
17.4 COMPANY SHARE ANALYSIS: ASIA-PACIFIC
17.5 MERGERS & ACQUISITIONS
17.6 NEW PRODUCT DEVELOPMENT & APPROVALS
17.7 EXPANSIONS
17.8 PARTNERSHIP AND OTHER STRATEGIC DEVELOPMENTS
18 SWOT ANALYSIS
19 GLOBAL FOOD AND DRINK PACKAGING MARKET – COMPANY PROFILE
19.1 AMCOR PLC
19.1.1 COMPANY SNAPSHOT
19.1.2 PRODUCT PORTFOLIO
19.1.3 PRODUCTION CAPACITY OVERVIEW
19.1.4 SWOT ANALYSIS
19.1.5 REVENUE ANALYSIS
19.1.6 RECENT UPDATES
19.2 BALL CORPORATION
19.2.1 COMPANY SNAPSHOT
19.2.2 PRODUCT PORTFOLIO
19.2.3 PRODUCTION CAPACITY OVERVIEW
19.2.4 SWOT ANALYSIS
19.2.5 REVENUE ANALYSIS
19.2.6 RECENT UPDATES
19.3 BERRY GLOBAL INC
19.3.1 COMPANY SNAPSHOT
19.3.2 PRODUCT PORTFOLIO
19.3.3 PRODUCTION CAPACITY OVERVIEW
19.3.4 SWOT ANALYSIS
19.3.5 REVENUE ANALYSIS
19.3.6 RECENT UPDATES
19.4 TETRA PAK
19.4.1 COMPANY SNAPSHOT
19.4.2 PRODUCT PORTFOLIO
19.4.3 PRODUCTION CAPACITY OVERVIEW
19.4.4 SWOT ANALYSIS
19.4.5 REVENUE ANALYSIS
19.4.6 RECENT UPDATES
19.5 INTERNATIONAL PAPER
19.5.1 COMPANY SNAPSHOT
19.5.2 PRODUCT PORTFOLIO
19.5.3 PRODUCTION CAPACITY OVERVIEW
19.5.4 SWOT ANALYSIS
19.5.5 REVENUE ANALYSIS
19.5.6 RECENT UPDATES
19.6 WESTROCK COMPANY
19.6.1 COMPANY SNAPSHOT
19.6.2 PRODUCT PORTFOLIO
19.6.3 PRODUCTION CAPACITY OVERVIEW
19.6.4 SWOT ANALYSIS
19.6.5 REVENUE ANALYSIS
19.6.6 RECENT UPDATES
19.7 MONDI
19.7.1 COMPANY SNAPSHOT
19.7.2 PRODUCT PORTFOLIO
19.7.3 PRODUCTION CAPACITY OVERVIEW
19.7.4 SWOT ANALYSIS
19.7.5 REVENUE ANALYSIS
19.7.6 RECENT UPDATES
19.8 NAMPAK LTD
19.8.1 COMPANY SNAPSHOT
19.8.2 PRODUCT PORTFOLIO
19.8.3 PRODUCTION CAPACITY OVERVIEW
19.8.4 SWOT ANALYSIS
19.8.5 REVENUE ANALYSIS
19.8.6 RECENT UPDATES
19.9 ARDAGH GROUP
19.9.1 COMPANY SNAPSHOT
19.9.2 PRODUCT PORTFOLIO
19.9.3 PRODUCTION CAPACITY OVERVIEW
19.9.4 SWOT ANALYSIS
19.9.5 REVENUE ANALYSIS
19.9.6 RECENT UPDATES
19.1 PACTIV EVERGREEN INC.
19.10.1 COMPANY SNAPSHOT
19.10.2 PRODUCT PORTFOLIO
19.10.3 PRODUCTION CAPACITY OVERVIEW
19.10.4 SWOT ANALYSIS
19.10.5 REVENUE ANALYSIS
19.10.6 RECENT UPDATES
19.11 INDUSTRIAL DEVELOPMENT COMPANY SAL
19.11.1 COMPANY SNAPSHOT
19.11.2 PRODUCT PORTFOLIO
19.11.3 PRODUCTION CAPACITY OVERVIEW
19.11.4 SWOT ANALYSIS
19.11.5 REVENUE ANALYSIS
19.11.6 RECENT UPDATES
19.12 ELOPAK
19.12.1 COMPANY SNAPSHOT
19.12.2 PRODUCT PORTFOLIO
19.12.3 PRODUCTION CAPACITY OVERVIEW
19.12.4 SWOT ANALYSIS
19.12.5 REVENUE ANALYSIS
19.12.6 RECENT UPDATES
19.13 CLONDALKIN GROUP
19.13.1 COMPANY SNAPSHOT
19.13.2 PRODUCT PORTFOLIO
19.13.3 PRODUCTION CAPACITY OVERVIEW
19.13.4 SWOT ANALYSIS
19.13.5 REVENUE ANALYSIS
19.13.6 RECENT UPDATES
19.14 CKS PACKAGING, INC
19.14.1 COMPANY SNAPSHOT
19.14.2 PRODUCT PORTFOLIO
19.14.3 PRODUCTION CAPACITY OVERVIEW
19.14.4 SWOT ANALYSIS
19.14.5 REVENUE ANALYSIS
19.14.6 RECENT UPDATES
19.15 COVERIS
19.15.1 COMPANY SNAPSHOT
19.15.2 PRODUCT PORTFOLIO
19.15.3 PRODUCTION CAPACITY OVERVIEW
19.15.4 SWOT ANALYSIS
19.15.5 REVENUE ANALYSIS
19.15.6 RECENT UPDATES
19.16 GRAHAM PACKAGING COMPANY
19.16.1 COMPANY SNAPSHOT
19.16.2 PRODUCT PORTFOLIO
19.16.3 PRODUCTION CAPACITY OVERVIEW
19.16.4 SWOT ANALYSIS
19.16.5 REVENUE ANALYSIS
19.16.6 RECENT UPDATES
19.17 CROWN
19.17.1 COMPANY SNAPSHOT
19.17.2 PRODUCT PORTFOLIO
19.17.3 PRODUCTION CAPACITY OVERVIEW
19.17.4 SWOT ANALYSIS
19.17.5 REVENUE ANALYSIS
19.17.6 RECENT UPDATES
19.18 APTARGROUP, INC
19.18.1 COMPANY SNAPSHOT
19.18.2 PRODUCT PORTFOLIO
19.18.3 PRODUCTION CAPACITY OVERVIEW
19.18.4 SWOT ANALYSIS
19.18.5 REVENUE ANALYSIS
19.18.6 RECENT UPDATES
19.19 REFRESCO GROUP
19.19.1 COMPANY SNAPSHOT
19.19.2 PRODUCT PORTFOLIO
19.19.3 PRODUCTION CAPACITY OVERVIEW
19.19.4 SWOT ANALYSIS
19.19.5 REVENUE ANALYSIS
19.19.6 RECENT UPDATES
19.2 PACIFIC CAN CHINA HOLDINGS LIMITED
19.20.1 COMPANY SNAPSHOT
19.20.2 PRODUCT PORTFOLIO
19.20.3 PRODUCTION CAPACITY OVERVIEW
19.20.4 SWOT ANALYSIS
19.20.5 REVENUE ANALYSIS
19.20.6 RECENT UPDATES
19.21 TOKO SEIKAN GROUP HOLDING
19.21.1 COMPANY SNAPSHOT
19.21.2 PRODUCT PORTFOLIO
19.21.3 PRODUCTION CAPACITY OVERVIEW
19.21.4 SWOT ANALYSIS
19.21.5 REVENUE ANALYSIS
19.21.6 RECENT UPDATES
19.22 STORA ENSO
19.22.1 COMPANY SNAPSHOT
19.22.2 PRODUCT PORTFOLIO
19.22.3 PRODUCTION CAPACITY OVERVIEW
19.22.4 SWOT ANALYSIS
19.22.5 REVENUE ANALYSIS
19.22.6 RECENT UPDATES
19.23 SONOCO PRODUCTS COMPANY
19.23.1 COMPANY SNAPSHOT
19.23.2 PRODUCT PORTFOLIO
19.23.3 PRODUCTION CAPACITY OVERVIEW
19.23.4 SWOT ANALYSIS
19.23.5 REVENUE ANALYSIS
19.23.6 RECENT UPDATES
19.24 CAN-PACK S.A
19.24.1 COMPANY SNAPSHOT
19.24.2 PRODUCT PORTFOLIO
19.24.3 PRODUCTION CAPACITY OVERVIEW
19.24.4 SWOT ANALYSIS
19.24.5 REVENUE ANALYSIS
19.24.6 RECENT UPDATES
20 CONCLUSION
21 QUESTIONNAIRE
22 RELATED REPORTS
23 ABOUT DATA BRIDGE MARKET RESEARCH
Global Food Drink Packaging Market, Supply Chain Analysis and Ecosystem Framework
To support market growth and help clients navigate the impact of geopolitical shifts, DBMR has integrated in-depth supply chain analysis into its Global Food Drink Packaging Market research reports. This addition empowers clients to respond effectively to global changes affecting their industries. The supply chain analysis section includes detailed insights such as Global Food Drink Packaging Market consumption and production by country, price trend analysis, the impact of tariffs and geopolitical developments, and import and export trends by country and HSN code. It also highlights major suppliers with data on production capacity and company profiles, as well as key importers and exporters. In addition to research, DBMR offers specialized supply chain consulting services backed by over a decade of experience, providing solutions like supplier discovery, supplier risk assessment, price trend analysis, impact evaluation of inflation and trade route changes, and comprehensive market trend analysis.
Data collection and base year analysis are done using data collection modules with large sample sizes. The stage includes obtaining market information or related data through various sources and strategies. It includes examining and planning all the data acquired from the past in advance. It likewise envelops the examination of information inconsistencies seen across different information sources. The market data is analysed and estimated using market statistical and coherent models. Also, market share analysis and key trend analysis are the major success factors in the market report. To know more, please request an analyst call or drop down your inquiry.
The key research methodology used by DBMR research team is data triangulation which involves data mining, analysis of the impact of data variables on the market and primary (industry expert) validation. Data models include Vendor Positioning Grid, Market Time Line Analysis, Market Overview and Guide, Company Positioning Grid, Patent Analysis, Pricing Analysis, Company Market Share Analysis, Standards of Measurement, Global versus Regional and Vendor Share Analysis. To know more about the research methodology, drop in an inquiry to speak to our industry experts.
Data Bridge Market Research is a leader in advanced formative research. We take pride in servicing our existing and new customers with data and analysis that match and suits their goal. The report can be customized to include price trend analysis of target brands understanding the market for additional countries (ask for the list of countries), clinical trial results data, literature review, refurbished market and product base analysis. Market analysis of target competitors can be analyzed from technology-based analysis to market portfolio strategies. We can add as many competitors that you require data about in the format and data style you are looking for. Our team of analysts can also provide you data in crude raw excel files pivot tables (Fact book) or can assist you in creating presentations from the data sets available in the report.


