
Gas Cylinder Market Analysis and Insights
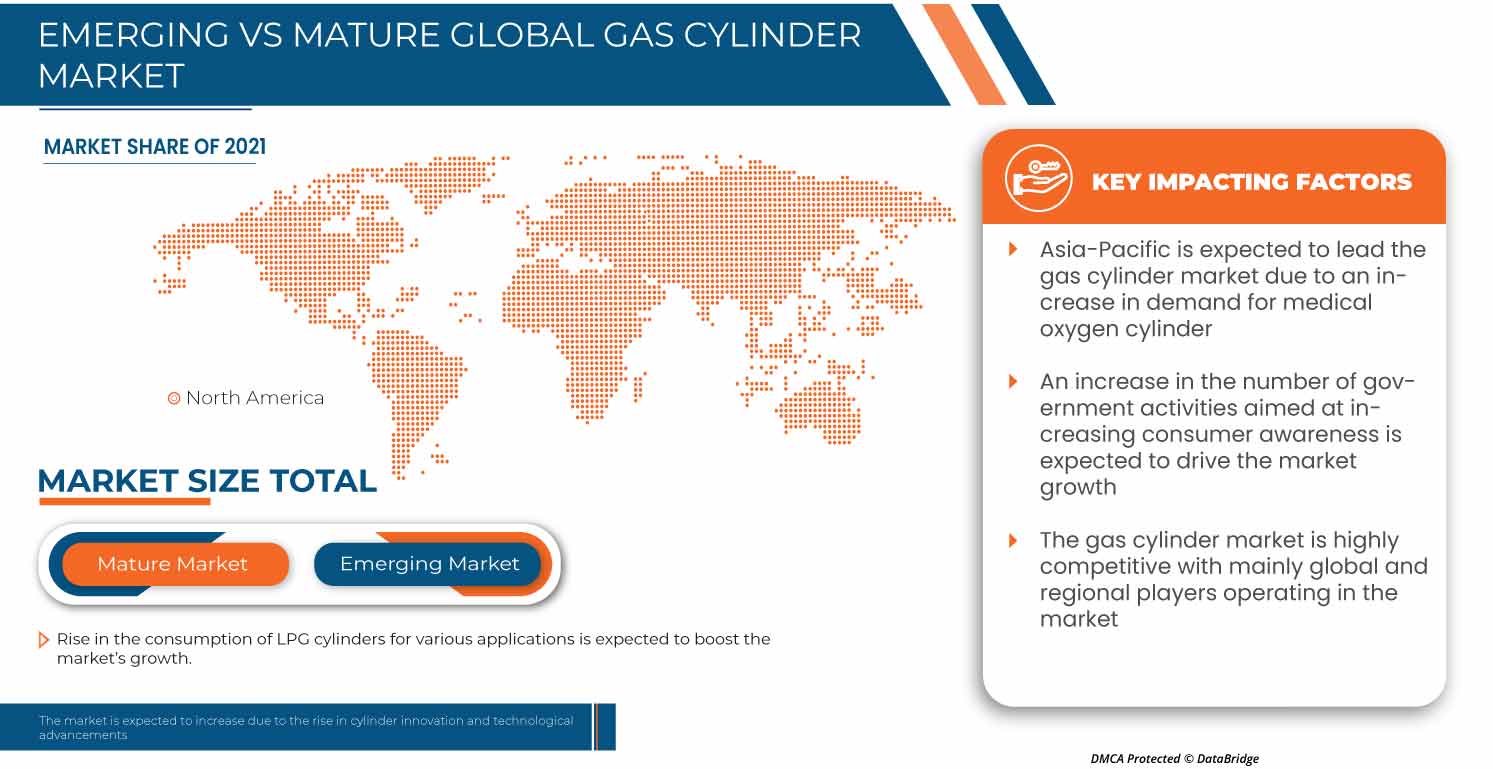
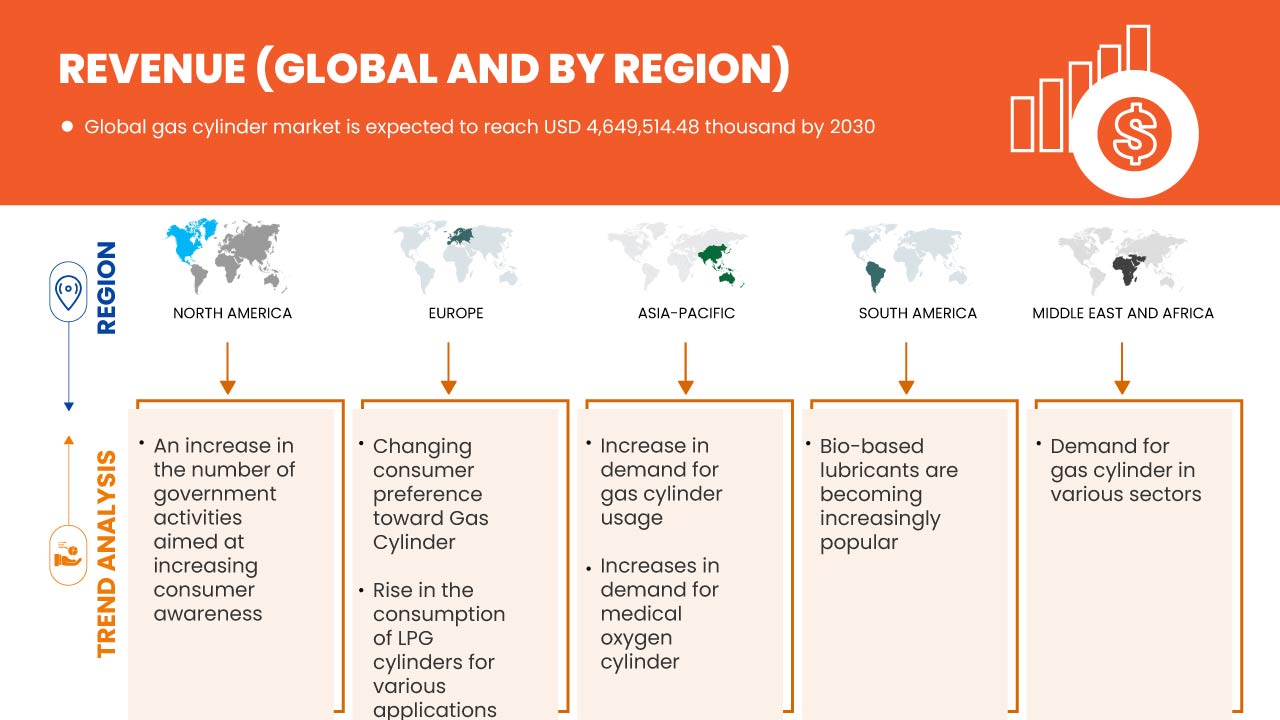
An increase in demand for medical oxygen cylinders is an important driver for the global gas cylinder market. The rise in the consumption of L.P.G. cylinders for various applications is gaining prominence. An increase in the number of government activities aimed at increasing consumer awareness and demand for gas cylinders in various sectors are expected to propel the growth of the global gas cylinder market.
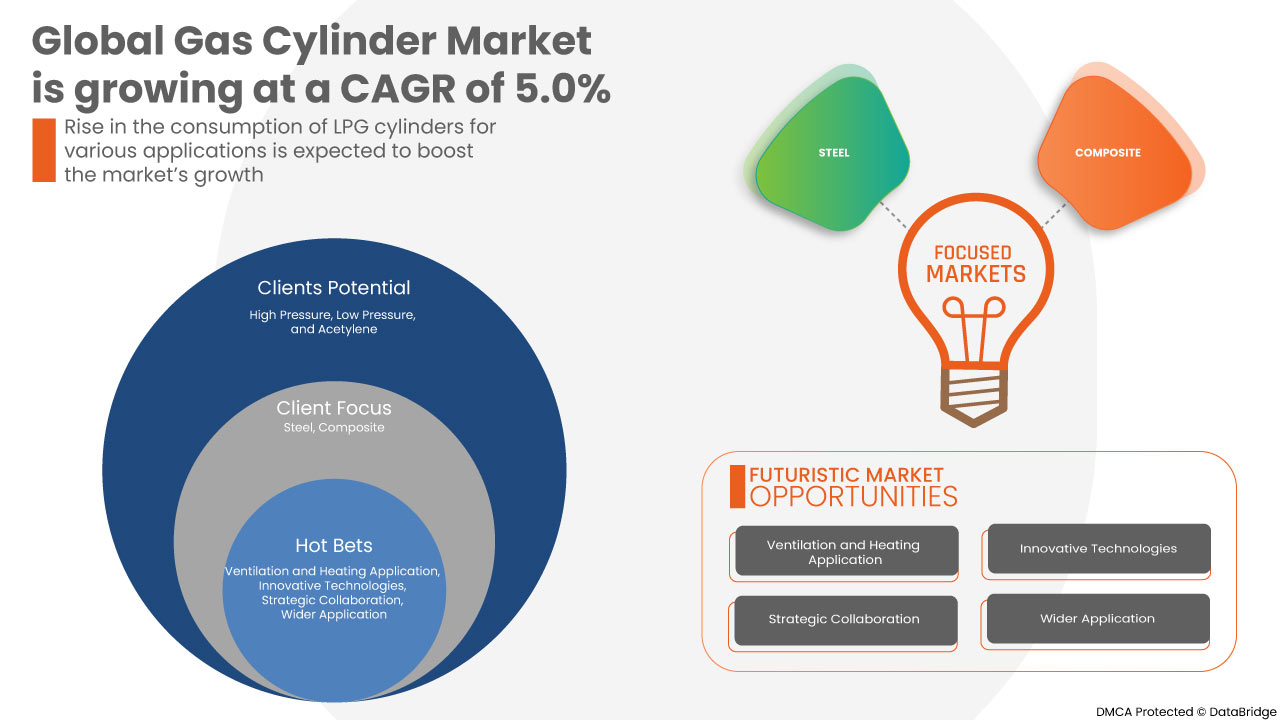
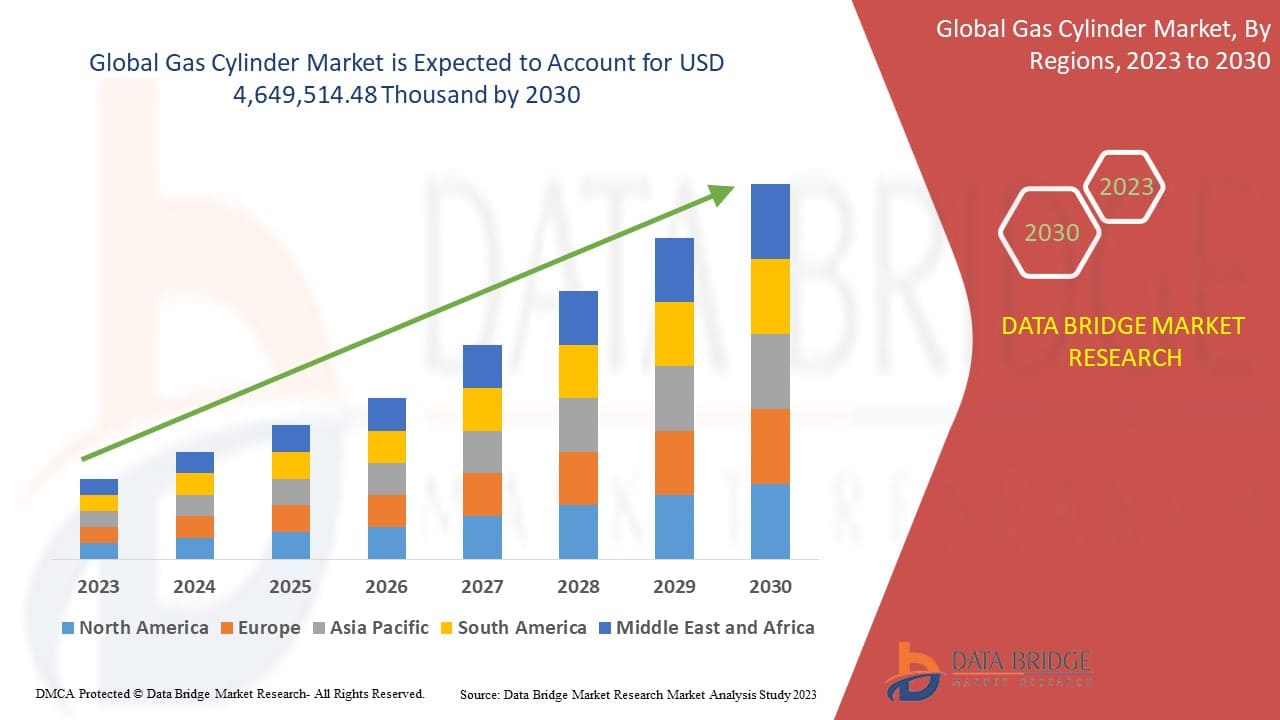
The gas cylinder market is expected to gain significant growth in the forecast period of 2023 to 2030. Data Bridge Market Research analyses that the market is growing with a CAGR of 5.0% in the forecast period of 2023 to 2030 and is expected to reach USD 4,649,514.48 thousand by 2030.
|
Report Metric |
Details |
|
Forecast Period |
2023 to 2030 |
|
Base Year |
2022 |
|
Historic Years |
2021 (Customizable to 2020- 2015) |
|
Quantitative Units |
Revenue in USD thousand |
|
Segments Covered |
By Material Type (Steel, Composite, And Others), Product (Low Pressure, High Pressure, Acetylene and Others), Wrap Type (Wrap Less, Glass Fiber, Aramid Fiber, Carbon Fiber And Others), Gas (Inert Gases, Flammable Gases, Toxic Gases, Pyrophoric Gases, Oxidizers And Others), Application (Kitchen And Domestic, Processing Industries, Medical, Transportation And Others |
|
Countries Covered |
U.S., Canada and Mexico in North America, Germany, France, U.K., Netherlands, Switzerland, Belgium, Russia, Italy, Spain, Turkey, Rest of Europe in Europe, China, Japan, India, South Korea, Singapore, Malaysia, Australia & New Zealand, Thailand, Indonesia, Hong Kong, Philippines, Taiwan, Rest of Asia-Pacific (APAC) in the Asia-Pacific (APAC), Saudi Arabia, United Arab Emirates, South Africa, Egypt, Israel, Rest of Middle East and Africa (MEA) as a part of Middle East and Africa (MEA), Brazil, Argentina and Rest of South America as part of South America |
|
Market Players Covered |
3M, Aygaz A.Ş., FABER INDUSTRIE SPA, Hexagon Ragasco AS, Luxfer Gas Cylinders, Worthington Industries Inc, Beijing Tianhai Industry Co., Ltd., Drägerwerk AG & Co. KGaA, EKC, Linde plc, Time Technoplast Ltd., MS GROUP, Welz Gas Cylinder GmbH, and Zhejiang Tianlong cylinder co., L.T.D. |
Market Definition
A gas cylinder is a pressure vessel that stores gases at higher than atmospheric pressures. High-pressure gas cylinders, also known as bottles. Depending on the physical qualities of the item, the stored components inside the cylinder may be in a supercritical fluid, compressed gas, Vapour over liquid, or dissolved in a substrate material. The valve and connecting connection are positioned at the top of a normal gas cylinder design, extending and standing upright on a flattened bottom end. The increasing focus of renowned manufacturers on developing unique cylinder designs that are capable of improving safety measures, optimizing handling and storage abilities, and are lightweight is anticipated to drive the market. The increased use of gas cylinders in various applications such as water treatment, soldering, beverage dispensing, medical purposes, heating and cooking, and fire extinguishing is expected to increase demand worldwide.
Gas Cylinder Market Dynamics
Drivers
- Increase in the demand of medical oxygen cylinder
Medical care providers frequently use oxygen gas cylinders for therapeutic and diagnostic reasons. Medical oxygen gas systems, such as oxygen, concentrators, and compressed oxygen gas cylinders, are widely used in homecare settings and are typically selected by elderly patients with mobility issues and require a consistent oxygen supply.
The global increase in industrialization has had a negative impact on the overall quality of breathing air. Because of fast growth and increased pollution, the air quality index (AQI) has been elevated, increasing the prevalence of respiratory disorders. Patients suffering from chronic respiratory diseases (CRDs) such as Chronic Obstructive Pulmonary Disease (COPD) require oxygen supplementation to improve their quality of life. Pollution, cigarette smoke, occupational chemicals and dust, and other factors can contribute to Chronic Rrespiratory Diseases (CRDs). In recent years, there has been an increase in the senior population with chronic conditions requiring ongoing respiratory assistance.
- Rise in the consumption of LPG cylinders for various application
Liquefied petroleum gas (LPG) is a fuel that burns cleanly, is sustainable, and is efficient. Because it is a sustainable, low-carbon, efficient, and innovative energy source. It provides advantages to customers. Industry and the environment LPG is less expensive than other traditional fuels since most of its energy is turned into heat, and it can be transported, stored, and utilized in a wide range of applications, including residential, commercial, agriculture, industrial, and auto gas.
LPG is a gas, but it is frequently kept under pressure, which converts it to a liquid. One of the major advantages of LPG over other energy sources is its ease of transportation. It has a better heating value and contains no Sulphur. Because LPG burns regularly, it is more dependable than other kinds of energy. LPG is more ecologically friendly than other energy sources. Though all energy sources emit carbon dioxide, when compared to oil, LPG emits just 81% of the carbon dioxide that oil produces. When compared to coal, another energy source, LPG emits just 70% of the carbon dioxide.
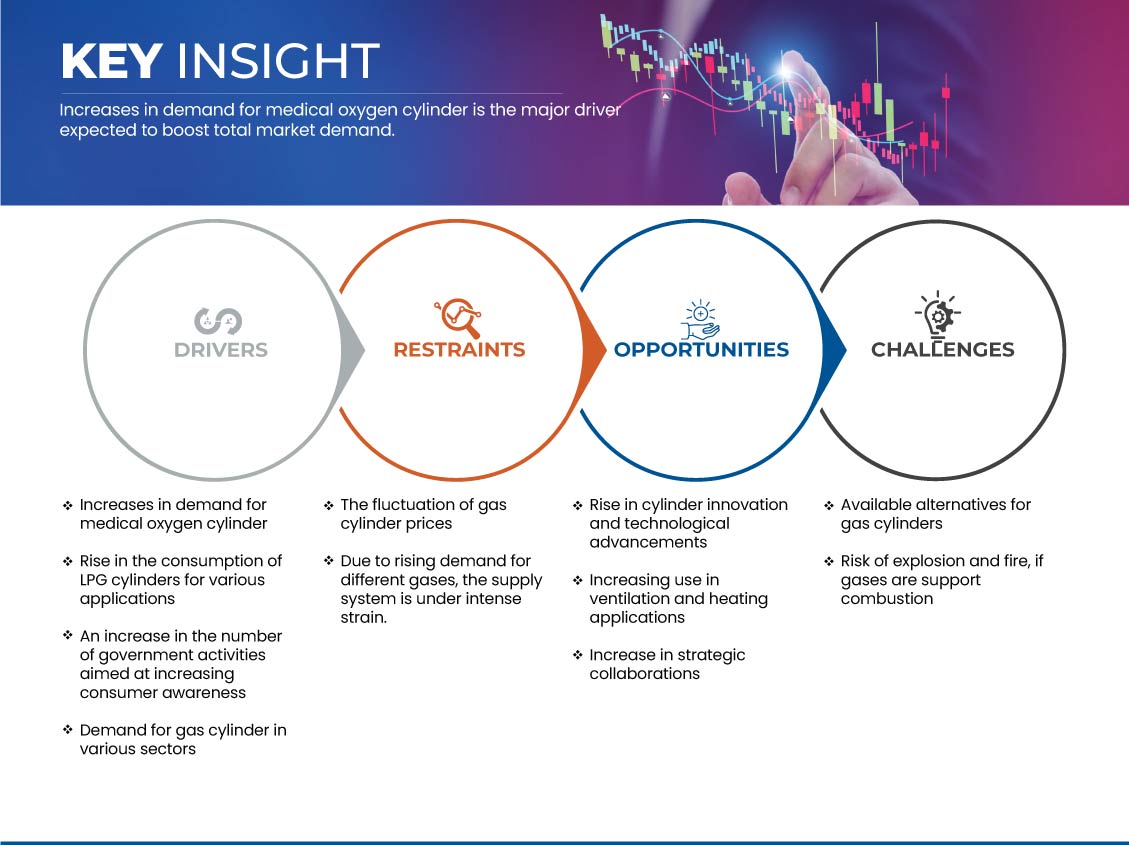
Opportunities
- Rise in cylinder innovation and technological advancements
Gas cylinder manufacturers are constantly improving their cylinder packages to satisfy changing market demands. Higher pressures, digital displays, and newly engineered guards and valves allow for more gas, cylinder intelligence, and simpler transportation without compromising safety. The transportation of high-value gases is crucial, increasing the demand for secure, controlled gas cylinders. Advances in the compression of volatile and nonreactive gases have affected the production of gas cylinders. Enhanced safety and innovative cylinder designs have improved the handling and storage capabilities of gas cylinders. As a result of this rise in cylinder innovation and technological advancements are expected to provide a market growth opportunity for the gas cylinder market. As a result of this rise in cylinder innovation and technological advancements are expected to provide a market growth opportunity for the gas cylinder market.
Restraints/Challenges
- The fluctuations of gas cylinder prices
Gas cylinders are made up of materials like steel, composite, and others. Steel materials are majorly used in the manufacturing of gas cylinders because of their better anti-stress capability, which saves energy during production, increases strength, anl is 100% recyclable at the end of the ' 'product's life. The composite cylinder is made from aluminum alloy, and the Composite cylinder is a three-layer cylinder made up of a blow-molded HDPE inner liner, covered with a composite layer of polymer-wrapped fiberglass, and fitted with a HDPE outer jacket. The prices of these materials are fluctuating in recent years, which makes gas cylinder prices also fluctuate.
Iron ore and scrap metal are the 2 major raw materials used in the steelmaking process. That is to say, steel production cost is directly related to the prices and availability of iron ore and scrap. For Instance, for the past few months, the continuously surging prices of iron ore from Australia (the largest supplier of iron ore in global trade) have been directly reflected in the recent spike in the steel market. Meanwhile, the availability of scrap metal used for recycled steel production can also affect costs.
- Due to rising demand for different gases, the supply chain system is under intense strain
The globe is in a supply chain crisis, with firms in every industry facing significant hurdles. A global shipping problem has resulted from the epidemic and its global reaction. Demand is outstripping supply, sea freight prices are at an all-time high, and container capacity is extremely limited. Unfortunately, there is no quick answer, and it appears that high shipping charges, lengthier lead times, and capacity bottlenecks will remain in the first half of 2022. Shipping businesses have predicted that things would start to improve in the second part of the year.
The major raw materials needed to fabricate gas cylinders posed another hurdle to the global supply chain. The epidemic has caused major disruption worldwide in mining and industry, resulting in a global scarcity of aluminum. As a result, aluminum prices have doubled, and cylinder makers can't acquire enough aluminum to boost manufacturing capacity, while mounting demand and supply restrictions have driven carbon fibre costs to record highs. The Russian invasion of Ukraine has unintended consequences, such as higher gasoline prices and flights being rerouted to avoid Russian airspace.
Recent Development
- In September 2022, Worthington Industries' new plant serving the hydrogen mobility market was completed in under two years. The new plant will produce Type III and IV composite pressure cylinders. The cylinders are lightweight and made of metallic or polymeric liners with carbon fiber reinforcement that can withstand high pressures. Applications include onboard fueling systems for cars, trucks, buses, trains, and ships, as well as storage and transport containers for compressed hydrogen and compressed natural gas (CNG)
- In March 2021, Luxfer Gas Cylinders announced the acquisition of Structural Composites Industries, a North American composite cylinder manufacturer. The acquisition strengthens Luxfer's composite cylinder offering and aligns with recent investments to further enhance their alternative fuels capability to address the CNG and Hydrogen market growth opportunities, as well as broadening our portfolio in aerospace, life support and other markets
Gas Cylinder Market Scope
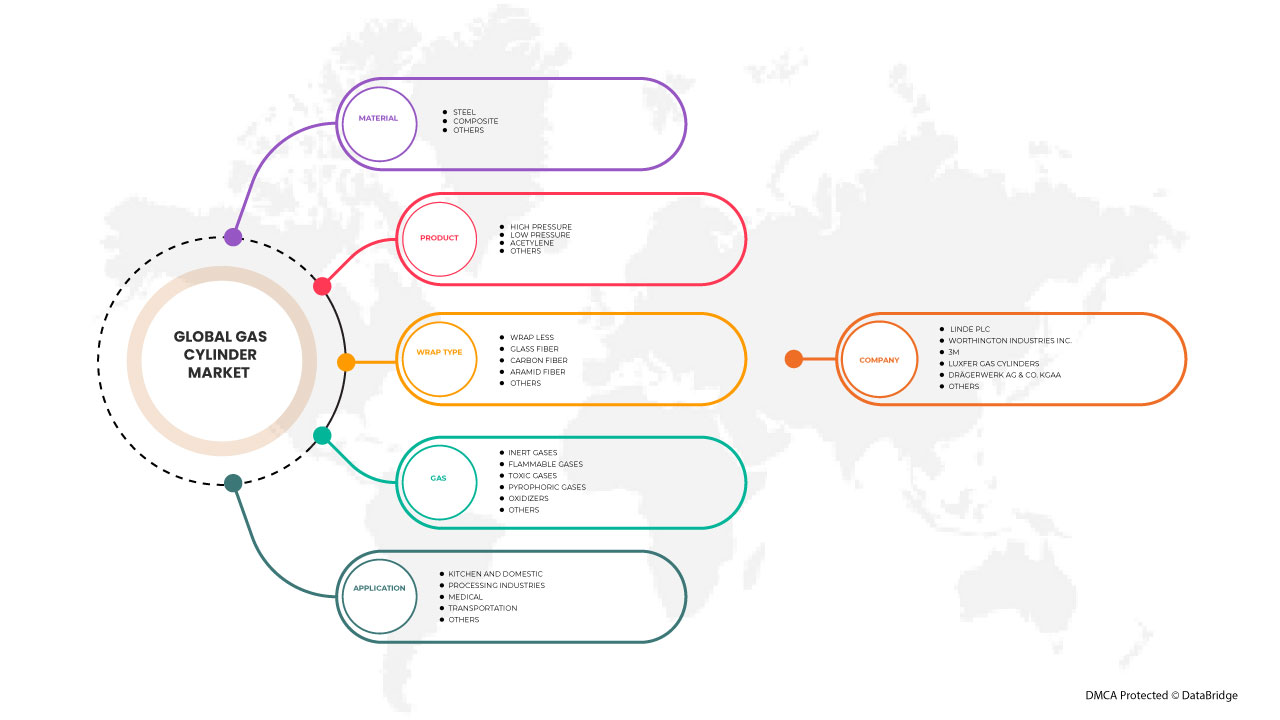
The gas cylinder market is categorized based on material, product, wrap type, gas and application. The growth amongst five segments will help you analyze major growth segments in the industries and provide the users with a valuable market overview and market insights to make strategic decisions to identify core market applications.
Material
- Steel
- Composite
- Others
On the basis of material, the gas cylinder market is segmented into steel, composite, and others.
Product
- High pressure
- Low pressure
- Acetylene
On the basis of product, the gas cylinder market is is segmented intohigh pressure, low pressure, and acetylene.
Wraps
- Wrap less
- Glass fiber
- Aramid fiber
- Carbon fiber
- Others
On the basis of wrap type, the gas cylinder market is segmented into wrap less, glass fiber, aramid fiber, carbon fiber, and others.
Gas
- Flammable gases
- Inert gases
- Toxic gases
- Pyrophoric gases
- Oxidizers
- Others
On the basis of gas, the gas cylinder market is segmented into inert gases, flammable gases, toxic gases, pyrophoric gases, oxidizers, and others.
Application
- Kitchen and domestic
- Processing industries
- Medical
- Transportation
- Others
On the basis of application, the gas cylinder market is segmented into kitchen and domestic, processing industries, medical, transportation, and others.
Gas Cylinder Market Regional Analysis/Insights
The gas cylinder market is segmented on the basis of material, product, wrap type, gas and application.
The major countries covered in the gas cylinder market report are the U.S., Canada and Mexico in North America, Germany, France, U.K., Netherlands, Switzerland, Belgium, Russia, Italy, Spain, Turkey, Rest of Europe in Europe, China, Japan, India, South Korea, Singapore, Malaysia, Australia & New Zealand, Thailand, Indonesia, Hong Kong, Philippines, Taiwan, Rest of Asia-Pacific (APAC) in the Asia-Pacific (APAC), Saudi Arabia, United Arab Emirates, South Africa, Egypt, Israel, Rest of Middle East and Africa (MEA) as a part of Middle East and Africa (MEA), Brazil, Argentina and Rest of South America as part of South America.
In Asia-Pacific, the China is expected to dominate the market due to an increase in demand for medical oxygen cylinders in the region. The U.S. is expected to dominate the North American gas cylinder market due to the increase in the number of government activities aimed at increasing consumer awareness.
The country section of the report also provides individual market-impacting factors and changes in market regulation that impact the current and future trends of the market. Data point downstream and upstream value chain analysis, technical trends porter's five forces analysis, and case studies are some of the pointers used to forecast the market scenario for individual countries. Also, the presence and availability of global brands and their challenges faced due to large or scarce competition from local and domestic brands, the impact of domestic tariffs, and trade routes are considered while providing forecast analysis of the country data.
Competitive Landscape and Gas Cylinder Market Share Analysis
The gas cylinder market competitive landscape provides details by competitors. Details included are company overview, company financials, revenue generated, market potential, investment in research and development, new market initiatives, production sites and facilities, company strengths and weaknesses, product launch, product trials pipelines, product approvals, patents, product width and breadth, application dominance, technology lifeline curve. The above data points provided are only related to the companies’ focus related to the gas cylinder market.
Some of the major market players engaged in the global gas cylinder market are 3M, Aygaz A.Ş., FABER INDUSTRIE SPA, Hexagon Ragasco AS, Luxfer Gas Cylinders, Worthington Industries Inc, Beijing Tianhai Industry Co., Ltd., Drägerwerk AG & Co. KGaA, EKC, Linde plc, Time Technoplast Ltd., MS GROUP, Welz Gas Cylinder GmbH, and Zhejiang Tianlong cylinder co., L.T.D. among others.
SKU-

- Interactive Data Analysis Dashboard
- Company Analysis Dashboard for high growth potential opportunities
- Research Analyst Access for customization & queries
- Competitor Analysis with Interactive dashboard
- Latest News, Updates & Trend analysis
- Harness the Power of Benchmark Analysis for Comprehensive Competitor Tracking
Table of Content
1 INTRODUCTION
1.1 OBJECTIVES OF THE STUDY
1.2 MARKET DEFINITION
1.3 OVERVIEW OF THE GLOBAL GAS CYLINDER MARKET
1.4 LIMITATION
1.5 MARKETS COVERED
2 MARKET SEGMENTATION
2.1 MARKETS COVERED
2.2 GEOGRAPHICAL SCOPE
2.3 YEARS CONSIDERED FOR THE STUDY
2.4 CURRENCY AND PRICING
2.5 DBMR TRIPOD DATA VALIDATION MODEL
2.6 PRODUCT LIFE LINE CURVE
2.7 MULTIVARIATE MODELING
2.8 PRIMARY INTERVIEWS WITH KEY OPINION LEADERS
2.9 DBMR MARKET POSITION GRID
2.1 DBMR MARKET CHALLENGE MATRIX
2.11 DBMR VENDOR SHARE ANALYSIS
2.12 SECONDARY SOURCES
2.13 ASSUMPTIONS
3 EXECUTIVE SUMMARY
4 PREMIUM INSIGHTS
5 MARKET OVERVIEW
5.1 DRIVERS
5.1.1 INCREASE IN THE DEMAND FOR MEDICAL OXYGEN CYLINDER
5.1.2 RISE IN THE CONSUMPTION OF LPG CYLINDERS FOR VARIOUS APPLICATIONS
5.1.3 AN INCREASE IN THE NUMBER OF GOVERNMENT ACTIVITIES AIMED AT INCREASING CONSUMER AWARENESS
5.1.4 DEMAND FOR GAS CYLINDERS IN VARIOUS SECTORS
5.2 RESTRAINTS
5.2.1 THE FLUCTUATIONS IN GAS CYLINDER PRICES
5.2.2 DUE TO THE RISING DEMAND FOR DIFFERENT GASES, THE SUPPLY CHAIN SYSTEM IS UNDER INTENSE STRAIN
5.3 OPPORTUNITIES
5.3.1 RISE IN CYLINDER INNOVATION AND TECHNOLOGICAL ADVANCEMENTS
5.3.2 INCREASING USE IN VENTILATION AND HEATING APPLICATIONS
5.3.3 INCREASE IN STRATEGIC COLLABORATIONS
5.4 CHALLENGES
5.4.1 AVAILABLE ALTERNATIVES FOR GAS CYLINDERS
5.4.2 RISK OF EXPLOSION AND FIRE, IF GASES SUPPORT COMBUSTION
6 GLOBAL GAS CYLINDER MARKET, BY MATERIAL
6.1 OVERVIEW
6.2 STEEL
6.3 COMPOSITE
6.4 OTHERS
7 GLOBAL GAS CYLINDER MARKET, BY PRODUCT
7.1 OVERVIEW
7.2 HIGH PRESSURE
7.3 LOW PRESSURE
7.4 ACETYLENE
7.5 OTHERS
8 GLOBAL GAS CYLINDER MARKET, BY WRAP TYPE
8.1 OVERVIEW
8.2 WRAP LESS
8.3 GLASS FIBER
8.4 ARAMID FIBER
8.5 CARBON FIBER
8.6 OTHERS
9 GLOBAL GAS CYLINDER MARKET, BY GAS
9.1 OVERVIEW
9.2 INERT GASES
9.3 FLAMMABLE GASES
9.4 TOXIC GASES
9.5 PYROPHORIC GASES
9.6 OXIDIZERS
9.7 OTHERS
10 GLOBAL GAS CYLINDER MARKET, BY APPLICATION
10.1 OVERVIEW
10.2 PROCESSING INDUSTRIES
10.3 TRANSPORTATION
10.4 KITCHEN AND DOMESTIC
10.5 MEDICALS
10.6 OTHERS
11 GLOBAL GAS CYLINDER MARKET, BY REGION
11.1 OVERVIEW
11.2 ASIA PACIFIC
11.2.1 CHINA
11.2.2 INDIA
11.2.3 JAPAN
11.2.4 SOUTH KOREA
11.2.5 THAILAND
11.2.6 SINGAPORE
11.2.7 INDONESIA
11.2.8 AUSTRALIA & NEW ZEALAND
11.2.9 PHILIPPINES
11.2.10 MALAYSIA
11.2.11 HONG KONG
11.2.12 TAIWAN
11.2.13 REST OF ASIA PACIFIC
11.3 EUROPE
11.3.1 GERMANY
11.3.2 U.K.
11.3.3 FRANCE
11.3.4 ITALY
11.3.5 SPAIN
11.3.6 RUSSIA
11.3.7 SWITZERLAND
11.3.8 TURKEY
11.3.9 BELGIUM
11.3.10 NETHERLANDS
11.3.11 REST OF EUROPE
11.4 NORTH AMERICA
11.4.1 U.S.
11.4.2 CANADA
11.4.3 MEXICO
11.5 MIDDLE EAST AND AFRICA
11.5.1 SAUDI ARABIA
11.5.2 UNITED ARAB EMIRATES
11.5.3 SOUTH AFRICA
11.5.4 EGYPT
11.5.5 ISRAEL
11.5.6 REST OF MIDDLE EAST AND AFRICA
11.6 SOUTH AMERICA
11.6.1 BRAZIL
11.6.2 ARGENTINA
11.6.3 REST OF SOUTH AMERICA
12 GLOBAL GAS CYLINDER MARKET COMPANY LANDSCAPE
12.1 COMPANY SHARE ANALYSIS:
12.2 COMPANY SHARE ANALYSIS: NORTH AMERICA
12.3 COMPANY SHARE ANALYSIS: EUROPE
12.4 COMPANY SHARE ANALYSIS: ASIA-PACIFIC
12.5 COLLABORATION
12.6 NEW UNIT
12.7 NEW PLANT
12.8 PARTNERSHIP
12.9 ACQUISITIONS
13 SWOT ANALYSIS
14 COMPANY PROFILES
14.1 LINDE PLC
14.1.1 COMPANY SNAPSHOT
14.1.2 REVENUE ANALYSIS
14.1.3 COMPANY SHARE ANALYSIS
14.1.4 PRODUCT PORTFOLIO
14.1.5 RECENT DEVELOPMENTS
14.2 WORTHINGTON INDUSTRIES INC.
14.2.1 COMPANY SNAPSHOT
14.2.2 COMPANY SHARE ANALYSIS
14.2.3 PRODUCT PORTFOLIO
14.2.4 RECENT DEVELOPMENT
14.3 3M
14.3.1 COMPANY SNAPSHOT
14.3.2 REVENUE ANALYSIS
14.3.3 COMPANY SHARE ANALYSIS
14.3.4 PRODUCT PORTFOLIO
14.3.5 RECENT DEVELOPMENT
14.4 LUXFER GAS CYLINDERS
14.4.1 COMPANY SNAPSHOT
14.4.2 COMPANY SHARE ANALYSIS
14.4.3 PRODUCT PORTFOLIO
14.4.4 RECENT UPDATE
14.5 DRÄGERWERK AG & CO. KGAA (2022)
14.5.1 COMPANY SNAPSHOT
14.5.2 REVENUE ANALYSIS
14.5.3 COMPANY SHARE ANALYSIS
14.5.4 PRODUCT PORTFOLIO
14.5.5 RECENT DEVELOPMENT
14.6 BEIJING TIANHAI INDUSTRY CO., LTD.
14.6.1 COMPANY SNAPSHOT
14.6.2 PRODUCT PORTFOLIO
14.6.3 RECENT UPDATES
14.7 AYGAZ A.Ş.
14.7.1 COMPANY SNAPSHOT
14.7.2 REVENUE ANALYSIS
14.7.3 PRODUCT PORTFOLIO
14.7.4 RECENT DEVELOPEMNTS
14.8 FABER INDUSTRIE SPA
14.8.1 COMPANY SNAPSHOT
14.8.2 PRODUCT PORTFOLIO
14.8.3 RECENT DEVELOPMENT
14.9 WELZ GAS CYLINDER GMBH
14.9.1 COMPANY SNAPSHOT
14.9.2 PRODUCT PORTFOLIO
14.9.3 RECENT DEVELOPMENT
14.1 EKC
14.10.1 COMPANY SNAPSHOT
14.10.2 PRODUCT PORTFOLIO
14.10.3 RECENT DEVELOPMENT
14.11 HEXAGON RAGASCO AS
14.11.1 COMPANY SNAPSHOT
14.11.2 PRODUCT PORTFOLIO
14.11.3 RECENT DEVELOPMENT
14.12 MS GROUP
14.12.1 COMPANY SNAPSHOT
14.12.2 PRODUCT PORTFOLIO
14.12.3 RECENT DEVELOPMENT
14.13 TIME TECHNOPLAST LTD.
14.13.1 COMPANY SNAPSHOT
14.13.2 REVENUE ANALYSIS
14.13.3 PRODUCT PORTFOLIO
14.13.4 RECENT DEVELOPMENT
14.14 ZHEJIANG TIANLONG CYLINDER CO., LTD
14.14.1 COMPANY SNAPSHOT
14.14.2 PRODUCT PORTFOLIO
14.14.3 RECENT DEVELOPMENT
15 QUESTIONNAIRE
16 RELATED REPORTS
List of Table
TABLE 1 GLOBAL GAS CYLINDER MARKET, BY MATERIAL, 2021-2030 (USD THOUSAND)
TABLE 2 GLOBAL GAS CYLINDER MARKET, BY MATERIAL, 2021-2030 (THOUSAND UNITS)
TABLE 3 GLOBAL STEEL IN GAS CYLINDER MARKET, BY REGION, 2021-2030 (USD THOUSAND)
TABLE 4 GLOBAL STEEL IN GAS CYLINDER MARKET, BY REGION, 2021-2030 (THOUSAND UNITS)
TABLE 5 GLOBAL COMPOSITE IN GAS CYLINDER MARKET, BY REGION, 2021-2030 (USD THOUSAND)
TABLE 6 GLOBAL COMPOSITE IN GAS CYLINDER MARKET, BY REGION, 2021-2030 (THOUSAND UNITS)
TABLE 7 GLOBAL OTHERS IN GAS CYLINDER MARKET, BY REGION, 2021-2030 (USD THOUSAND)
TABLE 8 GLOBAL OTHERS IN GAS CYLINDER MARKET, BY REGION, 2021-2030 (THOUSAND UNITS)
TABLE 9 GLOBAL GAS CYLINDER MARKET, BY PRODUCT, 2021-2030 (USD THOUSAND)
TABLE 10 GLOBAL HIGH PRESSURE IN GAS CYLINDER MARKET, BY REGION, 2021-2030 (USD THOUSAND)
TABLE 11 GLOBAL LOW PRESSURE IN GAS CYLINDER MARKET, BY REGION, 2021-2030 (USD THOUSAND)
TABLE 12 GLOBAL ACETYLENE IN GAS CYLINDER MARKET, BY REGION, 2021-2030 (USD THOUSAND)
TABLE 13 GLOBAL OTHERS IN GAS CYLINDER MARKET, BY REGION, 2021-2030 (USD THOUSAND)
TABLE 14 GLOBAL GAS CYLINDER MARKET, BY WRAP TYPE, 2021-2030 (USD THOUSAND)
TABLE 15 GLOBAL WRAP LESS IN GAS CYLINDER MARKET, BY REGION, 2021-2030 (USD THOUSAND)
TABLE 16 GLOBAL GLASS FIBER IN GAS CYLINDER MARKET, BY REGION, 2021-2030 (USD THOUSAND)
TABLE 17 GLOBAL ARAMID FIBER IN GAS CYLINDER MARKET, BY REGION, 2021-2030 (USD THOUSAND)
TABLE 18 GLOBAL CARBON FIBER IN GAS CYLINDER MARKET, BY REGION, 2021-2030 (USD THOUSAND)
TABLE 19 GLOBAL OTHERS IN GAS CYLINDER MARKET, BY REGION, 2021-2030 (USD THOUSAND)
TABLE 20 GLOBAL GAS CYLINDER MARKET, BY GAS, 2021-2030 (USD THOUSAND)
TABLE 21 GLOBAL INERT GASES IN GAS CYLINDER MARKET, BY REGION, 2021-2030 (USD THOUSAND)
TABLE 22 GLOBAL FLAMMABLE GASES IN GAS CYLINDER MARKET, BY REGION, 2021-2030 (USD THOUSAND)
TABLE 23 GLOBAL TOXIC GASES IN GAS CYLINDER MARKET, BY REGION, 2021-2030 (USD THOUSAND)
TABLE 24 GLOBAL PYROPHORIC GASES IN GAS CYLINDER MARKET, BY REGION, 2021-2030 (USD THOUSAND)
TABLE 25 GLOBAL OXIDIZERS IN GAS CYLINDER MARKET, BY REGION, 2021-2030 (USD THOUSAND)
TABLE 26 GLOBAL OTHERS IN GAS CYLINDER MARKET, BY REGION, 2021-2030 (USD THOUSAND)
TABLE 27 GLOBAL GAS CYLINDER MARKET, BY APPLICATION, 2021-2030 (USD THOUSAND)
TABLE 28 GLOBAL PROCESSING INDUSTRIES IN GAS CYLINDER MARKET, BY REGION, 2021-2030 (USD THOUSAND)
TABLE 29 GLOBAL TRANSPORTATION IN GAS CYLINDER MARKET, BY REGION, 2021-2030 (USD THOUSAND)
TABLE 30 GLOBAL KITCHEN AND DOMESTIC IN GAS CYLINDER MARKET, BY REGION, 2021-2030 (USD THOUSAND)
TABLE 31 GLOBAL MEDICALS IN GAS CYLINDER MARKET, BY REGION, 2021-2030 (USD THOUSAND)
TABLE 32 GLOBAL OTHERS IN GAS CYLINDER MARKET, BY REGION, 2021-2030 (USD THOUSAND)
TABLE 33 GLOBAL GAS CYLINDER MARKET, BY REGION, 2021-2030 (USD THOUSAND)
TABLE 34 GLOBAL GAS CYLINDER MARKET, BY REGION, 2021-2030 (THOUSAND UNITS)
TABLE 35 ASIA-PACIFIC GAS CYLINDER MARKET, BY COUNTRY, 2021-2030 (USD THOUSAND)
TABLE 36 ASIA-PACIFIC GAS CYLINDER MARKET, BY COUNTRY, 2021-2030 (THOUSAND UNITS)
TABLE 37 ASIA-PACIFIC GAS CYLINDER MARKET, BY MATERIAL, 2021-2030 (USD THOUSAND)
TABLE 38 ASIA-PACIFIC GAS CYLINDER MARKET, BY MATERIAL, 2021-2030 (THOUSAND UNITS)
TABLE 39 ASIA-PACIFIC GAS CYLINDER MARKET, BY PRODUCT, 2021-2030 (USD THOUSAND)
TABLE 40 ASIA-PACIFIC GAS CYLINDER MARKET, BY WRAP TYPE, 2021-2030 (USD THOUSAND)
TABLE 41 ASIA-PACIFIC GAS CYLINDER MARKET, BY GAS, 2021-2030 (USD THOUSAND)
TABLE 42 ASIA-PACIFIC GAS CYLINDER MARKET, BY APPLICATION, 2021-2030 (USD THOUSAND)
TABLE 43 CHINA GAS CYLINDER MARKET, BY MATERIAL, 2021-2030 (USD THOUSAND)
TABLE 44 CHINA GAS CYLINDER MARKET, BY MATERIAL, 2021-2030 (THOUSAND UNITS)
TABLE 45 CHINA GAS CYLINDER MARKET, BY PRODUCT, 2021-2030 (USD THOUSAND)
TABLE 46 CHINA GAS CYLINDER MARKET, BY WRAP TYPE, 2021-2030 (USD THOUSAND)
TABLE 47 CHINA GAS CYLINDER MARKET, BY GAS, 2021-2030 (USD THOUSAND)
TABLE 48 CHINA GAS CYLINDER MARKET, BY APPLICATION, 2021-2030 (USD THOUSAND)
TABLE 49 INDIA GAS CYLINDER MARKET, BY MATERIAL, 2021-2030 (USD THOUSAND)
TABLE 50 INDIA GAS CYLINDER MARKET, BY MATERIAL, 2021-2030 (THOUSAND UNITS)
TABLE 51 INDIA GAS CYLINDER MARKET, BY PRODUCT, 2021-2030 (USD THOUSAND)
TABLE 52 INDIA GAS CYLINDER MARKET, BY WRAP TYPE, 2021-2030 (USD THOUSAND)
TABLE 53 INDIA GAS CYLINDER MARKET, BY GAS, 2021-2030 (USD THOUSAND)
TABLE 54 INDIA GAS CYLINDER MARKET, BY APPLICATION, 2021-2030 (USD THOUSAND)
TABLE 55 JAPAN GAS CYLINDER MARKET, BY MATERIAL, 2021-2030 (USD THOUSAND)
TABLE 56 JAPAN GAS CYLINDER MARKET, BY MATERIAL, 2021-2030 (THOUSAND UNITS)
TABLE 57 JAPAN GAS CYLINDER MARKET, BY PRODUCT, 2021-2030 (USD THOUSAND)
TABLE 58 JAPAN GAS CYLINDER MARKET, BY WRAP TYPE, 2021-2030 (USD THOUSAND)
TABLE 59 JAPAN GAS CYLINDER MARKET, BY GAS, 2021-2030 (USD THOUSAND)
TABLE 60 JAPAN GAS CYLINDER MARKET, BY APPLICATION, 2021-2030 (USD THOUSAND)
TABLE 61 SOUTH KOREA GAS CYLINDER MARKET, BY MATERIAL, 2021-2030 (USD THOUSAND)
TABLE 62 SOUTH KOREA GAS CYLINDER MARKET, BY MATERIAL, 2021-2030 (THOUSAND UNITS)
TABLE 63 SOUTH KOREA GAS CYLINDER MARKET, BY PRODUCT, 2021-2030 (USD THOUSAND)
TABLE 64 SOUTH KOREA GAS CYLINDER MARKET, BY WRAP TYPE, 2021-2030 (USD THOUSAND)
TABLE 65 SOUTH KOREA GAS CYLINDER MARKET, BY GAS, 2021-2030 (USD THOUSAND)
TABLE 66 SOUTH KOREA GAS CYLINDER MARKET, BY APPLICATION, 2021-2030 (USD THOUSAND)
TABLE 67 THAILAND GAS CYLINDER MARKET, BY MATERIAL, 2021-2030 (USD THOUSAND)
TABLE 68 THAILAND GAS CYLINDER MARKET, BY MATERIAL, 2021-2030 (THOUSAND UNITS)
TABLE 69 THAILAND GAS CYLINDER MARKET, BY PRODUCT, 2021-2030 (USD THOUSAND)
TABLE 70 THAILAND GAS CYLINDER MARKET, BY WRAP TYPE, 2021-2030 (USD THOUSAND)
TABLE 71 THAILAND GAS CYLINDER MARKET, BY GAS, 2021-2030 (USD THOUSAND)
TABLE 72 THAILAND GAS CYLINDER MARKET, BY APPLICATION, 2021-2030 (USD THOUSAND)
TABLE 73 SINGAPORE GAS CYLINDER MARKET, BY MATERIAL, 2021-2030 (USD THOUSAND)
TABLE 74 SINGAPORE GAS CYLINDER MARKET, BY MATERIAL, 2021-2030 (THOUSAND UNITS)
TABLE 75 SINGAPORE GAS CYLINDER MARKET, BY PRODUCT, 2021-2030 (USD THOUSAND)
TABLE 76 SINGAPORE GAS CYLINDER MARKET, BY WRAP TYPE, 2021-2030 (USD THOUSAND)
TABLE 77 SINGAPORE GAS CYLINDER MARKET, BY GAS, 2021-2030 (USD THOUSAND)
TABLE 78 SINGAPORE GAS CYLINDER MARKET, BY APPLICATION, 2021-2030 (USD THOUSAND)
TABLE 79 INDONESIA GAS CYLINDER MARKET, BY MATERIAL, 2021-2030 (USD THOUSAND)
TABLE 80 INDONESIA GAS CYLINDER MARKET, BY MATERIAL, 2021-2030 (THOUSAND UNITS)
TABLE 81 INDONESIA GAS CYLINDER MARKET, BY PRODUCT, 2021-2030 (USD THOUSAND)
TABLE 82 INDONESIA GAS CYLINDER MARKET, BY WRAP TYPE, 2021-2030 (USD THOUSAND)
TABLE 83 INDONESIA GAS CYLINDER MARKET, BY GAS, 2021-2030 (USD THOUSAND)
TABLE 84 INDONESIA GAS CYLINDER MARKET, BY APPLICATION, 2021-2030 (USD THOUSAND)
TABLE 85 AUSTRALIA & NEW ZEALAND GAS CYLINDER MARKET, BY MATERIAL, 2021-2030 (USD THOUSAND)
TABLE 86 AUSTRALIA & NEW ZEALAND GAS CYLINDER MARKET, BY MATERIAL, 2021-2030 (THOUSAND UNITS)
TABLE 87 AUSTRALIA & NEW ZEALAND GAS CYLINDER MARKET, BY PRODUCT, 2021-2030 (USD THOUSAND)
TABLE 88 AUSTRALIA & NEW ZEALAND GAS CYLINDER MARKET, BY WRAP TYPE, 2021-2030 (USD THOUSAND)
TABLE 89 AUSTRALIA & NEW ZEALAND GAS CYLINDER MARKET, BY GAS, 2021-2030 (USD THOUSAND)
TABLE 90 AUSTRALIA & NEW ZEALAND GAS CYLINDER MARKET, BY APPLICATION, 2021-2030 (USD THOUSAND)
TABLE 91 PHILIPPINES GAS CYLINDER MARKET, BY MATERIAL, 2021-2030 (USD THOUSAND)
TABLE 92 PHILIPPINES GAS CYLINDER MARKET, BY MATERIAL, 2021-2030 (THOUSAND UNITS)
TABLE 93 PHILIPPINES GAS CYLINDER MARKET, BY PRODUCT, 2021-2030 (USD THOUSAND)
TABLE 94 PHILIPPINES GAS CYLINDER MARKET, BY WRAP TYPE, 2021-2030 (USD THOUSAND)
TABLE 95 PHILIPPINES GAS CYLINDER MARKET, BY GAS, 2021-2030 (USD THOUSAND)
TABLE 96 PHILIPPINES GAS CYLINDER MARKET, BY APPLICATION, 2021-2030 (USD THOUSAND)
TABLE 97 MALAYSIA GAS CYLINDER MARKET, BY MATERIAL, 2021-2030 (USD THOUSAND)
TABLE 98 MALAYSIA GAS CYLINDER MARKET, BY MATERIAL, 2021-2030 (THOUSAND UNITS)
TABLE 99 MALAYSIA GAS CYLINDER MARKET, BY PRODUCT, 2021-2030 (USD THOUSAND)
TABLE 100 MALAYSIA GAS CYLINDER MARKET, BY WRAP TYPE, 2021-2030 (USD THOUSAND)
TABLE 101 MALAYSIA GAS CYLINDER MARKET, BY GAS, 2021-2030 (USD THOUSAND)
TABLE 102 MALAYSIA GAS CYLINDER MARKET, BY APPLICATION, 2021-2030 (USD THOUSAND)
TABLE 103 HONG KONG GAS CYLINDER MARKET, BY MATERIAL, 2021-2030 (USD THOUSAND)
TABLE 104 HONG KONG GAS CYLINDER MARKET, BY MATERIAL, 2021-2030 (THOUSAND UNITS)
TABLE 105 HONG KONG GAS CYLINDER MARKET, BY PRODUCT, 2021-2030 (USD THOUSAND)
TABLE 106 HONG KONG GAS CYLINDER MARKET, BY WRAP TYPE, 2021-2030 (USD THOUSAND)
TABLE 107 HONG KONG GAS CYLINDER MARKET, BY GAS, 2021-2030 (USD THOUSAND)
TABLE 108 HONG KONG GAS CYLINDER MARKET, BY APPLICATION, 2021-2030 (USD THOUSAND)
TABLE 109 TAIWAN GAS CYLINDER MARKET, BY MATERIAL, 2021-2030 (USD THOUSAND)
TABLE 110 TAIWAN GAS CYLINDER MARKET, BY MATERIAL, 2021-2030 (THOUSAND UNITS)
TABLE 111 TAIWAN GAS CYLINDER MARKET, BY PRODUCT, 2021-2030 (USD THOUSAND)
TABLE 112 TAIWAN GAS CYLINDER MARKET, BY WRAP TYPE, 2021-2030 (USD THOUSAND)
TABLE 113 TAIWAN GAS CYLINDER MARKET, BY GAS, 2021-2030 (USD THOUSAND)
TABLE 114 TAIWAN GAS CYLINDER MARKET, BY APPLICATION, 2021-2030 (USD THOUSAND)
TABLE 115 REST OF ASIA PACIFIC GAS CYLINDER MARKET, BY MATERIAL, 2021-2030 (USD THOUSAND)
TABLE 116 REST OF ASIA PACIFIC GAS CYLINDER MARKET, BY MATERIAL, 2021-2030 (THOUSAND UNITS)
TABLE 117 EUROPE GAS CYLINDER MARKET, BY COUNTRY, 2021-2030 (USD THOUSAND)
TABLE 118 EUROPE GAS CYLINDER MARKET, BY COUNTRY, 2021-2030 (THOUSAND UNITS)
TABLE 119 EUROPE GAS CYLINDER MARKET, BY MATERIAL, 2021-2030 (USD THOUSAND)
TABLE 120 EUROPE GAS CYLINDER MARKET, BY MATERIAL, 2021-2030 (THOUSAND UNITS)
TABLE 121 EUROPE GAS CYLINDER MARKET, BY PRODUCT, 2021-2030 (USD THOUSAND)
TABLE 122 EUROPE GAS CYLINDER MARKET, BY WRAP TYPE, 2021-2030 (USD THOUSAND)
TABLE 123 EUROPE GAS CYLINDER MARKET, BY GAS, 2021-2030 (USD THOUSAND)
TABLE 124 EUROPE GAS CYLINDER MARKET, BY APPLICATION, 2021-2030 (USD THOUSAND)
TABLE 125 GERMANY GAS CYLINDER MARKET, BY MATERIAL, 2021-2030 (USD THOUSAND)
TABLE 126 GERMANY GAS CYLINDER MARKET, BY MATERIAL, 2021-2030 (THOUSAND UNITS)
TABLE 127 GERMANY GAS CYLINDER MARKET, BY PRODUCT, 2021-2030 (USD THOUSAND)
TABLE 128 GERMANY GAS CYLINDER MARKET, BY WRAP TYPE, 2021-2030 (USD THOUSAND)
TABLE 129 GERMANY GAS CYLINDER MARKET, BY GAS, 2021-2030 (USD THOUSAND)
TABLE 130 GERMANY GAS CYLINDER MARKET, BY APPLICATION, 2021-2030 (USD THOUSAND)
TABLE 131 U.K. GAS CYLINDER MARKET, BY MATERIAL, 2021-2030 (USD THOUSAND)
TABLE 132 U.K. GAS CYLINDER MARKET, BY MATERIAL, 2021-2030 (THOUSAND UNITS)
TABLE 133 U.K. GAS CYLINDER MARKET, BY PRODUCT, 2021-2030 (USD THOUSAND)
TABLE 134 U.K. GAS CYLINDER MARKET, BY WRAP TYPE, 2021-2030 (USD THOUSAND)
TABLE 135 U.K. GAS CYLINDER MARKET, BY GAS, 2021-2030 (USD THOUSAND)
TABLE 136 U.K. GAS CYLINDER MARKET, BY APPLICATION, 2021-2030 (USD THOUSAND)
TABLE 137 FRANCE GAS CYLINDER MARKET, BY MATERIAL, 2021-2030 (USD THOUSAND)
TABLE 138 FRANCE GAS CYLINDER MARKET, BY MATERIAL, 2021-2030 (THOUSAND UNITS)
TABLE 139 FRANCE GAS CYLINDER MARKET, BY PRODUCT, 2021-2030 (USD THOUSAND)
TABLE 140 FRANCE GAS CYLINDER MARKET, BY WRAP TYPE, 2021-2030 (USD THOUSAND)
TABLE 141 FRANCE GAS CYLINDER MARKET, BY GAS, 2021-2030 (USD THOUSAND)
TABLE 142 FRANCE GAS CYLINDER MARKET, BY APPLICATION, 2021-2030 (USD THOUSAND)
TABLE 143 ITALY GAS CYLINDER MARKET, BY MATERIAL, 2021-2030 (USD THOUSAND)
TABLE 144 ITALY GAS CYLINDER MARKET, BY MATERIAL, 2021-2030 (THOUSAND UNITS)
TABLE 145 ITALY GAS CYLINDER MARKET, BY PRODUCT, 2021-2030 (USD THOUSAND)
TABLE 146 ITALY GAS CYLINDER MARKET, BY WRAP TYPE, 2021-2030 (USD THOUSAND)
TABLE 147 ITALY GAS CYLINDER MARKET, BY GAS, 2021-2030 (USD THOUSAND)
TABLE 148 ITALY GAS CYLINDER MARKET, BY APPLICATION, 2021-2030 (USD THOUSAND)
TABLE 149 SPAIN GAS CYLINDER MARKET, BY MATERIAL, 2021-2030 (USD THOUSAND)
TABLE 150 SPAIN GAS CYLINDER MARKET, BY MATERIAL, 2021-2030 (THOUSAND UNITS)
TABLE 151 SPAIN GAS CYLINDER MARKET, BY PRODUCT, 2021-2030 (USD THOUSAND)
TABLE 152 SPAIN GAS CYLINDER MARKET, BY WRAP TYPE, 2021-2030 (USD THOUSAND)
TABLE 153 SPAIN GAS CYLINDER MARKET, BY GAS, 2021-2030 (USD THOUSAND)
TABLE 154 SPAIN GAS CYLINDER MARKET, BY APPLICATION, 2021-2030 (USD THOUSAND)
TABLE 155 RUSSIA GAS CYLINDER MARKET, BY MATERIAL, 2021-2030 (USD THOUSAND)
TABLE 156 RUSSIA GAS CYLINDER MARKET, BY MATERIAL, 2021-2030 (THOUSAND UNITS)
TABLE 157 RUSSIA GAS CYLINDER MARKET, BY PRODUCT, 2021-2030 (USD THOUSAND)
TABLE 158 RUSSIA GAS CYLINDER MARKET, BY WRAP TYPE, 2021-2030 (USD THOUSAND)
TABLE 159 RUSSIA GAS CYLINDER MARKET, BY GAS, 2021-2030 (USD THOUSAND)
TABLE 160 RUSSIA GAS CYLINDER MARKET, BY APPLICATION, 2021-2030 (USD THOUSAND)
TABLE 161 SWITZERLAND GAS CYLINDER MARKET, BY MATERIAL, 2021-2030 (USD THOUSAND)
TABLE 162 SWITZERLAND GAS CYLINDER MARKET, BY MATERIAL, 2021-2030 (THOUSAND UNITS)
TABLE 163 SWITZERLAND GAS CYLINDER MARKET, BY PRODUCT, 2021-2030 (USD THOUSAND)
TABLE 164 SWITZERLAND GAS CYLINDER MARKET, BY WRAP TYPE, 2021-2030 (USD THOUSAND)
TABLE 165 SWITZERLAND GAS CYLINDER MARKET, BY GAS, 2021-2030 (USD THOUSAND)
TABLE 166 SWITZERLAND GAS CYLINDER MARKET, BY APPLICATION, 2021-2030 (USD THOUSAND)
TABLE 167 TURKEY GAS CYLINDER MARKET, BY MATERIAL, 2021-2030 (USD THOUSAND)
TABLE 168 TURKEY GAS CYLINDER MARKET, BY MATERIAL, 2021-2030 (THOUSAND UNITS)
TABLE 169 TURKEY GAS CYLINDER MARKET, BY PRODUCT, 2021-2030 (USD THOUSAND)
TABLE 170 TURKEY GAS CYLINDER MARKET, BY WRAP TYPE, 2021-2030 (USD THOUSAND)
TABLE 171 TURKEY GAS CYLINDER MARKET, BY GAS, 2021-2030 (USD THOUSAND)
TABLE 172 TURKEY GAS CYLINDER MARKET, BY APPLICATION, 2021-2030 (USD THOUSAND)
TABLE 173 BELGIUM GAS CYLINDER MARKET, BY MATERIAL, 2021-2030 (USD THOUSAND)
TABLE 174 BELGIUM GAS CYLINDER MARKET, BY MATERIAL, 2021-2030 (THOUSAND UNITS)
TABLE 175 BELGIUM GAS CYLINDER MARKET, BY PRODUCT, 2021-2030 (USD THOUSAND)
TABLE 176 BELGIUM GAS CYLINDER MARKET, BY WRAP TYPE, 2021-2030 (USD THOUSAND)
TABLE 177 BELGIUM GAS CYLINDER MARKET, BY GAS, 2021-2030 (USD THOUSAND)
TABLE 178 BELGIUM GAS CYLINDER MARKET, BY APPLICATION, 2021-2030 (USD THOUSAND)
TABLE 179 NETHERLANDS GAS CYLINDER MARKET, BY MATERIAL, 2021-2030 (USD THOUSAND)
TABLE 180 NETHERLANDS GAS CYLINDER MARKET, BY MATERIAL, 2021-2030 (THOUSAND UNITS)
TABLE 181 NETHERLANDS GAS CYLINDER MARKET, BY PRODUCT, 2021-2030 (USD THOUSAND)
TABLE 182 NETHERLANDS GAS CYLINDER MARKET, BY WRAP TYPE, 2021-2030 (USD THOUSAND)
TABLE 183 NETHERLANDS GAS CYLINDER MARKET, BY GAS, 2021-2030 (USD THOUSAND)
TABLE 184 NETHERLANDS GAS CYLINDER MARKET, BY APPLICATION, 2021-2030 (USD THOUSAND)
TABLE 185 REST OF EUROPE GAS CYLINDER MARKET, BY MATERIAL, 2021-2030 (USD THOUSAND)
TABLE 186 REST OF EUROPE GAS CYLINDER MARKET, BY MATERIAL, 2021-2030 (THOUSAND UNITS)
TABLE 187 NORTH AMERICA GAS CYLINDER MARKET, BY COUNTRY, 2021-2030 (USD THOUSAND)
TABLE 188 NORTH AMERICA GAS CYLINDER MARKET, BY COUNTRY, 2021-2030 (THOUSAND UNITS)
TABLE 189 NORTH AMERICA CYLINDER MARKET, BY MATERIAL, 2021-2030 (USD THOUSAND)
TABLE 190 NORTH AMERICA CYLINDER MARKET, BY MATERIAL, 2021-2030 (THOUSAND UNITS)
TABLE 191 NORTH AMERICA CYLINDER MARKET, BY PRODUCT, 2021-2030 (USD THOUSAND)
TABLE 192 NORTH AMERICA CYLINDER MARKET, BY WRAP TYPE, 2021-2030 (USD THOUSAND)
TABLE 193 NORTH AMERICA CYLINDER MARKET, BY GAS, 2021-2030 (USD THOUSAND)
TABLE 194 NORTH AMERICA CYLINDER MARKET, BY APPLICATION, 2021-2030 (USD THOUSAND)
TABLE 195 U.S. GAS CYLINDER MARKET, BY MATERIAL, 2021-2030 (USD THOUSAND)
TABLE 196 U.S. GAS CYLINDER MARKET, BY MATERIAL, 2021-2030 (THOUSAND UNITS)
TABLE 197 U.S. GAS CYLINDER MARKET, BY PRODUCT, 2021-2030 (USD THOUSAND)
TABLE 198 U.S. GAS CYLINDER MARKET, BY WRAP TYPE, 2021-2030 (USD THOUSAND)
TABLE 199 U.S. GAS CYLINDER MARKET, BY GAS, 2021-2030 (USD THOUSAND)
TABLE 200 U.S. GAS CYLINDER MARKET, BY APPLICATION, 2021-2030 (USD THOUSAND)
TABLE 201 CANADA GAS CYLINDER MARKET, BY MATERIAL, 2021-2030 (USD THOUSAND)
TABLE 202 CANADA GAS CYLINDER MARKET, BY MATERIAL, 2021-2030 (THOUSAND UNITS)
TABLE 203 CANADA GAS CYLINDER MARKET, BY PRODUCT, 2021-2030 (USD THOUSAND)
TABLE 204 CANADA GAS CYLINDER MARKET, BY WRAP TYPE, 2021-2030 (USD THOUSAND)
TABLE 205 CANADA GAS CYLINDER MARKET, BY GAS, 2021-2030 (USD THOUSAND)
TABLE 206 CANADA GAS CYLINDER MARKET, BY APPLICATION, 2021-2030 (USD THOUSAND)
TABLE 207 MEXICO GAS CYLINDER MARKET, BY MATERIAL, 2021-2030 (USD THOUSAND)
TABLE 208 MEXICO GAS CYLINDER MARKET, BY MATERIAL, 2021-2030 (THOUSAND UNITS)
TABLE 209 MEXICO GAS CYLINDER MARKET, BY PRODUCT, 2021-2030 (USD THOUSAND)
TABLE 210 MEXICO GAS CYLINDER MARKET, BY WRAP TYPE, 2021-2030 (USD THOUSAND)
TABLE 211 MEXICO GAS CYLINDER MARKET, BY GAS, 2021-2030 (USD THOUSAND)
TABLE 212 MEXICO GAS CYLINDER MARKET, BY APPLICATION, 2021-2030 (USD THOUSAND)
TABLE 213 MIDDLE EAST & AFRICA GAS CYLINDER MARKET, BY COUNTRY, 2021-2030 (USD THOUSAND)
TABLE 214 MIDDLE EAST & AFRICA GAS CYLINDER MARKET, BY COUNTRY, 2021-2030 (THOUSAND UNITS)
TABLE 215 MIDDLE EAST & AFRICA GAS CYLINDER MARKET, BY MATERIAL, 2021-2030 (USD THOUSAND)
TABLE 216 MIDDLE EAST & AFRICA GAS CYLINDER MARKET, BY MATERIAL, 2021-2030 (THOUSAND UNITS)
TABLE 217 MIDDLE EAST & AFRICA GAS CYLINDER MARKET, BY PRODUCT, 2021-2030 (USD THOUSAND)
TABLE 218 MIDDLE EAST & AFRICA GAS CYLINDER MARKET, BY WRAP TYPE, 2021-2030 (USD THOUSAND)
TABLE 219 MIDDLE EAST & AFRICA GAS CYLINDER MARKET, BY GAS, 2021-2030 (USD THOUSAND)
TABLE 220 MIDDLE EAST & AFRICA GAS CYLINDER MARKET, BY APPLICATION, 2021-2030 (USD THOUSAND)
TABLE 221 SAUDI ARABIA GAS CYLINDER MARKET, BY MATERIAL, 2021-2030 (USD THOUSAND)
TABLE 222 SAUDI ARABIA GAS CYLINDER MARKET, BY MATERIAL, 2021-2030 (THOUSAND UNITS)
TABLE 223 SAUDI ARABIA GAS CYLINDER MARKET, BY PRODUCT, 2021-2030 (USD THOUSAND)
TABLE 224 SAUDI ARABIA GAS CYLINDER MARKET, BY WRAP TYPE, 2021-2030 (USD THOUSAND)
TABLE 225 SAUDI ARABIA GAS CYLINDER MARKET, BY GAS, 2021-2030 (USD THOUSAND)
TABLE 226 SAUDI ARABIA GAS CYLINDER MARKET, BY APPLICATION, 2021-2030 (USD THOUSAND)
TABLE 227 UNITED ARAB EMIRATES GAS CYLINDER MARKET, BY MATERIAL, 2021-2030 (USD THOUSAND)
TABLE 228 UNITED ARAB EMIRATES GAS CYLINDER MARKET, BY MATERIAL, 2021-2030 (THOUSAND UNITS)
TABLE 229 UNITED ARAB EMIRATES GAS CYLINDER MARKET, BY PRODUCT, 2021-2030 (USD THOUSAND)
TABLE 230 UNITED ARAB EMIRATES GAS CYLINDER MARKET, BY WRAP TYPE, 2021-2030 (USD THOUSAND)
TABLE 231 UNITED ARAB EMIRATES GAS CYLINDER MARKET, BY GAS, 2021-2030 (USD THOUSAND)
TABLE 232 UNITED ARAB EMIRATES GAS CYLINDER MARKET, BY APPLICATION, 2021-2030 (USD THOUSAND)
TABLE 233 SOUTH AFRICA GAS CYLINDER MARKET, BY MATERIAL, 2021-2030 (USD THOUSAND)
TABLE 234 SOUTH AFRICA GAS CYLINDER MARKET, BY MATERIAL, 2021-2030 (THOUSAND UNITS)
TABLE 235 SOUTH AFRICA GAS CYLINDER MARKET, BY PRODUCT, 2021-2030 (USD THOUSAND)
TABLE 236 SOUTH AFRICA GAS CYLINDER MARKET, BY WRAP TYPE, 2021-2030 (USD THOUSAND)
TABLE 237 SOUTH AFRICA GAS CYLINDER MARKET, BY GAS, 2021-2030 (USD THOUSAND)
TABLE 238 SOUTH AFRICA GAS CYLINDER MARKET, BY APPLICATION, 2021-2030 (USD THOUSAND)
TABLE 239 EGYPT GAS CYLINDER MARKET, BY MATERIAL, 2021-2030 (USD THOUSAND)
TABLE 240 EGYPT GAS CYLINDER MARKET, BY MATERIAL, 2021-2030 (THOUSAND UNITS)
TABLE 241 EGYPT GAS CYLINDER MARKET, BY PRODUCT, 2021-2030 (USD THOUSAND)
TABLE 242 EGYPT GAS CYLINDER MARKET, BY WRAP TYPE, 2021-2030 (USD THOUSAND)
TABLE 243 EGYPT GAS CYLINDER MARKET, BY GAS, 2021-2030 (USD THOUSAND)
TABLE 244 EGYPT GAS CYLINDER MARKET, BY APPLICATION, 2021-2030 (USD THOUSAND)
TABLE 245 ISRAEL GAS CYLINDER MARKET, BY MATERIAL, 2021-2030 (USD THOUSAND)
TABLE 246 ISRAEL GAS CYLINDER MARKET, BY MATERIAL, 2021-2030 (THOUSAND UNITS)
TABLE 247 ISRAEL GAS CYLINDER MARKET, BY PRODUCT, 2021-2030 (USD THOUSAND)
TABLE 248 ISRAEL GAS CYLINDER MARKET, BY WRAP TYPE, 2021-2030 (USD THOUSAND)
TABLE 249 ISRAEL GAS CYLINDER MARKET, BY GAS, 2021-2030 (USD THOUSAND)
TABLE 250 ISRAEL GAS CYLINDER MARKET, BY APPLICATION, 2021-2030 (USD THOUSAND)
TABLE 251 REST OF MIDDLE EAST & AFRICA GAS CYLINDER MARKET, BY MATERIAL, 2021-2030 (USD THOUSAND)
TABLE 252 REST OF MIDDLE EAST & AFRICA GAS CYLINDER MARKET, BY MATERIAL, 2021-2030 (THOUSAND UNITS)
TABLE 253 SOUTH AMERICA GLOBAL GAS CYLINDER MARKET, BY COUNTRY, 2021-2030 (USD THOUSAND)
TABLE 254 SOUTH AMERICA GAS CYLINDER MARKET, BY COUNTRY, 2021-2030 (THOUSAND UNITS)
TABLE 255 SOUTH AMERICA GAS CYLINDER MARKET, BY MATERIAL, 2021-2030 (USD THOUSAND)
TABLE 256 SOUTH AMERICA GAS CYLINDER MARKET, BY MATERIAL, 2021-2030 (THOUSAND UNITS)
TABLE 257 SOUTH AMERICA GAS CYLINDER MARKET, BY PRODUCT, 2021-2030 (USD THOUSAND)
TABLE 258 SOUTH AMERICA GAS CYLINDER MARKET, BY WRAP TYPE, 2021-2030 (USD THOUSAND)
TABLE 259 SOUTH AMERICA GAS CYLINDER MARKET, BY GAS, 2021-2030 (USD THOUSAND)
TABLE 260 SOUTH AMERICA GAS CYLINDER MARKET, BY APPLICATION, 2021-2030 (USD THOUSAND)
TABLE 261 BRAZIL GAS CYLINDER MARKET, BY MATERIAL, 2021-2030 (USD THOUSAND)
TABLE 262 BRAZIL GAS CYLINDER MARKET, BY MATERIAL, 2021-2030 (THOUSAND UNITS)
TABLE 263 BRAZIL GAS CYLINDER MARKET, BY PRODUCT, 2021-2030 (USD THOUSAND)
TABLE 264 BRAZIL GAS CYLINDER MARKET, BY WRAP TYPE, 2021-2030 (USD THOUSAND)
TABLE 265 BRAZIL GAS CYLINDER MARKET, BY GAS, 2021-2030 (USD THOUSAND)
TABLE 266 BRAZIL GAS CYLINDER MARKET, BY APPLICATION, 2021-2030 (USD THOUSAND)
TABLE 267 ARGENTINA GAS CYLINDER MARKET, BY MATERIAL, 2021-2030 (USD THOUSAND)
TABLE 268 ARGENTINA GAS CYLINDER MARKET, BY MATERIAL, 2021-2030 (THOUSAND UNITS)
TABLE 269 ARGENTINA GAS CYLINDER MARKET, BY PRODUCT, 2021-2030 (USD THOUSAND)
TABLE 270 ARGENTINA GAS CYLINDER MARKET, BY WRAP TYPE, 2021-2030 (USD THOUSAND)
TABLE 271 ARGENTINA GAS CYLINDER MARKET, BY GAS, 2021-2030 (USD THOUSAND)
TABLE 272 ARGENTINA GAS CYLINDER MARKET, BY APPLICATION, 2021-2030 (USD THOUSAND)
TABLE 273 REST OF SOUTH AMERICA GAS CYLINDER MARKET, BY MATERIAL, 2021-2030 (USD THOUSAND)
TABLE 274 REST OF SOUTH AMERICA GAS CYLINDER MARKET, BY MATERIAL, 2021-2030 (THOUSAND UNITS)
List of Figure
FIGURE 1 GLOBAL GAS CYLINDER MARKET
FIGURE 2 GLOBAL GAS CYLINDER MARKET: DATA TRIANGULATION
FIGURE 3 GLOBAL GAS CYLINDER MARKET: DROC ANALYSIS
FIGURE 4 GLOBAL GAS CYLINDER MARKET: GLOBAL VS REGIONAL MARKET ANALYSIS
FIGURE 5 GLOBAL GAS CYLINDER MARKET: COMPANY RESEARCH ANALYSIS
FIGURE 6 GLOBAL GAS CYLINDER MARKET: THE PRODUCT LIFE LINE CURVE
FIGURE 7 GLOBAL GAS CYLINDER MARKET: MULTIVARIATE MODELLING
FIGURE 8 GLOBAL GAS CYLINDER MARKET: INTERVIEW DEMOGRAPHICS
FIGURE 9 GLOBAL GAS CYLINDER MARKET: DBMR MARKET POSITION GRID
FIGURE 10 GLOBAL GAS CYLINDER MARKET: THE MARKET CHALLENGE MATRIX
FIGURE 11 GLOBAL GAS CYLINDER MARKET: VENDOR SHARE ANALYSIS
FIGURE 12 GLOBAL GAS CYLINDER MARKET: SEGMENTATION
FIGURE 13 ASIA-PACIFIC IS EXPECTED TO DOMINATE THE GLOBAL GAS CYLINDER MARKET, WHILE EUROPE IS EXPECTED TO GROW WITH THE HIGHEST CAGR IN THE FORECAST PERIOD
FIGURE 14 RISE IN THE CONSUMPTION OF LPG CYLINDERS FOR VARIOUS APPLICATIONS IS EXPECTED TO DRIVE GLOBAL GAS CYLINDER MARKET IN THE FORECAST PERIOD
FIGURE 15 STEEL SEGMENT IS EXPECTED TO ACCOUNT FOR THE LARGEST SHARE OF THE GLOBAL GAS CYLINDER MARKET IN 2023 & 2030
FIGURE 16 ASIA-PACIFIC IS THE FASTEST-GROWING MARKET FOR GAS CYLINDER MARKET MANUFACTURERS IN THE FORECAST PERIOD
FIGURE 17 DRIVERS, RESTRAINTS, OPPORTUNITIES AND CHALLENGES OF GLOBAL GAS CYLINDERS MARKET
FIGURE 18 GLOBAL GAS CYLINDER MARKET: BY MATERIAL, 2022
FIGURE 19 GLOBAL GAS CYLINDER MARKET: BY PRODUCT, 2022
FIGURE 20 GLOBAL GAS CYLINDER MARKET: BY WRAP TYPE, 2022
FIGURE 21 GLOBAL GAS CYLINDER MARKET: BY GAS, 2022
FIGURE 22 GLOBAL GAS CYLINDER MARKET: BY APPLICATION, 2022
FIGURE 23 GLOBAL GAS CYLINDER MARKET: SNAPSHOT (2022)
FIGURE 24 GLOBAL GAS CYLINDER MARKET: BY REGION (2022)
FIGURE 25 GLOBAL GAS CYLINDER MARKET: BY REGION (2023 & 2030)
FIGURE 26 GLOBAL GAS CYLINDER MARKET: BY REGION (2022 & 2030)
FIGURE 27 GLOBAL GAS CYLINDER MARKET: BY MATERIAL (2023-2030)
FIGURE 28 ASIA-PACIFIC GAS CYLINDER MARKET: SNAPSHOT (2022)
FIGURE 29 ASIA-PACIFIC GAS CYLINDER MARKET: BY COUNTRY (2022)
FIGURE 30 ASIA-PACIFIC GAS CYLINDER MARKET: BY COUNTRY (2023 & 2030)
FIGURE 31 ASIA-PACIFIC GAS CYLINDER MARKET: BY COUNTRY (2022 & 2030)
FIGURE 32 ASIA-PACIFIC GAS CYLINDER MARKET: BY MATERIAL (2023-2030)
FIGURE 33 EUROPE GAS CYLINDER MARKET: SNAPSHOT (2022)
FIGURE 34 EUROPE GAS CYLINDER MARKET: BY COUNTRY (2022)
FIGURE 35 EUROPE GAS CYLINDER MARKET: BY COUNTRY (2023 & 2030)
FIGURE 36 EUROPE GAS CYLINDER MARKET: BY COUNTRY (2022 & 2030)
FIGURE 37 EUROPE GAS CYLINDER MARKET: BY MATERIAL (2023-2030)
FIGURE 38 NORTH AMERICA GAS CYLINDER MARKET: SNAPSHOT (2022)
FIGURE 39 NORTH AMERICA GAS CYLINDER MARKET: BY COUNTRY (2022)
FIGURE 40 NORTH AMERICA GAS CYLINDER MARKET: BY COUNTRY (2023 & 2030)
FIGURE 41 NORTH AMERICA GAS CYLINDER MARKET: BY COUNTRY (2022 & 2030)
FIGURE 42 NORTH AMERICA GAS CYLINDER MARKET: BY MATERIAL (2023-2030)
FIGURE 43 MIDDLE EAST AND AFRICA GAS CYLINDER MARKET: SNAPSHOT (2022)
FIGURE 44 MIDDLE EAST AND AFRICA GAS CYLINDER MARKET: BY COUNTRY (2022)
FIGURE 45 MIDDLE EAST AND AFRICA GAS CYLINDER MARKET: BY COUNTRY (2023 & 2030)
FIGURE 46 MIDDLE EAST AND AFRICA GAS CYLINDER MARKET: BY COUNTRY (2022 & 2030)
FIGURE 47 MIDDLE EAST AND AFRICA GAS CYLINDER MARKET: BY MATERIAL (2023-2030)
FIGURE 48 SOUTH AMERICA GAS CYLINDER MARKET: SNAPSHOT (2022)
FIGURE 49 SOUTH AMERICA GAS CYLINDER MARKET: BY COUNTRY (2022)
FIGURE 50 SOUTH AMERICA GAS CYLINDER MARKET: BY COUNTRY (2023 & 2030)
FIGURE 51 SOUTH AMERICA GAS CYLINDER MARKET: BY COUNTRY (2022 & 2030)
FIGURE 52 SOUTH AMERICA GAS CYLINDER MARKET: BY MATERIAL (2023-2030)
FIGURE 53 GLOBAL GAS CYLINDER MARKET: COMPANY SHARE 2022 (%)
FIGURE 54 NORTH AMERICA GAS CYLINDER MARKET: COMPANY SHARE 2022 (%)
FIGURE 55 EUROPE GAS CYLINDER MARKET: COMPANY SHARE 2022 (%)
FIGURE 56 ASIA-PACIFIC GAS CYLINDER MARKET: COMPANY SHARE 2022 (%)
Global Gas Cylinder Market, Supply Chain Analysis and Ecosystem Framework
To support market growth and help clients navigate the impact of geopolitical shifts, DBMR has integrated in-depth supply chain analysis into its Global Gas Cylinder Market research reports. This addition empowers clients to respond effectively to global changes affecting their industries. The supply chain analysis section includes detailed insights such as Global Gas Cylinder Market consumption and production by country, price trend analysis, the impact of tariffs and geopolitical developments, and import and export trends by country and HSN code. It also highlights major suppliers with data on production capacity and company profiles, as well as key importers and exporters. In addition to research, DBMR offers specialized supply chain consulting services backed by over a decade of experience, providing solutions like supplier discovery, supplier risk assessment, price trend analysis, impact evaluation of inflation and trade route changes, and comprehensive market trend analysis.
Data collection and base year analysis are done using data collection modules with large sample sizes. The stage includes obtaining market information or related data through various sources and strategies. It includes examining and planning all the data acquired from the past in advance. It likewise envelops the examination of information inconsistencies seen across different information sources. The market data is analysed and estimated using market statistical and coherent models. Also, market share analysis and key trend analysis are the major success factors in the market report. To know more, please request an analyst call or drop down your inquiry.
The key research methodology used by DBMR research team is data triangulation which involves data mining, analysis of the impact of data variables on the market and primary (industry expert) validation. Data models include Vendor Positioning Grid, Market Time Line Analysis, Market Overview and Guide, Company Positioning Grid, Patent Analysis, Pricing Analysis, Company Market Share Analysis, Standards of Measurement, Global versus Regional and Vendor Share Analysis. To know more about the research methodology, drop in an inquiry to speak to our industry experts.
Data Bridge Market Research is a leader in advanced formative research. We take pride in servicing our existing and new customers with data and analysis that match and suits their goal. The report can be customized to include price trend analysis of target brands understanding the market for additional countries (ask for the list of countries), clinical trial results data, literature review, refurbished market and product base analysis. Market analysis of target competitors can be analyzed from technology-based analysis to market portfolio strategies. We can add as many competitors that you require data about in the format and data style you are looking for. Our team of analysts can also provide you data in crude raw excel files pivot tables (Fact book) or can assist you in creating presentations from the data sets available in the report.


