
Global Gene Synthesis Market
Market Size in USD Billion
 USD
3.25 Billion
USD
16.95 Billion
2024
2032
USD
3.25 Billion
USD
16.95 Billion
2024
2032
| 2025 - 2032 | |
| USD 3.25 Billion | |
| USD 16.95 Billion | |
| % | |
|
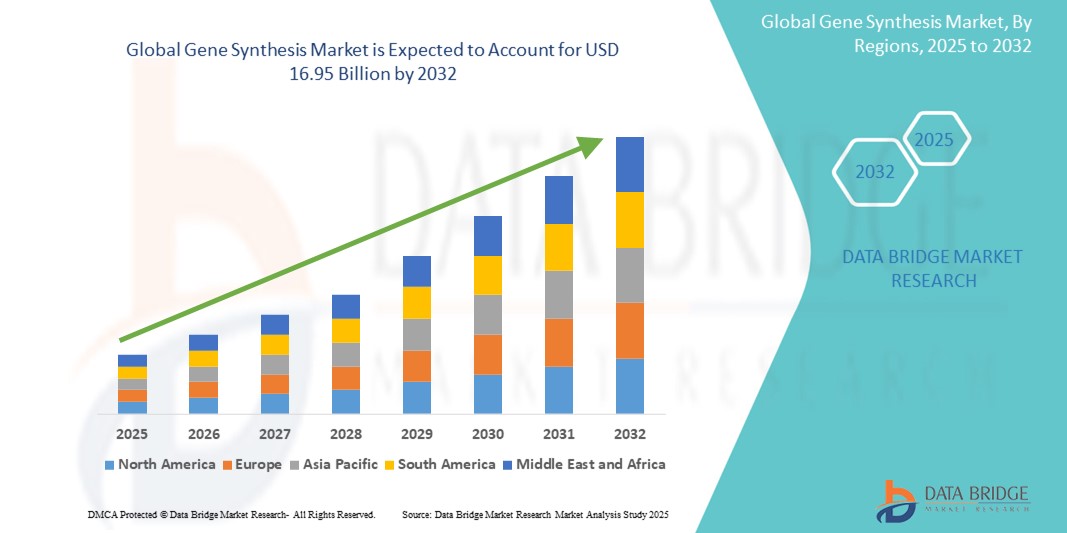
Gene Synthesis Market Size
- The global gene synthesis market was valued at USD 3.25 billion in 2024 and is expected to reach USD 16.95 billion by 2032
- During the forecast period of 2025 to 2032 the market is likely to grow at a CAGR of 22.90%, primarily driven by increasing demand for synthetic biology applications
- This growth is driven by factors such as rising demand for personalized medicine, advancements in CRISPR and gene editing technologies, and expanding applications in pharmaceuticals and biotechnology
Gene Synthesis Market Analysis
- Gene synthesis is a fundamental technology in genetic engineering, enabling the artificial creation of DNA sequences for various applications, including drug development, synthetic biology, and agricultural biotechnology. It plays a crucial role in research and commercial applications by providing customized genetic material
- The demand for gene synthesis is significantly driven by the rising adoption of synthetic biology, advancements in gene editing technologies such as CRISPR, and increasing investments in personalized medicine and biotechnology research. The pharmaceutical and healthcare sectors are key contributors, utilizing gene synthesis for drug discovery, vaccine development, and genetic disorder treatments
- North America stands out as one of the dominant regions for the gene synthesis market, driven by strong Research and Development infrastructure, high biotech industry investments, and government support for genomic research
- For instance, U.S. leads in synthetic biology research and gene synthesis innovations, with numerous biotech startups and established firms developing novel genetic solutions for medical and industrial applications
- Globally, gene synthesis ranks as one of the most critical technologies in genetic and biomedical research, following next-generation sequencing (NGS) systems, and plays a pivotal role in accelerating advancements in precision medicine, biopharmaceutical development, and agricultural genetic engineering
Report Scope and Gene Synthesis Market Segmentation
|
Attributes |
Gene Synthesis Key Market Insights |
|
Segments Covered |
|
|
Countries Covered |
North America
Europe
Asia-Pacific
Middle East and Africa
South America
|
|
Key Market Players |
|
|
Market Opportunities |
|
|
Value Added Data Infosets |
In addition to the insights on market scenarios such as market value, growth rate, segmentation, geographical coverage, and major players, the market reports curated by the Data Bridge Market Research also include import export analysis, production capacity overview, production consumption analysis, price trend analysis, climate change scenario, supply chain analysis, value chain analysis, raw material/consumables overview, vendor selection criteria, PESTLE Analysis, Porter Analysis, and regulatory framework. |
Gene Synthesis Market Trends
“Automation and AI-Driven Gene Synthesis Technologies”
- One prominent trend in the global gene synthesis market is the increasing integration of automation and AI-driven technologies in the gene synthesis process
- These advancements enhance the speed, accuracy, and cost-efficiency of DNA synthesis, enabling researchers to create complex genetic sequences with high precision
- For instance, AI-powered algorithms optimize codon selection and error correction, significantly improving the success rate of synthetic gene assembly, which is crucial for applications in drug discovery, synthetic biology, and genetic engineering
- Automation in gene synthesis also enables high-throughput DNA production, reducing turnaround times and accelerating research in fields such as vaccine development, cancer therapeutics, and bioengineering
- This trend is transforming the gene synthesis industry by making the process more efficient, scalable, and accessible, further driving innovation and expanding its applications across biotechnology and healthcare sectors
Gene Synthesis Market Dynamics
Driver
“Rising Demand for Synthetic Biology and Genetic Research”
- The growing adoption of synthetic biology, genetic engineering, and molecular diagnostics is significantly driving the demand for gene synthesis technologies
- As research in genomics expands, scientists and biotech companies increasingly rely on gene synthesis for applications such as drug development, vaccine production, and gene therapy
- Gene synthesis plays a crucial role in advancing precision medicine, enabling the creation of custom DNA sequences that help develop targeted treatments for genetic disorders, cancer, and infectious diseases
- The ongoing technological advancements, including AI-driven gene synthesis and automation, further highlight the need for high-throughput, cost-effective, and accurate DNA synthesis solutions to accelerate research and clinical applications
- As industries such as pharmaceuticals, agriculture, and bioengineering continue to integrate gene synthesis into their workflows, the demand for scalable and efficient synthesis technologies rises, fostering market growth
For instance,
- In June 2023, according to an article published by the National Center for Biotechnology Information, the synthetic biology market is experiencing rapid expansion, with gene synthesis playing a central role in the development of novel biomaterials, biofuels, and engineered microorganisms, further boosting market demand
- In March 2022, according to the World Health Organization, increasing global investments in genetic research and biotechnology startups have accelerated the adoption of gene synthesis in areas such as vaccine development and pandemic preparedness, strengthening its market position
- As a result of the rising demand for synthetic biology applications, personalized medicine, and advanced genetic research, the need for gene synthesis technologies continues to grow significantly
Opportunity
“Enhancing Genetic Engineering with AI-Driven Gene Synthesis”
- AI-powered gene synthesis technologies can optimize DNA design, improve sequence accuracy, and accelerate the synthesis process, enabling researchers to develop more efficient genetic constructs for applications in medicine, biotechnology, and synthetic biology
- AI algorithms can analyze vast genomic datasets, predict optimal gene sequences, and reduce synthesis errors, allowing for the rapid development of novel therapeutics, including gene therapies, vaccines, and precision medicine solutions
- In addition, AI-driven tools assist in codon optimization, error correction, and protein expression prediction, enhancing the success rate of synthetic genes and reducing overall research and development costs
For instance,
- In February 2024, according to an article published in the Nature Biotechnology Journal, AI-assisted gene synthesis significantly improves the speed and accuracy of synthetic DNA assembly, leading to breakthroughs in engineered cell lines, biopharmaceuticals, and genome editing applications
- In October 2023, according to a report from the National Institutes of Health (NIH), AI-powered bioinformatics tools have been instrumental in designing synthetic genes for CRISPR-based therapies, ensuring precise targeting and minimizing off-target effects, thereby advancing gene editing research
- The integration of AI in gene synthesis can lead to more efficient genetic engineering, faster drug discovery, and improved biotechnological innovations. By leveraging AI-driven synthesis processes, researchers can enhance the scalability and precision of DNA synthesis, opening new avenues for advancements in synthetic biology and personalized medicine.
Restraint/Challenge
“High Costs and Technical Complexity Limiting Accessibility”
- The high cost associated with gene synthesis services and the complexity of synthesizing long or highly accurate DNA sequences present significant challenges, particularly for academic institutions and small biotech firms with limited budgets
- Despite technological advancements, the expenses involved in custom gene design, synthesis, and error correction can be substantial, impacting the affordability and accessibility of these services in cost-sensitive markets
- This financial barrier often leads to delayed project timelines or reduced research scope, especially in developing regions where funding for advanced biotech applications may be limited
For instance,
- In December 2023, according to a report published by GenScript Biotech Corporation, the cost of synthesizing complex genes with high fidelity remains a major challenge for many researchers, with prices ranging significantly depending on gene length, sequence complexity, and turnaround time
- In August 2022, according to the National Human Genome Research Institute (NHGRI), while automation has improved efficiency, the high upfront investment in infrastructure and skilled labor still restricts broader adoption of gene synthesis technologies, especially in low-resource settings
- Consequently, these cost and technical barriers can limit the adoption of gene synthesis, particularly in emerging economies, and may slow the pace of innovation and equitable access to synthetic biology advancements globally
Gene Synthesis Market Scope
The market is segmented on the basis of component, gene type, gene synthesis type, application, method, end user and distribution channel.
|
Segmentation |
Sub-Segmentation |
|
By Component |
|
|
By Gene Type |
|
|
By Gene Synthesis Type |
|
|
By Application
|
|
|
By Method |
|
|
By End User
|
|
|
By Distribution Channel |
|
Gene Synthesis Market Regional Analysis
“North America is the Dominant Region in the Gene Synthesis Market”
- North America leads the global gene synthesis market, supported by a robust biotechnology ecosystem, high Research and development investments, and strong government support for genomics and synthetic biology research
- U.S. holds the largest market share due to the presence of major biotech companies, leading academic institutions, and continuous advancements in gene editing and personalized medicine
- Favorable regulatory frameworks, well-established funding mechanisms, and rapid adoption of innovative technologies further accelerate market growth across the region
- In addition, the increasing applications of gene synthesis in drug discovery, cancer research, and vaccine development, combined with a strong infrastructure for clinical trials and product commercialization, bolster North America’s market dominance
“Asia-Pacific is Projected to Register the Highest Growth Rate”
- Asia-Pacific is expected to experience the fastest growth in the gene synthesis market, fueled by rising government initiatives, expanding biotech industries, and increasing genomic research activities
- Countries such as China, India, and South Korea are becoming key markets, driven by growing demand for genetic testing, synthetic biology applications, and pharmaceutical innovation
- China’s massive investments in biotechnology and synthetic biology, along with its rapidly growing CRO sector, position it as a major hub for gene synthesis services and research
- India’s increasing focus on personalized medicine, combined with cost-effective Research and Development capabilities and a large patient population, is boosting demand for gene synthesis technologies. The rising number of collaborations with international biotech firms and the establishment of research parks further contribute to regional growth
Gene Synthesis Market Share
The market competitive landscape provides details by competitor. Details included are company overview, company financials, revenue generated, market potential, investment in research and development, new market initiatives, global presence, production sites and facilities, production capacities, company strengths and weaknesses, product launch, product width and breadth, application dominance. The above data points provided are only related to the companies' focus related to market.
The Major Market Leaders Operating in the Market Are:
- ATDBio Ltd (U.K.)
- General Biosystems, Inc. (U.S.)
- Macrogen, Inc. (South Korea)
- Boster Biological Technology (U.S.)
- Creative Biogene (U.S.)
- Bioneer Pacific (Austraila)
- exonbio (U.S.)
- trenzyme GmbH (Germany)
- Twist Bioscience (U.S.)
- BioCat GmbH (Germany)
- OriGene Technologies, Inc. (U.S.)
- Integrated DNA Technologies, Inc. (U.S.)
- Eurofins Scientific (Luxembourg)
- NZYTech (Portugal)
- Ansa Biotechnologies (U.S.)
- Thermo Fisher Scientific Inc. (U.S.)
- GenScript (U.S.)
- Synbio Technologies (U.S.)
- ProteoGenix (France)
- Bio Basic Inc. (Canada)
- ATG:biosynthetics GmbH (Germany)
- Merck KGaA (Germany)
- Kaneka Eurogentec S.A. (Belgium)
- Ginkgo Bioworks (U.S.)
- Evonetix (U.K.)
- ProMab (U.S.)
- CSBio (U.S.)
- Azenta US Inc. (U.S.)
Latest Developments in Global Gene Synthesis Market
- In March 2025, Thermo Fisher Scientific launched its next-generation GeneArt Gene Synthesis Service, featuring advanced error correction algorithms and increased throughput capabilities. This new platform aims to accelerate synthetic biology workflows by offering faster turnaround times and enhanced accuracy, catering to high-demand applications in therapeutics and vaccine development
- In January 2025, Twist Bioscience Corporation announced a strategic partnership with Ginkgo Bioworks to co-develop synthetic genes for engineered cell programs. The collaboration focuses on creating high-fidelity DNA sequences for use in bioindustrial manufacturing and pharmaceutical applications, leveraging Twist’s silicon-based DNA synthesis technology
- In November 2024, Codex DNA (now Telesis Bio) introduced the BioXp Select DNA Assembly Kit, a customizable gene synthesis solution designed for rapid, automated construction of synthetic genes and genetic circuits. This development supports researchers in synthetic biology and drug discovery by enabling same-day synthesis and cloning
- In October 2024, GenScript launched its CRISPR-optimized Gene Synthesis Platform, designed to provide high-quality, CRISPR-compatible DNA fragments for genome editing applications. The platform minimizes off-target effects and enhances editing efficiency, offering significant value for gene therapy and functional genomics research
- In August 2024, Integrated DNA Technologies (IDT) announced the expansion of its Ultramer DNA Oligos product line, now supporting longer and more complex gene constructs for advanced molecular biology applications. This development is aimed at researchers requiring ultra-pure, long synthetic DNA for genome assembly, synthetic biology, and personalized medicine
SKU-

- Interactive Data Analysis Dashboard
- Company Analysis Dashboard for high growth potential opportunities
- Research Analyst Access for customization & queries
- Competitor Analysis with Interactive dashboard
- Latest News, Updates & Trend analysis
- Harness the Power of Benchmark Analysis for Comprehensive Competitor Tracking
Table of Content
- introduction
- OBJECTIVES OF THE STUDY
- MARKET DEFINITION
- OVERVIEW of GLOBAL gene synthesis MARKET
- LIMITATIONs
- MARKETS COVERED
- MARKET SEGMENTATION
- MARKETS COVERED
- geographical scope
- years considered for the study
- currency and pricing
- DBMR TRIPOD DATA VALIDATION MODEL
- MULTIVARIATE MODELLING
- product & services LIFELINE CURVE
- primary interviews with key opinion leaders
- DBMR MARKET POSITION GRID
- MARKET APPLICATION COVERAGE GRID
- vendor share analysis
- secondary sourcEs
- assumptions
- EXECUTIVE SUMMARY
- GLOBAL GENE SYNTHESIS MARKET: REGULATIONS
- OTHER STANDARD REGULATIONS IMPLEMENTED WORLDWIDE
- REGULATIONS RELATED TO BIODIVERSITY WHILE USING SYNTHETIC BIOLOGY
- Market Overview
- Drivers
- rising prevalEnce of chronic infectious diseaseS
- rising adoption of gene therapy
- growing interest of gene synthesis in THE field of molecular biology
- favorable government initiatives
- expanding field of synthetic biology
- restraints
- ethical issues associated with genetic engineering
- threat imposed to ecosystem and biodiversity
- lack of trained professionals
- technical limitation across production process
- opportunities
- increased funding towards genomics
- technolOgical advancements
- increasing demand of personalized medicines
- challenges
- long approval process
- lack of well defined patent system
- IMPACT OF COVID-19 ON THE GLOBAL GENE SYNTHESIS MARKET
- Impact ON SUPPLY CHAIN
- IMPACT ON DEMAND
- STRATEGIC DECISION FOR MANUFACTURERS
- Conclusion
- global Gene synthesis MARKET, BY product & services
- overview
- software & services
- consumbles
- Reagents
- Assays
- Probes & Dyes
- Others
- synthesizer
- Column-Based Synthesizers
- Microarray-Based Synthesizers
- global Gene synthesis MARKET, BY gene type
- overview
- standard gene
- complex gene
- express gene
- others
- global Gene synthesis MARKET, BY product type
- overview
- CUSTOM GENE SYNTHESIS
- GENE LIBRARY SYNTHESIS
- global Gene synthesis MARKET, BY application
- overview
- synthetic biology
- genetic engineering
- therapeutic antibodies
- vaccine design
- others
- global Gene synthesis MARKET, BY method
- overview
- pcr based enzyme synthesis
- chip based dna synthesis
- solid based synthesis
- global Gene synthesis MARKET, BY end user
- OVERVIEW
- academic & research institute
- biotech & pharmaceutical companies
- diagnostic laboratories
- others
- global Gene synthesis MARKET, BY distribution channel
- overview
- direct tender
- online distribution
- third party distributors
- Global Gene Synthesis Market by geography
- overview
- NORTH AMERICA
- U.S.
- Canada
- Mexico
- EUROPE
- GERMANY
- U.K.
- ITALY
- SPAIN
- FRANCE
- NETHERLANDS
- RUSSIA
- SWITZERLAND
- TURKEY
- BELGIUM
- IRELAND
- REST OF EUROPE
- ASIA-PACIFIC
- China
- japan
- India
- South KOrea
- Australia
- Singapore
- Malaysia
- Thailand
- Indonesia
- Philippines
- Rest of Asia-Pacific
- SOUTH AMERICA
- BRAZIL
- ARGENTINA
- REST OF SOUTH AMERICA
- MIDDLE EAST AND AFRICA
- SAUDI ARAB
- SOUTH AFRICA
- UAE
- ISRAEL
- EGYPT
- REST OF MIDDLE EAST AND AFRICA
- Global Gene Synthesis Market, COMPANY landscape
- company share analysis: global
- company share analysis: north america
- company share analysis: europe
- company share analysis: Asia-Pacific
- swot analysis
- company profile
- Integrated DNA Technologies, Inc. (A Subsidiary of Danaher)
- COMPANY SNAPSHOT
- REVENUE ANALYSIS
- COMPANY SHARE ANALYSIS
- PRODUCT PORTFOLIO
- RECENT DEVELOPMENTS
- THERMO FISHER SCIENTIFIC INC.
- COMPANY SNAPSHOT
- REVENUE ANALYSIS
- COMPANY SHARE ANALYSIS
- PRODUCT PORTFOLIO
- RECENT DEVELOPMENTS
- MERCK KGAA
- COMPANY SNAPSHOT
- REVENUE ANALYSIS
- COMPANY SHARE ANALYSIS
- PRODUCT PORTFOLIO
- RECENT DEVELOPMENTS
- Eurofins Scientific
- COMPANY SNAPSHOT
- REVENUE ANALYSIS
- COMPANY SHARE ANALYSIS
- SERVICE PORTFOLIO
- RECENT DEVELOPMENT
- Bio Basic Inc.
- COMPANY SNAPSHOT
- PRODUCT PORTFOLIO
- RECENT DEVELOPMENTS
- KANEKA EUROGENTEC S.A.
- COMPANY SNAPSHOT
- PRODUCT PORTFOLIO
- RECENT DEVELOPMENTS
- GENEWIZ (a subsidiary of Brooks Automation, Inc.)
- COMPANY SNAPSHOT
- REVENUE ANALYSIS
- SERVICE PORTFOLIO
- RECENT DEVELOPMENTS
- LGC LIMITED
- COMPANY SNAPSHOT
- PRODUCT PORTFOLIO
- RECENT DEVELOPMENTS
- Creative Biogene
- COMPANY SNAPSHOT
- SERVICE PORTFOLIO
- RECENT DEVELOPMENT
- GenScript
- COMPANY SNAPSHOT
- REVENUE ANALYSIS
- REAGENT SERVICE PORTFOLIO
- RECENT DEVELOPMENT
- Codex DNA, Inc.
- COMPANY SNAPSHOT
- PRODUCT PORTFOLIO
- RECENT DEVELOPMENTS
- BBI-LIFESCIENCES
- COMPANY SNAPSHOT
- REVENUE ANALYSIS
- PRODUCT PORTFOLIO
- RECENT DEVELOPMENT
- Aldevron
- COMPANY SNAPSHOT
- PRODUCT PORTFOLIO
- RECENT DEVELOPMENTS
- ATUM
- COMPANY SNAPSHOT
- SERVICE PORTFOLIO
- RECENT DEVELOPMENTS
- Twist Bioscience
- COMPANY SNAPSHOT
- REVENUE ANALYSIS
- PRODUCT PORTFOLIO
- RECENT DEVELOPMENTS
- BioCat GmbH
- COMPANY SNAPSHOT
- PRODUCT PORTFOLIO
- RECENT DEVELOPMENT
- ATG:biosynthetics GmbH
- COMPANY SNAPSHOT
- PRODUCT PORTFOLIO
- RECENT DEVELOPMENT
- Evonetix
- COMPANY SNAPSHOT
- PLATFORM PORTFOLIO
- RECENT DEVELOPMENTS
- exonbio
- COMPANY SNAPSHOT
- SERVICE PORTFOLIO
- RECENT DEVELOPMENT
- trenzyme GmbH
- COMPANY SNAPSHOT
- SERVICE PORTFOLIO
- RECENT DEVELOPMENT
- questionnaire
- related reports
List of Table
TABLE 1 Global Gene Synthesis Market, By Product & Services, 2019-2028 (USD Million)
TABLE 2 Global Software & Services in Gene Synthesis Market, By Product & Services, 2019-2028 (USD Million)
TABLE 3 Global Consumables in Gene Synthesis Market, By Product & Services, 2019-2028 (USD Million)
TABLE 4 Global Consumables in Gene Synthesis Market, By Product & Services 2019-2028 (USD Million)
TABLE 5 Global Synthesizer in Gene Synthesis Market, By Product & Services, 2019-2028 (USD Million)
TABLE 6 Global Synthesizer in Gene Synthesis Market, By Product & Services 2019-2028 (USD Million)
TABLE 7 Global Gene Synthesis Market, By Gene Type, 2019-2028 (USD Million)
TABLE 8 Global Standard Gene in Gene Synthesis Market, By Gene Type, 2019-2028 (USD Million)
TABLE 9 Global Complex Gene in Gene Synthesis Market, By Gene Type, 2019-2028 (USD Million)
TABLE 10 Global Express Gene in Gene Synthesis Market, By Gene Type, 2019-2028 (USD Million)
TABLE 11 Global Others in Gene Synthesis Market, By Gene Type, 2019-2028 (USD Million)
TABLE 12 Global Gene Synthesis Market, By Product Type, 2019-2028 (USD Million)
TABLE 13 Global Custom Gene Synthesis in Gene Synthesis Market, By Product Type, 2019-2028 (USD Million)
TABLE 14 Global Gene Library Synthesis in Gene Synthesis Market, By Product Type, 2019-2028 (USD Million)
TABLE 15 Global Gene Synthesis Market, By Application, 2019-2028 (USD Million)
TABLE 16 Global Synthetic Biology in Gene Synthesis Market, By Application, 2019-2028 (USD Million)
TABLE 17 Global Genetic Engineering in Gene Synthesis Market, By Application, 2019-2028 (USD Million)
TABLE 18 Global Therapeutic Antibodies in Gene Synthesis Market, By Application, 2019-2028 (USD Million)
TABLE 19 Global Vaccine Design in Gene Synthesis Market, By Application, 2019-2028 (USD Million)
TABLE 20 Global Others in Gene Synthesis Market, By Application, 2019-2028 (USD Million)
TABLE 21 globaL Gene synthesis Market, By method, 2017-2028 (USD Million)
TABLE 22 globaL pcr based enzyme synthesis in Gene synthesis Market, By Region, 2017-2028 (USD Million)
TABLE 23 globaL chip based dna synthesis in Gene synthesis Market, By Region, 2017-2028 (USD Million)
TABLE 24 globaL solid pahse synthesis in Gene synthesis Market, By Region, 2017-2028 (USD Million)
TABLE 25 globaL Gene synthesis Market, By end user, 2017-2028 (USD Million)
TABLE 26 globaL academic & research institute in Gene synthesis Market, By Region, 2017-2028 (USD Million)
TABLE 27 globaL Biotech & pharmaceutical companies in Gene synthesis Market, By Region, 2017-2028 (USD Million)
TABLE 28 globaL diagnostic laboratory in Gene synthesis Market, By Region, 2017-2028 (USD Million)
TABLE 29 globaL others in Gene synthesis Market, By Region, 2017-2028 (USD Million)
TABLE 30 globaL Gene synthesis Market, By distribution channel, 2017-2028 (USD Million)
TABLE 31 globaL direct tender in Gene synthesis Market, By Region, 2017-2028 (USD Million)
TABLE 32 globaL online distribution in Gene synthesis Market, By Region, 2017-2028 (USD Million)
TABLE 33 globaL third party distributor in Gene synthesis Market, By Region, 2017-2028 (USD Million)
TABLE 34 GLOBAL Gene SynthesisMARKET, BY REGION , 2021-2028 (USD MILLION)
TABLE 35 North AMERICA GENE SYNTHESIS MARKET, By Region, 2019-2028 (USD Million)
TABLE 36 NORTH AMERICA GENE SYNTHESIS MARKET, By Product & sERVICES, 2019-2028 (USD Million)
TABLE 37 NORTH AMERICA CONSUMABLES IN GENE SYNTHESIS MARKET, By PRODUCTS & SERVICES 2019-2028 (USD Million)
TABLE 38 NORTH AMERICA SYNTHESIZER in GENE SYNTHESIS MARKET, By PRODUCTS & SERVICES, 2019-2028 (USD Million)
TABLE 39 NORTH AMERICA GENE SYNTHESIS MARKET, By GENE TYPE, 2019-2028 (USD Million)
TABLE 40 NORTH AMERICA GENE SYNTHESIS MARKET, By PRODUCT TYPE, 2019-2028 (USD Million)
TABLE 41 NORTH AMERICA GENE SYNTHESIS MARKET, By APPLICATION, 2019-2028 (USD Million)
TABLE 42 NORTH AMERICA GENE SYNTHESIS MARKET, By METHOD, 2019-2028 (USD Million)
TABLE 43 NORTH AMERICA GENE SYNTHESIS MARKET, By END USER, 2019-2028 (USD Million)
TABLE 44 NORTH AMERICA GENE SYNTHESIS MARKET, By DISTRIBUTION CHANNEL, 2019-2028 (USD Million)
TABLE 45 U.S. GENE SYNTHESIS MARKET, By Product & sERVICES, 2019-2028 (USD Million)
TABLE 46 U.S. CONSUMABLES IN GENE SYNTHESIS MARKET, By PRODUCTS & SERVICES 2019-2028 (USD Million)
TABLE 47 U.S. SYNTHESIZER in GENE SYNTHESIS MARKET, By PRODUCTS & SERVICES, 2019-2028 (USD Million)
TABLE 48 U.S. GENE SYNTHESIS MARKET, By GENE TYPE, 2019-2028 (USD Million)
TABLE 49 U.S. GENE SYNTHESIS MARKET, By PRODUCT TYPE, 2019-2028 (USD Million)
TABLE 50 U.S. GENE SYNTHESIS MARKET, By APPLICATION, 2019-2028 (USD Million)
TABLE 51 U.S. GENE SYNTHESIS MARKET, By METHOD, 2019-2028 (USD Million)
TABLE 52 U.S. GENE SYNTHESIS MARKET, By END USER, 2019-2028 (USD Million)
TABLE 53 U.S. GENE SYNTHESIS MARKET, By DISTRIBUTION CHANNEL, 2019-2028 (USD Million)
TABLE 54 CANADA GENE SYNTHESIS MARKET, By Product & sERVICES, 2019-2028 (USD Million)
TABLE 55 CANADA CONSUMABLES IN GENE SYNTHESIS MARKET, By PRODUCTS & SERVICES 2019-2028 (USD Million)
TABLE 56 CANADA SYNTHESIZER in GENE SYNTHESIS MARKET, By PRODUCTS & SERVICES, 2019-2028 (USD Million)
TABLE 57 CANADA GENE SYNTHESIS MARKET, By GENE TYPE, 2019-2028 (USD Million)
TABLE 58 CANADA GENE SYNTHESIS MARKET, By PRODUCT TYPE, 2019-2028 (USD Million)
TABLE 59 CANADA GENE SYNTHESIS MARKET, By APPLICATION, 2019-2028 (USD Million)
TABLE 60 CANADA GENE SYNTHESIS MARKET, By METHOD, 2019-2028 (USD Million)
TABLE 61 CANADA GENE SYNTHESIS MARKET, By END USER, 2019-2028 (USD Million)
TABLE 62 CANADA GENE SYNTHESIS MARKET, By DISTRIBUTION CHANNEL, 2019-2028 (USD Million)
TABLE 63 MEXICO GENE SYNTHESIS MARKET, By Product & sERVICES, 2019-2028 (USD Million)
TABLE 64 MEXICO CONSUMABLES IN GENE SYNTHESIS MARKET, By PRODUCTS & SERVICES 2019-2028 (USD Million)
TABLE 65 MEXICO SYNTHESIZER in GENE SYNTHESIS MARKET, By PRODUCTS & SERVICES, 2019-2028 (USD Million)
TABLE 66 MEXICO GENE SYNTHESIS MARKET, By GENE TYPE, 2019-2028 (USD Million)
TABLE 67 MEXICO GENE SYNTHESIS MARKET, By PRODUCT TYPE, 2019-2028 (USD Million)
TABLE 68 MEXICO GENE SYNTHESIS MARKET, By APPLICATION, 2019-2028 (USD Million)
TABLE 69 MEXICO GENE SYNTHESIS MARKET, By METHOD, 2019-2028 (USD Million)
TABLE 70 MEXICO GENE SYNTHESIS MARKET, By END USER, 2019-2028 (USD Million)
TABLE 71 MEXICO GENE SYNTHESIS MARKET, By DISTRIBUTION CHANNEL, 2019-2028 (USD Million)
TABLE 72 Europe Gene synthesis Market, By Region, 2019-2028 (USD Million)
TABLE 73 Europe Gene Synthesis Market, By Product & Services, 2019-2028 (USD Million)
TABLE 74 Europe Consumables in Gene Synthesis Market, By Product & Services 2019-2028 (USD Million)
TABLE 75 Europe Synthesizer in Gene Synthesis Market, By Product & Services 2019-2028 (USD Million)
TABLE 76 Europe Gene Synthesis Market, By Gene Type, 2019-2028 (USD Million)
TABLE 77 Europe Gene Synthesis Market, By Product Type, 2019-2028 (USD Million)
TABLE 78 Europe Gene Synthesis Market, By Application, 2019-2028 (USD Million)
TABLE 79 Europe Gene Synthesis Market, By Method, 2019-2028 (USD Million)
TABLE 80 Europe Gene Synthesis Market, By End User, 2019-2028 (USD Million)
TABLE 81 Europe Gene Synthesis Market, By Distribution Channel, 2019-2028 (USD Million)
TABLE 82 Germany Gene Synthesis Market, By Product & Services, 2019-2028 (USD Million)
TABLE 83 Germany Consumables in Gene Synthesis Market, By Product & Services 2019-2028 (USD Million)
TABLE 84 Germany Synthesizer in Gene Synthesis Market, By Product & Services 2019-2028 (USD Million)
TABLE 85 Germany Gene Synthesis Market, By Gene Type, 2019-2028 (USD Million)
TABLE 86 Germany Gene Synthesis Market, By Product Type, 2019-2028 (USD Million)
TABLE 87 Germany Gene Synthesis Market, By Application, 2019-2028 (USD Million)
TABLE 88 Germany Gene Synthesis Market, By Method, 2019-2028 (USD Million)
TABLE 89 Germany Gene Synthesis Market, By End User, 2019-2028 (USD Million)
TABLE 90 Germany Gene Synthesis Market, By Distribution Channel, 2019-2028 (USD Million)
TABLE 91 U.K Gene Synthesis Market, By Product & Services, 2019-2028 (USD Million)
TABLE 92 U.K Consumables in Gene Synthesis Market, By Product & Services 2019-2028 (USD Million)
TABLE 93 U.K Synthesizer in Gene Synthesis Market, By Product & Services 2019-2028 (USD Million)
TABLE 94 U.K Gene Synthesis Market, By Gene Type, 2019-2028 (USD Million)
TABLE 95 U.K Gene Synthesis Market, By Product Type, 2019-2028 (USD Million)
TABLE 96 U.K Gene Synthesis Market, By Application, 2019-2028 (USD Million)
TABLE 97 U.K Gene Synthesis Market, By Method, 2019-2028 (USD Million)
TABLE 98 U.K Gene Synthesis Market, By End User, 2019-2028 (USD Million)
TABLE 99 U.K Gene Synthesis Market, By Distribution Channel, 2019-2028 (USD Million)
TABLE 100 ITALY Gene Synthesis Market, By Product & Services, 2019-2028 (USD Million)
TABLE 101 ITALY Consumables in Gene Synthesis Market, By Product & Services 2019-2028 (USD Million)
TABLE 102 ITALY Synthesizer in Gene Synthesis Market, By Product & Services 2019-2028 (USD Million)
TABLE 103 ITALY Gene Synthesis Market, By Gene Type, 2019-2028 (USD Million)
TABLE 104 ITALY Gene Synthesis Market, By Product Type, 2019-2028 (USD Million)
TABLE 105 ITALY Gene Synthesis Market, By Application, 2019-2028 (USD Million)
TABLE 106 ITALY Gene Synthesis Market, By Method, 2019-2028 (USD Million)
TABLE 107 ITALY Gene Synthesis Market, By End User, 2019-2028 (USD Million)
TABLE 108 ITALY Gene Synthesis Market, By Distribution Channel, 2019-2028 (USD Million)
TABLE 109 SPAIN Gene Synthesis Market, By Product & Services, 2019-2028 (USD Million)
TABLE 110 SPAIN Consumables in Gene Synthesis Market, By Product & Services 2019-2028 (USD Million)
TABLE 111 SPAIN Synthesizer in Gene Synthesis Market, By Product & Services 2019-2028 (USD Million)
TABLE 112 SPAIN Gene Synthesis Market, By Gene Type, 2019-2028 (USD Million)
TABLE 113 SPAIN Gene Synthesis Market, By Product Type, 2019-2028 (USD Million)
TABLE 114 SPAIN Gene Synthesis Market, By Application, 2019-2028 (USD Million)
TABLE 115 SPAIN Gene Synthesis Market, By Method, 2019-2028 (USD Million)
TABLE 116 SPAIN Gene Synthesis Market, By End User, 2019-2028 (USD Million)
TABLE 117 SPAIN Gene Synthesis Market, By Distribution Channel, 2019-2028 (USD Million)
TABLE 118 FRANCE Gene Synthesis Market, By Product & Services, 2019-2028 (USD Million)
TABLE 119 FRANCE Consumables in Gene Synthesis Market, By Product & Services 2019-2028 (USD Million)
TABLE 120 FRANCE Synthesizer in Gene Synthesis Market, By Product & Services 2019-2028 (USD Million)
TABLE 121 FRANCE Gene Synthesis Market, By Gene Type, 2019-2028 (USD Million)
TABLE 122 FRANCE Gene Synthesis Market, By Product Type, 2019-2028 (USD Million)
TABLE 123 FRANCE Gene Synthesis Market, By Application, 2019-2028 (USD Million)
TABLE 124 FRANCE Gene Synthesis Market, By Method, 2019-2028 (USD Million)
TABLE 125 FRANCE Gene Synthesis Market, By End User, 2019-2028 (USD Million)
TABLE 126 FRANCE Gene Synthesis Market, By Distribution Channel, 2019-2028 (USD Million)
TABLE 127 NETHERLANDS Gene Synthesis Market, By Product & Services, 2019-2028 (USD Million)
TABLE 128 NETHERLANDS Consumables in Gene Synthesis Market, By Product & Services 2019-2028 (USD Million)
TABLE 129 NETHERLANDS Synthesizer in Gene Synthesis Market, By Product & Services 2019-2028 (USD Million)
TABLE 130 NETHERLANDS Gene Synthesis Market, By Gene Type, 2019-2028 (USD Million)
TABLE 131 NETHERLANDS Gene Synthesis Market, By Product Type, 2019-2028 (USD Million)
TABLE 132 NETHERLANDS Gene Synthesis Market, By Application, 2019-2028 (USD Million)
TABLE 133 NETHERLANDS Gene Synthesis Market, By Method, 2019-2028 (USD Million)
TABLE 134 NETHERLANDS Gene Synthesis Market, By End User, 2019-2028 (USD Million)
TABLE 135 NETHERLANDS Gene Synthesis Market, By Distribution Channel, 2019-2028 (USD Million)
TABLE 136 RUSSIA Gene Synthesis Market, By Product & Services, 2019-2028 (USD Million)
TABLE 137 RUSSIA Consumables in Gene Synthesis Market, By Product & Services 2019-2028 (USD Million)
TABLE 138 RUSSIA Synthesizer in Gene Synthesis Market, By Product & Services 2019-2028 (USD Million)
TABLE 139 RUSSIA Gene Synthesis Market, By Gene Type, 2019-2028 (USD Million)
TABLE 140 RUSSIA Gene Synthesis Market, By Product Type, 2019-2028 (USD Million)
TABLE 141 RUSSIA Gene Synthesis Market, By Application, 2019-2028 (USD Million)
TABLE 142 RUSSIA Gene Synthesis Market, By Method, 2019-2028 (USD Million)
TABLE 143 RUSSIA Gene Synthesis Market, By End User, 2019-2028 (USD Million)
TABLE 144 RUSSIA Gene Synthesis Market, By Distribution Channel, 2019-2028 (USD Million)
TABLE 145 SWITZERLAND Gene Synthesis Market, By Product & Services, 2019-2028 (USD Million)
TABLE 146 SWITZERLAND Consumables in Gene Synthesis Market, By Product & Services 2019-2028 (USD Million)
TABLE 147 SWITZERLAND Synthesizer in Gene Synthesis Market, By Product & Services 2019-2028 (USD Million)
TABLE 148 SWITZERLAND Gene Synthesis Market, By Gene Type, 2019-2028 (USD Million)
TABLE 149 SWITZERLAND Gene Synthesis Market, By Product Type, 2019-2028 (USD Million)
TABLE 150 SWITZERLAND Gene Synthesis Market, By Application, 2019-2028 (USD Million)
TABLE 151 SWITZERLAND Gene Synthesis Market, By Method, 2019-2028 (USD Million)
TABLE 152 SWITZERLAND Gene Synthesis Market, By End User, 2019-2028 (USD Million)
TABLE 153 SWITZERLAND Gene Synthesis Market, By Distribution Channel, 2019-2028 (USD Million)
TABLE 154 TURKEY Gene Synthesis Market, By Product & Services, 2019-2028 (USD Million)
TABLE 155 TURKEY Consumables in Gene Synthesis Market, By Product & Services 2019-2028 (USD Million)
TABLE 156 TURKEY Synthesizer in Gene Synthesis Market, By Product & Services 2019-2028 (USD Million)
TABLE 157 TURKEY Gene Synthesis Market, By Gene Type, 2019-2028 (USD Million)
TABLE 158 TURKEY Gene Synthesis Market, By Product Type, 2019-2028 (USD Million)
TABLE 159 TURKEY Gene Synthesis Market, By Application, 2019-2028 (USD Million)
TABLE 160 TURKEY Gene Synthesis Market, By Method, 2019-2028 (USD Million)
TABLE 161 TURKEY Gene Synthesis Market, By End User, 2019-2028 (USD Million)
TABLE 162 TURKEY Gene Synthesis Market, By Distribution Channel, 2019-2028 (USD Million)
TABLE 163 BELGIUM Gene Synthesis Market, By Product & Services, 2019-2028 (USD Million)
TABLE 164 BELGIUM Consumables in Gene Synthesis Market, By Product & Services 2019-2028 (USD Million)
TABLE 165 BELGIUM Synthesizer in Gene Synthesis Market, By Product & Services 2019-2028 (USD Million)
TABLE 166 BELGIUM Gene Synthesis Market, By Gene Type, 2019-2028 (USD Million)
TABLE 167 BELGIUM Gene Synthesis Market, By Product Type, 2019-2028 (USD Million)
TABLE 168 BELGIUM Gene Synthesis Market, By Application, 2019-2028 (USD Million)
TABLE 169 BELGIUM Gene Synthesis Market, By Method, 2019-2028 (USD Million)
TABLE 170 BELGIUM Gene Synthesis Market, By End User, 2019-2028 (USD Million)
TABLE 171 BELGIUM Gene Synthesis Market, By Distribution Channel, 2019-2028 (USD Million)
TABLE 172 IRELAND Gene Synthesis Market, By Product & Services, 2019-2028 (USD Million)
TABLE 173 IRELAND Consumables in Gene Synthesis Market, By Product & Services 2019-2028 (USD Million)
TABLE 174 IRELAND Synthesizer in Gene Synthesis Market, By Product & Services 2019-2028 (USD Million)
TABLE 175 IRELAND Gene Synthesis Market, By Gene Type, 2019-2028 (USD Million)
TABLE 176 IRELAND Gene Synthesis Market, By Product Type, 2019-2028 (USD Million)
TABLE 177 IRELAND Gene Synthesis Market, By Application, 2019-2028 (USD Million)
TABLE 178 IRELAND Gene Synthesis Market, By Method, 2019-2028 (USD Million)
TABLE 179 IRELAND Gene Synthesis Market, By End User, 2019-2028 (USD Million)
TABLE 180 IRELAND Gene Synthesis Market, By Distribution Channel, 2019-2028 (USD Million)
TABLE 181 Rest of Europe Gene Synthesis Market, By Product & Services, 2019-2028 (USD Million)
TABLE 182 Asia-Pacific GENE SYNTHESIS MARKET, By Region, 2019-2028 (USD Million)
TABLE 183 ASIA-PACIFIC GENE SYNTHESIS MARKET, By Product & sERVICES, 2019-2028 (USD Million)
TABLE 184 ASIA-PACIFIC CONSUMABLES IN GENE SYNTHESIS MARKET, By PRODUCTS & SERVICES 2019-2028 (USD Million)
TABLE 185 ASIA-PACIFIC SYNTHESIZER in GENE SYNTHESIS MARKET, By PRODUCTS & SERVICES, 2019-2028 (USD Million)
TABLE 186 ASIA-PACIFIC GENE SYNTHESIS MARKET, By GENE TYPE, 2019-2028 (USD Million)
TABLE 187 ASIA-PACIFIC GENE SYNTHESIS MARKET, By PRODUCT TYPE, 2019-2028 (USD Million)
TABLE 188 ASIA-PACIFIC GENE SYNTHESIS MARKET, By APPLICATION, 2019-2028 (USD Million)
TABLE 189 ASIA-PACIFIC GENE SYNTHESIS MARKET, By METHOD, 2019-2028 (USD Million)
TABLE 190 ASIA-PACIFIC GENE SYNTHESIS MARKET, By END USER, 2019-2028 (USD Million)
TABLE 191 ASIA-PACIFIC GENE SYNTHESIS MARKET, By DISTRIBUTION CHANNEL, 2019-2028 (USD Million)
TABLE 192 CHINA GENE SYNTHESIS MARKET, By Product & sERVICES, 2019-2028 (USD Million)
TABLE 193 CHINA CONSUMABLES IN GENE SYNTHESIS MARKET, By PRODUCTS & SERVICES 2019-2028 (USD Million)
TABLE 194 CHINA SYNTHESIZER in GENE SYNTHESIS MARKET, By PRODUCTS & SERVICES, 2019-2028 (USD Million)
TABLE 195 CHINA GENE SYNTHESIS MARKET, By GENE TYPE, 2019-2028 (USD Million)
TABLE 196 CHINA GENE SYNTHESIS MARKET, By PRODUCT TYPE, 2019-2028 (USD Million)
TABLE 197 CHINA GENE SYNTHESIS MARKET, By APPLICATION, 2019-2028 (USD Million)
TABLE 198 CHINA GENE SYNTHESIS MARKET, By METHOD, 2019-2028 (USD Million)
TABLE 199 CHINA GENE SYNTHESIS MARKET, By END USER, 2019-2028 (USD Million)
TABLE 200 CHINA GENE SYNTHESIS MARKET, By DISTRIBUTION CHANNEL, 2019-2028 (USD Million)
TABLE 201 JAPAN GENE SYNTHESIS MARKET, By Product & sERVICES, 2019-2028 (USD Million)
TABLE 202 JAPAN CONSUMABLES IN GENE SYNTHESIS MARKET, By PRODUCTS & SERVICES 2019-2028 (USD Million)
TABLE 203 JAPAN SYNTHESIZER in GENE SYNTHESIS MARKET, By PRODUCTS & SERVICES, 2019-2028 (USD Million)
TABLE 204 JAPAN GENE SYNTHESIS MARKET, By GENE TYPE, 2019-2028 (USD Million)
TABLE 205 JAPAN GENE SYNTHESIS MARKET, By PRODUCT TYPE, 2019-2028 (USD Million)
TABLE 206 JAPAN GENE SYNTHESIS MARKET, By APPLICATION, 2019-2028 (USD Million)
TABLE 207 JAPAN GENE SYNTHESIS MARKET, By METHOD, 2019-2028 (USD Million)
TABLE 208 JAPAN GENE SYNTHESIS MARKET, By END USER, 2019-2028 (USD Million)
TABLE 209 JAPAN GENE SYNTHESIS MARKET, By DISTRIBUTION CHANNEL, 2019-2028 (USD Million)
TABLE 210 INDIA GENE SYNTHESIS MARKET, By Product & sERVICES, 2019-2028 (USD Million)
TABLE 211 INDIA CONSUMABLES IN GENE SYNTHESIS MARKET, By PRODUCTS & SERVICES 2019-2028 (USD Million)
TABLE 212 INDIA SYNTHESIZER in GENE SYNTHESIS MARKET, By PRODUCTS & SERVICES, 2019-2028 (USD Million)
TABLE 213 INDIA GENE SYNTHESIS MARKET, By GENE TYPE, 2019-2028 (USD Million)
TABLE 214 INDIA GENE SYNTHESIS MARKET, By PRODUCT TYPE, 2019-2028 (USD Million)
TABLE 215 INDIA GENE SYNTHESIS MARKET, By APPLICATION, 2019-2028 (USD Million)
TABLE 216 INDIA GENE SYNTHESIS MARKET, By METHOD, 2019-2028 (USD Million)
TABLE 217 INDIA GENE SYNTHESIS MARKET, By END USER, 2019-2028 (USD Million)
TABLE 218 INDIA GENE SYNTHESIS MARKET, By DISTRIBUTION CHANNEL, 2019-2028 (USD Million)
TABLE 219 SOUTH KOREA GENE SYNTHESIS MARKET, By Product & sERVICES, 2019-2028 (USD Million)
TABLE 220 SOUTH KOREA CONSUMABLES IN GENE SYNTHESIS MARKET, By PRODUCTS & SERVICES 2019-2028 (USD Million)
TABLE 221 SOUTH KOREA SYNTHESIZER in GENE SYNTHESIS MARKET, By PRODUCTS & SERVICES, 2019-2028 (USD Million)
TABLE 222 SOUTH KOREA GENE SYNTHESIS MARKET, By GENE TYPE, 2019-2028 (USD Million)
TABLE 223 SOUTH KOREA GENE SYNTHESIS MARKET, By PRODUCT TYPE, 2019-2028 (USD Million)
TABLE 224 SOUTH KOREA GENE SYNTHESIS MARKET, By APPLICATION, 2019-2028 (USD Million)
TABLE 225 SOUTH KOREA GENE SYNTHESIS MARKET, By METHOD, 2019-2028 (USD Million)
TABLE 226 SOUTH KOREA GENE SYNTHESIS MARKET, By END USER, 2019-2028 (USD Million)
TABLE 227 SOUTH KOREA GENE SYNTHESIS MARKET, By DISTRIBUTION CHANNEL, 2019-2028 (USD Million)
TABLE 228 AUSTRALIA GENE SYNTHESIS MARKET, By Product & sERVICES, 2019-2028 (USD Million)
TABLE 229 AUSTRALIA CONSUMABLES IN GENE SYNTHESIS MARKET, By PRODUCTS & SERVICES 2019-2028 (USD Million)
TABLE 230 AUSTRALIA SYNTHESIZER in GENE SYNTHESIS MARKET, By PRODUCTS & SERVICES, 2019-2028 (USD Million)
TABLE 231 AUSTRALIA GENE SYNTHESIS MARKET, By GENE TYPE, 2019-2028 (USD Million)
TABLE 232 AUSTRALIA GENE SYNTHESIS MARKET, By PRODUCT TYPE, 2019-2028 (USD Million)
TABLE 233 AUSTRALIA GENE SYNTHESIS MARKET, By APPLICATION, 2019-2028 (USD Million)
TABLE 234 AUSTRALIA GENE SYNTHESIS MARKET, By METHOD, 2019-2028 (USD Million)
TABLE 235 AUSTRALIA GENE SYNTHESIS MARKET, By END USER, 2019-2028 (USD Million)
TABLE 236 AUSTRALIA GENE SYNTHESIS MARKET, By DISTRIBUTION CHANNEL, 2019-2028 (USD Million)
TABLE 237 SINGAPORE GENE SYNTHESIS MARKET, By Product & sERVICES, 2019-2028 (USD Million)
TABLE 238 SINGAPORE CONSUMABLES IN GENE SYNTHESIS MARKET, By PRODUCTS & SERVICES 2019-2028 (USD Million)
TABLE 239 SINGAPORE SYNTHESIZER in GENE SYNTHESIS MARKET, By PRODUCTS & SERVICES, 2019-2028 (USD Million)
TABLE 240 SINGAPORE GENE SYNTHESIS MARKET, By GENE TYPE, 2019-2028 (USD Million)
TABLE 241 SINGAPORE GENE SYNTHESIS MARKET, By PRODUCT TYPE, 2019-2028 (USD Million)
TABLE 242 SINGAPORE GENE SYNTHESIS MARKET, By APPLICATION, 2019-2028 (USD Million)
TABLE 243 SINGAPORE GENE SYNTHESIS MARKET, By METHOD, 2019-2028 (USD Million)
TABLE 244 SINGAPORE GENE SYNTHESIS MARKET, By END USER, 2019-2028 (USD Million)
TABLE 245 SINGAPORE GENE SYNTHESIS MARKET, By DISTRIBUTION CHANNEL, 2019-2028 (USD Million)
TABLE 246 MALAYSIA GENE SYNTHESIS MARKET, By Product & sERVICES, 2019-2028 (USD Million)
TABLE 247 MALAYSIA CONSUMABLES IN GENE SYNTHESIS MARKET, By PRODUCTS & SERVICES 2019-2028 (USD Million)
TABLE 248 MALAYSIA SYNTHESIZER in GENE SYNTHESIS MARKET, By PRODUCTS & SERVICES, 2019-2028 (USD Million)
TABLE 249 MALAYSIA GENE SYNTHESIS MARKET, By GENE TYPE, 2019-2028 (USD Million)
TABLE 250 MALAYSIA GENE SYNTHESIS MARKET, By PRODUCT TYPE, 2019-2028 (USD Million)
TABLE 251 MALAYSIA GENE SYNTHESIS MARKET, By APPLICATION, 2019-2028 (USD Million)
TABLE 252 MALAYSIA GENE SYNTHESIS MARKET, By METHOD, 2019-2028 (USD Million)
TABLE 253 MALAYSIA GENE SYNTHESIS MARKET, By END USER, 2019-2028 (USD Million)
TABLE 254 MALAYSIA GENE SYNTHESIS MARKET, By DISTRIBUTION CHANNEL, 2019-2028 (USD Million)
TABLE 255 THAILAND GENE SYNTHESIS MARKET, By Product & sERVICES, 2019-2028 (USD Million)
TABLE 256 THAILAND CONSUMABLES IN GENE SYNTHESIS MARKET, By PRODUCTS & SERVICES 2019-2028 (USD Million)
TABLE 257 THAILAND SYNTHESIZER in GENE SYNTHESIS MARKET, By PRODUCTS & SERVICES, 2019-2028 (USD Million)
TABLE 258 THAILAND GENE SYNTHESIS MARKET, By GENE TYPE, 2019-2028 (USD Million)
TABLE 259 THAILAND GENE SYNTHESIS MARKET, By PRODUCT TYPE, 2019-2028 (USD Million)
TABLE 260 THAILAND GENE SYNTHESIS MARKET, By APPLICATION, 2019-2028 (USD Million)
TABLE 261 THAILAND GENE SYNTHESIS MARKET, By METHOD, 2019-2028 (USD Million)
TABLE 262 THAILAND GENE SYNTHESIS MARKET, By END USER, 2019-2028 (USD Million)
TABLE 263 THAILAND GENE SYNTHESIS MARKET, By DISTRIBUTION CHANNEL, 2019-2028 (USD Million)
TABLE 264 INDONESIA GENE SYNTHESIS MARKET, By Product & sERVICES, 2019-2028 (USD Million)
TABLE 265 INDONESIA CONSUMABLES IN GENE SYNTHESIS MARKET, By PRODUCTS & SERVICES 2019-2028 (USD Million)
TABLE 266 INDONESIA SYNTHESIZER in GENE SYNTHESIS MARKET, By PRODUCTS & SERVICES, 2019-2028 (USD Million)
TABLE 267 INDONESIA GENE SYNTHESIS MARKET, By GENE TYPE, 2019-2028 (USD Million)
TABLE 268 INDONESIA GENE SYNTHESIS MARKET, By PRODUCT TYPE, 2019-2028 (USD Million)
TABLE 269 INDONESIA GENE SYNTHESIS MARKET, By APPLICATION, 2019-2028 (USD Million)
TABLE 270 INDONESIA GENE SYNTHESIS MARKET, By METHOD, 2019-2028 (USD Million)
TABLE 271 INDONESIA GENE SYNTHESIS MARKET, By END USER, 2019-2028 (USD Million)
TABLE 272 INDONESIA GENE SYNTHESIS MARKET, By DISTRIBUTION CHANNEL, 2019-2028 (USD Million)
TABLE 273 PHILIPPINES GENE SYNTHESIS MARKET, By Product & sERVICES, 2019-2028 (USD Million)
TABLE 274 PHILIPPINES CONSUMABLES IN GENE SYNTHESIS MARKET, By PRODUCTS & SERVICES 2019-2028 (USD Million)
TABLE 275 PHILIPPINES SYNTHESIZER in GENE SYNTHESIS MARKET, By PRODUCTS & SERVICES, 2019-2028 (USD Million)
TABLE 276 PHILIPPINES GENE SYNTHESIS MARKET, By GENE TYPE, 2019-2028 (USD Million)
TABLE 277 PHILIPPINES GENE SYNTHESIS MARKET, By PRODUCT TYPE, 2019-2028 (USD Million)
TABLE 278 PHILIPPINES GENE SYNTHESIS MARKET, By APPLICATION, 2019-2028 (USD Million)
TABLE 279 PHILIPPINES GENE SYNTHESIS MARKET, By METHOD, 2019-2028 (USD Million)
TABLE 280 PHILIPPINES GENE SYNTHESIS MARKET, By END USER, 2019-2028 (USD Million)
TABLE 281 PHILIPPINES GENE SYNTHESIS MARKET, By DISTRIBUTION CHANNEL, 2019-2028 (USD Million)
TABLE 282 Rest of Asia-Pacific GENE SYNTHESIS MARKET, By Product & sERVICES, 2019-2028 (USD Million)
TABLE 283 South AMERICA GENE SYNTHESIS MARKET, By Region, 2019-2028 (USD Million)
TABLE 284 SOUTH AMERICA GENE SYNTHESIS MARKET, By Product & sERVICES, 2019-2028 (USD Million)
TABLE 285 SOUTH AMERICA CONSUMABLES IN GENE SYNTHESIS MARKET, By PRODUCTS & SERVICES 2019-2028 (USD Million)
TABLE 286 SOUTH AMERICA SYNTHESIZER in GENE SYNTHESIS MARKET, By PRODUCTS & SERVICES, 2019-2028 (USD Million)
TABLE 287 SOUTH AMERICA GENE SYNTHESIS MARKET, By GENE TYPE, 2019-2028 (USD Million)
TABLE 288 SOUTH AMERICA GENE SYNTHESIS MARKET, By PRODUCT TYPE, 2019-2028 (USD Million)
TABLE 289 SOUTH AMERICA GENE SYNTHESIS MARKET, By APPLICATION, 2019-2028 (USD Million)
TABLE 290 SOUTH AMERICA GENE SYNTHESIS MARKET, By METHOD, 2019-2028 (USD Million)
TABLE 291 SOUTH AMERICA GENE SYNTHESIS MARKET, By END USER, 2019-2028 (USD Million)
TABLE 292 SOUTH AMERICA GENE SYNTHESIS MARKET, By DISTRIBUTION CHANNEL, 2019-2028 (USD Million)
TABLE 293 BRAZIL GENE SYNTHESIS MARKET, By Product & sERVICES, 2019-2028 (USD Million)
TABLE 294 BRAZIL CONSUMABLES IN GENE SYNTHESIS MARKET, By PRODUCTS & SERVICES 2019-2028 (USD Million)
TABLE 295 BRAZIL SYNTHESIZER in GENE SYNTHESIS MARKET, By PRODUCTS & SERVICES, 2019-2028 (USD Million)
TABLE 296 BRAZIL GENE SYNTHESIS MARKET, By GENE TYPE, 2019-2028 (USD Million)
TABLE 297 BRAZIL GENE SYNTHESIS MARKET, By PRODUCT TYPE, 2019-2028 (USD Million)
TABLE 298 BRAZIL GENE SYNTHESIS MARKET, By APPLICATION, 2019-2028 (USD Million)
TABLE 299 BRAZIL GENE SYNTHESIS MARKET, By METHOD, 2019-2028 (USD Million)
TABLE 300 BRAZIL GENE SYNTHESIS MARKET, By END USER, 2019-2028 (USD Million)
TABLE 301 BRAZIL GENE SYNTHESIS MARKET, By DISTRIBUTION CHANNEL, 2019-2028 (USD Million)
TABLE 302 ARGENTINA GENE SYNTHESIS MARKET, By Product & sERVICES, 2019-2028 (USD Million)
TABLE 303 ARGENTINA CONSUMABLES IN GENE SYNTHESIS MARKET, By PRODUCTS & SERVICES 2019-2028 (USD Million)
TABLE 304 ARGENTINA SYNTHESIZER in GENE SYNTHESIS MARKET, By PRODUCTS & SERVICES, 2019-2028 (USD Million)
TABLE 305 ARGENTINA GENE SYNTHESIS MARKET, By GENE TYPE, 2019-2028 (USD Million)
TABLE 306 ARGENTINA GENE SYNTHESIS MARKET, By PRODUCT TYPE, 2019-2028 (USD Million)
TABLE 307 ARGENTINA GENE SYNTHESIS MARKET, By APPLICATION, 2019-2028 (USD Million)
TABLE 308 ARGENTINA GENE SYNTHESIS MARKET, By METHOD, 2019-2028 (USD Million)
TABLE 309 ARGENTINA GENE SYNTHESIS MARKET, By END USER, 2019-2028 (USD Million)
TABLE 310 ARGENTINA GENE SYNTHESIS MARKET, By DISTRIBUTION CHANNEL, 2019-2028 (USD Million)
TABLE 311 ARGENTINA GENE SYNTHESIS MARKET, By Product & sERVICES, 2019-2028 (USD Million)
TABLE 312 Middle East and Africa Gene synthesis Market, By Region, 2019-2028 (USD Million)
TABLE 313 middle east and africa Gene Synthesis Market, By Product & Services, 2019-2028 (USD Million)
TABLE 314 middle east and africa Consumables in Gene Synthesis Market, By Product & Services 2019-2028 (USD Million)
TABLE 315 middle east and africa Synthesizer in Gene Synthesis Market, By Product & Services 2019-2028 (USD Million)
TABLE 316 middle east and africa Gene Synthesis Market, By Gene Type, 2019-2028 (USD Million)
TABLE 317 middle east and africa Gene Synthesis Market, By Product Type, 2019-2028 (USD Million)
TABLE 318 middle east and africa Gene Synthesis Market, By Application, 2019-2028 (USD Million)
TABLE 319 middle east and africa Gene Synthesis Market, By Method, 2019-2028 (USD Million)
TABLE 320 middle easta and africa Gene Synthesis Market, By End User, 2019-2028 (USD Million)
TABLE 321 middle east and africa Gene Synthesis Market, By Distribution Channel, 2019-2028 (USD Million)
TABLE 322 saudi arab Gene Synthesis Market, By Product & Services, 2019-2028 (USD Million)
TABLE 323 saudi arab Consumables in Gene Synthesis Market, By Product & Services 2019-2028 (USD Million)
TABLE 324 saudi arab Synthesizer in Gene Synthesis Market, By Product & Services 2019-2028 (USD Million)
TABLE 325 saudi arab Gene Synthesis Market, By Gene Type, 2019-2028 (USD Million)
TABLE 326 saudi arab Gene Synthesis Market, By Product Type, 2019-2028 (USD Million)
TABLE 327 saudi arab Gene Synthesis Market, By Application, 2019-2028 (USD Million)
TABLE 328 saudi arab Gene Synthesis Market, By Method, 2019-2028 (USD Million)
TABLE 329 saudi arab Gene Synthesis Market, By End User, 2019-2028 (USD Million)
TABLE 330 saudi arab Gene Synthesis Market, By Distribution Channel, 2019-2028 (USD Million)
TABLE 331 south africa Gene Synthesis Market, By Product & Services, 2019-2028 (USD Million)
TABLE 332 south africa Consumables in Gene Synthesis Market, By Product & Services 2019-2028 (USD Million)
TABLE 333 south africa Synthesizer in Gene Synthesis Market, By Product & Services 2019-2028 (USD Million)
TABLE 334 south africa Gene Synthesis Market, By Gene Type, 2019-2028 (USD Million)
TABLE 335 south africa Gene Synthesis Market, By Product Type, 2019-2028 (USD Million)
TABLE 336 south africa Gene Synthesis Market, By Application, 2019-2028 (USD Million)
TABLE 337 south africa Gene Synthesis Market, By Method, 2019-2028 (USD Million)
TABLE 338 south africa Gene Synthesis Market, By End User, 2019-2028 (USD Million)
TABLE 339 south africa Gene Synthesis Market, By Distribution Channel, 2019-2028 (USD Million)
TABLE 340 UAE Gene Synthesis Market, By Product & Services, 2019-2028 (USD Million)
TABLE 341 uae Consumables in Gene Synthesis Market, By Product & Services 2019-2028 (USD Million)
TABLE 342 uae Synthesizer in Gene Synthesis Market, By Product & Services 2019-2028 (USD Million)
TABLE 343 uae Gene Synthesis Market, By Gene Type, 2019-2028 (USD Million)
TABLE 344 uae Gene Synthesis Market, By Product Type, 2019-2028 (USD Million)
TABLE 345 uae Gene Synthesis Market, By Application, 2019-2028 (USD Million)
TABLE 346 uae Gene Synthesis Market, By Method, 2019-2028 (USD Million)
TABLE 347 uae Gene Synthesis Market, By End User, 2019-2028 (USD Million)
TABLE 348 uae Gene Synthesis Market, By Distribution Channel, 2019-2028 (USD Million)
TABLE 349 ISRAEL Gene Synthesis Market, By Product & Services, 2019-2028 (USD Million)
TABLE 350 ISRAEL Consumables in Gene Synthesis Market, By Product & Services 2019-2028 (USD Million)
TABLE 351 ISRAEL Synthesizer in Gene Synthesis Market, By Product & Services 2019-2028 (USD Million)
TABLE 352 ISRAEL Gene Synthesis Market, By Gene Type, 2019-2028 (USD Million)
TABLE 353 ISRAEL Gene Synthesis Market, By Product Type, 2019-2028 (USD Million)
TABLE 354 ISRAEL Gene Synthesis Market, By Application, 2019-2028 (USD Million)
TABLE 355 ISRAEL Gene Synthesis Market, By Method, 2019-2028 (USD Million)
TABLE 356 ISRAEL Gene Synthesis Market, By End User, 2019-2028 (USD Million)
TABLE 357 ISRAEL Gene Synthesis Market, By Distribution Channel, 2019-2028 (USD Million)
TABLE 358 egypt Gene Synthesis Market, By Product & Services, 2019-2028 (USD Million)
TABLE 359 egypt Consumables in Gene Synthesis Market, By Product & Services 2019-2028 (USD Million)
TABLE 360 egypt Synthesizer in Gene Synthesis Market, By Product & Services 2019-2028 (USD Million)
TABLE 361 egypt Gene Synthesis Market, By Gene Type, 2019-2028 (USD Million)
TABLE 362 egypt Gene Synthesis Market, By Product Type, 2019-2028 (USD Million)
TABLE 363 egypt Gene Synthesis Market, By Application, 2019-2028 (USD Million)
TABLE 364 egypt Gene Synthesis Market, By Method, 2019-2028 (USD Million)
TABLE 365 egypt Gene Synthesis Market, By End User, 2019-2028 (USD Million)
TABLE 366 egypt Gene Synthesis Market, By Distribution Channel, 2019-2028 (USD Million)
TABLE 367 REST OF MIDDLE EAST AND AFRICA Gene Synthesis Market, By Product & Services, 2019-2028 (USD Million)
TABLE 368 REST OF MIDDLE EAST AND AFRICA Consumables in Gene Synthesis Market, By Product & Services 2019-2028 (USD Million)
TABLE 369 REST OF MIDDLE EAST AND AFRICA Synthesizer in Gene Synthesis Market, By Product & Services 2019-2028 (USD Million)
TABLE 370 REST OF MIDDLE EAST AND AFRICA Gene Synthesis Market, By Gene Type, 2019-2028 (USD Million)
TABLE 371 REST OF MIDDLE EAST AND AFRICA Gene Synthesis Market, By Product Type, 2019-2028 (USD Million)
TABLE 372 REST OF MIDDLE EAST AND AFRICA Gene Synthesis Market, By Application, 2019-2028 (USD Million)
TABLE 373 REST OF MIDDLE EAST AND AFRICA Gene Synthesis Market, By Method, 2019-2028 (USD Million)
TABLE 374 REST OF MIDDLE EAST AND AFRICA Gene Synthesis Market, By End User, 2019-2028 (USD Million)
TABLE 375 REST OF MIDDLE EAST AND AFRICA Gene Synthesis Market, By Distribution Channel, 2019-2028 (USD Million)
List of Figure
FIGURE 1 Global Gene synthesis market: segmentation
FIGURE 2 Global Gene synthesis market : data triangulation
FIGURE 3 global Gene synthesis Market: DROC ANALYSIS
FIGURE 4 Global Gene synthesis market: Global VS REGIONAL MARKET ANALYSIS
FIGURE 5 Global Gene synthesis Market: COMPANY RESEARCH ANALYSIS
FIGURE 6 GLOBAL Gene synthesis MARKET: MULTIVARIATE MODELLING
FIGURE 7 GLOBAL Gene synthesis MARKET: INTERVIEW DEMOGRAPHICS
FIGURE 8 GLOBAL GENE SYNTHESIS MARKET: DBMR MARKET POSITION GRID
FIGURE 9 GLOBAL gene synthesis Market: MARKET APPLICATION COVERAGE GRID
FIGURE 10 GLOBAL GENE SYNTHESIS MARKET: VENDOR SHARE ANALYSIS
FIGURE 11 Global Gene synthesis market: SEGMENTATION
FIGURE 12 NORTH AMERICA is expected to DOMINATE and asia-pacific is growing at the fastest pace in THE GLOBAL Gene synthesis market IN the forecast period of 2021 to 2028
FIGURE 13 rising adoption of gene therapy is expected to drive THE global Gene synthesis MARKET IN THE FORECAST PERIOD OF 2021 to 2028
FIGURE 14 Software & Services SEGMENT IS EXPECTED to account for the largest share of the global GENE SYNTHESIS MARKET in 2021 & 2028
FIGURE 15 asia-pacific is the fastest growing market in global Gene synthesis market in the forecast period of 2021 to 2028
FIGURE 16 DRIVERS, RESTRAINTS, OPPORTUNITIES, AND CHALLENGEs OF Global Gene synthesis Market
FIGURE 17 Pediatric deaths cause by influenza (2017–2020) in THE U.S.
FIGURE 18 global prevalEnce of hbv infection (worldwide, 2018)
FIGURE 19 global Gene synthesis market: BY product & services, 2020
FIGURE 20 global Gene synthesis market: BY product & services, 2020-2028 (USD Million)
FIGURE 21 global Gene synthesis market: BY product & services, CAGR (2020-2028).
FIGURE 22 global Gene synthesis market: BY product & services, LIFELINE CURVE
FIGURE 23 global Gene synthesis market: BY gene type, 2020
FIGURE 24 global Gene synthesis market: BY gene type, 2020-2028 (USD Million)
FIGURE 25 global Gene synthesis market: BY gene type, CAGR (2020-2028)
FIGURE 26 global Gene synthesis market: BY gene type, LIFELINE CURVE
FIGURE 27 global Gene synthesis market: BY product type, 2020
FIGURE 28 global Gene synthesis market: BY product type, 2020-2028 (USD Million)
FIGURE 29 global Gene synthesis market: BY product type, CAGR (2020-2028)
FIGURE 30 global Gene synthesis market: BY product type, LIFELINE CURVE
FIGURE 31 global Gene synthesis market: BY application, 2020
FIGURE 32 global Gene synthesis market: BY application, 2020-2028 (USD Million)
FIGURE 33 global Gene synthesis market: BY application, CAGR (2020-2028)
FIGURE 34 global Gene synthesis market: BY application, LIFELINE CURVE
FIGURE 35 global Gene synthesis market: BY method, 2020
FIGURE 36 global Gene synthesis market: BY method, 2020-2028 (USD Million)
FIGURE 37 global Gene synthesis market: BY method, CAGR (2020-2028)
FIGURE 38 global Gene synthesis market: BY method, LIFELINE CURVE
FIGURE 39 global Gene synthesis market: BY end user, 2020
FIGURE 40 global Gene synthesis market: BY end user , 2020-2028 (USD Million)
FIGURE 41 global Gene synthesis market: BY end user, CAGR (2020-2028)
FIGURE 42 global Gene synthesis market: BY end user, LIFELINE CURVE
FIGURE 43 global Gene synthesis market: BY distribution channel, 2020
FIGURE 44 global Gene synthesis market: BY distribution channel, 2020-2028 (USD Million)
FIGURE 45 global Gene synthesis market: BY distribution channel, CAGR (2020-2028)
FIGURE 46 global Gene synthesis market: BY distribution channel, LIFELINE CURVE
FIGURE 47 GLOBAL gene Synthesis market: SNAPSHOT (2020)
FIGURE 48 GLOBAL gene Synthesismarket: BY COUNTRY (2020)
FIGURE 49 GLOBAL gene Synthesis market: BY COUNTRY (2021 & 2028)
FIGURE 50 GLOBAL gene Synthesismarket: BY COUNTRY (2020 & 2028)
FIGURE 51 GLOBAL gene Synthesismarket: BY Product Type (2021-2028)
FIGURE 52 North America Gene SYNTHESIS MARKET: SNAPSHOT (2020)
FIGURE 53 North America Gene SYNTHESIS MARKET: BY COUNTRY (2020)
FIGURE 54 North America Gene SYNTHESIS MARKET: BY COUNTRY (2021 & 2028)
FIGURE 55 North America Gene SYNTHESIS MARKET: BY COUNTRY (2020 & 2028)
FIGURE 56 North America Gene SYNTHESIS MARKET: BY product Type (2021-2028)
FIGURE 57 Europe GENE SYNTHESIS market: SNAPSHOT (2020)
FIGURE 58 Europe GENE SYNTHESIS market: BY COUNTRY (2020)
FIGURE 59 Europe GENE SYNTHESIS market: BY COUNTRY (2021 & 2028)
FIGURE 60 Europe GENE SYNTHESIS market: BY COUNTRY (2020 & 2028)
FIGURE 61 Europe GENE SYNTHESIS market: BY Product Type (2021-2028)
FIGURE 62 Asia-Pacific Gene SYNTHESIS MARKET: SNAPSHOT (2020)
FIGURE 63 Asia-Pacific Gene SYNTHESIS MARKET: BY COUNTRY (2020)
FIGURE 64 Asia-Pacific Gene SYNTHESIS MARKET: BY COUNTRY (2021 & 2028)
FIGURE 65 Asia-Pacific Gene SYNTHESIS MARKET: BY COUNTRY (2020 & 2028)
FIGURE 66 Asia-Pacific Gene SYNTHESIS MARKET: BY product Type (2021-2028)
FIGURE 67 South America Gene SYNTHESIS MARKET: SNAPSHOT (2020)
FIGURE 68 South America Gene SYNTHESIS MARKET: BY COUNTRY (2020)
FIGURE 69 South America Gene SYNTHESIS MARKET: BY COUNTRY (2021 & 2028)
FIGURE 70 South America Gene SYNTHESIS MARKET: BY COUNTRY (2020 & 2028)
FIGURE 71 South America Gene SYNTHESIS MARKET: BY products Type (2021-2028)
FIGURE 72 middle east and africa GENE SYNTHESIS market: SNAPSHOT (2020)
FIGURE 73 middle east and africa GENE SYNTHESIS market: BY COUNTRY (2020)
FIGURE 74 middle east and africa GENE SYNTHESIS market: BY COUNTRY (2021 & 2028)
FIGURE 75 middle east and africa GENE SYNTHESIS market: BY COUNTRY (2020 & 2028)
FIGURE 76 middle east and africa GENE SYNTHESIS market: BY Product Type (2021-2028)
FIGURE 77 Global Gene Synthesis market: company share 2020 (%)
FIGURE 78 North America Gene Synthesis Market: company share 2020 (%)
FIGURE 79 EUROPE Gene Synthesis Market: company share 2020 (%)
FIGURE 80 ASIA-PACIFIC Gene Synthesis Market: company share 2020 (%)
Data collection and base year analysis are done using data collection modules with large sample sizes. The stage includes obtaining market information or related data through various sources and strategies. It includes examining and planning all the data acquired from the past in advance. It likewise envelops the examination of information inconsistencies seen across different information sources. The market data is analysed and estimated using market statistical and coherent models. Also, market share analysis and key trend analysis are the major success factors in the market report. To know more, please request an analyst call or drop down your inquiry.
The key research methodology used by DBMR research team is data triangulation which involves data mining, analysis of the impact of data variables on the market and primary (industry expert) validation. Data models include Vendor Positioning Grid, Market Time Line Analysis, Market Overview and Guide, Company Positioning Grid, Patent Analysis, Pricing Analysis, Company Market Share Analysis, Standards of Measurement, Global versus Regional and Vendor Share Analysis. To know more about the research methodology, drop in an inquiry to speak to our industry experts.
Data Bridge Market Research is a leader in advanced formative research. We take pride in servicing our existing and new customers with data and analysis that match and suits their goal. The report can be customized to include price trend analysis of target brands understanding the market for additional countries (ask for the list of countries), clinical trial results data, literature review, refurbished market and product base analysis. Market analysis of target competitors can be analyzed from technology-based analysis to market portfolio strategies. We can add as many competitors that you require data about in the format and data style you are looking for. Our team of analysts can also provide you data in crude raw excel files pivot tables (Fact book) or can assist you in creating presentations from the data sets available in the report.


