
Global Graph Analytics Market
Market Size in USD Billion
 USD
1.14 Billion
USD
11.72 Billion
2022
2030
USD
1.14 Billion
USD
11.72 Billion
2022
2030
| 2023 - 2030 | |
| USD 1.14 Billion | |
| USD 11.72 Billion | |
| % | |
|
Graph Analytics Market Analysis and Size
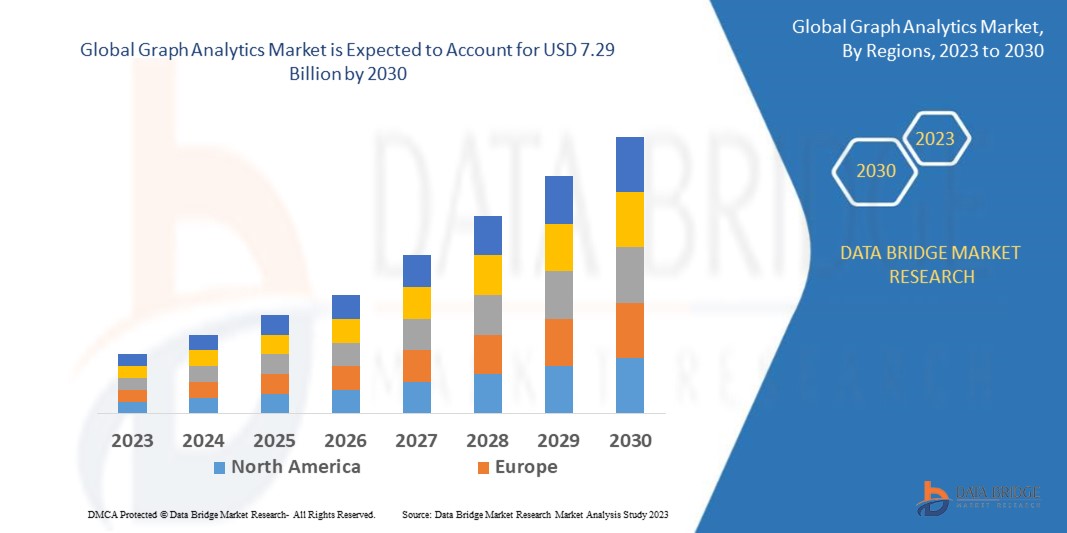
The Data Bridge Market Research analyses that the global graph analytics market, which was USD 1.14 billion in 2022, is expected to reach USD 7.29 billion by 2030, and is expected to undergo a CAGR of 33.82% during the forecast period. Data Bridge Market Research report on graph analytics market provides analysis and insights regarding the various factors expected to be prevalent throughout the forecast period while providing their impacts on the market's growth. The rise in the demand to identify complex patterns from the data in motion is escalating the growth of graph analytics market. In addition to the market insights such as market value, growth rate, market segments, geographical coverage, market players, and market scenario, the market report curated by the Data Bridge Market Research team includes in-depth expert analysis, import/export analysis, pricing analysis, production consumption analysis, and pestle analysis.
Graph Analytics Market Scope and Segmentation
|
Report Metric |
Details |
|
Forecast Period |
2023 to 2030 |
|
Base Year |
2022 |
|
Historic Years |
2021 (Customizable to 2015-2020) |
|
Quantitative Units |
Revenue in USD Billion, Volumes in Units, Pricing in USD |
|
Segments Covered |
Components (Solutions, Services), Deployment Mode (On-premises, Cloud), Organization Size (Large Enterprises, Small and Medium-Sized Enterprises), Application (Customer Analytics, Risk and Compliance Management, Recommendation Engines, Route Optimization Fraud Detection, Others), Vertical (Banking, Financial Services, and Insurance (BFSI), Retail and e-Commerce, Telecom, Healthcare and Life Sciences, Government and Public Sector, Manufacturing, Transportation and Logistics, Others) |
|
Countries Covered |
U.S., Canada, Mexico, Brazil, Argentina, Rest of South America, Germany, Italy, U.K., France, Spain, Netherlands, Belgium, Switzerland, Turkey, Russia, Rest of Europe, Japan, China, India, South Korea, Australia, Singapore, Malaysia, Thailand, Indonesia, Philippines, Rest of Asia-Pacific, Saudi Arabia, U.A.E., South Africa, Egypt, Israel, Rest of the Middle East and Africa |
|
Market Players Covered |
IBM (U.S.), Microsoft (U.S.), Amazon Web Services, Inc. (U.S.), Oracle (U.S.), TigerGraph (U.S.), Cray Inc. (U.S.), DataStax (U.S.), TIBCO Software Inc (U.S.), Linkurious SAS (France), Graphistry (U.S.), Lynx Analytics Pte. Ltd. (Singapore), Objectivity Inc. (U.S.), and among others. |
|
Market Opportunities |
|
Market Definition
Graph analytics is known to be an emerging and interesting new area for analytics workloads and it is also referred to as network analysis. Marketing managers are chiefly interested in the identification of social network influencers as they are potential targets for social media marketing campaigns. Connecting with influencers could set off chain reactions among the social network communities and trigger sale of services and products.
Global Graph Analytics Market Dynamics
Drivers
- Data-Driven Decision Making
In an increasingly data-centric world, organizations across various industries are recognizing the value of graph analytics in extracting meaningful insights from complex and interconnected data. This drives the demand for graph analytics tools as they enable businesses to make data-driven decisions, optimize operations, and uncover hidden patterns in their data.
- Rise of Social Networks and Recommendation Systems
With the proliferation of social media platforms, e-commerce, and online content, there is a growing need for graph analytics to power recommendation systems and enhance user experiences. These systems rely on graph algorithms to analyze user behavior and connections, leading to increased adoption of graph analytics solutions.
Opportunities
• Development in Fraud Detection and Prevention
The field of graph analytics requires specialized skills and expertise in graph theory, algorithms, and data science. Finding and retaining talent with the necessary knowledge and experience can be a significant challenge for organizations seeking to leverage graph analytics effectively.
Interoperability and Integration: Integrating graph analytics tools with existing data infrastructure and software applications can be challenging. Ensuring seamless interoperability and data exchange between different systems is crucial for realizing the full potential of graph analytics, but it often requires substantial effort and resources.
• Increasing Adoption of Social Network Analysis
Implementing and maintaining graph analytics solutions can be costly, both in terms of technology investments and ongoing operational expenses. Small and medium-sized enterprises may find it challenging to allocate resources for such initiatives, limiting market penetration among this segment.
Restraints/Challenges
- Lack of Skilled Talent
The field of graph analytics requires specialized skills and expertise in graph theory, algorithms, and data science. Finding and retaining talent with the necessary knowledge and experience can be a significant challenge for organizations seeking to leverage graph analytics effectively.
- Interoperability and Integration
Integrating graph analytics tools with existing data infrastructure and software applications can be challenging. Ensuring seamless interoperability and data exchange between different systems is crucial for realizing the full potential of graph analytics, but it often requires substantial effort and resources.
- Cost Considerations
Implementing and maintaining graph analytics solutions can be costly, both in terms of technology investments and ongoing operational expenses. Small and medium-sized enterprises may find it challenging to allocate resources for such initiatives, limiting market penetration among this segment.
This graph analytics market report provides details of new recent developments, trade regulations, import-export analysis, production analysis, value chain optimization, market share, impact of domestic and localized market players, analyses opportunities in terms of emerging revenue pockets, changes in market regulations, strategic market growth analysis, market size, category market growths, application niches and dominance, product approvals, product launches, geographic expansions, technological innovations in the market. To gain more info on the computer vision market contact Data Bridge Market Research for an Analyst Brief, our team will help you take an informed market decision to achieve market growth.
Recent Development
- In March 2020, TigerGraph, one of the prominent players in Graph Analytics, launched TigerGraph3.0 to unravel the relevant real-time data and develop scalable graph analytics
Global Graph Analytics Market Scope
The graph analytics market is segmented on the basis of components, deployment mode, organization size, application and vertical. The growth among segments helps you analyze niche pockets of growth and strategies to approach the market and determine your core application areas and the difference in your target markets.
Components
- Solutions
- Services
Deployment Mode
- On-premises
- Cloud
Organization Size
- Large Enterprises
- Small and Medium-Sized Enterprises
Application
- Customer Analytics
- Risk and Compliance Management
- Recommendation Engines
- Route Optimization Fraud Detection
- Others
Vertical
- Banking
- Financial Services, and Insurance (BFSI)
- Retail and e-Commerce
- Telecom
- Healthcare and Life Sciences
- Government and Public Sector
- Manufacturing
- Transportation and Logistics
- Others
Global Graph Analytics Market Region Analysis/Insights
The graph analytics market is analyzed, and market size, volume information is provided by components, deployment mode, organization size, application and vertical as referenced above.
The countries covered in the graph analytics market report are the U.S., Canada, and Mexico in North America, Brazil, Argentina, and the rest of South America as part of South America, Germany, Italy, U.K., France, Spain, Netherlands, Belgium, Switzerland, Turkey, Russia, Rest of Europe in Europe, Japan, China, India, South Korea, Australia, Singapore, Malaysia, Thailand, Indonesia, Philippines, Rest of Asia-Pacific (APAC) in the Asia-Pacific (APAC), Saudi Arabia, U.A.E., South Africa, Egypt, Israel, Rest of Middle East and Africa (MEA) as a part of the Middle East and Africa (MEA).
North America dominates the graph analytics market due to the increased use of big data technology. Furthermore, the growing investment by various company’s real-time analytics and large amount of data across numerous verticals will further boost the growth of the graph analytics market in the region during the forecast period. Asia-Pacific is projected to observe significant amount of growth in the graph analytics market due to the high adoption of advanced technologies, such as artificial intelligence, big data analytics, and the internet of things (IoT), by several companies is further anticipated to propel the growth of the graph analytics market in the region in the coming years.
The country section of the report also provides individual market impacting factors and changes in regulation in the market domestically that impacts the current and future trends of the market. Data points such as down-stream and up-stream value chain analysis, technical trends and porter's five forces analysis, case studies are some of the pointers used to forecast the market scenario for individual countries. Also, the presence and availability of global brands and their challenges faced due to large or scarce competition from local and domestic brands, impact of domestic tariffs and trade routes are considered while providing forecast analysis of the country data.
Competitive Landscape and Global Graph Analytics Market Share Analysis
The graph analytics market competitive landscape provides details by a competitor. Details included are company overview, company financials, revenue generated, market potential, investment in research and development, new market initiatives, regional presence, company strengths and weaknesses, product launch, product width and breadth, application dominance. The above data points provided are only related to the companies' focus related to the graph analytics market.
Some of the major players operating in the global graph analytics market are
- IBM (U.S.)
- Microsoft (U.S.)
- Amazon Web Services, Inc. (U.S.)
- Oracle (U.S.)
- TigerGraph (U.S.)
- Cray Inc. (U.S.)
- DataStax (U.S.)
- TIBCO Software Inc (U.S.)
- Linkurious SAS - France
- Graphistry (U.S.)
- Lynx Analytics Pte. Ltd.(Singapore)
- Objectivity Inc. (U.S.)
SKU-

- Interactive Data Analysis Dashboard
- Company Analysis Dashboard for high growth potential opportunities
- Research Analyst Access for customization & queries
- Competitor Analysis with Interactive dashboard
- Latest News, Updates & Trend analysis
- Harness the Power of Benchmark Analysis for Comprehensive Competitor Tracking
Data collection and base year analysis are done using data collection modules with large sample sizes. The stage includes obtaining market information or related data through various sources and strategies. It includes examining and planning all the data acquired from the past in advance. It likewise envelops the examination of information inconsistencies seen across different information sources. The market data is analysed and estimated using market statistical and coherent models. Also, market share analysis and key trend analysis are the major success factors in the market report. To know more, please request an analyst call or drop down your inquiry.
The key research methodology used by DBMR research team is data triangulation which involves data mining, analysis of the impact of data variables on the market and primary (industry expert) validation. Data models include Vendor Positioning Grid, Market Time Line Analysis, Market Overview and Guide, Company Positioning Grid, Patent Analysis, Pricing Analysis, Company Market Share Analysis, Standards of Measurement, Global versus Regional and Vendor Share Analysis. To know more about the research methodology, drop in an inquiry to speak to our industry experts.
Data Bridge Market Research is a leader in advanced formative research. We take pride in servicing our existing and new customers with data and analysis that match and suits their goal. The report can be customized to include price trend analysis of target brands understanding the market for additional countries (ask for the list of countries), clinical trial results data, literature review, refurbished market and product base analysis. Market analysis of target competitors can be analyzed from technology-based analysis to market portfolio strategies. We can add as many competitors that you require data about in the format and data style you are looking for. Our team of analysts can also provide you data in crude raw excel files pivot tables (Fact book) or can assist you in creating presentations from the data sets available in the report.


