
Global Graph Database Market
Market Size in USD Billion
 USD
2.70 Billion
USD
10.28 Billion
2024
2032
USD
2.70 Billion
USD
10.28 Billion
2024
2032
| 2025 - 2032 | |
| USD 2.70 Billion | |
| USD 10.28 Billion | |
| % | |
|
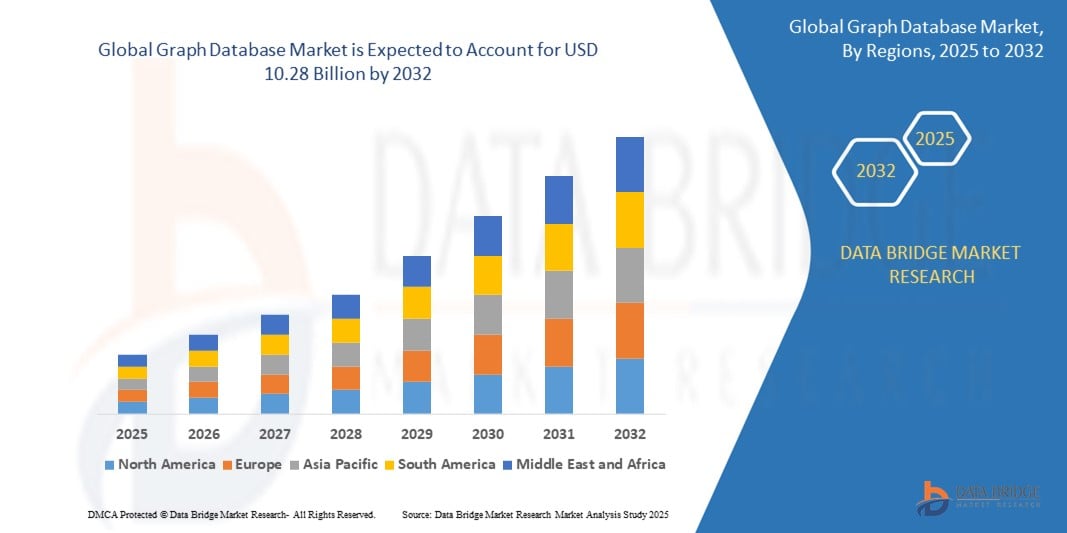
Graph Database Market Size
- The global graph database market size was valued at USD 2.70 billion in 2024 and is expected to reach USD 10.28 billion by 2032, at a CAGR of 18.20% during the forecast period
- The market growth is largely fueled by the increasing adoption of graph databases for real-time data analytics, fraud detection, and recommendation engines across sectors such as BFSI, telecom, and e-commerce
- Furthermore, the rising complexity of enterprise data and growing demand for scalable, high-performance solutions that uncover hidden relationships are positioning graph databases as a critical tool for modern data infrastructure, thereby significantly accelerating market expansion
Graph Database Market Analysis
- Graph databases, designed to store, manage, and query data based on relationships, are becoming essential for enterprises aiming to derive insights from highly connected and complex datasets across various applications such as fraud detection, recommendation systems, and network analysis
- The escalating demand for graph databases is primarily driven by the growing need for real-time analytics, increasing adoption of AI and machine learning, and the rising volume of unstructured and semi-structured data generated across industries
- North America dominated the graph database market with a share of 42.5% in 2024, due to early adoption of advanced analytics tools, strong investments in AI and machine learning, and the rising need for real-time data processing in industries such as BFSI, healthcare, and IT
- Asia-Pacific is expected to be the fastest growing region in the graph database market during the forecast period due to increasing enterprise digitalization, government-backed smart city initiatives, and rapid cloud adoption in economies such as China, India, Japan, and South Korea
- Cloud segment dominated the market in 2024, due to growing preference for scalable, cost-effective, and maintenance-free deployment options. Cloud-based graph databases offer on-demand performance, simplified integration with other cloud services, and global accessibility, making them ideal for distributed teams and modern application development
Report Scope and Graph Database Market Segmentation
|
Attributes |
Graph Database Key Market Insights |
|
Segments Covered |
|
|
Countries Covered |
North America
Europe
Asia-Pacific
Middle East and Africa
South America
|
|
Key Market Players |
|
|
Market Opportunities |
|
|
Value Added Data Infosets |
In addition to the market insights such as market value, growth rate, market segments, geographical coverage, market players, and market scenario, the market report curated by the Data Bridge Market Research team includes in-depth expert analysis, import/export analysis, pricing analysis, production consumption analysis, and pestle analysis. |
Graph Database Market Trends
“Increasing Adoption of Cloud-Based Graph Databases”
- A significant and accelerating trend in the global graph database market is the increasing adoption of cloud-based deployment models, enabling enhanced scalability, flexibility, and real-time collaboration across distributed data environments
- For instance, Amazon Neptune, a fully managed graph database service on AWS, supports both RDF and Property Graph models and is widely used for knowledge graphs and fraud detection. Similarly, Microsoft’s Azure Cosmos DB provides native support for Gremlin API, enabling scalable graph database solutions in the cloud
- Cloud-based graph databases allow organizations to manage massive volumes of connected data with minimal infrastructure overhead, enabling faster deployment and easier integration with existing cloud-native services. Google Cloud’s integration with Neo4j AuraDB allows users to build advanced analytics and recommendation engines without managing backend systems
- These platforms support use cases such as identity access management, real-time fraud analysis, and personalized content delivery by leveraging relationship-centric data modeling in a cost-effective, on-demand environment
- This shift toward cloud-native graph solutions is fundamentally reshaping how businesses derive insights from complex data. Companies such as Neo4j and TigerGraph are actively expanding their cloud offerings to meet rising demand from sectors including BFSI, telecom, and retail
- The demand for cloud-based graph databases is accelerating rapidly as enterprises seek to modernize data infrastructure, improve time-to-insight, and achieve seamless integration with AI and machine learning workflows
Graph Database Market Dynamics
Driver
“Rising Need for Real-Time Data Analytics”
- The rising need for real-time data analytics across industries is a significant driver for the growing demand for graph databases
- For instance, in March 2024, Neo4j announced major updates to its graph data science platform, enhancing its real-time recommendation and fraud detection capabilities, which are being rapidly adopted by fintech firms and e-commerce platforms. Such developments by key players are expected to propel the graph database market in the coming years
- As enterprises face increasing volumes of highly connected data, graph databases enable instant analysis of relationships and patterns that traditional databases cannot handle efficiently. This is critical in use cases such as detecting fraudulent transactions, identifying supply chain disruptions, and powering personalized content engines
- Furthermore, the growing demand for instant insights in sectors such as banking, telecom, and retail is driving organizations to shift from batch processing models to real-time analytics solutions powered by graph technologies
- Cloud-based solutions from companies such as TigerGraph, Amazon Neptune, and Microsoft Azure Cosmos DB are further expanding access to real-time graph analytics, allowing enterprises to deploy these capabilities quickly and cost-effectively across diverse operational environments
Restraint/Challenge
“Limited Workforce Expertise”
- Limited workforce expertise in graph database technologies presents a significant challenge to broader market adoption and deployment. As graph databases require specialized knowledge in graph theory, query languages such as Cypher or Gremlin, and schema design, many organizations struggle to find qualified professionals capable of implementing and managing these systems effectively
- For instance, despite Neo4j’s widespread adoption, many enterprises face a steep learning curve in onboarding developers familiar with its architecture and graph query language. This lack of expertise can lead to slower deployment timelines, misconfigured implementations, and underutilization of graph database capabilities
- Addressing this challenge through targeted training programs, certification courses, and user-friendly development tools is critical for market expansion. Companies such as TigerGraph and Neo4j have launched educational initiatives and community support platforms to build a skilled user base, yet the talent gap remains a bottleneck for scaling advanced graph-based solutions
- In addition, the rapid pace of innovation in graph technology can overwhelm traditional IT teams, further widening the expertise gap. This issue is particularly pronounced among small and medium enterprises that may lack the resources to invest in specialized training
- Bridging this talent shortage through strategic partnerships, academic collaborations, and simplified tooling will be essential to ensure that organizations can fully harness the potential of graph databases for real-time analytics, fraud detection, and knowledge graph applications
Graph Database Market Scope
The market is segmented on the basis of type, application, database, deployment model, analysis type, size, component, and end-user.
• By Type
On the basis of type, the graph database market is segmented into Resource Description Framework (RDF) and Labeled Property Graph (LPG). The Labeled Property Graph (LPG) segment dominated the largest market revenue share in 2024, driven by its flexibility in representing complex relationships with nodes, edges, and key-value properties. LPG's intuitive data modeling structure supports use cases such as knowledge graphs, recommendation engines, and real-time fraud detection with high performance, making it suitable for both transactional and analytical workloads.
The RDF segment is projected to witness the fastest CAGR from 2025 to 2032, fueled by its standardized semantic web framework and strong compatibility with linked data and ontology-based reasoning. RDF finds increasing adoption in government and academic sectors for data integration and compliance with W3C standards, especially in projects that demand strong interoperability across heterogeneous data sources.
• By Application
On the basis of application, the graph database market is segmented into Fraud Detection, Prevention, and Recommendation Engine. Fraud Detection and Prevention held the largest revenue share in 2024, owing to its growing deployment in banking and e-commerce sectors to uncover hidden patterns and detect anomalies in real-time. Graph databases excel at identifying suspicious behavior through connected data insights, offering businesses advanced tools to combat increasingly sophisticated fraud schemes.
The recommendation engine segment is expected to record the fastest growth rate from 2025 to 2032, driven by the demand for hyper-personalized user experiences in sectors such as retail, streaming, and social platforms. Graph-based recommendations leverage multi-dimensional relationships to deliver accurate content and product suggestions, significantly improving customer engagement and satisfaction.
• By Database
On the basis of database type, the graph database market is segmented into Relational (SQL) and Non-relational (NoSQL). The Non-relational (NoSQL) segment held the largest market share in 2024, attributed to its high scalability, schema flexibility, and ability to handle unstructured and semi-structured data. NoSQL graph databases support agile application development and real-time analytics, making them widely adopted across dynamic environments such as social networks, cybersecurity, and knowledge management.
The Relational (SQL) segment is projected to grow at the fastest CAGR from 2025 to 2032 as enterprises integrate graph capabilities into traditional SQL environments. This hybrid approach allows organizations to leverage existing relational infrastructure while gaining advanced relationship-querying features, minimizing operational disruptions and training needs.
• By Deployment Model
On the basis of deployment model, the graph database market is segmented into On-premise and Cloud. The cloud segment dominated the largest revenue share in 2024, driven by growing preference for scalable, cost-effective, and maintenance-free deployment options. Cloud-based graph databases offer on-demand performance, simplified integration with other cloud services, and global accessibility, making them ideal for distributed teams and modern application development.
The on-premise segment is anticipated to witness the fastest growth from 2025 to 2032, particularly among enterprises in highly regulated sectors such as finance, healthcare, and defense. These organizations prefer on-premise setups for greater data control, compliance with strict privacy policies, and security against external threats.
• By Analysis Type
On the basis of analysis type, the graph database market is segmented into Path Analysis, Connectivity Analysis, Community Analysis, and Centrality Analysis. Path analysis held the largest market share in 2024, owing to its critical role in optimizing logistics, detecting fraud chains, and mapping customer journeys. It allows businesses to understand sequences, dependencies, and causal relationships in transactional and operational data.
Community analysis is expected to witness the fastest CAGR from 2025 to 2032, propelled by its applications in marketing, social network analysis, and cybersecurity. It helps identify clusters, influencer groups, and behavior patterns, enabling more targeted interventions and deeper insights into ecosystem dynamics.
• By Size
On the basis of organization size, the market is segmented into Large Enterprises and Small and Medium Enterprises (SMEs). Large enterprises accounted for the largest revenue share in 2024, driven by their extensive need to manage massive and complex datasets across departments and regions. These organizations leverage graph databases for enterprise knowledge graphs, fraud analytics, and supply chain optimization.
The SME segment is expected to grow at the fastest rate from 2025 to 2032 due to increasing digital transformation initiatives and growing access to cloud-based graph solutions. SMEs benefit from improved customer insights and streamlined decision-making without heavy investments in traditional infrastructure.
• By Component
On the basis of component, the graph database market is segmented into Software and Services. The software segment held the largest market share in 2024, attributed to the rising adoption of graph engines and database management platforms for data querying, visualization, and integration. Continuous product innovations and growing open-source availability further strengthen this segment.
The services segment is projected to grow at the highest CAGR from 2025 to 2032, supported by rising demand for consulting, training, integration, and support services. As more organizations explore graph technology, expert services are vital to ensure smooth adoption, performance tuning, and strategic alignment with business goals.
• By End User
On the basis of end user, the graph database market is segmented into Banking, Financial Services and Insurance (BFSI), Telecom and IT, Healthcare and Lifesciences, Transportation and Logistics, Retail and E-commerce, Energy and Utilities, Government and Public, Manufacturing, and Others. The BFSI segment held the largest market share in 2024, driven by the need for robust fraud detection, risk management, and regulatory compliance. Graph databases provide BFSI players with the ability to map complex transactional relationships and track financial crime networks.
The healthcare and lifesciences segment is expected to record the fastest CAGR from 2025 to 2032 due to growing applications in genomics, drug discovery, and patient data integration. Graph technology enables researchers and clinicians to analyze biological networks and medical records in a connected context, accelerating innovation and personalized care.
Graph Database Market Regional Analysis
- North America dominated the graph database market with the largest revenue share of 42.5% in 2024, driven by early adoption of advanced analytics tools, strong investments in AI and machine learning, and the rising need for real-time data processing in industries such as BFSI, healthcare, and IT
- Organizations in the region leverage graph databases for fraud detection, recommendation engines, and complex network analysis across structured and unstructured datasets
- The market's expansion is supported by the presence of leading vendors, growing cloud adoption, and enterprise demand for scalable, high-performance data management solutions
U.S. Graph Database Market Insight
The U.S. graph database market captured the largest revenue share in 2024 within North America, driven by widespread enterprise digitization and integration of graph-based analytics into data platforms. The country's advanced cloud infrastructure and data-centric regulatory environment encourage adoption in finance, healthcare, and retail sectors. U.S. firms are increasingly deploying graph databases for customer experience enhancement, cybersecurity, and relationship intelligence, supported by a robust ecosystem of solution providers and cloud platforms.
Europe Graph Database Market Insight
The Europe graph database market is projected to expand at a strong CAGR throughout the forecast period, primarily due to strict data governance standards such as GDPR and the region's growing focus on data lineage, transparency, and interoperability. The increasing demand for AI-powered insights in telecom, BFSI, and public services fuels growth. Enterprises are adopting graph technologies to enhance fraud detection, improve supply chain visibility, and drive personalization strategies across digital channels.
U.K. Graph Database Market Insight
The U.K. graph database market is expected to grow at a robust CAGR during the forecast period, fueled by rising investments in digital transformation and the growing importance of network analytics in government and finance sectors. The U.K.'s expanding fintech landscape and cybersecurity focus are driving demand for graph-based fraud detection and customer journey mapping solutions. Adoption is also increasing in research institutions and enterprises focused on semantic knowledge graph construction.
Germany Graph Database Market Insight
The Germany graph database market is set to expand steadily during the forecast period, supported by the country's emphasis on Industry 4.0, data automation, and intelligent decision-making. German enterprises are leveraging graph databases for optimizing production networks, predictive maintenance, and IT operations. The integration of graph analytics into legacy systems and ERP platforms is gaining traction, particularly within the automotive, manufacturing, and public sector domains.
Asia-Pacific Graph Database Market Insight
The Asia-Pacific graph database market is poised to grow at the fastest CAGR from 2025 to 2032, fueled by increasing enterprise digitalization, government-backed smart city initiatives, and rapid cloud adoption in economies such as China, India, Japan, and South Korea. Organizations are turning to graph databases to power fraud detection, personalized services, and complex data integration across distributed environments.
Japan Graph Database Market Insight
The Japan graph database market is growing steadily, driven by the country's strong technological infrastructure and rising demand for AI-enhanced data solutions. Enterprises and government agencies are using graph databases to improve semantic search, optimize logistics, and detect patterns in cybersecurity threats. The market is also supported by the integration of graph analytics into IoT and smart manufacturing systems aligned with Japan’s Society 5.0 goals.
China Graph Database Market Insight
The China graph database market held the largest revenue share in Asia Pacific in 2024, attributed to the government's push for data innovation and strong demand from the tech, finance, and logistics sectors. China's fast-growing digital ecosystem is leveraging graph databases to support recommendation systems, fraud detection, and supply chain intelligence. Domestic vendors are actively innovating in the graph space, supported by a large talent pool and favorable policy frameworks.
Graph Database Market Share
The graph database industry is primarily led by well-established companies, including:
- Hewlett Packard Enterprise Development LP (U.S.)
- IBM (U.S.)
- Microsoft (U.S.)
- Siemens (Germany)
- ANSYS, Inc. (U.S.)
- SAP SE (Germany)
- Oracle (U.S.)
- Robert Bosch GmbH (Germany)
- Atos SE (France)
- ABB (Switzerland)
- Kellton (India)
- AVEVA Group Limited (U.K.)
- DXC Technology Company (U.S.)
- Altair Engineering, Inc. (U.S.)
- Hexaware Technologies Limited. (India)
- Tata Consultancy Services Limited (India)
- Infosys Limited (India)
- NTT DATA Group Corporation (Japan)
- Cloud Software Group, Inc. U.S.)
- Redis Ltd (U.S.)
Latest Developments in Global Graph Database Market
- In May 2023, AWS partnered with Neo4j, a key player in defining the graph database landscape and setting open-source standards. As an AWS Marketplace seller, Neo4j has established itself as a leader in the graph database space. In addition, the company has earned the AWS Data and Analytics Competency, highlighting its expertise in delivering advanced data solutions on the AWS platform
- In May 2023, SAP and Google Cloud announced an enhanced partnership, featuring the launch of a comprehensive open data offering aimed at streamlining data landscapes and maximizing the potential of business data. This new initiative combines SAP's and Google Cloud's data and analytics technologies to enhance the accessibility and utility of enterprise data. Furthermore, it aims to propel advancements in enterprise artificial intelligence development, facilitating greater innovation and insights for businesses
- In April 2023, Neo4j partnered with Imperium Solutions to address the rising demand for graph technology in Singapore. Through this collaboration, Imperium Solutions will help customers unlock the full potential of Neo4j, the leading graph database provider known for solving complex, enterprise-level challenges. This partnership aims to enhance the ability to efficiently identify relationships and patterns within vast datasets, driving greater value for businesses in the region
- In February 2023, IBM announced its acquisition of StepZen Inc., the creator of a GraphQL server with an innovative architecture that enables developers to build GraphQL APIs rapidly and with minimal coding. StepZen is designed for high flexibility, seamlessly integrating with various API approaches. In addition, it is offered as a Software as a Service (SaaS) solution, while also supporting deployments in private clouds and on-premises data centers, catering to diverse business needs
- In December 2022, LSEG and Microsoft entered into a 10-year strategic partnership aimed at developing next-generation data and analytics solutions, alongside cloud infrastructure enhancements. As part of this collaboration, Microsoft will make an equity investment in LSEG through a share acquisition. The partnership will leverage Microsoft Azure, artificial intelligence, and Microsoft Teams to design LSEG's data infrastructure and create innovative productivity, data analytics, and modeling solutions for users
SKU-

- Interactive Data Analysis Dashboard
- Company Analysis Dashboard for high growth potential opportunities
- Research Analyst Access for customization & queries
- Competitor Analysis with Interactive dashboard
- Latest News, Updates & Trend analysis
- Harness the Power of Benchmark Analysis for Comprehensive Competitor Tracking
Table of Content
1 INTRODUCTION
1.1 OBJECTIVES OF THE STUDY
1.2 MARKET DEFINITION
1.3 OVERVIEW OF GLOBAL GRAPH DATABASE MARKET
1.4 CURRENCY AND PRICING
1.5 LIMITATION
1.6 MARKETS COVERED
2 MARKET SEGMENTATION
2.1 KEY TAKEAWAYS
2.2 ARRIVING AT THE GLOBAL GRAPH DATABASE MARKET
2.2.1 VENDOR POSITIONING GRID
2.2.2 TECHNOLOGY LIFE LINE CURVE
2.2.3 MARKET GUIDE
2.2.4 MULTIVARIATE MODELLING
2.2.5 TOP TO BOTTOM ANALYSIS
2.2.6 STANDARDS OF MEASUREMENT
2.2.7 VENDOR SHARE ANALYSIS
2.2.8 DATA POINTS FROM KEY PRIMARY INTERVIEWS
2.2.9 DATA POINTS FROM KEY SECONDARY DATABASES
2.3 GLOBAL GRAPH DATABASE MARKET: RESEARCH SNAPSHOT
2.4 ASSUMPTIONS
3 MARKET OVERVIEW
3.1 DRIVERS
3.2 RESTRAINTS
3.3 OPPORTUNITIES
3.4 CHALLENGES
4 EXECUTIVE SUMMARY
5 PREMIUM INSIGHTS
5.1 PORTER’S FIVE FORCES ANALYSIS
5.2 REGULATORY STANDARDS
5.3 INDUSTRY ANALYSIS & FUTURISTIC SCENARIO
5.4 PENETRATION AND GROWTH POSPECT MAPPING
5.5 NEW BUSINESS AND EMERGING BUSINESS'S REVENUE OPPORTUNITIES
5.6 TECHNOLOGY ANALYSIS
5.6.1 KEY TECHNOLOGIES
5.6.2 COMPLEMENTARY TECHNOLOGIES
5.6.3 ADJACENT TECHNOLOGIES
FIGURE 1 TECHNOLOGY MATRIX
Company Product/Service offered
5.7 COMPANY COMPETITIVE ANALYSIS
5.7.1 STRATEGIC DEVELOPMENT
5.7.2 TECHNOLOGY IMPLEMENTATION PROCESS
5.7.2.1. CHALLENGES
5.7.2.2. INHOUSE IMPLEMENTATION/OUTSOURCED (THIRD PARTY) IMPLEMENTATION
5.7.3 CUSTOMER BASE
5.7.4 SERVICE POSITIONING
5.7.5 CUSTOMER FEEDBACK/RATING (B2B OR B2C)
5.7.6 APPLICATION REACH
5.7.7 SERVICE PLATFORM MATRIX
FIGURE 2 COMPANY COMPARATIVE ANALYSIS
Parameters Company A
Market Share
Growth (%)
Target Audience
Price Structure
Market Strategies
Customer Feedback
Service Positioning
Customer Feedback/Rating
Strategic Development
Application Reach
6 COMPANY SERVICE PLATFORM MATRIX
6.1 USED CASES & ITS ANALYSIS
7 FIG 4. USED CASE ANALYSIS
Company Product/Service offered
8 GLOBAL GRAPH DATABASE MARKET, BY MODEL TYPE
8.1 OVERVIEW
8.2 RESOURCE DESCRIPTION FRAMEWORK (RDF)
8.3 LABELED PROPERTY GRAPH (LPG)
8.4 HYPERGRAPHS
8.5 OTHERS
9 GLOBAL GRAPH DATABASE MARKET, BY SET OF OBJECTS
9.1 OVERVIEW
9.2 NODES
9.3 EDGES
9.4 OTHERS
10 GLOBAL GRAPH DATABASE MARKET, BY OFFERING
10.1 OVERVIEW
10.2 SOLUTION
10.2.1 BY DEPLOYMENT TYPE
10.2.1.1. ON-PREMISE
10.2.1.2. CLOUD
10.3 SERVICES
10.3.1 PROFESSIONAL SERVICES
10.3.2 MANAGED SERVICES
11 GLOBAL GRAPH DATABASE MARKET, BY ANALYSIS TYPE
11.1 OVERVIEW
11.2 PATH ANALYSIS
11.3 CONNECTIVITY ANALYSIS
11.4 COMMUNITY ANALYSIS
11.5 CENTRALITY ANALYSIS
12 GLOBAL GRAPH DATABASE MARKET, BY APPLICATION
12.1 OVERVIEW
12.2 FRAUD DETECTION
12.3 REAL-TIME RECOMMENDATION ENGINES
12.4 MASTER DATA MANAGEMENT (MDM)
12.5 NETWORK AND IT OPERATIONS
12.6 IDENTITY AND ACCESS MANAGEMENT (IAM)
13 GLOBAL GRAPH DATABASE MARKET, BY ORGANISATION TYPE
13.1 OVERVIEW
13.2 LARGE ENTERPRISES
13.3 SMALL & MEDIUM ENTERPRISES
14 GLOBAL GRAPH DATABASE MARKET, BY DEPLOYMENT MODE
14.1 OVERVIEW
14.2 ON-PREMISE
14.3 CLOUD
15 GLOBAL GRAPH DATABASE MARKET, BY END USER
15.1 OVERVIEW
15.2 MANUFACTURING & AUTOMOTIVE
15.2.1 BY OFFERING
15.2.1.1. SOLUTION
15.2.1.1.1. BY DEPLOYMENT TYPE
15.2.1.1.1.1 ON-PREMISE
15.2.1.1.1.2 CLOUD
15.2.1.1.1.3 SERVICES
15.2.1.1.1.4 PROFESSIONAL SERVICES
15.2.1.1.1.5 MANAGED SERVICES
15.3 RETAIL AND E-COMMERCE
15.3.1 SOLUTION
15.3.1.1. BY DEPLOYMENT TYPE
15.3.1.1.1. ON-PREMISE
15.3.1.1.2. CLOUD
15.3.1.2. SERVICES
15.3.1.2.1. PROFESSIONAL SERVICES
15.3.1.2.2. MANAGED SERVICES
15.4 HEALTHCARE AND PHARMACEUTICALS
15.4.1 SOLUTION
15.4.1.1. BY DEPLOYMENT TYPE
15.4.1.1.1. ON-PREMISE
15.4.1.1.2. CLOUD
15.4.1.2. SERVICES
15.4.1.2.1. PROFESSIONAL SERVICES
15.4.1.2.2. MANAGED SERVICES
15.5 BANKING, FINANCIAL SERVICES & INSURANCE
15.5.1 SOLUTION
15.5.1.1. BY DEPLOYMENT TYPE
15.5.1.1.1. ON-PREMISE
15.5.1.1.2. CLOUD
15.5.1.2. SERVICES
15.5.1.2.1. PROFESSIONAL SERVICES
15.5.1.2.2. MANAGED SERVICES
15.6 ENERGY & UTILITIES
15.6.1 SOLUTION
15.6.1.1. BY DEPLOYMENT TYPE
15.6.1.1.1. ON-PREMISE
15.6.1.1.2. CLOUD
15.6.1.2. SERVICES
15.6.1.2.1. PROFESSIONAL SERVICES
15.6.1.2.2. MANAGED SERVICES
15.7 GOVERNMENT & PUBLIC
15.7.1 SOLUTION
15.7.1.1. BY DEPLOYMENT TYPE
15.7.1.1.1. ON-PREMISE
15.7.1.1.2. CLOUD
15.7.1.2. SERVICES
15.7.1.2.1. PROFESSIONAL SERVICES
15.7.1.2.2. MANAGED SERVICES
15.8 TELECOM & IT
15.8.1 SOLUTION
15.8.1.1. BY DEPLOYMENT TYPE
15.8.1.1.1. ON-PREMISE
15.8.1.1.2. CLOUD
15.8.1.2. SERVICES
15.8.1.2.1. PROFESSIONAL SERVICES
15.8.1.2.2. MANAGED SERVICES
15.9 TRANSPORTATION & LOGISTICS
15.9.1 SOLUTION
15.9.1.1. BY DEPLOYMENT TYPE
15.9.1.1.1. ON-PREMISE
15.9.1.1.2. CLOUD
15.9.1.2. SERVICES
15.9.1.2.1. PROFESSIONAL SERVICES
15.9.1.2.2. MANAGED SERVICES
15.1 OTHERS
16 GLOBAL GRAPH DATABASE MARKET, BY REGION
16.1 GLOBAL GRAPH DATABASE MARKET, (ALL SEGMENTATION PROVIDED ABOVE IS REPRESENTED IN THIS CHAPTER BY COUNTRY)
16.1.1 NORTH AMERICA
16.1.1.1. U.S.
16.1.1.2. CANADA
16.1.1.3. MEXICO
16.1.2 EUROPE
16.1.2.1. GERMANY
16.1.2.2. FRANCE
16.1.2.3. U.K.
16.1.2.4. ITALY
16.1.2.5. SPAIN
16.1.2.6. RUSSIA
16.1.2.7. TURKEY
16.1.2.8. BELGIUM
16.1.2.9. NETHERLANDS
16.1.2.10. SWITZERLAND
16.1.2.11. SWEDEN
16.1.2.12. DENMARK
16.1.2.13. POLAND
16.1.2.14. REST OF EUROPE
16.1.3 ASIA PACIFIC
16.1.3.1. JAPAN
16.1.3.2. CHINA
16.1.3.3. SOUTH KOREA
16.1.3.4. INDIA
16.1.3.5. AUSTRALIA AND NEW ZEALAND
16.1.3.6. SINGAPORE
16.1.3.7. THAILAND
16.1.3.8. MALAYSIA
16.1.3.9. INDONESIA
16.1.3.10. PHILIPPINES
16.1.3.11. TAIWAN
16.1.3.12. VIETNAM
16.1.3.13. REST OF ASIA PACIFIC
16.1.4 SOUTH AMERICA
16.1.4.1. BRAZIL
16.1.4.2. ARGENTINA
16.1.4.3. REST OF SOUTH AMERICA
16.1.5 MIDDLE EAST AND AFRICA
16.1.5.1. SOUTH AFRICA
16.1.5.2. EGYPT
16.1.5.3. SAUDI ARABIA
16.1.5.4. U.A.E
16.1.5.5. ISRAEL
16.1.5.6. KUWAIT
16.1.5.7. QATAR
16.1.5.8. REST OF MIDDLE EAST AND AFRICA
16.2 KEY PRIMARY INSIGHTS: BY MAJOR COUNTRIES
17 GLOBAL GRAPH DATABASE MARKET, COMPANY LANDSCAPE
17.1 COMPANY SHARE ANALYSIS: GLOBAL
17.2 COMPANY SHARE ANALYSIS: NORTH AMERICA
17.3 COMPANY SHARE ANALYSIS: EUROPE
17.4 COMPANY SHARE ANALYSIS: ASIA-PACIFIC
17.5 MERGERS & ACQUISITIONS
17.6 NEW PRODUCT DEVELOPMENT & APPROVALS
17.7 EXPANSIONS
17.8 REGULATORY CHANGES
17.9 PARTNERSHIP AND OTHER STRATEGIC DEVELOPMENTS
18 GLOBAL GRAPH DATABASE MARKET, SWOT ANALYSIS
19 GLOBAL GRAPH DATABASE MARKET, COMPANY PROFILE
19.1 MICROSOFT CORPORATION
19.1.1 COMPANY SNAPSHOT
19.1.2 REVENUE ANALYSIS
19.1.3 PRODUCT PORTFOLIO
19.1.4 RECENT DEVELOPMENTS
19.2 IBM CORPORATION
19.2.1 COMPANY SNAPSHOT
19.2.2 REVENUE ANALYSIS
19.2.3 PRODUCT PORTFOLIO
19.2.4 RECENT DEVELOPMENTS
19.3 NEO4J INC.
19.3.1 COMPANY SNAPSHOT
19.3.2 REVENUE ANALYSIS
19.3.3 PRODUCT PORTFOLIO
19.3.4 RECENT DEVELOPMENTS
19.4 ORACLE CORPORATION
19.4.1 COMPANY SNAPSHOT
19.4.2 REVENUE ANALYSIS
19.4.3 PRODUCT PORTFOLIO
19.4.4 RECENT DEVELOPMENTS
19.5 DATASTAX INC.
19.5.1 COMPANY SNAPSHOT
19.5.2 REVENUE ANALYSIS
19.5.3 PRODUCT PORTFOLIO
19.5.4 RECENT DEVELOPMENTS
19.6 ARANGOGRAPH DB
19.6.1 COMPANY SNAPSHOT
19.6.2 REVENUE ANALYSIS
19.6.3 PRODUCT PORTFOLIO
19.6.4 RECENT DEVELOPMENTS
19.7 TIGERGRAPH
19.7.1 COMPANY SNAPSHOT
19.7.2 REVENUE ANALYSIS
19.7.3 PRODUCT PORTFOLIO
19.7.4 RECENT DEVELOPMENTS
19.8 AMAZON WEB SERVICES INC.
19.8.1 COMPANY SNAPSHOT
19.8.2 REVENUE ANALYSIS
19.8.3 PRODUCT PORTFOLIO
19.8.4 RECENT DEVELOPMENTS
19.9 ONTOTEXT INC.
19.9.1 COMPANY SNAPSHOT
19.9.2 REVENUE ANALYSIS
19.9.3 PRODUCT PORTFOLIO
19.9.4 RECENT DEVELOPMENTS
19.1 STARDOG UNION
19.10.1 COMPANY SNAPSHOT
19.10.2 REVENUE ANALYSIS
19.10.3 PRODUCT PORTFOLIO
19.10.4 RECENT DEVELOPMENTS
19.11 SAP SE
19.11.1 COMPANY SNAPSHOT
19.11.2 REVENUE ANALYSIS
19.11.3 PRODUCT PORTFOLIO
19.11.4 RECENT DEVELOPMENTS
19.12 MARKLOGIC CORPORATION
19.12.1 COMPANY SNAPSHOT
19.12.2 REVENUE ANALYSIS
19.12.3 PRODUCT PORTFOLIO
19.12.4 RECENT DEVELOPMENTS
19.13 TIBCO SOFTWARE INC. (CLOUD SOFTWARE GROUP)
19.13.1 COMPANY SNAPSHOT
19.13.2 REVENUE ANALYSIS
19.13.3 PRODUCT PORTFOLIO
19.13.4 RECENT DEVELOPMENTS
19.14 FRANZ INC.
19.14.1 COMPANY SNAPSHOT
19.14.2 REVENUE ANALYSIS
19.14.3 PRODUCT PORTFOLIO
19.14.4 RECENT DEVELOPMENTS
19.15 OPENLINK SOFTWARE
19.15.1 COMPANY SNAPSHOT
19.15.2 REVENUE ANALYSIS
19.15.3 PRODUCT PORTFOLIO
19.15.4 RECENT DEVELOPMENTS
19.16 BITNINE CO. LTD.
19.16.1 COMPANY SNAPSHOT
19.16.2 REVENUE ANALYSIS
19.16.3 PRODUCT PORTFOLIO
19.16.4 RECENT DEVELOPMENTS
19.17 FLUREE
19.17.1 COMPANY SNAPSHOT
19.17.2 REVENUE ANALYSIS
19.17.3 PRODUCT PORTFOLIO
19.17.4 RECENT DEVELOPMENTS
19.18 DGRAPH
19.18.1 COMPANY SNAPSHOT
19.18.2 REVENUE ANALYSIS
19.18.3 PRODUCT PORTFOLIO
19.18.4 RECENT DEVELOPMENTS
19.19 REDIS LABS
19.19.1 COMPANY SNAPSHOT
19.19.2 REVENUE ANALYSIS
19.19.3 PRODUCT PORTFOLIO
19.19.4 RECENT DEVELOPMENTS
19.2 ALTAIR ENGINEERING INC.
19.20.1 COMPANY SNAPSHOT
19.20.2 REVENUE ANALYSIS
19.20.3 PRODUCT PORTFOLIO
19.20.4 RECENT DEVELOPMENTS
NOTE: THE COMPANIES PROFILED IS NOT EXHAUSTIVE LIST AND IS AS PER OUR PREVIOUS CLIENT REQUIREMENT. WE PROFILE MORE THAN 100 COMPANIES IN OUR STUDY AND HENCE THE LIST OF COMPANIES CAN BE MODIFIED OR REPLACED ON REQUEST
20 RELATED REPORTS
21 QUESTIONNAIRE
22 ABOUT DATA BRIDGE MARKET RESEARCH
Data collection and base year analysis are done using data collection modules with large sample sizes. The stage includes obtaining market information or related data through various sources and strategies. It includes examining and planning all the data acquired from the past in advance. It likewise envelops the examination of information inconsistencies seen across different information sources. The market data is analysed and estimated using market statistical and coherent models. Also, market share analysis and key trend analysis are the major success factors in the market report. To know more, please request an analyst call or drop down your inquiry.
The key research methodology used by DBMR research team is data triangulation which involves data mining, analysis of the impact of data variables on the market and primary (industry expert) validation. Data models include Vendor Positioning Grid, Market Time Line Analysis, Market Overview and Guide, Company Positioning Grid, Patent Analysis, Pricing Analysis, Company Market Share Analysis, Standards of Measurement, Global versus Regional and Vendor Share Analysis. To know more about the research methodology, drop in an inquiry to speak to our industry experts.
Data Bridge Market Research is a leader in advanced formative research. We take pride in servicing our existing and new customers with data and analysis that match and suits their goal. The report can be customized to include price trend analysis of target brands understanding the market for additional countries (ask for the list of countries), clinical trial results data, literature review, refurbished market and product base analysis. Market analysis of target competitors can be analyzed from technology-based analysis to market portfolio strategies. We can add as many competitors that you require data about in the format and data style you are looking for. Our team of analysts can also provide you data in crude raw excel files pivot tables (Fact book) or can assist you in creating presentations from the data sets available in the report.


