
Global Heart Failure Drugs Market
Market Size in USD Million
 USD
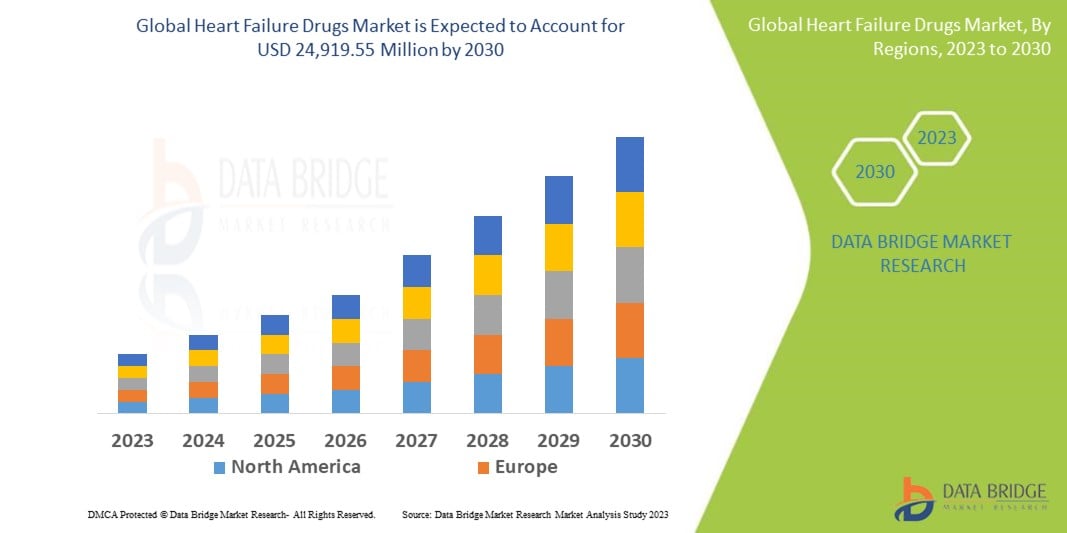
8,010.62 Million
USD
24,919.55 Million
2023
2030
USD
8,010.62 Million
USD
24,919.55 Million
2023
2030
| 2024 - 2030 | |
| USD 8,010.62 Million | |
| USD 24,919.55 Million | |
| % | |
|
Heart Failure Drugs Market Analysis and Size
The increase in the rate of cardiovascular cases among people and the growing geriatric population globally are the major factors driving the heart failure drugs market. The increase in the need for these drugs as they treat different symptoms of the disorder and the patient's dependency on them accelerates the growth of heart failure drugs. The change in lifestyle, such as excessive alcohol consumption, smoking, and unhealthy diet habits, causes heart problems propelling the heart failure drugs market. The increase in investment by key players and the increase in research and development activities influence the heart failure drugs market. Additionally, increased heart problems due to obesity and lack of physical activities boost the heart failure drugs market. Furthermore, the rise in demand for effective drugs and treatment and product approval extends profitable opportunities to the market of heart failure drugs.
However, the side effects of consuming these drugs are expected to obstruct the heart failure drug market growth. Rising concerns regarding increasing contractility may damage the myocardium and shorten the survival of these patients is projected to challenge the heart failure drugs market.
Data Bridge Market Research analyses that the heart failure drugs market which was USD 8,010.62 million in 2023, would rocket up to USD 24,919.55 million by 2030, and is expected to undergo a CAGR of 15.56% during the forecast period. This indicates that the market value. "Beta blockers" dominates the type segment of the heart failure drugs market due to increasing awareness about heart failure drugs. In addition to the insights on market scenarios such as market value, growth rate, segmentation, geographical coverage, and major players, the market reports curated by the Data Bridge Market Research also include depth expert analysis, patient epidemiology, pipeline analysis, pricing analysis, and regulatory framework.
Heart Failure Drugs Market Scope and Segmentation
|
Report Metric |
Details |
|
Forecast Period |
2023 to 2030 |
|
Base Year |
2022 |
|
Historic Years |
2021 (Customizable to 2015-2020) |
|
Quantitative Units |
Revenue in USD Million, Volumes in Units, Pricing in USD |
|
Segments Covered |
By Type (ACE Inhibitors, Angiotensin Receptor Blockers, Beta Blockers, Diuretics, Others), Application (Injection, Capsule, Tablets), Distribution Channel (Hospital Pharmacies, Retail Pharmacies, Online Pharmacies), End Users (Hospitals, Specialty Centres, Others) |
|
Countries Covered |
U.S., Canada, Mexico, Germany, Italy, U.K., France, Spain, Netherland, Belgium, Switzerland, Turkey, Russia, Rest of Europe, Japan, China, India, South Korea, Australia, Singapore, Malaysia, Thailand, Indonesia, Philippines, Rest of Asia-Pacific, Brazil, Argentina, Rest of South America, South Africa, Saudi Arabia, U.A.E., Egypt, Israel, Rest of Middle East and Africa |
|
Market Players Covered |
Amgen Inc. (U.S.), AstraZeneca (U.K.), Bayer AG (Germany), Novartis AG (Switzerland), Gilead Sciences, Inc (U.S.), GlaxoSmithKline plc (U.K.), Pfizer Inc. (U.S.), Teva Pharmaceutical Industries Ltd (Israel), Cardurion Pharmaceuticals (U.S.), Cardior Pharmaceuticals (Germany), Actelion Pharmaceuticals Ltd (Switzerland), Boehringer Ingelheim International GmbH (Germany), Bristol-Myers Squibb Company (U.S.), CYTOKINETICS, INC. (U.S.), and Eli Lilly and Company (U.S.) among others. |
|
Market Opportunities |
|
Market Definition
The heart failure drugs market refers to the global pharmaceutical industry segment that encompasses developing, producing, and commercializing medications specifically designed to treat heart failure. Heart failure is a chronic medical condition characterized by the heart's inability to pump enough blood to meet the body's demands. This market focuses on drugs that aim to alleviate symptoms, improve heart function, and enhance patients' quality of life.
Heart failure drugs include a range of therapeutic agents targeting different aspects of the condition, such as reducing fluid build-up, managing blood pressure, improving cardiac contractility, and addressing underlying causes. These medications can include diuretics, angiotensin-converting enzyme (ACE) inhibitors, angiotensin receptor blockers (ARBs), beta-blockers, aldosterone antagonists, and others.
Heart Failure Drugs Market Dynamics
Drivers
- Increasing Prevalence of Heart Failure
The global prevalence of heart failure is rising due to an aging population, sedentary lifestyles, unhealthy dietary habits, and increased risk factors like obesity, diabetes, and hypertension. This growing patient population fuels the demand for effective heart failure drugs.
- Rising Awareness and Early Diagnosis
Increasing awareness about heart failure symptoms, risk factors, and the importance of early diagnosis has resulted in more patients seeking medical help at an earlier stage. Timely diagnosis enables prompt initiation of treatment, leading to a greater demand for heart failure drugs.
- Growing Healthcare Expenditure
Rising healthcare expenditure globally, especially in developed economies, increases access to healthcare services and medications. Governments and private insurers often cover a significant portion of the costs associated with heart failure drugs, making them more accessible to patients.
Opportunities
- Technological Advancements and Medical Innovations
Medical research and technological advances have led to development of novel therapeutic approaches and drug formulations for heart failure treatment. These innovations include introducing new drug classes, improved drug delivery systems, and targeted therapies, enhancing the effectiveness and safety of heart failure drugs.
Restraint/Challenge
- High Development Costs
The research, development, and clinical trial costs of bringing a heart failure drug to market can be substantial. The extensive investment required and the risk of failure during the development process can deter some pharmaceutical companies from pursuing research in this field. High development costs may limit the number of new drugs entering the market and potentially slow innovation.
This heart failure drugs market report provides details of new recent developments, trade regulations, import-export analysis, production analysis, value chain optimization, market share, the impact of domestic and localized market players, analyses opportunities in terms of emerging revenue pockets, changes in market regulations, strategic market growth analysis, market size, category market growths, application niches and dominance, product approvals, product launches, geographic expansions, technological innovations in the market. To gain more info on the Heart failure drugs market contact Data Bridge Market Research for an Analyst Brief, our team will help you take an informed market decision to achieve market growth.
Recent Development
- In September 2022, Bayer launched a novel heart failure drug in India that it has co-developed with Merck at one-fifteenth of the global price at Rs 127 per pill. It's a one-pill-a-day therapy. Verquvo (vericiguat) is the first novel treatment approved to reduce the risk of cardiovascular deaths and repeated hospitalization among worsening heart failure patients.
Global Heart Failure Drugs Market Scope
The heart failure drugs market is segmented on the basis of type, application, distribution channel, and end users. The growth amongst these segments will help you meagre growth segments in the industries and provide the users with a valuable market overview and insights to help them make strategic decisions for identifying core market applications.
Type
- ACE Inhibitors
- Angiotensin Receptor Blockers
- Beta Blockers
- Diuretics
- Others
Application
- Injection
- Capsule
- Tablets
Distribution Channel
- Hospital Pharmacies
- Retail Pharmacies
- Online Pharmacies
End Users
- Hospitals
- Specialty Centres
- Others
Heart failure drugs Market Regional Analysis/Insights
The Heart failure drugs market is analysed and market size insights and trends are provided by country, type, application, distribution channel, and end usesr as referenced above.
The countries covered in the Heart failure drugs market report is U.S., Canada, Mexico, Germany, Italy, U.K., France, Spain, Netherland, Belgium, Switzerland, Turkey, Russia, Rest of Europe, Japan, China, India, South Korea, Australia, Singapore, Malaysia, Thailand, Indonesia, Philippines, Rest of Asia-Pacific, Brazil, Argentina, Rest of South America, South Africa, Saudi Arabia, U.A.E, Egypt, Israel, Rest of Middle East and Africa.
North America is expected to dominate the global heart failure drugs market due to the increasing prevalence of heart disease in that region.
Asia-Pacific is the fastest-growing region due to increasing awareness and interest in health and wellness.
The country section of the report also provides individual market impacting factors and domestic regulation changes that impact the current and future trends of the market. Data points like down-stream and upstream value chain analysis, technical trends and porter's five forces analysis, case studies are some of the pointers used to forecast the market scenario for individual countries. Also, the presence and availability of global brands and their challenges faced due to large or scarce competition from local and domestic brands, impact of domestic tariffs and trade routes are considered while providing forecast analysis of the country data.
Healthcare Infrastructure growth Installed base and New Technology Penetration
The heart failure drugs market also provides you with detailed market analysis for every country growth in healthcare expenditure for capital equipment, installed base of different kind of products for heart failure drugs market, impact of technology using life line curves and changes in healthcare regulatory scenarios and their impact on the market. The data is available for historic period 2015-2020.
Competitive Landscape and Heart Failure Drugs Market Share Analysis
The heart failure drugs market competitive landscape provides details by competitor. Details included are company overview, company financials, revenue generated, market potential, investment in research and development, new market initiatives, global presence, production sites and facilities, production capacities, company strengths and weaknesses, product launch, product width and breadth, application dominance. The above data points provided are only related to the companies' focus related to the market.
Some of the major players operating in the heart failure drugs market are:
- Amgen Inc. (U.S.)
- AstraZeneca (U.K.)
- Bayer AG (Germany)
- Novartis AG (Switzerland)
- Gilead Sciences, Inc (U.S.)
- GlaxoSmithKline plc (U.K.)
- Pfizer Inc. (U.S.)
- Teva Pharmaceutical Industries Ltd (Israel)
- Cardurion Pharmaceuticals (U.S.)
- Cardior Pharmaceuticals (Germany)
- Actelion Pharmaceuticals Ltd (Switzerland)
- Boehringer Ingelheim International GmbH (Germany)
- Bristol-Myers Squibb Company (U.S.)
- CYTOKINETICS, INC. (U.S.)
- Eli Lilly and Company (U.S.)
SKU-

- Interactive Data Analysis Dashboard
- Company Analysis Dashboard for high growth potential opportunities
- Research Analyst Access for customization & queries
- Competitor Analysis with Interactive dashboard
- Latest News, Updates & Trend analysis
- Harness the Power of Benchmark Analysis for Comprehensive Competitor Tracking
Table of Content
1 INTRODUCTION
1.1 OBJECTIVES OF THE STUDY
1.2 MARKET DEFINITION
1.3 OVERVIEW OF GLOBAL HEART FAILURE DRUGS MARKET
1.4 CURRENCY AND PRICING
1.5 LIMITATION
1.6 MARKETS COVERED
2 MARKET SEGMENTATION
2.1 KEY TAKEAWAYS
2.2 ARRIVING AT THE GLOBAL HEART FAILURE DRUGS MARKET SIZE
2.2.1 VENDOR POSITIONING GRID
2.2.2 TECHNOLOGY LIFE LINE CURVE
2.2.3 TRIPOD DATA VALIDATION MODEL
2.2.4 MARKET GUIDE
2.2.5 MULTIVARIATE MODELLING
2.2.6 TOP TO BOTTOM ANALYSIS
2.2.7 CHALLENGE MATRIX
2.2.8 APPLICATION COVERAGE GRID
2.2.9 STANDARDS OF MEASUREMENT
2.2.10 VENDOR SHARE ANALYSIS
2.2.11 SALES VALUE , VOLUME AND ASP
2.2.12 DATA POINTS FROM KEY PRIMARY INTERVIEWS
2.2.13 DATA POINTS FROM KEY SECONDARY DATABASES
2.3 GLOBAL HEART FAILURE DRUGS MARKET: RESEARCH SNAPSHOT
2.4 ASSUMPTIONS
3 MARKET OVERVIEW
3.1 DRIVERS
3.2 RESTRAINTS
3.3 OPPORTUNITIES
3.4 CHALLENGES
4 EXECUTIVE SUMMARY
5 EPIDEMIOLOGY ANALYSIS
6 PREMIUM INSIGHTS
6.1 PESTEL ANALYSIS
6.2 PORTER’S 5 FORCES
6.3 PATENT ANALYSIS
6.4 REIMBURSEMENT SCENARIO
6.5 GLOBAL HEART FAILURE DRUGS MARKET ANALYSIS (QUALITATIVE AND QUANTITATIVE ANALYSIS)
7 INDUSTRY INSIGHTS
7.1 DEMOGRAPHIC TRENDS: IMPACTS ON ALL INCIDENCE RATES
7.2 KEY PRICING STRATEGIES
7.3 INTERVIEWS WITH DRUG COMPANIES
7.4 INTERVIEWS WITH PHYSICIANS AND TECHNICIANS
7.5 OTHER KOL SNAPSHOTS
8 REGULATORY FRAMWORKAS
9 PIPELINE ANALYSIS
9.1 PHASE III CANDIDATES
9.2 PHASE II CANDIDATES
9.3 PHASE I CANDIDATES
9.4 PRECLINICAL & RESEARCH CANDIDATES
10 GLOBAL HEART FAILURE DRUGS MARKET, BY DRUG CLASS
10.1 OVERVIEW
10.2 ANGIOTENSIN-CONVERTING ENZYME (ACE) INHIBITORS
10.2.1 BY TYPE
10.2.1.1. CAPTOPRIL
10.2.1.1.1. MARKET VALUE (USD MN)
10.2.1.1.2. MARKET VOLUME (SU)
10.2.1.1.3. AVERAGE SELLING PRICE (USD)
10.2.1.2. ENALAPRIL
10.2.1.2.1. MARKET VALUE (USD MN)
10.2.1.2.2. MARKET VOLUME (SU)
10.2.1.2.3. AVERAGE SELLING PRICE (USD)
10.2.1.3. FOSINOPRIL
10.2.1.3.1. MARKET VALUE (USD MN)
10.2.1.3.2. MARKET VOLUME (SU)
10.2.1.3.3. AVERAGE SELLING PRICE (USD)
10.2.1.4. PERINDOPRIL
10.2.1.4.1. MARKET VALUE (USD MN)
10.2.1.4.2. MARKET VOLUME (SU)
10.2.1.4.3. AVERAGE SELLING PRICE (USD)
10.2.1.5. QUINAPRIL
10.2.1.5.1. MARKET VALUE (USD MN)
10.2.1.5.2. MARKET VOLUME (SU)
10.2.1.5.3. AVERAGE SELLING PRICE (USD)
10.2.1.6. TRANDOLAPRIL
10.2.1.6.1. MARKET VALUE (USD MN)
10.2.1.6.2. MARKET VOLUME (SU)
10.2.1.6.3. AVERAGE SELLING PRICE (USD)
10.2.1.7. OTHERS
10.2.2 BY ROUTE OF ADMINISTRATION
10.2.2.1. ORAL
10.2.2.1.1. MARKET VALUE (USD MN)
10.2.2.1.2. MARKET VOLUME (SU)
10.2.2.1.3. AVERAGE SELLING PRICE (USD)
10.2.2.2. PARENTERAL
10.2.2.2.1. MARKET VALUE (USD MN)
10.2.2.2.2. MARKET VOLUME (SU)
10.2.2.2.3. AVERAGE SELLING PRICE (USD)
10.2.2.3. OTHERS
10.2.3 BY DRUG TYPE
10.2.3.1. BRANDED
10.2.3.1.1. MARKET VALUE (USD MN)
10.2.3.1.2. MARKET VOLUME (SU)
10.2.3.1.3. AVERAGE SELLING PRICE (USD)
10.2.3.2. GENERIC
10.2.3.2.1. MARKET VALUE (USD MN)
10.2.3.2.2. MARKET VOLUME (SU)
10.2.3.2.3. AVERAGE SELLING PRICE (USD)
10.3 ANGIOTENSIN II RECEPTOR BLOCKERS (ARB OR AIIRA)
10.3.1 BY TYPE
10.3.1.1. CANDESARTAN
10.3.1.1.1. MARKET VALUE (USD MN)
10.3.1.1.2. MARKET VOLUME (SU)
10.3.1.1.3. AVERAGE SELLING PRICE (USD)
10.3.1.2. LOSARTAN
10.3.1.2.1. MARKET VALUE (USD MN)
10.3.1.2.2. MARKET VOLUME (SU)
10.3.1.2.3. AVERAGE SELLING PRICE (USD)
10.3.1.3. VALSARTAN
10.3.1.3.1. MARKET VALUE (USD MN)
10.3.1.3.2. MARKET VOLUME (SU)
10.3.1.3.3. AVERAGE SELLING PRICE (USD)
10.3.1.4. OTHERS
10.3.2 BY ROUTE OF ADMINISTRATION
10.3.2.1. ORAL
10.3.2.1.1. MARKET VALUE (USD MN)
10.3.2.1.2. MARKET VOLUME (SU)
10.3.2.1.3. AVERAGE SELLING PRICE (USD)
10.3.2.2. PARENTERAL
10.3.2.2.1. MARKET VALUE (USD MN)
10.3.2.2.2. MARKET VOLUME (SU)
10.3.2.2.3. AVERAGE SELLING PRICE (USD)
10.3.2.3. OTHERS
10.3.3 BY DRUG TYPE
10.3.3.1. BRANDED
10.3.3.1.1. MARKET VALUE (USD MN)
10.3.3.1.2. MARKET VOLUME (SU)
10.3.3.1.3. AVERAGE SELLING PRICE (USD)
10.3.3.2. GENERIC
10.3.3.2.1. MARKET VALUE (USD MN)
10.3.3.2.2. MARKET VOLUME (SU)
10.3.3.2.3. AVERAGE SELLING PRICE (USD)
10.4 BETA BLOCKERS
10.4.1 BY TYPE
10.4.1.1. BISOPROLOL
10.4.1.1.1. MARKET VALUE (USD MN)
10.4.1.1.2. MARKET VOLUME (SU)
10.4.1.1.3. AVERAGE SELLING PRICE (USD)
10.4.1.2. METOPROLOL SUCCINATE
10.4.1.2.1. MARKET VALUE (USD MN)
10.4.1.2.2. MARKET VOLUME (SU)
10.4.1.2.3. AVERAGE SELLING PRICE (USD)
10.4.1.3. CARVEDILOL
10.4.1.3.1. MARKET VALUE (USD MN)
10.4.1.3.2. MARKET VOLUME (SU)
10.4.1.3.3. AVERAGE SELLING PRICE (USD)
10.4.1.4. CARVEDILOL CR
10.4.1.4.1. MARKET VALUE (USD MN)
10.4.1.4.2. MARKET VOLUME (SU)
10.4.1.4.3. AVERAGE SELLING PRICE (USD)
10.4.1.5. OTHERS
10.4.2 BY ROUTE OF ADMINISTRATION
10.4.2.1. ORAL
10.4.2.1.1. MARKET VALUE (USD MN)
10.4.2.1.2. MARKET VOLUME (SU)
10.4.2.1.3. AVERAGE SELLING PRICE (USD)
10.4.2.2. PARENTERAL
10.4.2.2.1. MARKET VALUE (USD MN)
10.4.2.2.2. MARKET VOLUME (SU)
10.4.2.2.3. AVERAGE SELLING PRICE (USD)
10.4.2.3. OTHERS
10.4.3 BY DRUG TYPE
10.4.3.1. BRANDED
10.4.3.1.1. MARKET VALUE (USD MN)
10.4.3.1.2. MARKET VOLUME (SU)
10.4.3.1.3. AVERAGE SELLING PRICE (USD)
10.4.3.2. GENERIC
10.4.3.2.1. MARKET VALUE (USD MN)
10.4.3.2.2. MARKET VOLUME (SU)
10.4.3.2.3. AVERAGE SELLING PRICE (USD)
10.5 ALDOSTERONE ANTAGONISTS
10.5.1 BY TYPE
10.5.1.1. SPIRONOLACTONE
10.5.1.1.1. MARKET VALUE (USD MN)
10.5.1.1.2. MARKET VOLUME (SU)
10.5.1.1.3. AVERAGE SELLING PRICE (USD)
10.5.1.2. EPLERENONE
10.5.1.2.1. MARKET VALUE (USD MN)
10.5.1.2.2. MARKET VOLUME (SU)
10.5.1.2.3. AVERAGE SELLING PRICE (USD)
10.5.1.3. OTHERS
10.5.2 BY ROUTE OF ADMINISTRATION
10.5.2.1. ORAL
10.5.2.1.1. MARKET VALUE (USD MN)
10.5.2.1.2. MARKET VOLUME (SU)
10.5.2.1.3. AVERAGE SELLING PRICE (USD)
10.5.2.2. PARENTERAL
10.5.2.2.1. MARKET VALUE (USD MN)
10.5.2.2.2. MARKET VOLUME (SU)
10.5.2.2.3. AVERAGE SELLING PRICE (USD)
10.5.2.3. OTHERS
10.5.3 BY DRUG TYPE
10.5.3.1. BRANDED
10.5.3.1.1. MARKET VALUE (USD MN)
10.5.3.1.2. MARKET VOLUME (SU)
10.5.3.1.3. AVERAGE SELLING PRICE (USD)
10.5.3.2. GENERIC
10.5.3.2.1. MARKET VALUE (USD MN)
10.5.3.2.2. MARKET VOLUME (SU)
10.5.3.2.3. AVERAGE SELLING PRICE (USD)
10.6 DIURETICS
10.6.1 BY TYPE
10.6.1.1. FUROSEMIDE
10.6.1.1.1. MARKET VALUE (USD MN)
10.6.1.1.2. MARKET VOLUME (SU)
10.6.1.1.3. AVERAGE SELLING PRICE (USD)
10.6.1.2. BUMETANIDE
10.6.1.2.1. MARKET VALUE (USD MN)
10.6.1.2.2. MARKET VOLUME (SU)
10.6.1.2.3. AVERAGE SELLING PRICE (USD)
10.6.1.3. TORSEMIDE
10.6.1.3.1. MARKET VALUE (USD MN)
10.6.1.3.2. MARKET VOLUME (SU)
10.6.1.3.3. AVERAGE SELLING PRICE (USD)
10.6.1.4. CHLORTHIAZIDE
10.6.1.4.1. MARKET VALUE (USD MN)
10.6.1.4.2. MARKET VOLUME (SU)
10.6.1.4.3. AVERAGE SELLING PRICE (USD)
10.6.1.5. AMILORIDE
10.6.1.5.1. MARKET VALUE (USD MN)
10.6.1.5.2. MARKET VOLUME (SU)
10.6.1.5.3. AVERAGE SELLING PRICE (USD)
10.6.1.6. HYDROCHLORTHIAZIDE
10.6.1.6.1. MARKET VALUE (USD MN)
10.6.1.6.2. MARKET VOLUME (SU)
10.6.1.6.3. AVERAGE SELLING PRICE (USD)
10.6.1.7. INDAPAMIDE
10.6.1.7.1. MARKET VALUE (USD MN)
10.6.1.7.2. MARKET VOLUME (SU)
10.6.1.7.3. AVERAGE SELLING PRICE (USD)
10.6.1.8. METOLAZONE
10.6.1.8.1. MARKET VALUE (USD MN)
10.6.1.8.2. MARKET VOLUME (SU)
10.6.1.8.3. AVERAGE SELLING PRICE (USD)
10.6.1.9. TRIAMTERENE
10.6.1.9.1. MARKET VALUE (USD MN)
10.6.1.9.2. MARKET VOLUME (SU)
10.6.1.9.3. AVERAGE SELLING PRICE (USD)
10.6.1.10. OTHERS
10.6.2 BY ROUTE OF ADMINISTRATION
10.6.2.1. ORAL
10.6.2.1.1. MARKET VALUE (USD MN)
10.6.2.1.2. MARKET VOLUME (SU)
10.6.2.1.3. AVERAGE SELLING PRICE (USD)
10.6.2.2. PARENTERAL
10.6.2.2.1. MARKET VALUE (USD MN)
10.6.2.2.2. MARKET VOLUME (SU)
10.6.2.2.3. AVERAGE SELLING PRICE (USD)
10.6.2.3. OTHERS
10.6.3 BY DRUG TYPE
10.6.3.1. BRANDED
10.6.3.1.1. MARKET VALUE (USD MN)
10.6.3.1.2. MARKET VOLUME (SU)
10.6.3.1.3. AVERAGE SELLING PRICE (USD)
10.6.3.2. GENERIC
10.6.3.2.1. MARKET VALUE (USD MN)
10.6.3.2.2. MARKET VOLUME (SU)
10.6.3.2.3. AVERAGE SELLING PRICE (USD)
10.7 IF CHANNEL BLOCKER
10.7.1 BY TYPE
10.7.1.1. IVABRADINE
10.7.1.1.1. MARKET VALUE (USD MN)
10.7.1.1.2. MARKET VOLUME (SU)
10.7.1.1.3. AVERAGE SELLING PRICE (USD)
10.7.1.2. OTHERS
10.7.2 BY ROUTE OF ADMINISTRATION
10.7.2.1. ORAL
10.7.2.1.1. MARKET VALUE (USD MN)
10.7.2.1.2. MARKET VOLUME (SU)
10.7.2.1.3. AVERAGE SELLING PRICE (USD)
10.7.2.2. PARENTERAL
10.7.2.2.1. MARKET VALUE (USD MN)
10.7.2.2.2. MARKET VOLUME (SU)
10.7.2.2.3. AVERAGE SELLING PRICE (USD)
10.7.2.3. OTHERS
10.7.3 BY DRUG TYPE
10.7.3.1. BRANDED
10.7.3.1.1. MARKET VALUE (USD MN)
10.7.3.1.2. MARKET VOLUME (SU)
10.7.3.1.3. AVERAGE SELLING PRICE (USD)
10.7.3.2. GENERIC
10.7.3.2.1. MARKET VALUE (USD MN)
10.7.3.2.2. MARKET VOLUME (SU)
10.7.3.2.3. AVERAGE SELLING PRICE (USD)
10.8 COMBINATION DRUGS
10.8.1 BY TYPE
10.8.1.1. HYDRALAZINE AND ISOSORBIDE DINITRATE
10.8.1.1.1. MARKET VALUE (USD MN)
10.8.1.1.2. MARKET VOLUME (SU)
10.8.1.1.3. AVERAGE SELLING PRICE (USD)
10.8.1.2. SACUBTRIL VALSARTAN (ARNIS)
10.8.1.2.1. MARKET VALUE (USD MN)
10.8.1.2.2. MARKET VOLUME (SU)
10.8.1.2.3. AVERAGE SELLING PRICE (USD)
10.8.1.3. OTHERS
10.8.2 BY ROUTE OF ADMINISTRATION
10.8.2.1. ORAL
10.8.2.1.1. MARKET VALUE (USD MN)
10.8.2.1.2. MARKET VOLUME (SU)
10.8.2.1.3. AVERAGE SELLING PRICE (USD)
10.8.2.2. PARENTERAL
10.8.2.2.1. MARKET VALUE (USD MN)
10.8.2.2.2. MARKET VOLUME (SU)
10.8.2.2.3. AVERAGE SELLING PRICE (USD)
10.8.2.3. OTHERS
10.8.3 BY DRUG TYPE
10.8.3.1. BRANDED
10.8.3.1.1. MARKET VALUE (USD MN)
10.8.3.1.2. MARKET VOLUME (SU)
10.8.3.1.3. AVERAGE SELLING PRICE (USD)
10.8.3.2. GENERIC
10.8.3.2.1. MARKET VALUE (USD MN)
10.8.3.2.2. MARKET VOLUME (SU)
10.8.3.2.3. AVERAGE SELLING PRICE (USD)
10.9 SODIUM-GLUCOSE COTRANSPORTER-2 (SGL2) INHIBITOR
10.9.1 BY TYPE
10.9.1.1. DAPAGLIFLOZIN
10.9.1.1.1. MARKET VALUE (USD MN)
10.9.1.1.2. MARKET VOLUME (SU)
10.9.1.1.3. AVERAGE SELLING PRICE (USD)
10.9.1.2. EMPAGLIFLOZIN
10.9.1.2.1. MARKET VALUE (USD MN)
10.9.1.2.2. MARKET VOLUME (SU)
10.9.1.2.3. AVERAGE SELLING PRICE (USD)
10.9.1.3. OTHERS
10.9.2 BY ROUTE OF ADMINISTRATION
10.9.2.1. ORAL
10.9.2.1.1. MARKET VALUE (USD MN)
10.9.2.1.2. MARKET VOLUME (SU)
10.9.2.1.3. AVERAGE SELLING PRICE (USD)
10.9.2.2. PARENTERAL
10.9.2.2.1. MARKET VALUE (USD MN)
10.9.2.2.2. MARKET VOLUME (SU)
10.9.2.2.3. AVERAGE SELLING PRICE (USD)
10.9.2.3. OTHERS
10.9.3 BY DRUG TYPE
10.9.3.1. BRANDED
10.9.3.1.1. MARKET VALUE (USD MN)
10.9.3.1.2. MARKET VOLUME (SU)
10.9.3.1.3. AVERAGE SELLING PRICE (USD)
10.9.3.2. GENERIC
10.9.3.2.1. MARKET VALUE (USD MN)
10.9.3.2.2. MARKET VOLUME (SU)
10.9.3.2.3. AVERAGE SELLING PRICE (USD)
10.1 DIGOXIN
10.10.1 BY ROUTE OF ADMINISTRATION
10.10.1.1. ORAL
10.10.1.1.1. MARKET VALUE (USD MN)
10.10.1.1.2. MARKET VOLUME (SU)
10.10.1.1.3. AVERAGE SELLING PRICE (USD)
10.10.1.2. PARENTERAL
10.10.1.2.1. MARKET VALUE (USD MN)
10.10.1.2.2. MARKET VOLUME (SU)
10.10.1.2.3. AVERAGE SELLING PRICE (USD)
10.10.1.3. OTHERS
10.10.2 BY DRUG TYPE
10.10.2.1. BRANDED
10.10.2.1.1. MARKET VALUE (USD MN)
10.10.2.1.2. MARKET VOLUME (SU)
10.10.2.1.3. AVERAGE SELLING PRICE (USD)
10.10.2.2. GENERIC
10.10.2.2.1. MARKET VALUE (USD MN)
10.10.2.2.2. MARKET VOLUME (SU)
10.10.2.2.3. AVERAGE SELLING PRICE (USD)
10.11 VERICIGUAT
10.11.1 BY ROUTE OF ADMINISTRATION
10.11.1.1. ORAL
10.11.1.1.1. MARKET VALUE (USD MN)
10.11.1.1.2. MARKET VOLUME (SU)
10.11.1.1.3. AVERAGE SELLING PRICE (USD)
10.11.1.2. PARENTERAL
10.11.1.2.1. MARKET VALUE (USD MN)
10.11.1.2.2. MARKET VOLUME (SU)
10.11.1.2.3. AVERAGE SELLING PRICE (USD)
10.11.1.3. OTHERS
10.11.1.3.1. MARKET VALUE (USD MN)
10.11.1.3.2. MARKET VOLUME (SU)
10.11.1.3.3. AVERAGE SELLING PRICE (USD)
10.11.2 BY DRUG TYPE
10.11.2.1. BRANDED
10.11.2.1.1. MARKET VALUE (USD MN)
10.11.2.1.2. MARKET VOLUME (SU)
10.11.2.1.3. AVERAGE SELLING PRICE (USD)
10.11.2.2. GENERIC
10.11.2.2.1. MARKET VALUE (USD MN)
10.11.2.2.2. MARKET VOLUME (SU)
10.11.2.2.3. AVERAGE SELLING PRICE (USD)
10.12 OTHERS
10.12.1 ANTICOAGULANTS
10.12.1.1. MARKET VALUE (USD MN)
10.12.1.2. MARKET VOLUME (SU)
10.12.1.3. AVERAGE SELLING PRICE (USD)
10.12.2 CHOLESTEROL-LOWERING DRUGS
10.12.2.1. MARKET VALUE (USD MN)
10.12.2.2. MARKET VOLUME (SU)
10.12.2.3. AVERAGE SELLING PRICE (USD)
10.12.3 OTHERS
10.12.4 BY ROUTE OF ADMINISTRATION
10.12.4.1. ORAL
10.12.4.1.1. MARKET VALUE (USD MN)
10.12.4.1.2. MARKET VOLUME (SU)
10.12.4.1.3. AVERAGE SELLING PRICE (USD)
10.12.4.2. PARENTERAL
10.12.4.2.1. MARKET VALUE (USD MN)
10.12.4.2.2. MARKET VOLUME (SU)
10.12.4.2.3. AVERAGE SELLING PRICE (USD)
10.12.4.3. OTHERS
10.12.5 BY DRUG TYPE
10.12.5.1. BRANDED
10.12.5.1.1. MARKET VALUE (USD MN)
10.12.5.1.2. MARKET VOLUME (SU)
10.12.5.1.3. AVERAGE SELLING PRICE (USD)
10.12.5.2. GENERIC
10.12.5.2.1. MARKET VALUE (USD MN)
10.12.5.2.2. MARKET VOLUME (SU)
10.12.5.2.3. AVERAGE SELLING PRICE (USD)
11 GLOBAL HEART FAILURE DRUGS MARKET, BY DRUG TYPE
11.1 OVERVIEW
11.2 GENERICS
11.3 BRANDED
12 GLOBAL HEART FAILURE DRUGS MARKET, BY ROUTE OF ADMINISTRATION
12.1 OVERVIEW
12.2 ORAL
12.3 PARENTERAL
12.4 OTHERS
13 GLOBAL HEART FAILURE DRUGS MARKET, BY MODE OF PURCHASE
13.1 OVERVIEW
13.2 PRESCRIPTION
13.3 OVER THE COUNTER (OTC)
14 GLOBAL HEART FAILURE DRUGS MARKET, BY END USER
14.1 OVERVIEW
14.2 HOSPITALS & CLINICS
14.3 AMBULATORY SURGICAL CENTERS
14.4 OTHERS
15 GLOBAL HEART FAILURE DRUGS MARKET, BY DISTRIBUTION CHANNEL
15.1 OVERVIEW
15.2 HOSPITAL PHARMACY
15.3 RETAIL PHARMACY
15.4 ONLINE PHARMACY
15.5 OTHERS
16 GLOBAL HEART FAILURE DRUGS MARKET, BY GEOGRAPHY
GLOBAL HEART FAILURE DRUGS MARKET (ALL SEGMENTATION PROVIDED ABOVE IS REPRESENTED IN THIS CHAPTER BY COUNTRY)
16.1 NORTH AMERICA
16.1.1 U.S.
16.1.1.1. U.S HEART FAILURE DRUGS MARKET BY DRUG CLASS
16.1.1.2. U.S HEART FAILURE DRUGS MARKET BY DRUG TYPE
16.1.1.3. U.S HEART FAILURE DRUGS MARKET BY ROUTE OF ADMINISTRATION
16.1.1.4. U.S HEART FAILURE DRUGS MARKET BY MODE OF PURCHASE
16.1.1.5. U.S HEART FAILURE DRUGS MARKET BY END USER
16.1.1.6. U.S HEART FAILURE DRUGS MARKET BY DISTRIBUTION CHANNEL
16.1.2 CANADA
16.1.3 MEXICO
16.2 EUROPE
16.2.1 GERMANY
16.2.2 FRANCE
16.2.3 U.K.
16.2.4 ITALY
16.2.5 SPAIN
16.2.6 RUSSIA
16.2.7 TURKEY
16.2.8 BELGIUM
16.2.9 DENMARK
16.2.10 SWEDEN
16.2.11 POLAND
16.2.12 NORWAY
16.2.13 FINLAND
16.2.14 NETHERLANDS
16.2.15 SWITZERLAND
16.2.16 REST OF EUROPE
16.3 ASIA-PACIFIC
16.3.1 JAPAN
16.3.2 CHINA
16.3.3 SOUTH KOREA
16.3.4 INDIA
16.3.5 AUSTRALIA
16.3.6 SINGAPORE
16.3.7 THAILAND
16.3.8 MALAYSIA
16.3.9 INDONESIA
16.3.10 PHILIPPINES
16.3.11 TAIWAN
16.3.12 INDONESIA
16.3.13 VIETNAM
16.3.14 REST OF ASIA-PACIFIC
16.4 SOUTH AMERICA
16.4.1 BRAZIL
16.4.2 ARGENTINA
16.4.3 REST OF SOUTH AMERICA
16.5 MIDDLE EAST AND AFRICA
16.5.1 SOUTH AFRICA
16.5.2 SAUDI ARABIA
16.5.3 UAE
16.5.4 EGYPT
16.5.5 BAHRAIN
16.5.6 KUWAIT
16.5.7 QATAR
16.5.8 OMAN
16.5.9 ISRAEL
16.5.10 REST OF MIDDLE EAST AND AFRICA
16.6 KEY PRIMARY INSIGHTS: BY MAJOR COUNTRIES
17 GLOBAL HEART FAILURE DRUGS MARKET, COMPANY LANDSCAPE
17.1 COMPANY SHARE ANALYSIS: GLOBAL
17.2 COMPANY SHARE ANALYSIS: NORTH AMERICA
17.3 COMPANY SHARE ANALYSIS: EUROPE
17.4 COMPANY SHARE ANALYSIS: ASIA-PACIFIC
17.5 MERGERS & ACQUISITIONS
17.6 NEW PRODUCT DEVELOPMENT & APPROVALS
17.7 EXPANSIONS
17.8 REGULATORY CHANGES
17.9 PARTNERSHIP AND OTHER STRATEGIC DEVELOPMENTS
18 GLOBAL HEART FAILURE DRUGS MARKET, SWOT AND DBMR ANALYSIS
19 GLOBAL HEART FAILURE DRUGS MARKET, COMPANY PROFILE
19.1 DAIICHI SANKYO
19.1.1 COMPANY OVERVIEW
19.1.2 REVENUE ANALYSIS
19.1.3 GEOGRAPHIC PRESENCE
19.1.4 PRODUCT PORTFOLIO
19.1.5 RECENT DEVELOPMENTS
19.2 ASTRAZENECA
19.2.1 COMPANY OVERVIEW
19.2.2 REVENUE ANALYSIS
19.2.3 GEOGRAPHIC PRESENCE
19.2.4 PRODUCT PORTFOLIO
19.2.5 RECENT DEVELOPMENTS
19.3 PFIZER
19.3.1 COMPANY OVERVIEW
19.3.2 REVENUE ANALYSIS
19.3.3 GEOGRAPHIC PRESENCE
19.3.4 PRODUCT PORTFOLIO
19.3.5 RECENT DEVELOPMENTS
19.4 NOVARTIS
19.4.1 COMPANY OVERVIEW
19.4.2 REVENUE ANALYSIS
19.4.3 GEOGRAPHIC PRESENCE
19.4.4 PRODUCT PORTFOLIO
19.4.5 RECENT DEVELOPMENTS
19.5 SANOFI
19.5.1 COMPANY OVERVIEW
19.5.2 REVENUE ANALYSIS
19.5.3 GEOGRAPHIC PRESENCE
19.5.4 PRODUCT PORTFOLIO
19.5.5 RECENT DEVELOPMENTS
19.6 DR REDDY LABORATORIES
19.6.1 COMPANY OVERVIEW
19.6.2 REVENUE ANALYSIS
19.6.3 GEOGRAPHIC PRESENCE
19.6.4 PRODUCT PORTFOLIO
19.6.5 RECENT DEVELOPMENTS
19.7 SUN PHARMACEUTICALS
19.7.1 COMPANY OVERVIEW
19.7.2 REVENUE ANALYSIS
19.7.3 GEOGRAPHIC PRESENCE
19.7.4 PRODUCT PORTFOLIO
19.7.5 RECENT DEVELOPMENTS
19.8 FRESENIUS KABI
19.8.1 COMPANY OVERVIEW
19.8.2 REVENUE ANALYSIS
19.8.3 GEOGRAPHIC PRESENCE
19.8.4 PRODUCT PORTFOLIO
19.8.5 RECENT DEVELOPMENTS
19.9 GLENMARK PHARMACEUTICALS
19.9.1 COMPANY OVERVIEW
19.9.2 REVENUE ANALYSIS
19.9.3 GEOGRAPHIC PRESENCE
19.9.4 PRODUCT PORTFOLIO
19.9.5 RECENT DEVELOPMENTS
19.1 TEVA PHARMACEUTICALS
19.10.1 COMPANY OVERVIEW
19.10.2 REVENUE ANALYSIS
19.10.3 GEOGRAPHIC PRESENCE
19.10.4 PRODUCT PORTFOLIO
19.10.5 RECENT DEVELOPMENTS
19.11 JOHNSONS & JOHNSONS (JANSSEN PHARMACEUTICALS)
19.11.1 COMPANY OVERVIEW
19.11.2 REVENUE ANALYSIS
19.11.3 GEOGRAPHIC PRESENCE
19.11.4 PRODUCT PORTFOLIO
19.11.5 RECENT DEVELOPMENTS
19.12 MERCK & CO., INC
19.12.1 COMPANY OVERVIEW
19.12.2 REVENUE ANALYSIS
19.12.3 GEOGRAPHIC PRESENCE
19.12.4 PRODUCT PORTFOLIO
19.12.5 RECENT DEVELOPMENTS
19.13 APOTEX CORPORATION
19.13.1 COMPANY OVERVIEW
19.13.2 REVENUE ANALYSIS
19.13.3 GEOGRAPHIC PRESENCE
19.13.4 PRODUCT PORTFOLIO
19.13.5 RECENT DEVELOPMENTS
19.14 ABBVIE
19.14.1 COMPANY OVERVIEW
19.14.2 REVENUE ANALYSIS
19.14.3 GEOGRAPHIC PRESENCE
19.14.4 PRODUCT PORTFOLIO
19.14.5 RECENT DEVELOPMENTS
19.15 HIKMA PHARMACEUTICALS
19.15.1 COMPANY OVERVIEW
19.15.2 REVENUE ANALYSIS
19.15.3 GEOGRAPHIC PRESENCE
19.15.4 PRODUCT PORTFOLIO
19.15.5 RECENT DEVELOPMENTS
19.16 ECI PHARMACEUTICALS
19.16.1 COMPANY OVERVIEW
19.16.2 REVENUE ANALYSIS
19.16.3 GEOGRAPHIC PRESENCE
19.16.4 PRODUCT PORTFOLIO
19.16.5 RECENT DEVELOPMENTS
19.17 BAXTER HEALTHCARE
19.17.1 COMPANY OVERVIEW
19.17.2 REVENUE ANALYSIS
19.17.3 GEOGRAPHIC PRESENCE
19.17.4 PRODUCT PORTFOLIO
19.17.5 RECENT DEVELOPMENTS
19.18 BAYER AG
19.18.1 COMPANY OVERVIEW
19.18.2 REVENUE ANALYSIS
19.18.3 GEOGRAPHIC PRESENCE
19.18.4 PRODUCT PORTFOLIO
19.18.5 RECENT DEVELOPMENTS
19.19 VALIDUS PHARMACEUTICALS
19.19.1 COMPANY OVERVIEW
19.19.2 REVENUE ANALYSIS
19.19.3 GEOGRAPHIC PRESENCE
19.19.4 PRODUCT PORTFOLIO
19.19.5 RECENT DEVELOPMENTS
19.2 BRISTOL MEYERS SQUIBB
19.20.1 COMPANY OVERVIEW
19.20.2 REVENUE ANALYSIS
19.20.3 GEOGRAPHIC PRESENCE
19.20.4 PRODUCT PORTFOLIO
19.20.5 RECENT DEVELOPMENTS
19.21 MYLAN PHARMACEUTICALS
19.21.1 COMPANY OVERVIEW
19.21.2 REVENUE ANALYSIS
19.21.3 GEOGRAPHIC PRESENCE
19.21.4 PRODUCT PORTFOLIO
19.21.5 RECENT DEVELOPMENTS
19.22 ELI LILLY & COMPANY
19.22.1 COMPANY OVERVIEW
19.22.2 REVENUE ANALYSIS
19.22.3 GEOGRAPHIC PRESENCE
19.22.4 PRODUCT PORTFOLIO
19.22.5 RECENT DEVELOPMENTS
19.23 AMGEN INC
19.23.1 COMPANY OVERVIEW
19.23.2 REVENUE ANALYSIS
19.23.3 GEOGRAPHIC PRESENCE
19.23.4 PRODUCT PORTFOLIO
19.23.5 RECENT DEVELOPMENTS
19.24 BAUSCH HEALTH
19.24.1 COMPANY OVERVIEW
19.24.2 REVENUE ANALYSIS
19.24.3 GEOGRAPHIC PRESENCE
19.24.4 PRODUCT PORTFOLIO
19.24.5 RECENT DEVELOPMENTS
19.25 CIPLA, INC
19.25.1 COMPANY OVERVIEW
19.25.2 REVENUE ANALYSIS
19.25.3 GEOGRAPHIC PRESENCE
19.25.4 PRODUCT PORTFOLIO
19.25.5 RECENT DEVELOPMENTS
19.26 BOEHRINGER INGELHEIM
19.26.1 COMPANY OVERVIEW
19.26.2 REVENUE ANALYSIS
19.26.3 GEOGRAPHIC PRESENCE
19.26.4 PRODUCT PORTFOLIO
19.26.5 RECENT DEVELOPMENTS
20 CONCLUSION
21 QUESTIONNAIRE
22 ABOUT DATA BRIDGE MARKET RESEARCH
Data collection and base year analysis are done using data collection modules with large sample sizes. The stage includes obtaining market information or related data through various sources and strategies. It includes examining and planning all the data acquired from the past in advance. It likewise envelops the examination of information inconsistencies seen across different information sources. The market data is analysed and estimated using market statistical and coherent models. Also, market share analysis and key trend analysis are the major success factors in the market report. To know more, please request an analyst call or drop down your inquiry.
The key research methodology used by DBMR research team is data triangulation which involves data mining, analysis of the impact of data variables on the market and primary (industry expert) validation. Data models include Vendor Positioning Grid, Market Time Line Analysis, Market Overview and Guide, Company Positioning Grid, Patent Analysis, Pricing Analysis, Company Market Share Analysis, Standards of Measurement, Global versus Regional and Vendor Share Analysis. To know more about the research methodology, drop in an inquiry to speak to our industry experts.
Data Bridge Market Research is a leader in advanced formative research. We take pride in servicing our existing and new customers with data and analysis that match and suits their goal. The report can be customized to include price trend analysis of target brands understanding the market for additional countries (ask for the list of countries), clinical trial results data, literature review, refurbished market and product base analysis. Market analysis of target competitors can be analyzed from technology-based analysis to market portfolio strategies. We can add as many competitors that you require data about in the format and data style you are looking for. Our team of analysts can also provide you data in crude raw excel files pivot tables (Fact book) or can assist you in creating presentations from the data sets available in the report.


