
Global Hematology Analyzers And Reagents Market
Market Size in USD Billion
 USD
5.30 Billion
USD
9.10 Billion
2025
2033
USD
5.30 Billion
USD
9.10 Billion
2025
2033
| 2026 - 2033 | |
| USD 5.30 Billion | |
| USD 9.10 Billion | |
| % | |
|
Hematology Analyzers and Reagents Market Size
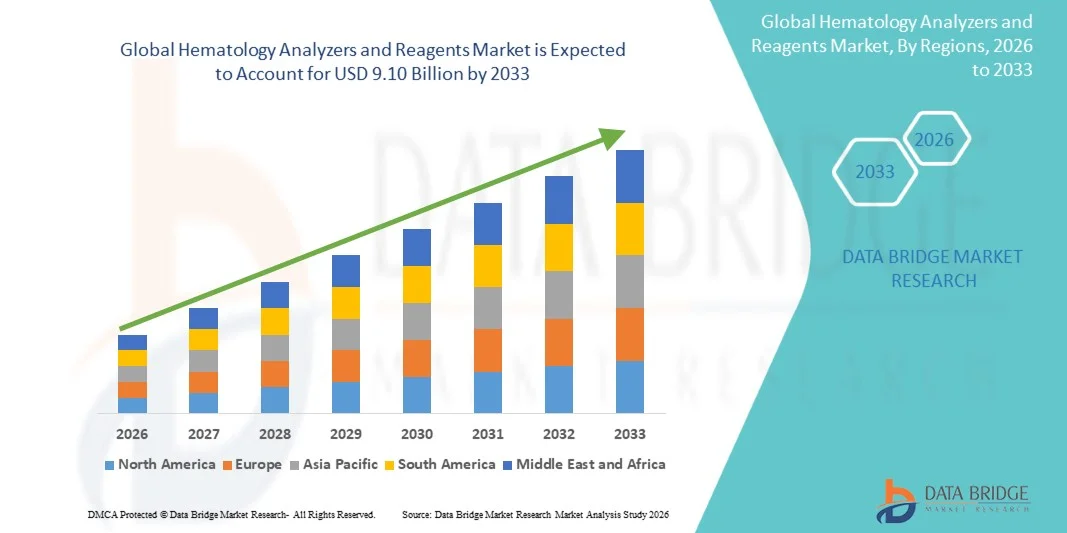
- The global hematology analyzers and reagents market size was valued at USD 5.30 billion in 2025 and is expected to reach USD 9.10 billion by 2033, at a CAGR of7.00% during the forecast period
- The market growth is largely fueled by the increasing prevalence of blood disorders, rising demand for routine blood testing, and continuous technological advancements in diagnostic laboratory equipment, leading to greater adoption of hematology analyzers across hospitals, diagnostic laboratories, and research institutions
- Furthermore, growing demand for accurate, rapid, and automated blood analysis solutions among healthcare providers is establishing hematology analyzers and reagents as essential tools in modern clinical diagnostics. These converging factors are accelerating the uptake of Hematology Analyzers and Reagents solutions, thereby significantly boosting the industry's growth
Hematology Analyzers and Reagents Market Analysis
- Hematology analyzers and reagents, offering automated and precise analysis of blood samples for diagnostic purposes, are increasingly vital components of modern clinical laboratories and healthcare facilities due to their ability to deliver rapid, accurate, and high-throughput blood testing for a wide range of hematological conditions
- The escalating demand for hematology analyzers and reagents is primarily fueled by the rising prevalence of blood disorders, increasing demand for routine diagnostic testing, and growing adoption of automated laboratory technologies to improve diagnostic efficiency and patient management
- North America dominated the hematology analyzers and reagents market with the largest revenue share of approximately 41.3% in 2025, supported by advanced healthcare infrastructure, strong presence of major diagnostic equipment manufacturers, and high adoption of automated laboratory systems, with the U.S. experiencing significant growth in hematology testing across hospitals, diagnostic laboratories, and research institutions
- Asia-Pacific is expected to be the fastest-growing region in the hematology analyzers and reagents market during the forecast period, registering a CAGR of approximately 8.1%, driven by expanding healthcare infrastructure, rising prevalence of blood-related disorders, increasing healthcare expenditure, and growing demand for advanced diagnostic solutions across emerging economies such as China and India
- The mid-range segment dominated the largest market revenue share of 44.1% in 2025, driven by its balance between affordability and advanced diagnostic capabilities
Report Scope and Hematology Analyzers and Reagents Market Segmentation
|
Attributes |
Hematology Analyzers and Reagents Key Market Insights |
|
Segments Covered |
|
|
Countries Covered |
North America
Europe
Asia-Pacific
Middle East and Africa
South America
|
|
Key Market Players |
• Abbott (U.S.) |
|
Market Opportunities |
|
|
Value Added Data Infosets |
In addition to the insights on market scenarios such as market value, growth rate, segmentation, geographical coverage, and major players, the market reports curated by the Data Bridge Market Research also include in-depth expert analysis, patient epidemiology, pipeline analysis, pricing analysis, and regulatory framework. |
Hematology Analyzers and Reagents Market Trends
“Technological Advancements and Increasing Automation in Diagnostic Laboratories”
- A significant and accelerating trend in the global Hematology Analyzers and Reagents market is the growing adoption of technologically advanced and highly automated diagnostic systems that enhance laboratory efficiency, accuracy, and testing throughput
- Modern hematology analyzers are designed to perform multiple blood tests simultaneously, enabling healthcare professionals to obtain faster and more precise diagnostic results for various blood-related disorders
- For instance, in 2024, Sysmex Corporation introduced an advanced automated hematology analyzer capable of performing high-throughput complete blood count (CBC) tests with improved accuracy and faster turnaround time, supporting laboratories handling large volumes of diagnostic samples
- The increasing integration of digital laboratory management systems and automated sample handling technologies is further improving workflow efficiency in hospitals and diagnostic laboratories worldwide
- Continuous advancements in reagent formulations are also improving the reliability and sensitivity of hematology testing, enabling more accurate detection of conditions such as anemia, leukemia, infections, and blood clotting disorders
- In addition, the development of compact and user-friendly analyzers is enabling smaller clinics and diagnostic centers to adopt advanced hematology testing technologies, expanding access to blood diagnostic services
- The rising demand for point-of-care testing and rapid diagnostic solutions is further encouraging manufacturers to develop portable and efficient hematology analyzers suitable for decentralized healthcare environments
Hematology Analyzers and Reagents Market Dynamics
Driver
“Rising Prevalence of Blood Disorders and Increasing Demand for Early Disease Diagnosis”
- The growing global prevalence of blood disorders such as anemia, leukemia, hemophilia, and other hematological conditions is a major factor driving the demand for hematology analyzers and reagents across hospitals and diagnostic laboratories
- For instance, in 2025, Abbott Laboratories expanded the availability of its automated hematology diagnostic systems across several hospital laboratories in Asia and Europe to support increasing demand for accurate blood testing and disease monitoring
- The increasing emphasis on early disease detection and routine health screening programs is significantly contributing to the growth of hematology testing worldwide
- Government initiatives and public health programs aimed at improving diagnostic capabilities in both developed and developing countries are further supporting market expansion
- The rising number of diagnostic laboratories, pathology centers, and hospital-based testing facilities is increasing the demand for reliable hematology analyzers and high-quality reagents
- In addition, the growing geriatric population, which is more susceptible to chronic and hematological diseases, is further increasing the demand for regular blood testing and diagnostic monitoring
Restraint/Challenge
“High Equipment Costs and Limited Accessibility in Developing Regions”
- The high cost of advanced hematology analyzers and associated reagents remains a significant challenge for healthcare facilities, particularly in developing countries with limited healthcare budgets
- For instance, several small diagnostic laboratories in low-income regions continue to rely on manual or semi-automated blood analysis methods due to the high acquisition and maintenance costs associated with fully automated hematology analyzers
- The need for skilled laboratory professionals to operate advanced diagnostic instruments and interpret test results can also limit adoption in regions experiencing shortages of trained healthcare personnel
- Regular maintenance requirements and the need for consistent reagent supply can create operational challenges for laboratories with limited resources
- In addition, stringent regulatory requirements and quality control standards for diagnostic equipment may increase the time and cost required for manufacturers to introduce new hematology analyzer technologies into the market
- Limited healthcare infrastructure in some rural and underserved areas can further restrict access to advanced hematology testing services, thereby slowing the overall adoption of these diagnostic solutions
Hematology Analyzers and Reagents Market Scope
The Hematology Analyzers and Reagents market is segmented on the basis of product and services, price range, application, and end user.
• By Product and Services
On the basis of product and services, the Hematology Analyzers and Reagents market is segmented into hematology products and services, hemostasis products and services, immunohematology products and services, plasma protein analyzers, haemoglobin analyzers, erythrocyte sedimentation rate analyzers, coagulation analyzers, flow cytometers, and differential counters. The hematology products and services segment dominated the largest market revenue share of 38.6% in 2025, driven by the growing demand for routine blood testing and complete blood count (CBC) diagnostics in hospitals and diagnostic laboratories. Hematology analyzers play a critical role in identifying blood disorders such as anemia, leukemia, and infections. Increasing global prevalence of hematological disorders and the rising number of diagnostic tests performed annually are supporting the dominance of this segment. In addition, advancements in automated hematology analyzers that offer faster results and improved diagnostic accuracy are boosting adoption across healthcare facilities. The integration of advanced technologies such as artificial intelligence and digital data management in hematology instruments is also enhancing laboratory efficiency. Furthermore, continuous innovation by diagnostic companies and increasing healthcare investments are further supporting the strong growth of hematology products and services worldwide.
The flow cytometers segment is expected to witness the fastest CAGR of 9.7% from 2026 to 2033, driven by the growing use of advanced diagnostic technologies for detailed cellular analysis. Flow cytometry plays a vital role in the diagnosis of blood cancers, immune system disorders, and infectious diseases by enabling rapid and precise cell analysis. Increasing demand for personalized medicine and targeted therapies is encouraging the use of flow cytometry in clinical diagnostics and research. In addition, technological advancements have improved the speed, accuracy, and multi-parameter analysis capabilities of modern flow cytometers. The rising number of research activities in immunology, oncology, and hematology is also contributing to the rapid growth of this segment. Furthermore, expanding adoption of flow cytometry in pharmaceutical research and biotechnology laboratories is further supporting its increasing demand.
• By Price Range
On the basis of price range, the Hematology Analyzers and Reagents market is segmented into high-end, mid-range, and low-end. The mid-range segment dominated the largest market revenue share of 44.1% in 2025, driven by its balance between affordability and advanced diagnostic capabilities. Mid-range hematology analyzers are widely used in medium-sized hospitals and diagnostic laboratories due to their ability to perform multiple hematological tests with reliable accuracy. These systems provide automated features, moderate throughput, and cost-effective solutions for routine blood analysis. The increasing number of diagnostic laboratories, especially in developing countries, is boosting demand for mid-range analyzers. In addition, healthcare providers prefer mid-range systems as they offer efficient performance without the high investment required for premium instruments. Continuous improvements in automation, data management, and diagnostic efficiency are further strengthening the dominance of this segment.
The high-end segment is expected to witness the fastest CAGR of 10.3% from 2026 to 2033, driven by the growing demand for advanced diagnostic technologies in large hospitals and reference laboratories. High-end hematology analyzers offer higher throughput, advanced cell differentiation capabilities, and improved diagnostic accuracy. These instruments are widely used in large healthcare facilities that handle high volumes of blood tests daily. Increasing focus on early disease detection and precision diagnostics is encouraging healthcare providers to invest in high-end hematology systems. In addition, the integration of artificial intelligence, automation, and digital connectivity in premium analyzers is improving laboratory efficiency and workflow management. The growing expansion of advanced diagnostic laboratories and rising healthcare investments worldwide are further contributing to the rapid growth of this segment.
• By Application
On the basis of application, the Hematology Analyzers and Reagents market is segmented into anemia, blood cancer, hemorrhagic conditions, infection-related conditions, immune system related conditions, and others. The anemia segment dominated the largest market revenue share of 32.8% in 2025, driven by the high global prevalence of anemia, particularly among women and children. Hematology analyzers play a crucial role in diagnosing anemia through complete blood count tests and hemoglobin measurements. Rising awareness regarding early diagnosis of blood disorders and increasing screening programs are contributing to the growth of this segment. In addition, nutritional deficiencies, chronic diseases, and genetic disorders are major factors driving the increasing incidence of anemia worldwide. Governments and healthcare organizations are actively promoting large-scale anemia screening initiatives, particularly in developing regions. The availability of advanced diagnostic technologies and improved laboratory infrastructure is also supporting the growth of anemia-related testing globally.
The blood cancer segment is expected to witness the fastest CAGR of 10.8% from 2026 to 2033, driven by the increasing incidence of hematological malignancies such as leukemia, lymphoma, and myeloma. Early diagnosis and monitoring of blood cancers require advanced hematology analyzers and diagnostic tools. Flow cytometry and advanced hematology testing technologies are increasingly being used for accurate detection and disease monitoring. In addition, growing research activities in oncology and the development of targeted cancer therapies are boosting the demand for advanced hematology diagnostics. Increasing healthcare awareness and improvements in cancer screening programs are also contributing to segment growth. Furthermore, rising healthcare investments and advancements in precision medicine are further supporting the rapid expansion of the blood cancer application segment.
• By End User
On the basis of end user, the Hematology Analyzers and Reagents market is segmented into hospital laboratories, blood banks, commercial service providers, government reference laboratories, research and academic institutes, and others. The hospital laboratories segment dominated the largest market revenue share of 42.5% in 2025, driven by the high volume of diagnostic testing performed in hospitals. Hospital laboratories serve as primary centers for diagnosing blood-related disorders and conducting routine blood examinations. The presence of skilled healthcare professionals and advanced diagnostic equipment enables hospitals to conduct accurate hematology tests. Increasing patient admissions and rising prevalence of chronic and infectious diseases are significantly boosting the demand for hematology diagnostics in hospitals. In addition, hospitals are continuously investing in advanced laboratory technologies to improve diagnostic efficiency and patient outcomes. The expansion of healthcare infrastructure and the establishment of new hospitals worldwide are further supporting the growth of this segment.
The research and academic institutes segment is expected to witness the fastest CAGR of 9.9% from 2026 to 2033, driven by the increasing focus on biomedical research and hematology studies. Academic institutions and research laboratories are actively using hematology analyzers and advanced diagnostic tools for scientific research and clinical trials. Growing investments in medical research and government funding for healthcare innovation are accelerating the demand for advanced laboratory instruments. In addition, increasing collaborations between academic institutions, biotechnology companies, and pharmaceutical organizations are expanding research activities in hematology. The rising focus on developing innovative diagnostic technologies and improving disease understanding is further supporting the rapid growth of this segment.
Hematology Analyzers and Reagents Market Regional Analysis
- North America dominated the hematology analyzers and reagents market with the largest revenue share of approximately 41.3% in 2025, supported by advanced healthcare infrastructure, strong presence of major diagnostic equipment manufacturers, and high adoption of automated laboratory systems across hospitals and diagnostic centers. The region benefits from well-established clinical laboratory networks, high healthcare spending, and strong regulatory standards that encourage the use of advanced diagnostic technologies for accurate disease detection and monitoring
- Healthcare providers and diagnostic laboratories in the region rely heavily on advanced hematology testing systems to improve diagnostic efficiency and accuracy. For instance, in 2024, Sysmex Corporation expanded the deployment of its high-throughput automated hematology analyzers across several U.S. hospital laboratories, enabling faster complete blood count (CBC) testing and improved diagnostic workflows
- The high prevalence of blood-related disorders such as anemia, leukemia, and other hematological conditions in the region further contributes to the growing demand for hematology analyzers and reagents
U.S. Hematology Analyzers and Reagents Market Insight
The U.S. hematology analyzers and reagents market captured the largest share within North America and continues to play a leading role in the global market due to the country’s strong diagnostic infrastructure and high adoption of advanced laboratory technologies. The presence of leading diagnostic equipment manufacturers, well-established hospital networks, and a large number of diagnostic laboratories contributes significantly to market growth. Increasing demand for routine blood testing, rising awareness regarding early disease diagnosis, and the growing prevalence of chronic and hematological disorders are major factors supporting the expansion of hematology testing across hospitals, research laboratories, and independent diagnostic centers throughout the country.
Europe Hematology Analyzers and Reagents Market Insight
The Europe hematology analyzers and reagents market is projected to expand at a substantial CAGR throughout the forecast period, supported by well-developed healthcare systems, strong diagnostic laboratory infrastructure, and increasing adoption of automated diagnostic technologies. Countries such as Germany, France, and the United Kingdom are major contributors to regional growth due to their advanced healthcare facilities and strong focus on early disease detection and preventive healthcare. In addition, increasing investments in laboratory modernization and the expansion of diagnostic services across hospitals and clinical laboratories are expected to drive market growth across the region.
U.K. Hematology Analyzers and Reagents Market Insight
The U.K. hematology analyzers and reagents market is anticipated to grow at a noteworthy CAGR during the forecast period, driven by rising demand for accurate diagnostic testing and increasing investments in healthcare infrastructure. The country’s strong network of hospitals, pathology laboratories, and research institutions supports the adoption of advanced hematology diagnostic technologies. Furthermore, government initiatives aimed at improving early disease detection and strengthening laboratory services are expected to contribute to the growth of the hematology analyzers and reagents market in the United Kingdom.
Germany Hematology Analyzers and Reagents Market Insight
The Germany hematology analyzers and reagents market is expected to expand at a considerable CAGR during the forecast period, fueled by the country’s well-established healthcare system and strong diagnostic research capabilities. Germany has a large number of advanced clinical laboratories and diagnostic centers that actively utilize automated hematology analyzers to perform routine blood testing and specialized hematological diagnostics. Increasing demand for early disease diagnosis and continuous technological advancements in diagnostic equipment are further supporting market growth in the country.
Asia-Pacific Hematology Analyzers and Reagents Market Insight
The Asia-Pacific hematology analyzers and reagents market is expected to be the fastest-growing region, registering a CAGR of approximately 8.1% during the forecast period, driven by expanding healthcare infrastructure, rising prevalence of blood-related disorders, and increasing healthcare expenditure across emerging economies. Countries such as China and India are witnessing rapid growth due to improvements in diagnostic laboratory networks, growing patient populations, and increasing awareness regarding early disease diagnosis. The expansion of hospital infrastructure and rising investments in advanced diagnostic technologies are further contributing to the market’s growth across the region.
Japan Hematology Analyzers and Reagents Market Insight
The Japan hematology analyzers and reagents market is gaining momentum due to the country’s advanced healthcare system and strong emphasis on diagnostic precision. Japan has a high adoption rate of automated laboratory technologies and a strong focus on preventive healthcare and routine medical testing. In addition, the country’s aging population and increasing prevalence of chronic diseases are contributing to the rising demand for routine hematology testing across hospitals and clinical laboratories.
China Hematology Analyzers and Reagents Market Insight
The China hematology analyzers and reagents market accounted for a significant revenue share within the Asia-Pacific region in 2025, driven by the rapid expansion of healthcare infrastructure and increasing demand for advanced diagnostic technologies. China has witnessed strong growth in hospital construction, diagnostic laboratory development, and healthcare investments, which are significantly improving access to diagnostic services. Furthermore, rising healthcare awareness, a growing patient population, and government initiatives aimed at strengthening disease diagnosis and treatment capabilities are expected to support continued growth of the hematology analyzers and reagents market in the country.
Hematology Analyzers and Reagents Market Share
The Hematology Analyzers and Reagents industry is primarily led by well-established companies, including:
• Abbott (U.S.)
• Sysmex Corporation (Japan)
• Danaher Corporation (U.S.)
• F. Hoffmann-La Roche Ltd. (Switzerland)
• Siemens Healthineers (Germany)
• Horiba Ltd. (Japan)
• Mindray Medical International Limited (China)
• Nihon Kohden Corporation (Japan)
• Bio-Rad Laboratories, Inc. (U.S.)
• Thermo Fisher Scientific Inc. (U.S.)
• Boule Diagnostics AB (Sweden)
• Diatron MI Zrt. (Hungary)
• Ortho Clinical Diagnostics (U.S.)
• Randox Laboratories Ltd. (U.K.)
• Agappe Diagnostics Ltd. (India)
• Drew Scientific Group (U.S.)
• Erba Mannheim (Germany)
• Sekisui Medical Co., Ltd. (Japan)
• HemoCue AB (Sweden)
• Trivitron Healthcare (India)
Latest Developments in Global Hematology Analyzers and Reagents Market
- In February 2023, Sysmex Corporation launched the XN-Series AI-enhanced hematology analyzer, integrating intelligent flagging and reflex testing capabilities to improve laboratory workflow efficiency and diagnostic accuracy. The system was rapidly adopted by hospitals and clinical laboratories to enhance automated blood analysis and reduce manual review requirements in hematology diagnostics
- In July 2023, Beckman Coulter announced the integration of its DxH 900 hematology analyzer and DxH Slidemaker Stainer II with the Scopio X100HT digital morphology platform, enabling end-to-end digital hematology workflow with AI-assisted peripheral blood smear analysis. This integration improves laboratory efficiency, supports remote slide review, and enhances diagnostic accuracy in blood disorder detection
- In August 2023, Mindray introduced the BC-7500CRP hematology analyzer, a combined hematology and C-reactive protein (CRP) testing system designed to deliver faster diagnostic results by performing multiple tests on a single platform. The analyzer helps clinical laboratories reduce turnaround time and improve operational efficiency in routine blood testing
- In March 2024, Sysmex Corporation launched the XN-4100 AI-powered hematology analyzer, featuring enhanced automation, advanced cell analysis, and improved diagnostic parameters for detecting hematological disorders. The analyzer was deployed in hundreds of hospitals worldwide to strengthen laboratory testing capabilities and support high-throughput diagnostic environments
- In March 2025, Sysmex Corporation introduced the XQ-320 automated hematology analyzer, a compact three-part differential system capable of processing up to 70 samples per hour and delivering results in less than 60 seconds. The system was designed to improve testing efficiency in mid-volume laboratories and regional diagnostic facilities
- In June 2025, Sysmex Corporation received U.S. FDA 510(k) clearance for its XR-Series automated hematology analyzer, a next-generation platform designed to deliver high-throughput blood testing with advanced digital imaging and improved diagnostic precision for clinical laboratories
SKU-

- Interactive Data Analysis Dashboard
- Company Analysis Dashboard for high growth potential opportunities
- Research Analyst Access for customization & queries
- Competitor Analysis with Interactive dashboard
- Latest News, Updates & Trend analysis
- Harness the Power of Benchmark Analysis for Comprehensive Competitor Tracking
Data collection and base year analysis are done using data collection modules with large sample sizes. The stage includes obtaining market information or related data through various sources and strategies. It includes examining and planning all the data acquired from the past in advance. It likewise envelops the examination of information inconsistencies seen across different information sources. The market data is analysed and estimated using market statistical and coherent models. Also, market share analysis and key trend analysis are the major success factors in the market report. To know more, please request an analyst call or drop down your inquiry.
The key research methodology used by DBMR research team is data triangulation which involves data mining, analysis of the impact of data variables on the market and primary (industry expert) validation. Data models include Vendor Positioning Grid, Market Time Line Analysis, Market Overview and Guide, Company Positioning Grid, Patent Analysis, Pricing Analysis, Company Market Share Analysis, Standards of Measurement, Global versus Regional and Vendor Share Analysis. To know more about the research methodology, drop in an inquiry to speak to our industry experts.
Data Bridge Market Research is a leader in advanced formative research. We take pride in servicing our existing and new customers with data and analysis that match and suits their goal. The report can be customized to include price trend analysis of target brands understanding the market for additional countries (ask for the list of countries), clinical trial results data, literature review, refurbished market and product base analysis. Market analysis of target competitors can be analyzed from technology-based analysis to market portfolio strategies. We can add as many competitors that you require data about in the format and data style you are looking for. Our team of analysts can also provide you data in crude raw excel files pivot tables (Fact book) or can assist you in creating presentations from the data sets available in the report.


