
 Market Analysis and Insights : Global High-definition (HD) Map for Autonomous Vehicles Market
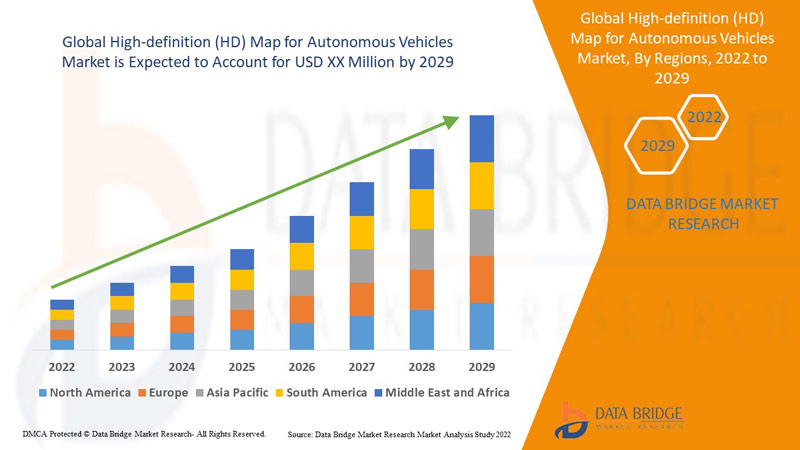
Data Bridge Market Research analyses that the HD map for autonomous vehicles market would exhibit a CAGR of 31.80% for the forecast period.
HD maps are essential for the progress of autonomous vehicles. HD maps are built and modernized in real-time by using the data captured by various cameras, sensors, and LiDAR. This data helps autonomous vehicles to make well decisions while performing driving tasks and can also provide localization information, which will help find the vehicle's exact position on the map.
The high adoption of Level 2 and Level 3 ADAS features in the automotive industry is a major factor expected to fuel the growth of the high-definition (HD) map for autonomous vehicles market in the forecast period of 2022 to 2029. Furthermore, rise in awareness concerning technological advances, high investment by startups in the development of HD maps, rise in trend of autonomous driving rise in dependence upon web, demand for correct navigation and rise in R&D of autonomous vehicle drive growth of the high-definition (HD) map for autonomous vehicles market.
However, high technological value and high processing and information streaming can hamper growth of the high-definition (HD) map for autonomous vehicles market.
Moreover, advancement in 5G technology, rise in importance of HD map for safe autonomous driving and improved road rules associated with freelance driving laws act as a opportunities for growth of the high-definition (HD) map for autonomous vehicles market in the above mentioned forecast period.
This high-definition (HD) map for autonomous vehicles market report provides details of new recent developments, trade regulations, import export analysis, production analysis, value chain optimization, market share, impact of domestic and localised market players, analyses opportunities in terms of emerging revenue pockets, changes in market regulations, strategic market growth analysis, market size, category market growths, application niches and dominance, product approvals, product launches, geographic expansions, technological innovations in the market. To gain more info on high-definition (HD) map for autonomous vehicles market contact Data Bridge Market Research for an Analyst Brief, our team will help you take an informed market decision to achieve market growth.
Global High-definition (HD) Map for Autonomous Vehicles Market Scope and Market Size
The high-definition (HD) map for autonomous vehicles market is segmented on the basis of solution, level of automation, usage, vehicle type, services. The growth amongst these segments will help you analyse meagre growth segments in the industries, and provide the users with valuable market overview and market insights to help them in making strategic decisions for identification of core market applications.
- On the basis of solution, the high-definition (HD) map for autonomous vehicles market has been segmented into cloud-based and embedded
- On the basis of level of automation, the high-definition (HD) map for autonomous vehicles market is segmented into semi-autonomous and autonomous
- On the basis of usage, the high-definition (HD) map for autonomous vehicles market is segmented into passenger mobility and commercial mobility
- On the basis of vehicle type, the high-definition (HD) map for autonomous vehicles market is segmented into passenger vehicle and commercial vehicle
- On the basis of services, the high-definition (HD) map for autonomous vehicles market is segmented into advertisement, mapping, localization, update, and maintenance
High-definition (HD) Map for Autonomous Vehicles Market Country Level Analysis
The high-definition (HD) map for autonomous vehicles market is analysed and market size insights and trends are provided by country, solution, level of automation, usage, vehicle type, services as referenced above.
The countries covered in the high-definition (HD) map for autonomous vehicles market report are U.S., Canada and Mexico in North America, Brazil, Argentina and Rest of South America as part of South America, Germany, Italy, U.K., France, Spain, Netherlands, Belgium, Switzerland, Turkey, Russia, Rest of Europe in Europe, Japan, China, India, South Korea, Australia, Singapore, Malaysia, Thailand, Indonesia, Philippines, Rest of Asia-Pacific (APAC) in Asia-Pacific (APAC), South Africa, Saudi Arabia, U.A.E, Israel, Egypt, Rest of Middle East and Africa (MEA) as a part of Middle East and Africa (MEA).
North-America dominates the high-definition (HD) map for autonomous vehicles market and will continue to flourish its trend of dominance during the forecast period owing to the increasing demand for a safe, efficient, and convenient driving experience. Asia-Pacific region is set to witness unprecedented growth during the forecast period and will project the highest compound annual growth (CAGR) rate. This is because of the rising investment in autonomous vehicle technology; and a strong presence of HD map suppliers.
The country section of the high-definition (HD) map for autonomous vehicles market report also provides individual market impacting factors and changes in regulation in the market domestically that impacts the current and future trends of the market. Data points such as consumption volumes, production sites and volumes, import export analysis, price trend analysis, cost of raw materials, down-stream and upstream value chain analysis are some of the major pointers used to forecast the market scenario for individual countries. Also, presence and availability of global brands and their challenges faced due to large or scarce competition from local and domestic brands, impact of sales channels are considered while providing forecast analysis of the country data.
Competitive Landscape and High-definition (HD) Map for Autonomous Vehicles Market Share Analysis
The high-definition (HD) map for autonomous vehicles market competitive landscape provides details by competitor. Details included are company overview, company financials, revenue generated, market potential, investment in research and development, new market initiatives, global presence, production sites and facilities, production capacities, company strengths and weaknesses, product launch, product width and breadth, application dominance. The above data points provided are only related to the companies’ focus related to high-definition (HD) map for autonomous vehicles market.
The major players covered in the high-definition (HD) map for autonomous vehicles market report are HERE, TomTom International BV., Google, NavInfo Co., Ltd., The Sanborn Map Company, Inc., CE Info Systems Pvt. Ltd., DEEPMAP, Momenta, Navmii, Mobileye, RMSI, Genesys International Corporation Ltd., Cyient, NVIDIA Corporation, ZENRIN USA, ZF Friedrichshafen AG, Blickfeld GmbH, Waymo LLC, Ushr Inc., and Argo AI, LLC among others.
SKU-

- Interactive Data Analysis Dashboard
- Company Analysis Dashboard for high growth potential opportunities
- Research Analyst Access for customization & queries
- Competitor Analysis with Interactive dashboard
- Latest News, Updates & Trend analysis
- Harness the Power of Benchmark Analysis for Comprehensive Competitor Tracking
Table of Content
1 INTRODUCTION
1.1 OBJECTIVES OF THE STUDY
1.2 MARKET DEFINITION
1.3 OVERVIEW OF GLOBAL HIGH-DEFINITION (HD) MAP FOR AUTONOMOUS VEHICLES MARKET
1.4 CURRENCY AND PRICING
1.5 LIMITATION
1.6 MARKETS COVERED
2 MARKET SEGMENTATION
2.1 KEY TAKEAWAYS
2.2 ARRIVING AT THE GLOBAL HIGH-DEFINITION (HD) MAP FOR AUTONOMOUS VEHICLES MARKET
2.2.1 VENDOR POSITIONING GRID
2.2.2 TECHNOLOGY LIFE LINE CURVE
2.2.3 MARKET GUIDE
2.2.4 MULTIVARIATE MODELLING
2.2.5 TOP TO BOTTOM ANALYSIS
2.2.6 STANDARDS OF MEASUREMENT
2.2.7 VENDOR SHARE ANALYSIS
2.2.8 DATA POINTS FROM KEY PRIMARY INTERVIEWS
2.2.9 DATA POINTS FROM KEY SECONDARY DATABASES
2.3 GLOBAL HIGH-DEFINITION (HD) MAP FOR AUTONOMOUS VEHICLES MARKET: RESEARCH SNAPSHOT
2.4 ASSUMPTIONS
3 MARKET OVERVIEW
3.1 DRIVERS
3.2 RESTRAINTS
3.3 OPPORTUNITIES
3.4 CHALLENGES
4 EXECUTIVE SUMMARY
5 PREMIUM INSIGHTS
5.1 PORTER’S FIVE FORCES ANALYSIS
5.2 REGULATORY STANDARDS
5.3 TECHNOLOGICAL TRENDS
5.4 VALUE CHAIN ANALYSIS
5.5 COMPANY COMPARITIVE ANALYSIS
5.6 PATENT ANALYSIS
5.7 COMPONENTS REQUIRED FOR MAKING HD MAPS
5.8 APPLICATIONS OF HD MAPS FOR NON AUTONOMOUS VEHICLE
6 GLOBAL HIGH-DEFINITION (HD) MAP FOR AUTONOMOUS VEHICLES MARKET, BY SERVICE TYPE
6.1 OVERVIEW
6.2 OPERATIONAL DATA
6.3 MAPPING
6.4 LOCALIZATION
6.5 ADVERTISEMENT
6.6 UPDATION AND MAINTENANCE
7 GLOBAL HIGH-DEFINITION (HD) MAP FOR AUTONOMOUS VEHICLES MARKET, BY SOLUTION
7.1 OVERVIEW
7.2 EMBEDDED
7.3 CLOUD BASED
8 GLOBAL HIGH-DEFINITION (HD) MAP FOR AUTONOMOUS VEHICLES MARKET, BY TECHNOLOGY
8.1 OVERVIEW
8.2 CAMERA BASED MAPPING
8.3 LIDAR BASED MAPPING
8.4 RADAR BASED MAPPING
8.5 COMBINATION OF SENSORS
9 GLOBAL HIGH-DEFINITION (HD) MAP FOR AUTONOMOUS VEHICLES MARKET, BY LEVEL OF AUTOMATION
9.1 OVERVIEW
9.2 SEMI AUTONOMOUS
9.2.1 LEVEL 2
9.2.2 LEVEL 3
9.3 AUTONOMOUS
9.3.1 LEVEL 4
9.3.2 LEVEL 5
10 GLOBAL HIGH-DEFINITION (HD) MAP FOR AUTONOMOUS VEHICLES MARKET, BY USAGE
10.1 OVERVIEW
10.2 PERSONAL MOBILITY
10.3 COMMERCIAL MOBILITY
11 GLOBAL HIGH-DEFINITION (HD) MAP FOR AUTONOMOUS VEHICLES MARKET, BY APPLICATION
11.1 OVERVIEW
11.2 ADAS
11.3 FLEET MANAGEMENT
11.4 NAVIGATION
11.5 TRAFFIC MANAGEMENT
11.6 AUTONOMOUS DRIVING
11.7 OTHERS
12 GLOBAL HIGH-DEFINITION (HD) MAP FOR AUTONOMOUS VEHICLES MARKET, BY VEHICLE TYPE
12.1 OVERVIEW
12.2 PASSENGER CAR
12.2.1 BY TYPE
12.2.1.1. SUVS
12.2.1.2. HATCHBACKS
12.2.1.3. SEDAN
12.2.1.4. COUPE & SPORTS CARS
12.2.1.5. OTHERS
12.3 COMMERCIAL VEHICLE
12.3.1 BY TYPE
12.3.1.1. LIGHT COMMERCIAL VEHICLE (LCV)
12.3.1.2. HEAVY COMMERCIAL VEHICLE (HCV)
13 GLOBAL HIGH-DEFINITION (HD) MAP FOR AUTONOMOUS VEHICLES MARKET, BY REGION
13.1 GLOBAL HIGH-DEFINITION (HD) MAP FOR AUTONOMOUS VEHICLES MARKET, (ALL SEGMENTATION PROVIDED ABOVE IS REPRESENTED IN THIS CHAPTER BY COUNTRY)
13.1.1 NORTH AMERICA
13.1.1.1. U.S.
13.1.1.2. CANADA
13.1.1.3. MEXICO
13.1.2 EUROPE
13.1.2.1. GERMANY
13.1.2.2. FRANCE
13.1.2.3. U.K.
13.1.2.4. ITALY
13.1.2.5. SPAIN
13.1.2.6. RUSSIA
13.1.2.7. TURKEY
13.1.2.8. BELGIUM
13.1.2.9. NETHERLANDS
13.1.2.10. SWITZERLAND
13.1.2.11. SWEDEN
13.1.2.12. DENMARK
13.1.2.13. POLAND
13.1.2.14. REST OF EUROPE
13.1.3 ASIA PACIFIC
13.1.3.1. JAPAN
13.1.3.2. CHINA
13.1.3.3. SOUTH KOREA
13.1.3.4. INDIA
13.1.3.5. AUSTRALIA AND NEW ZEALAND
13.1.3.6. SINGAPORE
13.1.3.7. THAILAND
13.1.3.8. MALAYSIA
13.1.3.9. INDONESIA
13.1.3.10. PHILIPPINES
13.1.3.11. TAIWAN
13.1.3.12. VIETNAM
13.1.3.13. REST OF ASIA PACIFIC
13.1.4 SOUTH AMERICA
13.1.4.1. BRAZIL
13.1.4.2. ARGENTINA
13.1.4.3. REST OF SOUTH AMERICA
13.1.5 MIDDLE EAST AND AFRICA
13.1.5.1. SOUTH AFRICA
13.1.5.2. EGYPT
13.1.5.3. SAUDI ARABIA
13.1.5.4. U.A.E
13.1.5.5. ISRAEL
13.1.5.6. KUWAIT
13.1.5.7. QATAR
13.1.5.8. REST OF MIDDLE EAST AND AFRICA
13.1.6 KEY PRIMARY INSIGHTS: BY MAJOR COUNTRIES
14 GLOBAL HIGH-DEFINITION (HD) MAP FOR AUTONOMOUS VEHICLES MARKET, COMPANY LANDSCAPE
14.1 COMPANY SHARE ANALYSIS: GLOBAL
14.2 COMPANY SHARE ANALYSIS: NORTH AMERICA
14.3 COMPANY SHARE ANALYSIS: EUROPE
14.4 COMPANY SHARE ANALYSIS: ASIA-PACIFIC
14.5 MERGERS & ACQUISITIONS
14.6 NEW PRODUCT DEVELOPMENT & APPROVALS
14.7 EXPANSIONS
14.8 REGULATORY CHANGES
14.9 PARTNERSHIP AND OTHER STRATEGIC DEVELOPMENTS
15 GLOBAL HIGH-DEFINITION (HD) MAP FOR AUTONOMOUS VEHICLES MARKET, SWOT ANALYSIS
16 GLOBAL HIGH-DEFINITION (HD) MAP FOR AUTONOMOUS VEHICLES MARKET, COMPANY PROFILE
16.1 ROBERT BOSCH GMBH
16.1.1 COMPANY SNAPSHOT
16.1.2 REVENUE ANALYSIS
16.1.3 PRODUCT PORTFOLIO
16.1.4 RECENT DEVELOPMENTS
16.2 TOMTOM
16.2.1 COMPANY SNAPSHOT
16.2.2 REVENUE ANALYSIS
16.2.3 PRODUCT PORTFOLIO
16.2.4 RECENT DEVELOPMENTS
16.3 HERE TECHNOLOGIES
16.3.1 COMPANY SNAPSHOT
16.3.2 REVENUE ANALYSIS
16.3.3 PRODUCT PORTFOLIO
16.3.4 RECENT DEVELOPMENTS
16.4 WAYMO
16.4.1 COMPANY SNAPSHOT
16.4.2 REVENUE ANALYSIS
16.4.3 PRODUCT PORTFOLIO
16.4.4 RECENT DEVELOPMENTS
16.5 CIVIL MAPS
16.5.1 COMPANY SNAPSHOT
16.5.2 REVENUE ANALYSIS
16.5.3 PRODUCT PORTFOLIO
16.5.4 RECENT DEVELOPMENTS
16.6 MAPBOX
16.6.1 COMPANY SNAPSHOT
16.6.2 REVENUE ANALYSIS
16.6.3 PRODUCT PORTFOLIO
16.6.4 RECENT DEVELOPMENTS
16.7 WOVEN PLANET HOLDING
16.7.1 COMPANY SNAPSHOT
16.7.2 REVENUE ANALYSIS
16.7.3 PRODUCT PORTFOLIO
16.7.4 RECENT DEVELOPMENTS
16.8 NVIDIA
16.8.1 COMPANY SNAPSHOT
16.8.2 REVENUE ANALYSIS
16.8.3 PRODUCT PORTFOLIO
16.8.4 RECENT DEVELOPMENTS
16.9 NAVINFO
16.9.1 COMPANY SNAPSHOT
16.9.2 REVENUE ANALYSIS
16.9.3 PRODUCT PORTFOLIO
16.9.4 RECENT DEVELOPMENTS
16.1 THE SANBORN MAP COMPANY INC.
16.10.1 COMPANY SNAPSHOT
16.10.2 REVENUE ANALYSIS
16.10.3 PRODUCT PORTFOLIO
16.10.4 RECENT DEVELOPMENTS
16.11 ESRI
16.11.1 COMPANY SNAPSHOT
16.11.2 REVENUE ANALYSIS
16.11.3 PRODUCT PORTFOLIO
16.11.4 RECENT DEVELOPMENTS
16.12 DYNAMIC MAP PLATFORM
16.12.1 COMPANY SNAPSHOT
16.12.2 REVENUE ANALYSIS
16.12.3 PRODUCT PORTFOLIO
16.12.4 RECENT DEVELOPMENTS
16.13 ZENRIN CO., LTD.
16.13.1 COMPANY SNAPSHOT
16.13.2 REVENUE ANALYSIS
16.13.3 PRODUCT PORTFOLIO
16.13.4 RECENT DEVELOPMENTS
16.14 BAIDU
16.14.1 COMPANY SNAPSHOT
16.14.2 REVENUE ANALYSIS
16.14.3 PRODUCT PORTFOLIO
16.14.4 RECENT DEVELOPMENTS
16.15 MOMENTA
16.15.1 COMPANY SNAPSHOT
16.15.2 REVENUE ANALYSIS
16.15.3 PRODUCT PORTFOLIO
16.15.4 RECENT DEVELOPMENTS
16.16 NAVMII
16.16.1 COMPANY SNAPSHOT
16.16.2 REVENUE ANALYSIS
16.16.3 PRODUCT PORTFOLIO
16.16.4 RECENT DEVELOPMENTS
16.17 DEEPMAP
16.17.1 COMPANY SNAPSHOT
16.17.2 REVENUE ANALYSIS
16.17.3 PRODUCT PORTFOLIO
16.17.4 RECENT DEVELOPMENTS
16.18 AUTONAVI
16.18.1 COMPANY SNAPSHOT
16.18.2 REVENUE ANALYSIS
16.18.3 PRODUCT PORTFOLIO
16.18.4 RECENT DEVELOPMENTS
16.19 MAPMYINDIA
16.19.1 COMPANY SNAPSHOT
16.19.2 REVENUE ANALYSIS
16.19.3 PRODUCT PORTFOLIO
16.19.4 RECENT DEVELOPMENTS
16.2 XPENG
16.20.1 COMPANY SNAPSHOT
16.20.2 REVENUE ANALYSIS
16.20.3 PRODUCT PORTFOLIO
16.20.4 RECENT DEVELOPMENTS
16.21 INTEL (MOBILEYE)
16.21.1 COMPANY SNAPSHOT
16.21.2 REVENUE ANALYSIS
16.21.3 PRODUCT PORTFOLIO
16.21.4 RECENT DEVELOPMENTS
16.22 BAIDU APOLLO
16.22.1 COMPANY SNAPSHOT
16.22.2 REVENUE ANALYSIS
16.22.3 PRODUCT PORTFOLIO
16.22.4 RECENT DEVELOPMENTS
16.23 ALIBABA
16.23.1 COMPANY SNAPSHOT
16.23.2 REVENUE ANALYSIS
16.23.3 PRODUCT PORTFOLIO
16.23.4 RECENT DEVELOPMENTS
16.24 AMAZON AWS
16.24.1 COMPANY SNAPSHOT
16.24.2 REVENUE ANALYSIS
16.24.3 PRODUCT PORTFOLIO
16.24.4 RECENT DEVELOPMENTS
16.25 GENERAL MOTORS
16.25.1 COMPANY SNAPSHOT
16.25.2 REVENUE ANALYSIS
16.25.3 PRODUCT PORTFOLIO
16.25.4 RECENT DEVELOPMENTS
16.26 APPLE
16.26.1 COMPANY SNAPSHOT
16.26.2 REVENUE ANALYSIS
16.26.3 PRODUCT PORTFOLIO
16.26.4 RECENT DEVELOPMENTS
16.27 PIONEER CORPORATION
16.27.1 COMPANY SNAPSHOT
16.27.2 REVENUE ANALYSIS
16.27.3 PRODUCT PORTFOLIO
16.27.4 RECENT DEVELOPMENTS
NOTE: THE COMPANIES PROFILED IS NOT EXHAUSTIVE LIST AND IS AS PER OUR PREVIOUS CLIENT REQUIREMENT. WE PROFILE MORE THAN 100 COMPANIES IN OUR STUDY AND HENCE THE LIST OF COMPANIES CAN BE MODIFIED OR REPLACED ON REQUEST
17 RELATED REPORTS
18 QUESTIONNAIRE
19 ABOUT DATA BRIDGE MARKET RESEARCH
Data collection and base year analysis are done using data collection modules with large sample sizes. The stage includes obtaining market information or related data through various sources and strategies. It includes examining and planning all the data acquired from the past in advance. It likewise envelops the examination of information inconsistencies seen across different information sources. The market data is analysed and estimated using market statistical and coherent models. Also, market share analysis and key trend analysis are the major success factors in the market report. To know more, please request an analyst call or drop down your inquiry.
The key research methodology used by DBMR research team is data triangulation which involves data mining, analysis of the impact of data variables on the market and primary (industry expert) validation. Data models include Vendor Positioning Grid, Market Time Line Analysis, Market Overview and Guide, Company Positioning Grid, Patent Analysis, Pricing Analysis, Company Market Share Analysis, Standards of Measurement, Global versus Regional and Vendor Share Analysis. To know more about the research methodology, drop in an inquiry to speak to our industry experts.
Data Bridge Market Research is a leader in advanced formative research. We take pride in servicing our existing and new customers with data and analysis that match and suits their goal. The report can be customized to include price trend analysis of target brands understanding the market for additional countries (ask for the list of countries), clinical trial results data, literature review, refurbished market and product base analysis. Market analysis of target competitors can be analyzed from technology-based analysis to market portfolio strategies. We can add as many competitors that you require data about in the format and data style you are looking for. Our team of analysts can also provide you data in crude raw excel files pivot tables (Fact book) or can assist you in creating presentations from the data sets available in the report.


