
Global Hyperloop Technology Market
Market Size in USD Billion
 USD
2.80 Billion
USD
33.94 Billion
2024
2032
USD
2.80 Billion
USD
33.94 Billion
2024
2032
| 2025 - 2032 | |
| USD 2.80 Billion | |
| USD 33.94 Billion | |
| % | |
|
What is the Global Hyperloop Technology Market Size and Growth Rate?
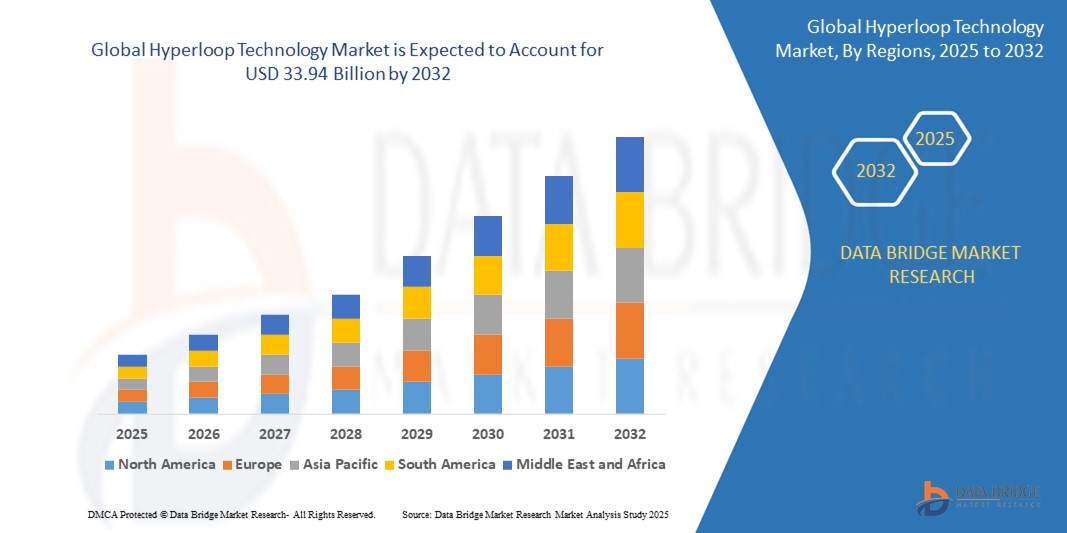
- The global hyperloop technology market size was valued at USD 2.80 billion in 2024 and is expected to reach USD 33.94 billion by 2032, at a CAGR of 36.60% during the forecast period
- The global hyperloop technology market is rapidly evolving, driven by advancements in high-speed transportation solutions that leverage low-pressure vacuum tubes. These tubes enable hyperloop pods to travel at unprecedented speeds while minimizing air resistance through magnetic levitation, which reduces friction and enhances energy efficiency
- Companies such as Virgin Hyperloop and Hyperloop Transportation Technologies are spearheading projects across various regions, including North America and Europe, indicating a growing interest in this innovative mode of transport
What are the Major Takeaways of Hyperloop Technology Market?
- Demand for speed in urban transportation is a significant market driver for Hyperloop technology, as it promises to drastically cut travel times between major cities. For instance, a Hyperloop system could reduce the journey from Los Angeles to San Francisco, typically taking about six hours by car or one hour by plane, to just approximately 35 minutes
- This immense time savings is particularly appealing to businesses looking to facilitate quick logistics and for commuters seeking efficient travel options
- North America dominated the Hyperloop Technology market with the largest revenue share of 38.69% in 2024, driven by the region's focus on transportation innovation, infrastructure modernization, and sustainability goals
- The Asia-Pacific (APAC) region is expected to grow at the fastest CAGR of 16.23% from 2025 to 2032, fueled by rapid urbanization, rising infrastructure investments, and strong government support
- The Tube segment dominated the market with the largest revenue share of 38.6% in 2024, owing to its critical role in maintaining low-pressure environments essential for high-speed travel
Report Scope and Hyperloop Technology Market Segmentation
|
Attributes |
Hyperloop Technology Key Market Insights |
|
Segments Covered |
|
|
Countries Covered |
North America
Europe
Asia-Pacific
Middle East and Africa
South America
|
|
Key Market Players |
|
|
Market Opportunities |
|
|
Value Added Data Infosets |
In addition to the insights on market scenarios such as market value, growth rate, segmentation, geographical coverage, and major players, the market reports curated by the Data Bridge Market Research also include in-depth expert analysis, pricing analysis, brand share analysis, consumer survey, demography analysis, supply chain analysis, value chain analysis, raw material/consumables overview, vendor selection criteria, PESTLE Analysis, Porter Analysis, and regulatory framework. |
What is the Key Trend in the Hyperloop Technology Market?
“Rising Integration of Renewable Energy Sources into Hyperloop Systems”
- The hyperloop technology market is witnessing significant growth, fueled by the need for faster, more sustainable transportation solutions. A major trend shaping the market is the integration of renewable energy sources, particularly solar power, into hyperloop systems to reduce environmental impact
- For instance, Virgin Hyperloop has outlined plans to power its transport pods using solar energy, aiming to operate with net-zero emissions. Similarly, Hyperloop Transportation Technologies (HyperloopTT) has incorporated solar panels along its test tracks in France to support energy efficiency
- These initiatives align with global climate goals, enhancing the technology’s appeal to both governments and investors. In 2023, Elon Musk’s Boring Company also received attention for its potential use of clean energy in future underground hyperloop systems
- With increasing funding from public and private sectors, the hyperloop market is poised to revolutionize intercity and cargo transport, offering ultra-fast travel with minimal ecological footprint
What are the Key Drivers of Hyperloop Technology Market?
- The electric power transmission and distribution (T&D) system serves as a crucial link between Global transportation challenges, particularly aging infrastructure and inefficiencies in existing transport systems, underscore the urgent need for innovative solutions such as Hyperloop technology
- According to the American Society of Civil Engineers (ASCE), the U.S. alone faces an estimated infrastructure investment gap of around USD 2.59 trillion over the next decade to maintain and upgrade its roads, bridges, and transit systems
- This growing deficit highlights the necessity for new, efficient transportation modalities that can alleviate congestion and enhance connectivity. Hyperloop systems can potentially transform travel by providing a high-speed, energy-efficient alternative, reducing travel times between major urban centers
- As cities and countries recognize the imperative to modernize their transportation networks, investment in Hyperloop technology becomes increasingly attractive, offering a viable solution to outdated infrastructures and fostering economic growth through improved transit options
- This urgent need for modernization serves as a crucial market driver for the Hyperloop technology sector
Which Factor is challenging the Growth of the Hyperloop Technology Market?
- High capital investment remains a significant challenge for the hyperloop technology market, as the development of such systems requires substantial upfront funding for research, infrastructure, and technology. Building the necessary infrastructure such as vacuum tubes, stations, and propulsion systems can demand billions of dollars
- For instance, estimates for the cost of constructing a hyperloop system between Los Angeles and San Francisco have ranged from USD 6 billion to over USD 7 billion, highlighting the financial burden involved
- This immense cost can deter potential investors and government support, particularly in an economic environment where budgets are tight and priorities may shift towards more immediate infrastructure needs
- Moreover, the uncertainty surrounding the return on investment (ROI) for hyperloop projects further complicates funding efforts, as stakeholders may be hesitant to commit resources to an unproven technology
How is the Hyperloop Technology Market Segmented?
The market is segmented on the basis of components, speed, capacity, route, and application.
• By Components
On the basis of components, the hyperloop technology market is segmented into Capsule, Tube, Propulsion System, and Others. The Tube segment dominated the market with the largest revenue share of 38.6% in 2024, owing to its critical role in maintaining low-pressure environments essential for high-speed travel. The growing demand for advanced infrastructure and the requirement for durable, low-friction tubes in long-distance routes are driving this segment. Investments in material innovation, such as carbon fiber composites, further enhance the growth outlook.
The Capsule segment is anticipated to witness the fastest growth rate from 2025 to 2032, fueled by technological advancements in lightweight design, passenger safety features, and aerodynamic efficiency. Increasing R&D investment in capsule development to enhance speed, comfort, and capacity is propelling its demand.
• By Speed
On the basis of speed, the hyperloop technology market is segmented into More Than 700 Miles and Less Than 700 Miles. The More Than 700 Miles segment accounted for the largest revenue share of 62.3% in 2024, driven by the core promise of hyperloop technology to provide ultra-high-speed transportation across long distances. High-speed capabilities enable substantial reductions in travel time between major cities, making it highly attractive for intercity transit solutions.
The Less Than 700 Miles segment is expected to record the fastest CAGR during the forecast period, supported by shorter-distance routes such as intracity or regional transit, where lower speeds offer greater cost-efficiency and simplified safety requirements.
• By Capacity
On the basis of capacity, the hyperloop technology market is segmented into Seat Capacity and Carriage Capacity. The Seat Capacity segment held the largest market share of 54.9% in 2024, owing to the primary focus on passenger transport in early-stage hyperloop projects. Passenger capsules are being designed with multiple seating configurations, addressing urban mobility demands.
The Carriage Capacity segment is expected to grow at the fastest CAGR from 2025 to 2032, fueled by increasing interest in freight transportation solutions using hyperloop systems. The ability to transport goods quickly across long distances with minimal carbon emissions makes it a compelling alternative to air and road freight.
• By Route
On the basis of route, the hyperloop technology market is segmented into Intercity and Intracity. The Intercity segment dominated the market with the largest revenue share of 67.4% in 2024, due to hyperloop’s core design being ideal for connecting major metropolitan areas with high-speed, long-distance corridors. Governments and private stakeholders are focusing infrastructure efforts primarily on intercity links.
The Intracity segment is projected to grow at the highest CAGR during the forecast period, supported by efforts to alleviate urban congestion. Compact hyperloop designs and modular pods are being explored for intracity deployment, especially in densely populated areas.
• By Application
On the basis of application, the hyperloop technology market is segmented into Passenger and Cargo/Freight. The Passenger segment led the market with a revenue share of 58.2% in 2024, driven by strong public and governmental interest in revolutionizing urban and intercity travel with faster, safer alternatives. Pilot projects and feasibility studies primarily emphasize passenger use cases.
The Cargo/Freight segment is expected to experience the fastest growth from 2025 to 2032, fueled by rising demand for next-gen logistics solutions. Hyperloop’s high speed and automation potential can significantly reduce shipping times and logistics costs for time-sensitive goods, pharmaceuticals, and perishables.
Which Region Holds the Largest Share of the Hyperloop Technology Market?
- North America dominated the hyperloop technology market with the largest revenue share of 38.69% in 2024, driven by the region's focus on transportation innovation, infrastructure modernization, and sustainability goals. The presence of major technology companies and significant government support for high-speed transit projects bolster regional dominance
- The adoption of cutting-edge mobility solutions, strong venture capital interest, and favorable regulatory frameworks further support hyperloop development in this region
- Key projects in the U.S. are prioritizing intercity transport corridors, aiming to reduce travel time drastically while enhancing environmental efficiency
U.S. Hyperloop Technology Market Insight
The U.S. market accounted for 31.25% of North America's share in 2024, largely fueled by the growing demand for eco-friendly, high-speed transport alternatives. Companies such as Virgin Hyperloop are leading pilot programs in multiple states, with feasibility studies funded by public-private partnerships. In addition, the U.S. is home to several R&D centers focusing on propulsion systems, magnetic levitation, and safety standards. The combination of government infrastructure bills and tech-sector collaboration positions the U.S. as a global leader in hyperloop innovation.
Europe Hyperloop Technology Market Insight
Europe is projected to grow at a significant CAGR throughout the forecast period, driven by the EU’s Green Deal, climate-neutral transport initiatives, and investments in cross-border connectivity. The region’s emphasis on carbon emission reduction and passenger mobility efficiency supports the adoption of hyperloop networks. Several countries, including Spain, France, and the Netherlands, are investing in hyperloop test tracks and route feasibility studies, positioning Europe as a key innovation hub.
U.K. Hyperloop Technology Market Insight
The U.K. market is expected to grow at a robust pace, spurred by the nation’s commitment to net-zero emissions by 2050 and growing interest in next-generation mobility. Partnerships between the government and private firms aim to explore hyperloop's potential for replacing short-haul flights and reducing congestion. Rising investments in smart infrastructure and increased interest from engineering universities are also key growth drivers in the U.K. market.
Germany Hyperloop Technology Market Insight
The Germany market is expanding rapidly, driven by sustainability-focused policies, engineering excellence, and growing support for high-speed rail alternatives. Germany's strong manufacturing base, combined with its emphasis on safe, efficient public transport, supports the adoption of hyperloop infrastructure. German engineering firms are also involved in developing key components such as linear motors, levitation technologies, and modular passenger capsules for global hyperloop projects.
Which Region is the Fastest Growing Region in the Hyperloop Technology Market?
The Asia-Pacific (APAC) region is expected to grow at the fastest CAGR of 16.23% from 2025 to 2032, fueled by rapid urbanization, rising infrastructure investments, and strong government support. Countries such as China, Japan, and India are leading innovation through pilot programs and public-private collaboration aimed at building high-speed corridors. The region’s emergence as a manufacturing hub for hyperloop components also contributes to increased affordability and accessibility.
Japan Hyperloop Technology Market Insight
Japan's hyperloop market is gaining momentum due to its technology-driven infrastructure policies, urban population density, and commitment to safety and efficiency. The country's strong R&D landscape, coupled with demand for aging-friendly transit options, is accelerating the development of smart, connected hyperloop systems. Japanese firms are actively working on the integration of IoT, AI, and transport automation, reinforcing the nation's role in shaping next-gen transit.
China Hyperloop Technology Market Insight
China accounted for the largest revenue share in APAC in 2024, driven by its aggressive smart city programs, expanding middle class, and state-backed innovation funding. The Chinese government is exploring hyperloop networks to connect Tier-1 and Tier-2 cities, aiming to reduce travel times and enhance economic linkages. Domestic manufacturers and research institutes are also engaged in rapid prototype development and testing, enabling China to play a central role in the global hyperloop race.
Which are the Top Companies in Hyperloop Technology Market?
The hyperloop technology industry is primarily led by well-established companies, including:
- AECOM (U.S.)
- Tesla (U.S.)
- Virgin Hyperloop (U.S.)
- Hyperloop Transportation Technologies (U.S.)
- SpaceX (U.S.)
- TransPod (Canada)
- Washington Hyperloop (U.S.)
- VicHyper (Australia)
- Dinclix GroundWorks Private Limited (India)
- Delft Hyperloop (Netherlands)
- Hardt B.V. (Netherlands)
- NEXT Prototypes e.V. (Germany)
- Zeleros (Spain)
- Waterloop (Canada)
- Badgerloop (U.S.)
What are the Recent Developments in Global Hyperloop Technology Market?
- In January 2024, Hyperloop Transportation Technologies (HyperloopTT) strengthened its partnership with Italian industrial firms Webuild and Leonardo by assuming the role of their core technology provider, with the objective of building the world’s first commercial hyperloop system in Italy, underlining the transition from concept to near-future deployment
- In February 2023, the Hyperloop Association was formed, uniting seven major hyperloop developers including Hardt, HyperloopTT, Swisspod Technologies, Hyperloop One, Nevomo, TransPod, and Zeleros to collaboratively promote high-speed, energy-efficient transport systems, highlighting the industry’s collective push toward mainstream adoption
- In February 2021, HyperloopTT signed a memorandum of understanding with the Haryana state government in India to evaluate the feasibility of a hyperloop route connecting Delhi and Chandigarh, marking a significant step toward bringing hyperloop technology to South Asia
- In December 2020, Hardt Hyperloop secured USD 7.08 million in funding to advance the development of its hyperloop systems, reinforcing investor confidence in Europe’s commitment to next-generation transportation
- In August 2020, Virgin Hyperloop partnered with the Center of Science and Industry (COSI) in Ohio to establish a Hyperloop experience center, offering educational exhibits and simulated rides to engage the public, thereby enhancing awareness and enthusiasm for the technology
SKU-

- Interactive Data Analysis Dashboard
- Company Analysis Dashboard for high growth potential opportunities
- Research Analyst Access for customization & queries
- Competitor Analysis with Interactive dashboard
- Latest News, Updates & Trend analysis
- Harness the Power of Benchmark Analysis for Comprehensive Competitor Tracking
Data collection and base year analysis are done using data collection modules with large sample sizes. The stage includes obtaining market information or related data through various sources and strategies. It includes examining and planning all the data acquired from the past in advance. It likewise envelops the examination of information inconsistencies seen across different information sources. The market data is analysed and estimated using market statistical and coherent models. Also, market share analysis and key trend analysis are the major success factors in the market report. To know more, please request an analyst call or drop down your inquiry.
The key research methodology used by DBMR research team is data triangulation which involves data mining, analysis of the impact of data variables on the market and primary (industry expert) validation. Data models include Vendor Positioning Grid, Market Time Line Analysis, Market Overview and Guide, Company Positioning Grid, Patent Analysis, Pricing Analysis, Company Market Share Analysis, Standards of Measurement, Global versus Regional and Vendor Share Analysis. To know more about the research methodology, drop in an inquiry to speak to our industry experts.
Data Bridge Market Research is a leader in advanced formative research. We take pride in servicing our existing and new customers with data and analysis that match and suits their goal. The report can be customized to include price trend analysis of target brands understanding the market for additional countries (ask for the list of countries), clinical trial results data, literature review, refurbished market and product base analysis. Market analysis of target competitors can be analyzed from technology-based analysis to market portfolio strategies. We can add as many competitors that you require data about in the format and data style you are looking for. Our team of analysts can also provide you data in crude raw excel files pivot tables (Fact book) or can assist you in creating presentations from the data sets available in the report.


