
Global Image Activated Cell Sorting Market
Market Size in USD Million
 USD
610.72 Million
USD
1,309.13 Million
2025
2033
USD
610.72 Million
USD
1,309.13 Million
2025
2033
| 2026 - 2033 | |
| USD 610.72 Million | |
| USD 1,309.13 Million | |
| % | |
|
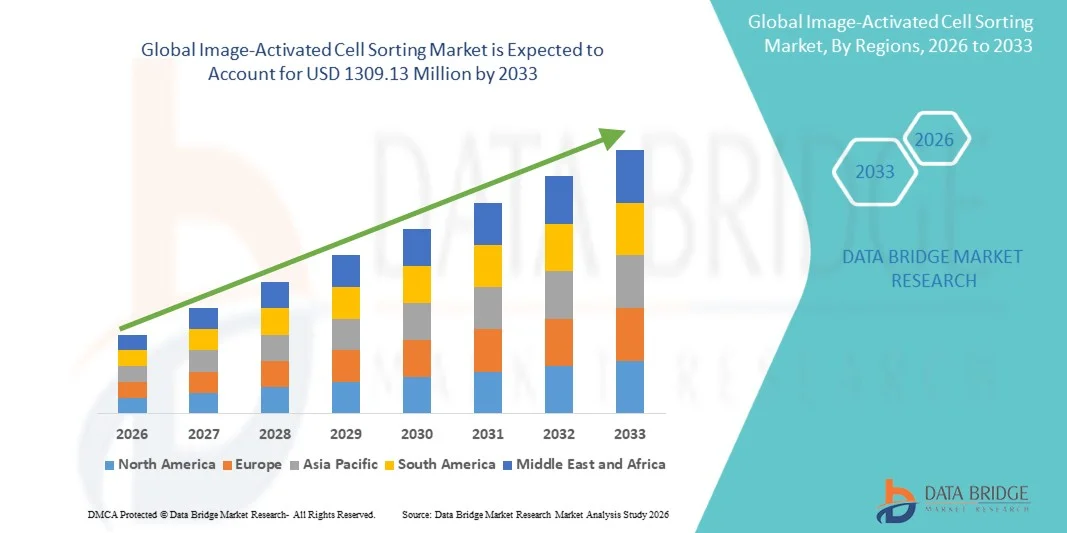
Image-Activated Cell Sorting Market Overview
The Image-Activated Cell Sorting Market was valued at USD 610.72 Million in 2025 and is projected to reach USD 1309.13 Million by 2033, growing at a CAGR of 10.00% from 2026 to 2033. The market is experiencing steady growth driven by rising demand for advanced cell analysis technologies, increasing adoption of precision medicine and personalized therapies, and expanding applications in cancer research, immunology, stem cell biology, and drug discovery. Rapid advancements in high-resolution imaging systems, artificial intelligence-enabled cell recognition, and automated sorting technologies are further accelerating the adoption of image-activated cell sorting solutions across research laboratories, biotechnology companies, and clinical research organizations.
The growing prevalence of chronic diseases and cancer worldwide, combined with increasing investments in cell-based research and regenerative medicine, is compelling academic institutions, pharmaceutical companies, and healthcare organizations to adopt advanced image-based cell sorting platforms. Image-activated cell sorting systems are increasingly replacing conventional fluorescence-based sorting methods in many applications by enabling high-content analysis, real-time visualization, and precise isolation of rare or complex cell populations. These technologies provide highly accurate, non-destructive, and reproducible cell sorting capabilities, supporting breakthroughs in single-cell analysis, biomarker discovery, immunotherapy development, and next-generation therapeutic research.
Key Market Trends & Insights
- North America dominated the Image-Activated Cell Sorting Market with the largest revenue share of 39.26% in 2025, supported by advanced biomedical research infrastructure, strong funding for cell-based research, increasing adoption of precision medicine, and the presence of leading biotechnology and life sciences companies across the region.
- The research applications segment dominated the market with a share of 61.27% in 2025 owing to increasing use of advanced cell sorting technologies in cancer research, immunology, stem cell biology, and drug discovery programs.
- Asia-Pacific is expected to be the fastest-growing region at a CAGR of 7.5% from 2026 to 2033, fueled by expanding biotechnology research activities, increasing healthcare investments, rising adoption of advanced cell analysis technologies, and growing pharmaceutical R&D spending across China, India, Japan, and South Korea.
- The Computational technique segment is projected to register the fastest CAGR of 7.2% from 2026 to 2033, reflecting growing demand for AI-driven image analysis, machine learning-based cell classification, and automated high-content screening platforms in advanced biomedical research.
- The Research Applications segment dominated the application category with a 61.44% revenue share in 2025, led by increasing use of image-activated cell sorting systems in oncology research, immunology studies, drug discovery, and single-cell analysis workflows.
- Pharmaceutical and Biotechnology Companies accounted for 37.62% of the market in 2025, supported by rising investments in cell therapy development, biomarker discovery, and advanced drug screening technologies requiring precise cell isolation and characterization capabilities.
- The Immune Synapse Formation segment is anticipated to be the fastest-growing function category, with a CAGR of 7.1% from 2026 to 2033, driven by increasing research focus on immunotherapy, T-cell interaction analysis, and next-generation immune response profiling technologies.
Market Size & Forecast
- Global Market Value (2025): USD 610.72 Million
- Expected Market Value (2033): USD 1309.13 Million
- Forecast CAGR (2026–2033): 10.00%
- Leading Region in 2025: North America
- Fastest Growing Region: Asia-Pacific
Report Scope and Image-Activated Cell Sorting Market Segmentation
|
Attributes |
Image-Activated Cell Sorting Key Market Insights |
|
Segments Covered |
|
|
Countries Covered |
North America · U.S. · Canada · Mexico Europe · Germany · France · U.K. · Netherlands · Switzerland · Belgium · Russia · Italy · Spain · Turkey · Rest of Europe Asia-Pacific · China · Japan · India · South Korea · Singapore · Malaysia · Australia · Thailand · Indonesia · Philippines · Rest of Asia-Pacific Middle East and Africa · Saudi Arabia · U.A.E. · South Africa · Egypt · Israel · Rest of Middle East and Africa South America · Brazil · Argentina · Rest of South America |
|
Key Market Players |
• BD Biosciences (U.S.) |
|
Market Opportunities |
· Expansion of AI-Powered Single-Cell Analysis Platforms · Growing Demand for Precision Medicine and Cell Therapy Development · Increasing Adoption in Emerging Biopharmaceutical and Academic Research Markets |
|
Value Added Data Infosets |
In addition to the insights on market scenarios such as market value, growth rate, segmentation, geographical coverage, and major players, the market reports curated by the Data Bridge Market Research also include in-depth expert analysis, geographically represented company-wise production and capacity, network layouts of distributors and partners, detailed and updated price trend analysis and deficit analysis of supply chain and demand. |
Image-Activated Cell Sorting Market Trends
Trend: Growing Adoption of AI-Driven Single-Cell Analysis & Precision Cell Sorting
Research institutions, biotechnology companies, and pharmaceutical manufacturers are increasingly adopting image-activated cell sorting technologies to improve the precision and efficiency of single-cell analysis, immunophenotyping, and biomarker discovery. The integration of high-resolution imaging, artificial intelligence, and machine learning algorithms enables researchers to identify and isolate rare cell populations with greater accuracy than conventional flow cytometry systems. Advanced image-based sorting platforms are increasingly being used in cancer biology, stem cell research, and immunotherapy development, where precise characterization of cellular morphology and function is critical. For instance, recent studies in oncology and immunology research have demonstrated that AI-enabled image cell sorting systems can improve rare tumor cell detection sensitivity by over 20–30% compared to traditional fluorescence-based approaches. In addition, growing adoption of automated microscopy and real-time cellular imaging technologies is enabling more efficient high-throughput screening workflows across academic and biopharmaceutical research laboratories.
Image-Activated Cell Sorting Market Dynamics
Key Market Driver: Rising Demand for Precision Medicine and Cell Therapy Research
The rapid expansion of precision medicine, regenerative medicine, and cell-based therapies is significantly driving demand for advanced image-activated cell sorting technologies. Pharmaceutical and biotechnology companies are increasingly utilizing these systems for isolating viable immune cells, stem cells, and circulating tumor cells required for CAR-T therapy development, cancer diagnostics, and next-generation biologics research. According to industry estimates, global investment in cell and gene therapy development has increased substantially over the past five years, creating strong demand for high-accuracy cell sorting platforms capable of supporting complex single-cell workflows. Image-activated cell sorting systems provide enhanced visualization, morphology-based selection, and label-free sorting capabilities, enabling researchers to analyze cellular heterogeneity with improved precision. In addition, research institutes and healthcare organizations are integrating AI-powered cell analysis platforms to accelerate biomarker discovery and drug screening processes while reducing manual analysis time and improving reproducibility.
Key Restraint/Challenge: High Cost and Technical Complexity of Advanced Cell Sorting Systems
A major challenge in the Image-Activated Cell Sorting Market is the high acquisition and operational cost associated with advanced imaging and automated sorting platforms. These systems integrate high-speed imaging modules, microfluidics, AI-powered analytics software, and sophisticated optical systems, resulting in significant capital investment and maintenance expenses. The total cost of ownership also includes software upgrades, calibration, consumables, and skilled workforce requirements, limiting adoption among smaller academic laboratories and emerging-market healthcare institutions. In addition, image-activated cell sorting workflows require highly trained personnel for system operation, data interpretation, and validation of complex cellular analysis procedures. For instance, advanced single-cell imaging platforms used in precision oncology and immunotherapy research can cost several hundred thousand dollars depending on configuration and throughput capacity, creating affordability barriers for resource-constrained research facilities.
Key Market Opportunity: Integration of Artificial Intelligence and High-Content Imaging Platforms
The integration of artificial intelligence, deep learning, and high-content imaging technologies presents a major growth opportunity for the Image-Activated Cell Sorting Market. AI-enabled platforms can automatically classify cells based on morphology, phenotype, and intracellular behavior while improving throughput and reducing human error in cell analysis workflows. The emergence of cloud-connected bioinformatics platforms and automated data analytics tools is enabling real-time interpretation of complex cellular datasets across large-scale research programs. In addition, growing adoption of microfluidic image-based sorting systems and label-free cell analysis technologies is expanding opportunities in precision diagnostics, personalized medicine, and immunotherapy development. Emerging biotechnology hubs across Asia-Pacific, Latin America, and the Middle East are also increasing investments in advanced cell analysis infrastructure, creating strong growth potential for next-generation image-activated cell sorting platforms in both clinical and research applications.
Image-Activated Cell Sorting Market Scope
The Image-Activated Cell Sorting market is segmented on the basis of services, technique, application, end user, and function.
By Services
On the basis of services, the Image-Activated Cell Sorting Market is segmented into population-level analysis (flow cytometry), cell-level analysis (microscopy), and gene-level analysis (sequencing). The population-level analysis (flow cytometry) segment dominated the market with a share of 42.38% in 2025 due to its extensive adoption in immunology, cancer biology, stem cell research, and clinical diagnostics. Flow cytometry-based systems provide rapid, high-throughput analysis and sorting of large cell populations with high precision and reproducibility. The growing use of fluorescence-activated cell sorting (FACS) in pharmaceutical research, biomarker discovery, and immune profiling is significantly supporting segment growth. In addition, increasing investments in precision medicine and cell-based therapeutics are accelerating demand for advanced flow cytometry platforms across research laboratories and hospitals globally. The widespread integration of AI-enabled imaging software, automated gating systems, and real-time analytics tools is further enhancing workflow efficiency and data accuracy. Strong adoption across biotechnology companies, academic institutes, and clinical laboratories continues to reinforce the dominance of this segment in the global market.
The gene-level analysis (sequencing) segment is expected to witness the fastest CAGR of 8.1% from 2026 to 2033, driven by increasing adoption of single-cell sequencing technologies for genomic profiling and precision medicine applications. Advances in next-generation sequencing (NGS), spatial transcriptomics, and AI-powered bioinformatics platforms are enabling highly detailed analysis of cellular heterogeneity and disease progression. Growing demand for personalized medicine, cancer genomics, and rare disease diagnostics is further accelerating segment expansion. Pharmaceutical and biotechnology companies are increasingly utilizing sequencing-integrated cell sorting platforms to improve drug discovery efficiency and biomarker identification. Moreover, rising government funding for genomics research and increasing clinical adoption of sequencing technologies are contributing significantly to the rapid growth of this segment.
By Technique
On the basis of technique, the Image-Activated Cell Sorting Market is segmented into optical, microfluidic, electrical, computational, and mechanical techniques. The optical segment dominated the market with a share of 39.74% in 2025 due to its high accuracy, non-invasive analysis capability, and widespread use in fluorescence imaging and high-content cell analysis applications. Optical systems enable precise identification and sorting of cells based on morphology, fluorescence intensity, and intracellular characteristics, making them highly suitable for biomedical research and clinical diagnostics. Increasing use of laser-based imaging systems, automated microscopy platforms, and AI-assisted image recognition technologies is further enhancing sorting efficiency and throughput. Additionally, growing adoption in oncology, stem cell therapy, and immunotherapy research is driving demand for optical cell sorting technologies across pharmaceutical and academic institutions globally.
The computational segment is projected to register the fastest CAGR of 8.4% from 2026 to 2033, driven by rapid integration of artificial intelligence, machine learning, and advanced image analytics into cell sorting workflows. Computational platforms enable real-time data interpretation, automated classification, and predictive cellular analysis, significantly improving sorting precision and operational efficiency. Increasing demand for large-scale single-cell data processing, automated diagnostics, and digital pathology applications is supporting segment expansion. In addition, the development of cloud-based analytical systems and AI-driven bioinformatics solutions is accelerating adoption across research institutions and clinical laboratories.
By Application
On the basis of application, the Image-Activated Cell Sorting Market is segmented into research applications and clinical applications. The research applications segment dominated the market with a share of 61.27% in 2025 owing to increasing use of advanced cell sorting technologies in cancer research, immunology, stem cell biology, and drug discovery programs. Academic institutes, biotechnology firms, and pharmaceutical companies are extensively utilizing image-activated cell sorting systems for high-resolution cellular analysis and biomarker identification. Rising investment in precision medicine research and growing demand for single-cell analysis technologies are significantly supporting market growth. Additionally, advancements in live-cell imaging, AI-assisted analysis platforms, and automated microscopy systems are enhancing the efficiency and reproducibility of research workflows, reinforcing the segment’s leading market position.
The clinical applications segment is anticipated to witness the fastest CAGR of 7.9% from 2026 to 2033, driven by increasing adoption of image-based cell sorting technologies in diagnostics, regenerative medicine, and personalized healthcare. Hospitals and diagnostic laboratories are integrating advanced cell analysis systems for early disease detection, immune monitoring, and therapeutic response assessment. Growing prevalence of cancer and chronic diseases, coupled with rising demand for precision diagnostics, is accelerating segment expansion. Furthermore, increasing regulatory approvals for cell-based therapies and growing use of image-guided sorting in clinical workflows are contributing significantly to market growth globally.
By End User
On the basis of end user, the Image-Activated Cell Sorting Market is segmented into research institutions, medical schools and academic institutions, pharmaceutical and biotechnology companies, and hospitals and clinical testing laboratories. The pharmaceutical and biotechnology companies segment dominated the market with a share of 36.42% in 2025 due to increasing utilization of advanced cell sorting technologies in drug discovery, biologics development, and cell therapy research. These organizations are heavily investing in AI-powered imaging platforms and automated single-cell analysis systems to improve research productivity and accelerate therapeutic development. Rising focus on immunotherapy, precision medicine, and genomic research is further driving adoption across the pharmaceutical sector. Additionally, increasing partnerships between biotech companies and research institutions are expanding the use of high-throughput cell sorting systems globally.
The hospitals and clinical testing laboratories segment is expected to witness the fastest CAGR of 7.8% from 2026 to 2033, driven by growing adoption of advanced diagnostic technologies for oncology, hematology, and infectious disease testing. Clinical laboratories are increasingly integrating image-activated cell sorting platforms to improve diagnostic accuracy, workflow automation, and patient monitoring capabilities. Rising demand for personalized treatment planning and real-time disease monitoring is accelerating adoption across hospital settings. Furthermore, expansion of digital pathology infrastructure and increasing investments in laboratory automation are supporting strong segment growth worldwide.
By Function
On the basis of function, the Image-Activated Cell Sorting Market is segmented into proliferation, metabolism, secretion, differentiation, signaling, metastasis, and immune synapse formation. The proliferation segment dominated the market with a share of 28.63% in 2025 due to the increasing importance of cell proliferation studies in cancer research, regenerative medicine, and drug development. Researchers are extensively utilizing image-activated cell sorting technologies to analyze cell cycle progression, tumor growth behavior, and therapeutic response mechanisms. The integration of live-cell imaging, fluorescence labeling, and AI-based analytics is improving the precision and speed of proliferation analysis across biomedical applications. In addition, rising investments in oncology research and stem cell therapy development are supporting the strong adoption of proliferation-focused sorting systems globally.
The immune synapse formation segment is projected to witness the fastest CAGR of 8.3% from 2026 to 2033, driven by growing research activities in immunotherapy, T-cell engineering, and autoimmune disease treatment. Advanced imaging and AI-enabled sorting systems are increasingly being used to study immune cell interactions and therapeutic responses at the single-cell level. Increasing demand for CAR-T cell therapy development and personalized immunotherapy solutions is significantly supporting segment growth. Furthermore, expanding investment in immune-oncology research and next-generation cellular therapies is expected to accelerate adoption of image-activated cell sorting technologies focused on immune synapse analysis.
Image-Activated Cell Sorting Market Regional Analysis
North America dominated the Image-Activated Cell Sorting market and accounted for the largest revenue share of 39.26% in 2025, supported by advanced biomedical research infrastructure, strong investments in cell-based research technologies, and the presence of leading biotechnology and life sciences companies across the region. The region also benefits from increasing adoption of precision medicine, rising demand for single-cell analysis, and growing use of AI-powered imaging and sorting platforms across pharmaceutical research, cancer diagnostics, and immunotherapy development. Increasing focus on genomics research, regenerative medicine, and high-throughput cellular analysis continues to strengthen North America’s leadership position in the global market.
U.S. Image-Activated Cell Sorting Market Insight
The U.S. Image-Activated Cell Sorting market is witnessing strong growth due to rising investments in biotechnology research, precision medicine initiatives, and advanced cellular analysis technologies. The country’s well-established pharmaceutical and life sciences ecosystem, along with increasing adoption of AI-enabled imaging systems, high-throughput cell sorting platforms, and single-cell sequencing technologies, is driving demand across research institutes, hospitals, and biotechnology companies. In addition, growing focus on cancer research, immunotherapy development, and stem cell applications is accelerating the adoption of image-activated cell sorting technologies throughout the United States.
Europe Image-Activated Cell Sorting Market Insight
The Europe Image-Activated Cell Sorting market remains a major contributor to global revenue, driven by strong government funding for biomedical research, technological innovation, and rising demand for advanced cell analysis solutions. The widespread adoption of high-resolution imaging systems and automated cell sorting technologies in cancer diagnostics, regenerative medicine, and pharmaceutical R&D is supporting market expansion across the region. Increasing investments in genomics research, personalized medicine, and AI-integrated laboratory platforms, coupled with strong academic and clinical research capabilities, continue to enhance the adoption of Image-Activated Cell Sorting technologies throughout Europe.
U.K. Image-Activated Cell Sorting Market Insight
The U.K. Image-Activated Cell Sorting market is experiencing steady growth, supported by increasing adoption of advanced cell imaging and sorting technologies in biomedical research, clinical diagnostics, and pharmaceutical development. Rising investments in genomics, stem cell research, and precision oncology are contributing significantly to market growth. Furthermore, integration of AI-based image analysis, automated microscopy systems, and high-throughput screening platforms is improving research efficiency and diagnostic accuracy, positioning the U.K. as a key innovation hub in the Image-Activated Cell Sorting industry.
Germany Image-Activated Cell Sorting Market Insight
The Germany Image-Activated Cell Sorting market is expanding steadily due to the country’s strong biotechnology industry, advanced research infrastructure, and increasing adoption of next-generation cell analysis technologies. Research institutes, pharmaceutical companies, and academic laboratories are increasingly utilizing image-activated cell sorting systems for immunology research, cancer biology studies, and drug discovery applications. Continuous advancements in fluorescence imaging, AI-assisted cell analysis, and automated sorting technologies, along with strong government support for life sciences innovation, are further driving market growth in Germany.
Asia-Pacific Image-Activated Cell Sorting Market Insight
The Asia-Pacific Image-Activated Cell Sorting market is expected to witness rapid growth, driven by expanding biotechnology research activities, increasing healthcare investments, and rising adoption of advanced cell analysis technologies across countries such as China, India, Japan, and South Korea. Growing demand for precision medicine, increasing pharmaceutical R&D spending, and rising awareness regarding early disease diagnosis are supporting regional market expansion. Additionally, the growing presence of biopharmaceutical manufacturing facilities, academic research centers, and government-backed genomics initiatives is accelerating adoption of image-activated cell sorting technologies across the region. Asia-Pacific is projected to register the fastest CAGR of 7.5% from 2026 to 2033.
Japan Image-Activated Cell Sorting Market Insight
The Japan Image-Activated Cell Sorting market is witnessing consistent growth due to rising investments in regenerative medicine, cancer research, and advanced biotechnology platforms. Pharmaceutical companies, academic institutions, and research organizations are increasingly adopting high-precision imaging and cell sorting technologies for stem cell analysis, immunotherapy development, and genomic research applications. Moreover, increasing integration of AI-driven image analytics and the country’s strong focus on precision healthcare and biomedical innovation are further contributing to market growth.
China Image-Activated Cell Sorting Market Insight
The China Image-Activated Cell Sorting market is growing rapidly, driven by expanding biotechnology infrastructure, rising pharmaceutical R&D investments, and increasing government support for precision medicine and genomics research. Growing adoption of AI-enabled imaging systems, automated cell sorting technologies, and high-throughput screening platforms across biotechnology companies, hospitals, and research institutions is significantly boosting market demand. In addition, increasing focus on cancer diagnostics, cell therapy development, and advanced biomedical research is positioning China as one of the fastest-growing markets for Image-Activated Cell Sorting globally.
Image-Activated Cell Sorting Market Share
The Image-Activated Cell Sorting industry is primarily led by well-established companies, including:
- BD Biosciences (U.S.)
- Sony Biotechnology Inc. (U.S.)
- Miltenyi Biotec GmbH (Germany)
- Bio-Rad Laboratories, Inc. (U.S.)
- Thermo Fisher Scientific Inc. (U.S.)
- Danaher Corporation (Beckman Coulter, Inc.) (U.S.)
- CytoNiche Biotech (China)
- On-Chip Biotechnologies Co., Ltd. (Japan)
- Union Biometrica, Inc. (U.S.)
- NanoCellect Biomedical, Inc. (U.S.)
- Fluigent S.A. (France)
- Cell Microsystems, Inc. (U.S.)
- 10x Genomics, Inc. (U.S.)
- Cytena GmbH (Germany)
- Standard BioTools Inc. (formerly Fluidigm Corporation) (U.S.)
- Deepcell, Inc. (U.S.)
- RareCyte, Inc. (U.S.)
- Leica Microsystems GmbH (Germany)
- Yokogawa Electric Corporation (Japan)
- ZEISS Group (Germany)
- Olympus Corporation (Japan)
- Agilent Technologies, Inc. (U.S.)
- Merck KGaA (Germany)
- Hamilton Company (U.S.)
- Apogee Flow Systems Ltd. (U.K.)
- CytoSMART Technologies B.V. (Netherlands)
- Takara Bio Inc. (Japan)
- Sysmex Corporation (Japan)
- Bio-Techne Corporation (U.S.)
- Dolomite Microfluidics (U.K.)
- Namocell, Inc. (U.S.)
- Akadeum Life Sciences, Inc. (U.S.)
- Sphere Fluidics Limited (U.K.)
- Inscopix, Inc. (U.S.)
Latest Developments in Image-Activated Cell Sorting Market
- In February 2025, BD (Becton, Dickinson and Company) announced advancements in its spectral cell sorting and imaging portfolio, expanding capabilities for high-parameter cell analysis and image-based cell characterization. The development strengthens BD’s position in precision cell analysis and supports growing demand for advanced immune profiling, oncology research, and single-cell applications in biotechnology and clinical laboratories
- In October 2024, Sony Biotechnology Inc. introduced enhancements to its FP7000 spectral cell sorter platform, incorporating advanced image-assisted sorting and real-time analysis capabilities for improved rare cell detection and sorting accuracy. The innovation supports next-generation cell therapy research and high-throughput biomedical applications
- In June 2024, Standard BioTools Inc. (formerly Fluidigm) announced expanded commercialization efforts for its imaging and single-cell analysis technologies aimed at improving high-content cell sorting workflows. The initiative focused on integrating imaging-based analytics with multi-omics platforms for advanced translational research and immunology studies
- In March 2024, Union Biometrica, Inc. launched upgraded high-throughput large-particle flow cytometry and image-based sorting capabilities for biomedical and genetic research applications. The new developments improve automated organism and cell sorting efficiency for drug discovery and developmental biology studies
- In November 2023, Cytena GmbH announced advancements in its single-cell dispensing and imaging technologies designed to support AI-driven image-activated cell selection workflows. The upgraded systems enable researchers to improve cell line development accuracy and monoclonal cell isolation efficiency
- In September 2023, Deepcell Inc. introduced its REM-I platform for label-free image-based cell sorting using artificial intelligence and real-time morphological analysis. The technology enables rapid identification and isolation of live cells without fluorescent labeling, supporting applications in cancer diagnostics and cell therapy manufacturing
- In June 2023, On-Chip Biotechnologies Co., Ltd. announced the expansion of its imaging flow cytometry and microfluidic cell sorting technologies for rare cell analysis and regenerative medicine research. The development focused on improving cell viability and sorting precision for stem cell and clinical applications
- In January 2023, Miltenyi Biotec launched enhancements to its MACSQuant Tyto Cell Sorter platform, incorporating improved sterile image-guided cell sorting functionalities for cell therapy and immunotherapy workflows. The launch strengthened automated and closed-system sorting solutions for clinical-grade applications
- In May 2022, NanoCellect Biomedical announced new capabilities for its WOLF Cell Sorter platform, integrating advanced imaging analytics and microfluidic technologies to improve gentle cell sorting and viability preservation. The development supported increasing adoption in single-cell genomics and CRISPR research workflows
- In October 2021, Cytek Biosciences expanded its Aurora and Northern Lights flow cytometry platforms with enhanced imaging and spectral analysis capabilities for high-dimensional cell sorting applications. The innovation improved sensitivity and multiplexing capacity for immunology, oncology, and translational medicine research
SKU-

- Interactive Data Analysis Dashboard
- Company Analysis Dashboard for high growth potential opportunities
- Research Analyst Access for customization & queries
- Competitor Analysis with Interactive dashboard
- Latest News, Updates & Trend analysis
- Harness the Power of Benchmark Analysis for Comprehensive Competitor Tracking
Data collection and base year analysis are done using data collection modules with large sample sizes. The stage includes obtaining market information or related data through various sources and strategies. It includes examining and planning all the data acquired from the past in advance. It likewise envelops the examination of information inconsistencies seen across different information sources. The market data is analysed and estimated using market statistical and coherent models. Also, market share analysis and key trend analysis are the major success factors in the market report. To know more, please request an analyst call or drop down your inquiry.
The key research methodology used by DBMR research team is data triangulation which involves data mining, analysis of the impact of data variables on the market and primary (industry expert) validation. Data models include Vendor Positioning Grid, Market Time Line Analysis, Market Overview and Guide, Company Positioning Grid, Patent Analysis, Pricing Analysis, Company Market Share Analysis, Standards of Measurement, Global versus Regional and Vendor Share Analysis. To know more about the research methodology, drop in an inquiry to speak to our industry experts.
Data Bridge Market Research is a leader in advanced formative research. We take pride in servicing our existing and new customers with data and analysis that match and suits their goal. The report can be customized to include price trend analysis of target brands understanding the market for additional countries (ask for the list of countries), clinical trial results data, literature review, refurbished market and product base analysis. Market analysis of target competitors can be analyzed from technology-based analysis to market portfolio strategies. We can add as many competitors that you require data about in the format and data style you are looking for. Our team of analysts can also provide you data in crude raw excel files pivot tables (Fact book) or can assist you in creating presentations from the data sets available in the report.


