
Implantable Ports Market Analysis and Insights
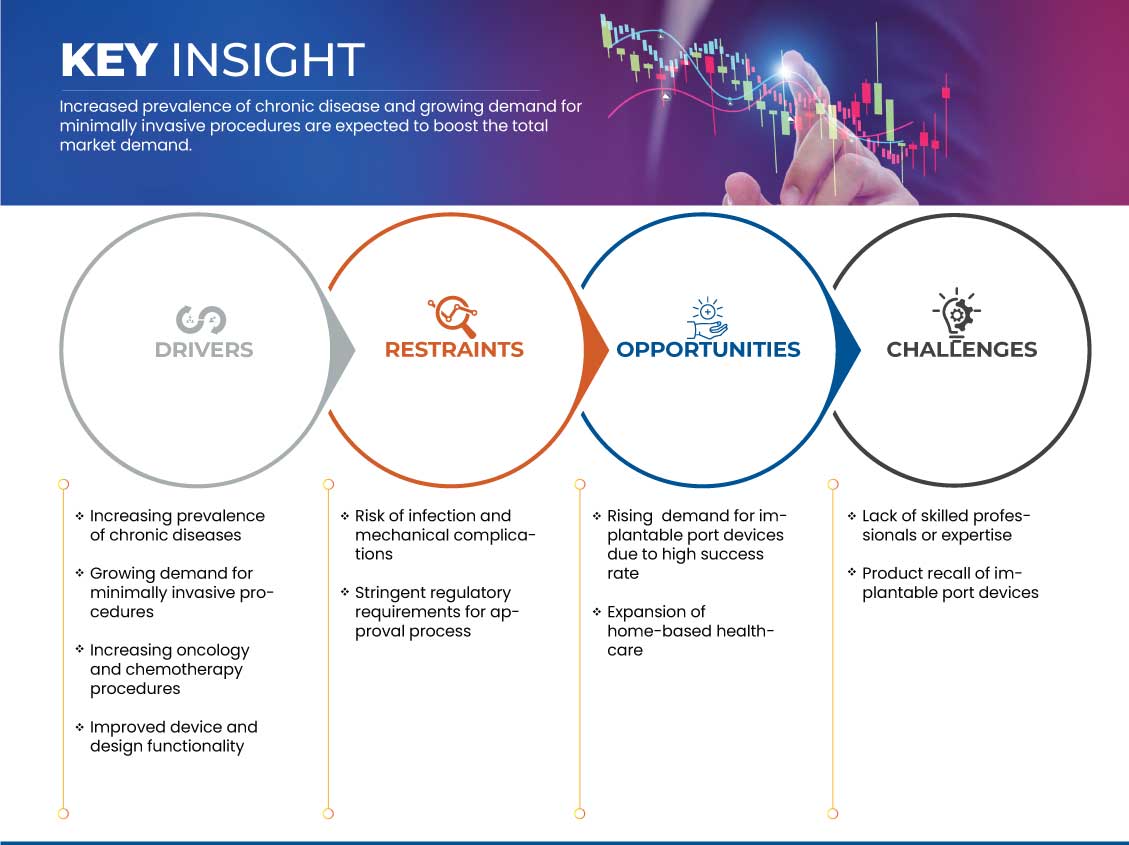
The increasing prevalence of chronic diseases and the growing demand for minimally invasive procedures are expected to drive market growth. The rising healthcare expenditure for better healthcare services is also attributed to market growth. The major market players are highly focused on product launches during the period. In addition, the government and regulatory bodies are supporting market players with product approval due to emergence. The market is growing in the forecast year due to the high demand for precision medicine and targeted therapy. However, stringent requirements for approval are expected to restrain market growth.
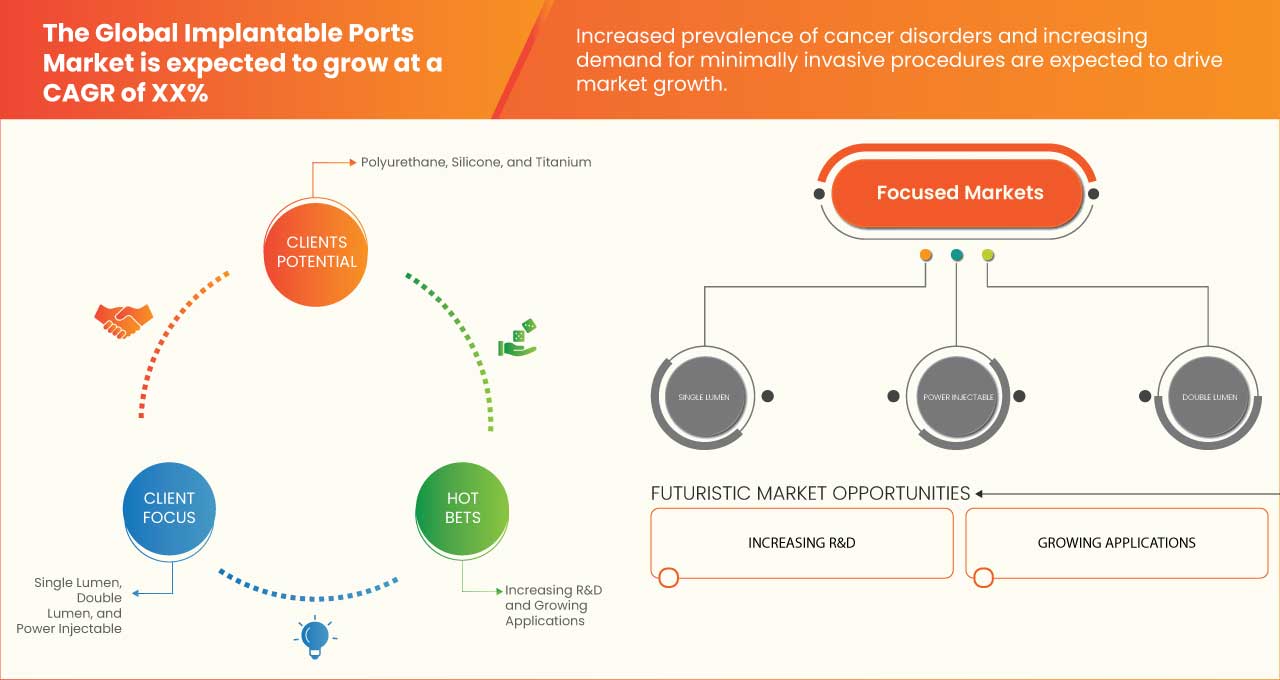
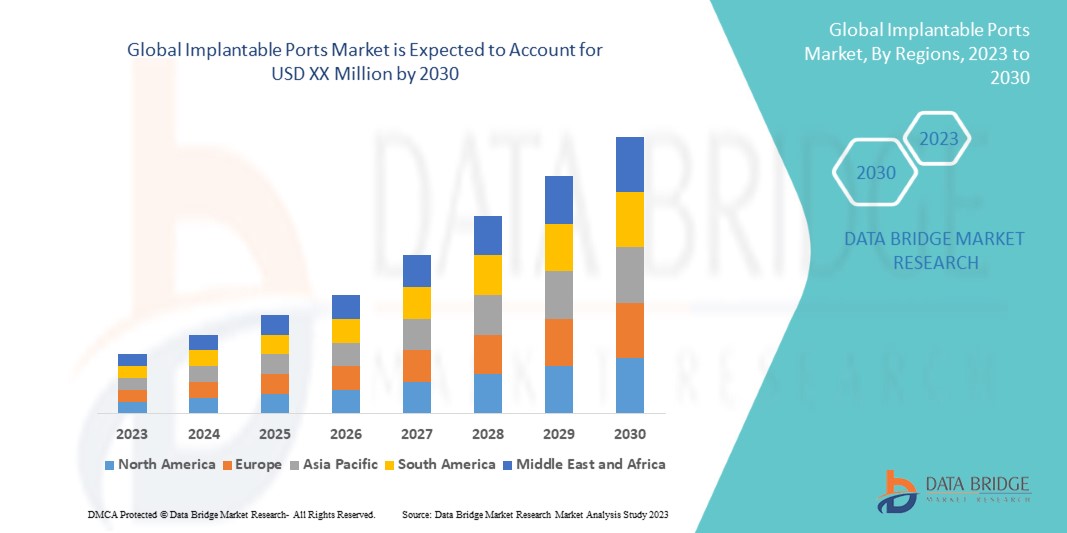
Data Bridge Market Research analyzes that the global implantable ports Market is expected to grow at a CAGR of 7.8% during the forecast period of 2023 to 2030.
|
Report Metric |
Details |
|
Forecast Period |
2023 to 2030 |
|
Base Year |
2022 |
|
Historic Year |
2021 (Customizable to 2015-2020) |
|
Quantitative Units |
Revenue in Thousand, Pricing in USD |
|
Segments Covered |
By Type (Single Lumen, Double Lumen, and Power-Injectable), Material (Polyurethane, Silicone, Titanium, and Others), Application (Chemotherapy, Blood Transfusion, Antibiotics, Intravenous Infusion of Blood Product, Pain Management, and Others), End Users (Hospitals, Clinics, Ambulatory Surgical Centre, Dialysis Centers, and Others) |
|
Countries Covered |
U.S., Canada, Mexico, Germany, U.K., France, Italy, Russia, Spain, Netherlands, Switzerland, Belgium, Turkey, Rest of Europe, China, Japan, India, Australia & New Zealand, South Korea, Indonesia, Philippines, Thailand, Malaysia, Singapore, Rest of Asia Pacific, South Africa, Egypt, Saudi Arabia, U.A.E., Israel, Rest of Middle East and Africa, Brazil, Argentina, and Rest of South America |
|
Market Players Covered |
B. Braun SE, AngioDynamics, BD, Teleflex Incorporated, Vygon, ICU Medical, Inc., Districlass Médical, AMI GmbH, and PakuMedmedical products gmbh among others |
Market Definition
The global implantable ports market is the worldwide market for medical devices known as implantable ports or portacath. These devices are used in healthcare settings to facilitate repeated access to a patient's bloodstream for the delivery of medications, fluids, or blood products, and for blood sampling. Implantable ports consist of two main components: a reservoir or chamber that is surgically implanted beneath the skin, usually in the chest or upper arm, and a catheter that connects the reservoir to a large vein, typically the subclavian vein or jugular vein. The catheter remains inside the patient's body, providing a stable access point for medical professionals to administer treatments or perform diagnostic procedures.
Global Implantable Ports Market Dynamics
This section deals with understanding the market drivers, advantages, opportunities, restraints, and challenges. All of this is discussed in detail below:
DRIVERS
- Increasing Prevalence of Chronic Diseases
Numerous chronic diseases require long-term medication administration, often through Intravenous (IV) therapies. Implantable ports provide a convenient and reliable way to administer medications directly into the bloodstream. These ports can be accessed repeatedly, eliminating the need for frequent needle sticks and reducing patient discomfort. The growing prevalence of chronic diseases such as cancer, cardiovascular diseases, and end-stage renal diseases necessitates the use of implantable ports, thereby driving market growth.
Chronic diseases often require regular medical interventions, including repeated blood sampling, intravenous drug administration, and chemotherapy. Implantable ports offer a more convenient and efficient alternative to traditional central venous access devices. They eliminate the need for external catheters and dressing changes, allowing patients to perform their daily activities without hindrance. The use of implantable ports improves patient quality of life and satisfaction, making them a preferred choice for long-term therapy management.
- Growing Demand for Minimally Invasive Procedures
Minimally invasive procedures are associated with reduced trauma, smaller incisions, and less tissue disruption compared to traditional surgical approaches. Implantable ports, being minimally invasive devices, offer patients a more comfortable experience during the surgical implantation procedure. The smaller incisions result in less post-operative pain, shorter recovery times, and improved overall patient comfort.
Minimally invasive procedures typically require shorter hospital stays compared to traditional open surgeries. Implantable ports can be implanted on an outpatient basis or with minimal hospitalization. Patients can often go home on the same day or within a short period after the procedure, resulting in cost savings and improved resource utilization for healthcare facilities. The demand for minimally invasive options such as implantable ports aligns with the trend of reducing hospital stays and promoting ambulatory care.
OPPORTUNITY
- Rising Demand for Implantable Port Devices Due to High Success Rate
Implantable port devices have a high success rate in terms of their ability to provide reliable and long-term access to various medical treatments. The design and placement of the device ensure proper catheter function and secure attachment to the port reservoir. This makes it possible to administer drugs, administer fluids, or draw blood in a consistent and effective manner. Since patients may receive their medicines without interruptions or difficulties, the high success rate of implanted ports translates into improved treatment outcomes. The consistent access offered by implantable ports also lessens the requirement for repeated venipuncture, minimizing patient discomfort and potential consequences related to challenging venous access.
The high success rate associated with implantable port devices has increased their demand in various medical settings. Healthcare providers and patients alike recognize the advantages of these devices in terms of improved patient safety, treatment efficacy, and patient experience. The rising demand for implantable ports is driven by the desire to optimize patient outcomes and minimize the risks and complications associated with other access devices. As a result, implantable port devices have become a preferred choice for long-term intravenous therapies, contributing to their growing adoption and market demand.
RESTRAINT/CHALLENGE
- Stringent Regulatory Requirements for Approval Process
Implantable ports, such as any medical device, are subject to regulatory approval before they can be marketed and used in healthcare settings. The regulatory approval process involves extensive testing, documentation, and evaluation of the safety and efficacy of the device. This process can be lengthy and time-consuming, requiring significant financial resources and expertise. The time and cost involved in obtaining regulatory clearance or approval can delay the market entry of new implantable ports and pose barriers to smaller manufacturers or innovators who may struggle to meet these requirements.
Regulatory agencies enforce stringent safety and performance standards for implantable ports to ensure patient safety and device effectiveness. Manufacturers must demonstrate compliance with these standards through rigorous testing and clinical data. While these standards are essential for patient protection, they can increase the complexity and cost of the product development process. Meeting these requirements may involve conducting extensive preclinical and clinical studies, which can add significant time and expenses to the overall development and regulatory approval process.
Recent Developments
- In November 2022, Teleflex Incorporated announced that it had participated in the 33rd Annual Virtual Piper Sandler Healthcare Conference. This will help the organization in developing brand image among others
- In November 2021, Teleflex Incorporated announced that it was named a MedReps.com 2023 Best Place to Work, earning the Number 1 spot for large companies and making this the sixth consecutive year the company has been on the list. This will help the organization in developing brand image among others
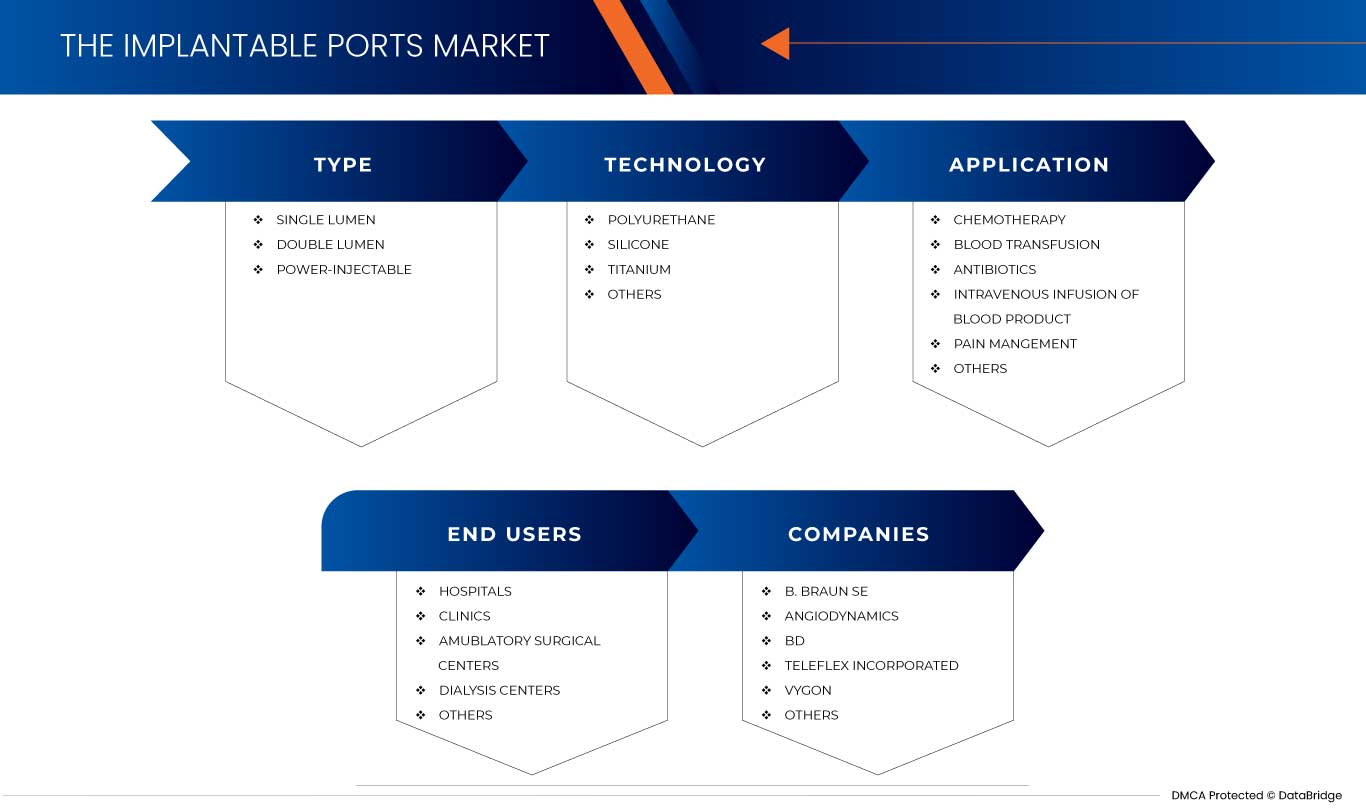
Global Implantable Ports Market Segmentation
The global implantable ports market is segmented into four notable segments based on type, material, application, and end users. The growth among segments helps you analyze niche pockets of growth and strategies to approach the market and determine your core application areas and the difference in your target markets.
Type
- Single Lumen
- Double Lumen
- Power-Injectable
On the basis of type, the market is segmented into single lumen, double lumen, and power-injectable.
Material
- Polyurethane
- Silicone
- Titanium
- Others
On the basis of material, the market is segmented into polyurethane, silicone, titanium, and others.
Application
- Chemotherapy
- Blood Transfusion
- Antibiotics
- Intravenous Infusion of Blood Product
- Pain Management
- Others
On the basis of application, the market is segmented into chemotherapy, blood transfusion, antibiotics, intravenous infusion of blood product, pain management, and others.
End Users
- Hospitals
- Clinics
- Ambulatory Sugery Centre
- Dialysis Centers
- Others
On the basis of end users, the market is segmented into hospitals, clinics, ambulatory surgical center, dialysis centers, and others.
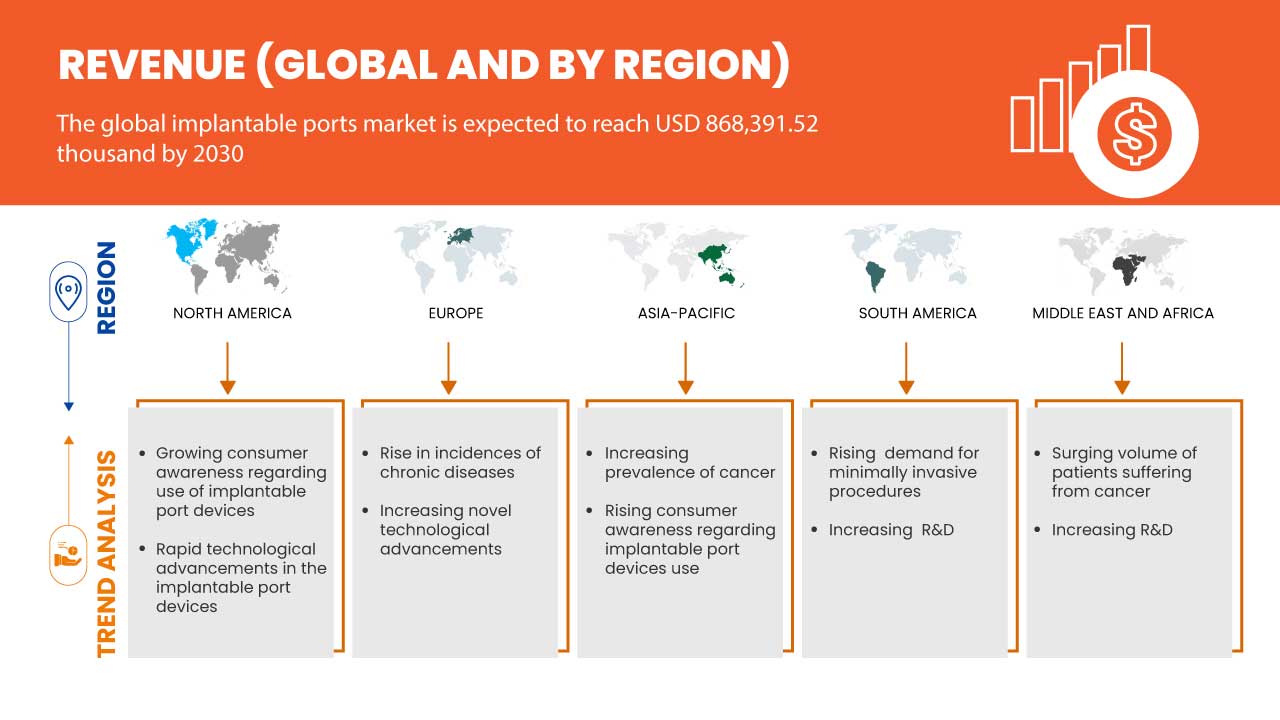
Global Implantable Ports Market Regional Analysis/Insights
The global implantable ports market is analyzed, and market size insights and trends are provided based on type, material, application, and end users.
The countries covered in this market report are the U.S., Canada, Mexico, Germany, France, U.K, Italy, Spain, Netherlands, Russia, Switzerland, Belgium, Turkey, rest of Europe, China, Japan, India, South Korea, Australia, Singapore, Thailand, Malaysia, Indonesia, Philippines, rest of Asia-Pacific, Brazil, Argentina, rest of South America, South Africa, Saudi Arabia, U.A.E., Egypt, Israel, and rest of Middle East and Africa.
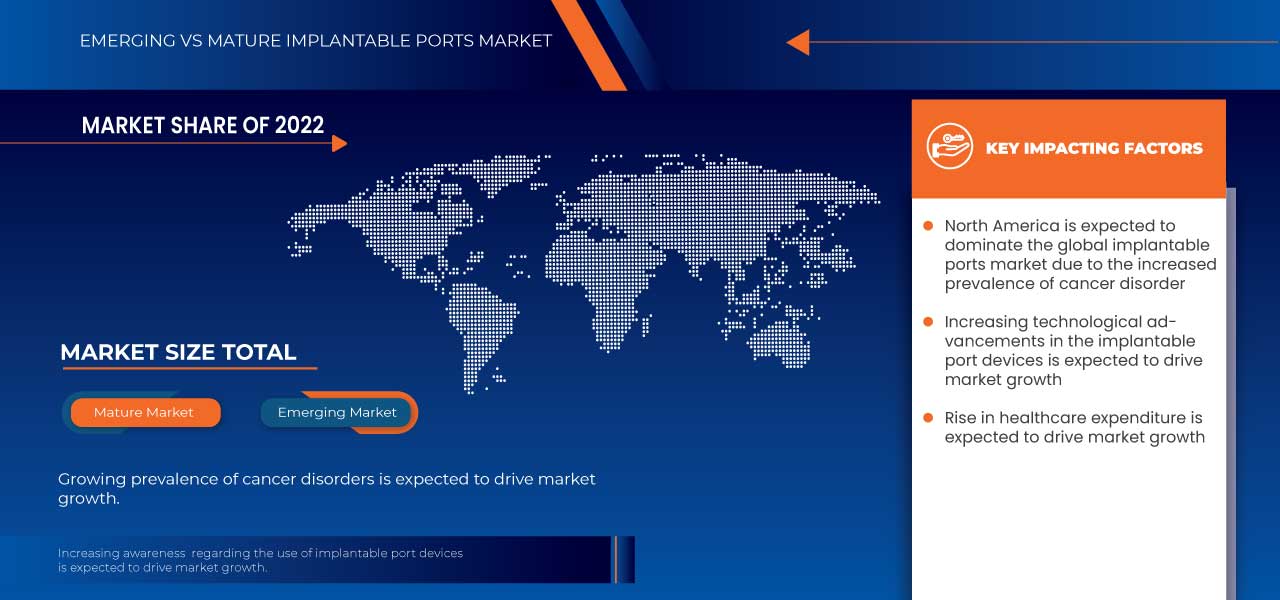
North America is expected to dominate the global implantable ports market because of the rising awareness and government funding for implantable ports. The U.S. is expected to dominate the North America region due to the increasing strategic initiatives by major market players. Germany is expected to dominate the Europe region due to rising healthcare expenditure and the increased global presence of key market players. China is expected to dominate the Asia-Pacific region due to the growing expenses on the overall development of healthcare infrastructure.
The country section of the report also provides individual market-impacting factors and changes in market regulation that impact the current and future trends of the market. Data points such as downstream and upstream value chain analysis, technical trends, Porter's five forces analysis, and case studies are some of the pointers used to forecast the market scenario for individual countries. Also, the presence and availability of global brands and their challenges faced due to large or scarce competition from local and domestic brands and the impact of domestic tariffs and trade routes are considered while providing forecast analysis of the country data.
Competitive Landscape and Global Implantable Ports Market Share Analysis
The global implantable ports market competitive landscape provides details of competitors. Details included are company overview, company financials, revenue generated, market potential, investment in R&D, new market initiatives, global presence, production sites and facilities, production capacities, company strengths and weaknesses, product launch, product width and breadth, and application dominance. The above data points provided are only related to the company’s focus on the market.
Some of the major market players operating in the global implantable ports market are B. Braun SE, AngioDynamics, BD, Teleflex Incorporated, Vygon, ICU Medical, Inc., Districlass Médical, AMI GmbH, and PakuMedmedical products gmbh among others.
SKU-

- Interactive Data Analysis Dashboard
- Company Analysis Dashboard for high growth potential opportunities
- Research Analyst Access for customization & queries
- Competitor Analysis with Interactive dashboard
- Latest News, Updates & Trend analysis
- Harness the Power of Benchmark Analysis for Comprehensive Competitor Tracking
Table of Content
1 INTRODUCTION
1.1 OBJECTIVES OF THE STUDY
1.2 MARKET DEFINITION
1.3 OVERVIEW OF THE GLOBAL IMPLANTABLE PORTS MARKET
1.4 CURRENCY AND PRICING
1.5 LIMITATIONS
1.6 MARKETS COVERED
2 MARKET SEGMENTATION
2.1 MARKETS COVERED
2.2 GEOGRAPHICAL SCOPE
2.3 YEARS CONSIDERED FOR THE STUDY
2.4 DBMR TRIPOD DATA VALIDATION MODEL
2.5 PRIMARY INTERVIEWS WITH KEY OPINION LEADERS
2.6 MULTIVARIATE MODELLING
2.7 TYPE SEGMENT LIFELINE CURVE
2.8 MARKET END USERS COVERAGE GRID
2.9 DBMR MARKET POSITION GRID
2.1 VENDOR SHARE ANALYSIS
2.11 SECONDARY SOURCES
2.12 ASSUMPTIONS
3 EXECUTIVE SUMMARY
4 PREMIUM INSIGHTS
4.1 CONSUMER BUYING BEHAVIOUR
4.2 FACTORS AFFECTING BUYING DECISION
4.3 PRODUCT ADOPTION SCENARIO
4.4 REGULATION COVERAGE
4.5 BRAND ANALYSIS
4.6 RAW MATERIAL SOURCING ANALYSIS
4.7 IMPORT EXPORT SCENARIO
4.8 PORTER'S 5 FORCES
5 SUPPLY CHAIN ANALYSIS
5.1 LOGISTIC COSTS SCENARIO
5.2 IMPORTANCE OF LOGISTICS SERVICE PROVIDERS
6 MARKET OVERVIEW
6.1 DRIVERS
6.1.1 INCREASING PREVALENCE OF CHRONIC DISEASES
6.1.2 GROWING DEMAND FOR MINIMALLY INVASIVE PROCEDURES
6.1.3 INCREASING ONCOLOGY AND CHEMOTHERAPY PROCEDURES
6.1.4 IMPROVED DEVICE DESIGN AND FUNCTIONALITY
6.2 RESTRAINTS
6.2.1 RISK OF INFECTIONS AND MECHANICAL COMPLICATIONS
6.2.2 STRINGENT REGULATORY REQUIREMENTS FOR APPROVAL PROCESS
6.3 OPPORTUNITIES
6.3.1 RISING DEMAND FOR IMPLANTABLE PORT DEVICES DUE TO HIGH SUCCESS RATE
6.3.2 EXPANSION OF HOME-BASED HEALTHCARE
6.4 CHALLENGES
6.4.1 LACK OF SKILLED PROFESSIONALS OR EXPERTISE
6.4.2 PRODUCT RECALL OF IMPLANTABLE PORT DEVICES
7 GLOBAL IMPLANTABLE PORTS MARKET, BY TYPE
7.1 OVERVIEW
7.2 SINGLE LUMEN
7.3 DOUBLE LUMEN
7.4 POWER- INJECTABLE
8 GLOBAL IMPLANTABLE PORTS MARKET, BY MATERIAL
8.1 OVERVIEW
8.2 POLYURETHANE
8.3 SILICONE
8.4 TITANIUM
8.5 OTHERS
9 GLOBAL IMPLANTABLE PORTS MARKET, BY APPLICATION
9.1 OVERVIEW
9.2 CHEMOTHERAPY
9.3 BLOOD TRANSFUSION
9.4 ANTIBIOTICS
9.5 INTRAVENOUS INFUSION OF BLOOD PRODUCT
9.6 PAIN MANAGEMENT
9.7 OTHERS
10 GLOBAL IMPLANTABLE PORTS MARKET, BY END USERS
10.1 OVERVIEW
10.2 HOSPITALS
10.3 CLINICS
10.4 AMBULATORY SURGICAL CENTER
10.5 DIALYSIS CENTER
10.6 OTHERS
11 GLOBAL IMPLANTABLE PORTS MARKET, BY REGION
11.1 OVERVIEW
11.2 NORTH AMERICA
11.2.1 U.S.
11.2.2 CANADA
11.2.3 MEXICO
11.3 EUROPE
11.3.1 GERMANY
11.3.2 U.K.
11.3.3 FRANCE
11.3.4 ITALY
11.3.5 RUSSIA
11.3.6 SPAIN
11.3.7 NETHERLANDS
11.3.8 SWITZERLAND
11.3.9 BELGIUM
11.3.10 TURKEY
11.3.11 REST OF EUROPE
11.4 ASIA-PACIFIC
11.4.1 CHINA
11.4.2 JAPAN
11.4.3 INDIA
11.4.4 AUSTRALIA & NEW ZEALAND
11.4.5 SOUTH KOREA
11.4.6 INDONESIA
11.4.7 PHILIPPINES
11.4.8 THAILAND
11.4.9 MALAYSIA
11.4.10 SINGAPORE
11.4.11 REST OF ASIA-PACIFIC
11.5 SOUTH AMERICA
11.5.1 BRAZIL
11.5.2 ARGENTINA
11.5.3 REST OF SOUTH AMERICA
11.6 MIDDLE EAST & AFRICA
11.6.1 SAUDI ARABIA
11.6.2 SOUTH AFRICA
11.6.3 U.A.E
11.6.4 EGYPT
11.6.5 ISRAEL
11.6.6 REST OF MIDDLE EAST & AFRICA
12 GLOBAL IMPLANTABLE PORTS MARKET: COMPANY LANDSCAPE
12.1 COMPANY SHARE ANALYSIS: GLOBAL
12.2 COMPANY SHARE ANALYSIS: NORTH AMERICA
12.3 COMPANY SHARE ANALYSIS: EUROPE
12.4 COMPANY SHARE ANALYSIS: ASIA-PACIFIC
13 SWOT
14 GLOBAL IMPLANTABLE PORTS MARKET, COMPANY PROFILE
14.1 B.BRAUN SE
14.1.1 COMPANY SNAPSHOT
14.1.2 COMPANY SHARE ANALYSIS
14.1.3 PRODUCT PORTFOLIO
14.1.4 RECENT DEVELOPMENTS
14.2 ANGIODYNAMICS
14.2.1 COMPANY SNAPSHOT
14.2.2 REVENUE ANALYSIS
14.2.3 COMPANY SHARE ANALYSIS
14.2.4 PRODUCT PORTFOLIO
14.2.5 RECENT DEVELOPMENT
14.3 BD
14.3.1 COMPANY SNAPSHOT
14.3.2 REVENUE ANALYSIS
14.3.3 COMPANY SHARE ANALYSIS
14.3.4 PRODUCT PORTFOLIO
14.3.5 RECENT DEVELOPMENT
14.4 TELEFLEX INCORPORATED
14.4.1 COMPANY SNAPSHOT
14.4.2 REVENUE ANALYSIS
14.4.3 COMPANY SHARE ANALYSIS
14.4.4 PRODUCT PORTFOLIO
14.4.5 RECENT DEVELOPMENTS
14.5 VYGON
14.5.1 COMPANY SNAPSHOT
14.5.2 COMPANY SHARE ANALYSIS
14.5.3 PRODUCT PORTFOLIO
14.5.4 RECENT DEVELOPMENT
14.6 AMI GMBH
14.6.1 COMPANY SNAPSHOT
14.6.2 PRODUCT PORTFOLIO
14.6.3 RECENT DEVELOPMENT
14.7 DISTRICLASS MÉDICAL
14.7.1 COMPANY SNAPSHOT
14.7.2 PRODUCT PORTFOLIO
14.7.3 RECENT DEVELOPMENT
14.8 ICU MEDICAL, INC.
14.8.1 COMPANY SNAPSHOT
14.8.2 REVENUE ANALYSIS
14.8.3 PRODUCT PORTFOLIO
14.8.4 RECENT DEVELOPMENT
14.9 PAKUMEDMEDICAL PRODUCTS GMBH
14.9.1 COMPANY SNAPSHOT
14.9.2 PRODUCT PORTFOLIO
14.9.3 RECENT DEVELOPMENTS
15 QUESTIONNAIRE
16 RELATED REPORTS
List of Table
TABLE 1 GLOBAL IMPLANTABLE PORTS MARKET, BY TYPE, 2021-2030 (USD THOUSAND)
TABLE 2 GLOBAL SINGLE LUMEN IN IMPLANTABLE PORTS MARKET, BY REGION, 2021-2030 (USD THOUSAND)
TABLE 3 GLOBAL DOUBLE LUMEN IN IMPLANTABLE PORTS MARKET, BY REGION, 2021-2030 (USD THOUSAND)
TABLE 4 GLOBAL POWER-INJECTABLE IN IMPLANTABLE PORTS MARKET, BY REGION, 2021-2030 (USD THOUSAND)
TABLE 5 GLOBAL IMPLANTABLE PORTS MARKET, BY MATERIAL, 2021-2030 (USD THOUSAND)
TABLE 6 GLOBAL POLYURETHANE IN IMPLANTABLE PORTS MARKET, BY REGION, 2021-2030 (USD THOUSAND)
TABLE 7 GLOBAL SILICONE IN IMPLANTABLE PORTS MARKET, BY REGION, 2021-2030 (USD THOUSAND)
TABLE 8 GLOBAL TITANIUM IN IMPLANTABLE PORTS MARKET, BY REGION, 2021-2030 (USD THOUSAND)
TABLE 9 GLOBAL OTHERS IN IMPLANTABLE PORTS MARKET, BY REGION, 2021-2030 (USD THOUSAND)
TABLE 10 GLOBAL IMPLANTABLE PORTS MARKET, BY APPLICATION, 2021-2030 (USD THOUSAND)
TABLE 11 GLOBAL CHEMOTHERAPY IN IMPLANTABLE PORTS MARKET, BY REGION, 2021-2030 (USD THOUSAND)
TABLE 12 GLOBAL BLOOD TRANSFUSION IN IMPLANTABLE PORTS MARKET, BY REGION, 2021-2030 (USD THOUSAND)
TABLE 13 GLOBAL ANTIBIOTICS IN IMPLANTABLE PORTS MARKET, BY REGION, 2021-2030 (USD THOUSAND)
TABLE 14 GLOBAL INTRAVENOUS INFUSION OF BLOOD PRODUCTS IN IMPLANTABLE PORTS MARKET, BY REGION, 2021-2030 (USD THOUSAND)
TABLE 15 GLOBAL PAIN MANAGEMENT IN IMPLANTABLE PORTS MARKET, BY REGION, 2021-2030 (USD THOUSAND)
TABLE 16 GLOBAL OTHERS IN IMPLANTABLE PORTS MARKET, BY REGION, 2021-2030 (USD THOUSAND)
TABLE 17 GLOBAL IMPLANTABLE PORTS MARKET, BY END USERS, 2021-2030 (USD THOUSAND)
TABLE 18 GLOBAL HOSPITALS IN IMPLANTABLE PORTS MARKET, BY REGION, 2021-2030 (USD THOUSAND)
TABLE 19 GLOBAL CLINICS IN IMPLANTABLE PORTS MARKET, BY REGION, 2021-2030 (USD THOUSAND)
TABLE 20 GLOBAL AMBULATORY SURGICAL CENTER IN IMPLANTABLE PORTS MARKET, BY REGION, 2021-2030 (USD THOUSAND)
TABLE 21 GLOBAL DIALYSIS CENTERS IN IMPLANTABLE PORTS MARKET, BY REGION, 2021-2030 (USD THOUSAND)
TABLE 22 GLOBAL OTHERS IN IMPLANTABLE PORTS MARKET, BY REGION, 2021-2030 (USD THOUSAND)
TABLE 23 GLOBAL IMPLANTABLE PORTS MARKET, BY REGION, 2021-2030 (USD THOUSAND)
TABLE 24 NORTH AMERICA IMPLANTABLE PORTS MARKET, BY COUNTRY, 2021-2030 (USD THOUSAND)
TABLE 25 NORTH AMERICA IMPLANTABLE PORTS MARKET, BY TYPE, 2021-2030 (USD THOUSAND)
TABLE 26 NORTH AMERICA IMPLANTABLE PORTS MARKET, BY TYPE, 2021-2030 (THOUSANDS UNITS)
TABLE 27 NORTH AMERICA IMPLANTABLE PORTS MARKET, BY MATERIAL, 2021-2030 (USD THOUSAND)
TABLE 28 NORTH AMERICA IMPLANTABLE PORTS MARKET, BY APPLICATION, 2021-2030 (USD THOUSAND)
TABLE 29 NORTH AMERICA IMPLANTABLE PORTS MARKET, BY END USER, 2021-2030 (USD THOUSAND)
TABLE 30 U.S. IMPLANTABLE PORTS MARKET, BY TYPE, 2021-2030 (USD THOUSAND)
TABLE 31 U.S. IMPLANTABLE PORTS MARKET, BY TYPE, 2021-2030 (THOUSANDS UNITS)
TABLE 32 U.S. IMPLANTABLE PORTS MARKET, BY TYPE, 2021-2030 (ASP)
TABLE 33 U.S. IMPLANTABLE PORTS MARKET, BY MATERIAL, 2021-2030 (USD THOUSAND)
TABLE 34 U.S. IMPLANTABLE PORTS MARKET, BY APPLICATION, 2021-2030 (USD THOUSAND)
TABLE 35 U.S. IMPLANTABLE PORTS MARKET, BY END USERS, 2021-2030 (USD THOUSAND)
TABLE 36 CANADA IMPLANTABLE PORTS MARKET, BY TYPE, 2021-2030 (USD THOUSAND)
TABLE 37 CANADA IMPLANTABLE PORTS MARKET, BY TYPE, 2021-2030 (THOUSANDS UNITS)
TABLE 38 CANADA IMPLANTABLE PORTS MARKET, BY TYPE, 2021-2030 (ASP)
TABLE 39 CANADA IMPLANTABLE PORTS MARKET, BY MATERIAL, 2021-2030 (USD THOUSAND)
TABLE 40 CANADA IMPLANTABLE PORTS MARKET, BY APPLICATION, 2021-2030 (USD THOUSAND)
TABLE 41 CANADA IMPLANTABLE PORTS MARKET, BY END USERS, 2021-2030 (USD THOUSAND)
TABLE 42 MEXICO IMPLANTABLE PORTS MARKET, BY TYPE, 2021-2030 (USD THOUSAND)
TABLE 43 MEXICO IMPLANTABLE PORTS MARKET, BY TYPE, 2021-2030 (THOUSANDS UNITS)
TABLE 44 MEXICO IMPLANTABLE PORTS MARKET, BY TYPE, 2021-2030 (ASP)
TABLE 45 MEXICO IMPLANTABLE PORTS MARKET, BY MATERIAL, 2021-2030 (USD THOUSAND)
TABLE 46 MEXICO IMPLANTABLE PORTS MARKET, BY APPLICATION, 2021-2030 (USD THOUSAND)
TABLE 47 MEXICO IMPLANTABLE PORTS MARKET, BY END USERS, 2021-2030 (USD THOUSAND)
TABLE 48 EUROPE IMPLANTABLE PORTS MARKET, BY COUNTRY, 2021-2030 (USD THOUSAND)
TABLE 49 EUROPE IMPLANTABLE PORTS MARKET, BY TYPE, 2021-2030 (USD THOUSAND)
TABLE 50 EUROPE IMPLANTABLE PORTS MARKET, BY TYPE, 2021-2030 (THOUSANDS UNITS)
TABLE 51 EUROPE IMPLANTABLE PORTS MARKET, BY MATERIAL, 2021-2030 (USD THOUSAND)
TABLE 52 EUROPE IMPLANTABLE PORTS MARKET, BY APPLICATION, 2021-2030 (USD THOUSAND)
TABLE 53 EUROPE IMPLANTABLE PORTS MARKET, BY END USERS, 2021-2030 (USD THOUSAND)
TABLE 54 GERMANY IMPLANTABLE PORTS MARKET, BY TYPE, 2021-2030 (USD THOUSAND)
TABLE 55 GERMANY IMPLANTABLE PORTS MARKET, BY TYPE, 2021-2030 (THOUSANDS UNITS)
TABLE 56 GERMANY IMPLANTABLE PORTS MARKET, BY TYPE, 2021-2030 (ASP)
TABLE 57 GERMANY IMPLANTABLE PORTS MARKET, BY MATERIAL, 2021-2030 (USD THOUSAND)
TABLE 58 GERMANY IMPLANTABLE PORTS MARKET, BY APPLICATION, 2021-2030 (USD THOUSAND)
TABLE 59 GERMANY IMPLANTABLE PORTS MARKET, BY END USERS, 2021-2030 (USD THOUSAND)
TABLE 60 U.K. IMPLANTABLE PORTS MARKET, BY TYPE, 2021-2030 (USD THOUSAND)
TABLE 61 U.K. IMPLANTABLE PORTS MARKET, BY TYPE, 2021-2030 (THOUSANDS UNITS)
TABLE 62 U.K. IMPLANTABLE PORTS MARKET, BY TYPE, 2021-2030 (ASP)
TABLE 63 U.K. IMPLANTABLE PORTS MARKET, BY MATERIAL, 2021-2030 (USD THOUSAND)
TABLE 64 U.K. IMPLANTABLE PORTS MARKET, BY APPLICATION, 2021-2030 (USD THOUSAND)
TABLE 65 U.K. IMPLANTABLE PORTS MARKET, BY END USERS, 2021-2030 (USD THOUSAND)
TABLE 66 FRANCE IMPLANTABLE PORTS MARKET, BY TYPE, 2021-2030 (USD THOUSAND)
TABLE 67 FRANCE IMPLANTABLE PORTS MARKET, BY TYPE, 2021-2030 (THOUSANDS UNITS)
TABLE 68 FRANCE IMPLANTABLE PORTS MARKET, BY TYPE, 2021-2030 (ASP)
TABLE 69 FRANCE IMPLANTABLE PORTS MARKET, BY MATERIAL, 2021-2030 (USD THOUSAND)
TABLE 70 FRANCE IMPLANTABLE PORTS MARKET, BY APPLICATION, 2021-2030 (USD THOUSAND)
TABLE 71 FRANCE IMPLANTABLE PORTS MARKET, BY END USERS, 2021-2030 (USD THOUSAND)
TABLE 72 ITALY IMPLANTABLE PORTS MARKET, BY TYPE, 2021-2030 (USD THOUSAND)
TABLE 73 ITALY IMPLANTABLE PORTS MARKET, BY TYPE, 2021-2030 (THOUSANDS UNITS)
TABLE 74 ITALY IMPLANTABLE PORTS MARKET, BY TYPE, 2021-2030 (ASP)
TABLE 75 ITALY IMPLANTABLE PORTS MARKET, BY MATERIAL, 2021-2030 (USD THOUSAND)
TABLE 76 ITALY IMPLANTABLE PORTS MARKET, BY APPLICATION, 2021-2030 (USD THOUSAND)
TABLE 77 ITALY IMPLANTABLE PORTS MARKET, BY END USERS, 2021-2030 (USD THOUSAND)
TABLE 78 RUSSIA IMPLANTABLE PORTS MARKET, BY TYPE, 2021-2030 (USD THOUSAND)
TABLE 79 RUSSIA IMPLANTABLE PORTS MARKET, BY TYPE, 2021-2030 (THOUSANDS UNITS)
TABLE 80 RUSSIA IMPLANTABLE PORTS MARKET, BY TYPE, 2021-2030 (ASP)
TABLE 81 RUSSIA IMPLANTABLE PORTS MARKET, BY MATERIAL, 2021-2030 (USD THOUSAND)
TABLE 82 RUSSIA IMPLANTABLE PORTS MARKET, BY APPLICATION, 2021-2030 (USD THOUSAND)
TABLE 83 RUSSIA IMPLANTABLE PORTS MARKET, BY END USERS, 2021-2030 (USD THOUSAND)
TABLE 84 SPAIN IMPLANTABLE PORTS MARKET, BY TYPE, 2021-2030 (USD THOUSAND)
TABLE 85 SPAIN IMPLANTABLE PORTS MARKET, BY TYPE, 2021-2030 (THOUSANDS UNITS)
TABLE 86 SPAIN IMPLANTABLE PORTS MARKET, BY TYPE, 2021-2030 (ASP)
TABLE 87 SPAIN IMPLANTABLE PORTS MARKET, BY MATERIAL, 2021-2030 (USD THOUSAND)
TABLE 88 SPAIN IMPLANTABLE PORTS MARKET, BY APPLICATION, 2021-2030 (USD THOUSAND)
TABLE 89 SPAIN IMPLANTABLE PORTS MARKET, BY END USERS, 2021-2030 (USD THOUSAND)
TABLE 90 NETHERLANDS IMPLANTABLE PORTS MARKET, BY TYPE, 2021-2030 (USD THOUSAND)
TABLE 91 NETHERLANDS IMPLANTABLE PORTS MARKET, BY TYPE, 2021-2030 (THOUSANDS UNITS)
TABLE 92 NETHERLANDS IMPLANTABLE PORTS MARKET, BY TYPE, 2021-2030 (ASP)
TABLE 93 NETHERLANDS IMPLANTABLE PORTS MARKET, BY MATERIAL, 2021-2030 (USD THOUSAND)
TABLE 94 NETHERLANDS IMPLANTABLE PORTS MARKET, BY APPLICATION, 2021-2030 (USD THOUSAND)
TABLE 95 NETHERLANDS IMPLANTABLE PORTS MARKET, BY END USERS, 2021-2030 (USD THOUSAND)
TABLE 96 SWITZERLAND IMPLANTABLE PORTS MARKET, BY TYPE, 2021-2030 (USD THOUSAND)
TABLE 97 SWITZERLAND IMPLANTABLE PORTS MARKET, BY TYPE, 2021-2030 (THOUSANDS UNITS)
TABLE 98 SWITZERLAND IMPLANTABLE PORTS MARKET, BY TYPE, 2021-2030 (ASP)
TABLE 99 SWITZERLAND IMPLANTABLE PORTS MARKET, BY MATERIAL, 2021-2030 (USD THOUSAND)
TABLE 100 SWITZERLAND IMPLANTABLE PORTS MARKET, BY APPLICATION, 2021-2030 (USD THOUSAND)
TABLE 101 SWITZERLAND IMPLANTABLE PORTS MARKET, BY END USERS, 2021-2030 (USD THOUSAND)
TABLE 102 BELGIUM IMPLANTABLE PORTS MARKET, BY TYPE, 2021-2030 (USD THOUSAND)
TABLE 103 BELGIUM IMPLANTABLE PORTS MARKET, BY TYPE, 2021-2030 (THOUSANDS UNITS)
TABLE 104 BELGIUM IMPLANTABLE PORTS MARKET, BY TYPE, 2021-2030 (ASP)
TABLE 105 BELGIUM IMPLANTABLE PORTS MARKET, BY MATERIAL, 2021-2030 (USD THOUSAND)
TABLE 106 BELGIUM IMPLANTABLE PORTS MARKET, BY APPLICATION, 2021-2030 (USD THOUSAND)
TABLE 107 BELGIUM IMPLANTABLE PORTS MARKET, BY END USERS, 2021-2030 (USD THOUSAND)
TABLE 108 TURKEY IMPLANTABLE PORTS MARKET, BY TYPE, 2021-2030 (USD THOUSAND)
TABLE 109 TURKEY IMPLANTABLE PORTS MARKET, BY TYPE, 2021-2030 (THOUSANDS UNITS)
TABLE 110 TURKEY IMPLANTABLE PORTS MARKET, BY TYPE, 2021-2030 (ASP)
TABLE 111 TURKEY IMPLANTABLE PORTS MARKET, BY MATERIAL, 2021-2030 (USD THOUSAND)
TABLE 112 TURKEY IMPLANTABLE PORTS MARKET, BY APPLICATION, 2021-2030 (USD THOUSAND)
TABLE 113 TURKEY IMPLANTABLE PORTS MARKET, BY END USERS, 2021-2030 (USD THOUSAND)
TABLE 114 REST OF EUROPE IMPLANTABLE PORTS MARKET, BY TYPE, 2021-2030 (USD THOUSAND)
TABLE 115 ASIA-PACIFIC IMPLANTABLE PORTS MARKET, BY COUNTRY, 2021-2030 (USD THOUSAND)
TABLE 116 ASIA-PACIFIC IMPLANTABLE PORTS MARKET, BY TYPE, 2021-2030 (USD THOUSAND)
TABLE 117 ASIA-PACIFIC IMPLANTABLE PORTS MARKET, BY TYPE, 2021-2030 (THOUSANDS UNITS)
TABLE 118 ASIA-PACIFIC IMPLANTABLE PORTS MARKET, BY MATERIAL, 2021-2030 (USD THOUSAND)
TABLE 119 ASIA-PACIFIC IMPLANTABLE PORTS MARKET, BY APPLICATION, 2021-2030 (USD THOUSAND)
TABLE 120 ASIA-PACIFIC IMPLANTABLE PORTS MARKET, BY END USERS, 2021-2030 (USD THOUSAND)
TABLE 121 CHINA IMPLANTABLE PORTS MARKET, BY TYPE, 2021-2030 (USD THOUSAND)
TABLE 122 CHINA IMPLANTABLE PORTS MARKET, BY TYPE, 2021-2030 (THOUSANDS UNITS)
TABLE 123 CHINA IMPLANTABLE PORTS MARKET, BY TYPE, 2021-2030 (ASP)
TABLE 124 CHINA IMPLANTABLE PORTS MARKET, BY MATERIAL, 2021-2030 (USD THOUSAND)
TABLE 125 CHINA IMPLANTABLE PORTS MARKET, BY APPLICATION, 2021-2030 (USD THOUSAND)
TABLE 126 CHINA IMPLANTABLE PORTS MARKET, BY END USERS, 2021-2030 (USD THOUSAND)
TABLE 127 JAPAN IMPLANTABLE PORTS MARKET, BY TYPE, 2021-2030 (USD THOUSAND)
TABLE 128 JAPAN IMPLANTABLE PORTS MARKET, BY TYPE, 2021-2030 (THOUSANDS UNITS)
TABLE 129 JAPAN IMPLANTABLE PORTS MARKET, BY TYPE, 2021-2030 (ASP)
TABLE 130 JAPAN IMPLANTABLE PORTS MARKET, BY MATERIAL, 2021-2030 (USD THOUSAND)
TABLE 131 JAPAN IMPLANTABLE PORTS MARKET, BY APPLICATION, 2021-2030 (USD THOUSAND)
TABLE 132 JAPAN IMPLANTABLE PORTS MARKET, BY END USERS, 2021-2030 (USD THOUSAND)
TABLE 133 INDIA IMPLANTABLE PORTS MARKET, BY TYPE, 2021-2030 (USD THOUSAND)
TABLE 134 INDIA IMPLANTABLE PORTS MARKET, BY TYPE, 2021-2030 (THOUSANDS UNITS)
TABLE 135 INDIA IMPLANTABLE PORTS MARKET, BY TYPE, 2021-2030 (ASP)
TABLE 136 INDIA IMPLANTABLE PORTS MARKET, BY MATERIAL, 2021-2030 (USD THOUSAND)
TABLE 137 INDIA IMPLANTABLE PORTS MARKET, BY APPLICATION, 2021-2030 (USD THOUSAND)
TABLE 138 INDIA IMPLANTABLE PORTS MARKET, BY END USERS, 2021-2030 (USD THOUSAND)
TABLE 139 AUSTRALIA & NEW ZEALAND IMPLANTABLE PORTS MARKET, BY TYPE, 2021-2030 (USD THOUSAND)
TABLE 140 AUSTRALIA & NEW ZEALAND IMPLANTABLE PORTS MARKET, BY TYPE, 2021-2030 (THOUSANDS UNITS)
TABLE 141 AUSTRALIA & NEW ZEALAND IMPLANTABLE PORTS MARKET, BY TYPE, 2021-2030 (ASP)
TABLE 142 AUSTRALIA & NEW ZEALAND IMPLANTABLE PORTS MARKET, BY MATERIAL, 2021-2030 (USD THOUSAND)
TABLE 143 AUSTRALIA & NEW ZEALAND IMPLANTABLE PORTS MARKET, BY APPLICATION, 2021-2030 (USD THOUSAND)
TABLE 144 AUSTRALIA & NEW ZEALAND IMPLANTABLE PORTS MARKET, BY END USERS, 2021-2030 (USD THOUSAND)
TABLE 145 SOUTH KOREA IMPLANTABLE PORTS MARKET, BY TYPE, 2021-2030 (USD THOUSAND)
TABLE 146 SOUTH KOREA IMPLANTABLE PORTS MARKET, BY TYPE, 2021-2030 (THOUSANDS UNITS)
TABLE 147 SOUTH KOREA IMPLANTABLE PORTS MARKET, BY TYPE, 2021-2030 (ASP)
TABLE 148 SOUTH KOREA IMPLANTABLE PORTS MARKET, BY MATERIAL, 2021-2030 (USD THOUSAND)
TABLE 149 SOUTH KOREA IMPLANTABLE PORTS MARKET, BY APPLICATION, 2021-2030 (USD THOUSAND)
TABLE 150 SOUTH KOREA IMPLANTABLE PORTS MARKET, BY END USERS, 2021-2030 (USD THOUSAND)
TABLE 151 INDONESIA IMPLANTABLE PORTS MARKET, BY TYPE, 2021-2030 (USD THOUSAND)
TABLE 152 INDONESIA IMPLANTABLE PORTS MARKET, BY TYPE, 2021-2030 (THOUSANDS UNITS)
TABLE 153 INDONESIA IMPLANTABLE PORTS MARKET, BY TYPE, 2021-2030 (ASP)
TABLE 154 INDONESIA IMPLANTABLE PORTS MARKET, BY MATERIAL, 2021-2030 (USD THOUSAND)
TABLE 155 INDONESIA IMPLANTABLE PORTS MARKET, BY APPLICATION, 2021-2030 (USD THOUSAND)
TABLE 156 INDONESIA IMPLANTABLE PORTS MARKET, BY END USERS, 2021-2030 (USD THOUSAND)
TABLE 157 PHILIPPINES IMPLANTABLE PORTS MARKET, BY TYPE, 2021-2030 (USD THOUSAND)
TABLE 158 PHILIPPINES IMPLANTABLE PORTS MARKET, BY TYPE, 2021-2030 (THOUSANDS UNITS)
TABLE 159 PHILIPPINES IMPLANTABLE PORTS MARKET, BY TYPE, 2021-2030 (ASP)
TABLE 160 PHILIPPINES IMPLANTABLE PORTS MARKET, BY MATERIAL, 2021-2030 (USD THOUSAND)
TABLE 161 PHILIPPINES IMPLANTABLE PORTS MARKET, BY APPLICATION, 2021-2030 (USD THOUSAND)
TABLE 162 PHILIPPINES IMPLANTABLE PORTS MARKET, BY END USERS, 2021-2030 (USD THOUSAND)
TABLE 163 THAILAND IMPLANTABLE PORTS MARKET, BY TYPE, 2021-2030 (USD THOUSAND)
TABLE 164 THAILAND IMPLANTABLE PORTS MARKET, BY TYPE, 2021-2030 (THOUSANDS UNITS)
TABLE 165 THAILAND IMPLANTABLE PORTS MARKET, BY TYPE, 2021-2030 (ASP)
TABLE 166 THAILAND IMPLANTABLE PORTS MARKET, BY MATERIAL, 2021-2030 (USD THOUSAND)
TABLE 167 THAILAND IMPLANTABLE PORTS MARKET, BY APPLICATION, 2021-2030 (USD THOUSAND)
TABLE 168 THAILAND IMPLANTABLE PORTS MARKET, BY END USERS, 2021-2030 (USD THOUSAND)
TABLE 169 MALAYSIA IMPLANTABLE PORTS MARKET, BY TYPE, 2021-2030 (USD THOUSAND)
TABLE 170 MALAYSIA IMPLANTABLE PORTS MARKET, BY TYPE, 2021-2030 (THOUSANDS UNITS)
TABLE 171 MALAYSIA IMPLANTABLE PORTS MARKET, BY TYPE, 2021-2030 (ASP)
TABLE 172 MALAYSIA IMPLANTABLE PORTS MARKET, BY MATERIAL, 2021-2030 (USD THOUSAND)
TABLE 173 MALAYSIA IMPLANTABLE PORTS MARKET, BY APPLICATION, 2021-2030 (USD THOUSAND)
TABLE 174 MALAYSIA IMPLANTABLE PORTS MARKET, BY END USERS, 2021-2030 (USD THOUSAND)
TABLE 175 SINGAPORE IMPLANTABLE PORTS MARKET, BY TYPE, 2021-2030 (USD THOUSAND)
TABLE 176 SINGAPORE IMPLANTABLE PORTS MARKET, BY TYPE, 2021-2030 (THOUSANDS UNITS)
TABLE 177 SINGAPORE IMPLANTABLE PORTS MARKET, BY TYPE, 2021-2030 (ASP)
TABLE 178 SINGAPORE IMPLANTABLE PORTS MARKET, BY MATERIAL, 2021-2030 (USD THOUSAND)
TABLE 179 SINGAPORE IMPLANTABLE PORTS MARKET, BY APPLICATION, 2021-2030 (USD THOUSAND)
TABLE 180 SINGAPORE IMPLANTABLE PORTS MARKET, BY END USERS, 2021-2030 (USD THOUSAND)
TABLE 181 REST OF ASIA PACIFIC IMPLANTABLE PORTS MARKET, BY TYPE, 2021-2030 (USD THOUSAND)
TABLE 182 SOUTH AMERICA IMPLANTABLE PORTS MARKET, BY COUNTRY, 2021-2030 (USD THOUSAND)
TABLE 183 SOUTH AMERICA IMPLANTABLE PORTS MARKET, BY TYPE, 2021-2030 (USD THOUSAND)
TABLE 184 SOUTH AMERICA IMPLANTABLE PORTS MARKET, BY TYPE, 2021-2030 (THOUSANDS UNITS)
TABLE 185 SOUTH AMERICA IMPLANTABLE PORTS MARKET, BY MATERIAL, 2021-2030 (USD THOUSAND)
TABLE 186 SOUTH AMERICA IMPLANTABLE PORTS MARKET, BY APPLICATION, 2021-2030 (USD THOUSAND)
TABLE 187 SOUTH AMERICA IMPLANTABLE PORTS MARKET, BY END USERS, 2021-2030 (USD THOUSAND)
TABLE 188 BRAZIL IMPLANTABLE PORTS MARKET, BY TYPE, 2021-2030 (USD THOUSAND)
TABLE 189 BRAZIL IMPLANTABLE PORTS MARKET, BY TYPE, 2021-2030 (THOUSANDS UNITS)
TABLE 190 BRAZIL IMPLANTABLE PORTS MARKET, BY TYPE, 2021-2030 (ASP)
TABLE 191 BRAZIL IMPLANTABLE PORTS MARKET, BY MATERIAL, 2021-2030 (USD THOUSAND)
TABLE 192 BRAZIL IMPLANTABLE PORTS MARKET, BY APPLICATION, 2021-2030 (USD THOUSAND)
TABLE 193 BRAZIL IMPLANTABLE PORTS MARKET, BY END USERS, 2021-2030 (USD THOUSAND)
TABLE 194 ARGENTINA IMPLANTABLE PORTS MARKET, BY TYPE, 2021-2030 (USD THOUSAND)
TABLE 195 ARGENTINA IMPLANTABLE PORTS MARKET, BY TYPE, 2021-2030 (THOUSANDS UNITS)
TABLE 196 ARGENTINA IMPLANTABLE PORTS MARKET, BY TYPE, 2021-2030 (ASP)
TABLE 197 ARGENTINA IMPLANTABLE PORTS MARKET, BY MATERIAL, 2021-2030 (USD THOUSAND)
TABLE 198 ARGENTINA IMPLANTABLE PORTS MARKET, BY APPLICATION, 2021-2030 (USD THOUSAND)
TABLE 199 ARGENTINA IMPLANTABLE PORTS MARKET, BY END USERS, 2021-2030 (USD THOUSAND)
TABLE 200 REST OF SOUTH AMERICA IMPLANTABLE PORTS MARKET, BY TYPE, 2021-2030 (USD THOUSAND)
TABLE 201 MIDDLE EAST AND AFRICA IMPLANTABLE PORTS MARKET, BY COUNTRY, 2021-2030 (USD THOUSAND)
TABLE 202 MIDDLE EAST AND AFRICA IMPLANTABLE PORTS MARKET, BY TYPE, 2021-2030 (USD THOUSAND)
TABLE 203 MIDDLE EAST AND AFRICA IMPLANTABLE PORTS MARKET, BY TYPE, 2021-2030 (THOUSANDS UNITS)
TABLE 204 MIDDLE EAST AND AFRICA IMPLANTABLE PORTS MARKET, BY MATERIAL, 2021-2030 (USD THOUSAND)
TABLE 205 MIDDLE EAST AND AFRICA IMPLANTABLE PORTS MARKET, BY APPLICATION, 2021-2030 (USD THOUSAND)
TABLE 206 MIDDLE EAST AND AFRICA IMPLANTABLE PORTS MARKET, BY END USERS, 2021-2030 (USD THOUSAND)
TABLE 207 SAUDI ARABIA IMPLANTABLE PORTS MARKET, BY TYPE, 2021-2030 (USD THOUSAND)
TABLE 208 SAUDI ARABIA IMPLANTABLE PORTS MARKET, BY TYPE, 2021-2030 (THOUSANDS UNITS)
TABLE 209 SAUDI ARABIA IMPLANTABLE PORTS MARKET, BY TYPE, 2021-2030 (ASP)
TABLE 210 SAUDI ARABIA IMPLANTABLE PORTS MARKET, BY MATERIAL, 2021-2030 (USD THOUSAND)
TABLE 211 SAUDI ARABIA IMPLANTABLE PORTS MARKET, BY APPLICATION, 2021-2030 (USD THOUSAND)
TABLE 212 SAUDI ARABIA IMPLANTABLE PORTS MARKET, BY END USERS, 2021-2030 (USD THOUSAND)
TABLE 213 SOUTH AFRICA IMPLANTABLE PORTS MARKET, BY TYPE, 2021-2030 (USD THOUSAND)
TABLE 214 SOUTH AFRICA IMPLANTABLE PORTS MARKET, BY TYPE, 2021-2030 (THOUSANDS UNITS)
TABLE 215 SOUTH AFRICA IMPLANTABLE PORTS MARKET, BY TYPE, 2021-2030 (ASP)
TABLE 216 SOUTH AFRICA IMPLANTABLE PORTS MARKET, BY MATERIAL, 2021-2030 (USD THOUSAND)
TABLE 217 SOUTH AFRICA IMPLANTABLE PORTS MARKET, BY APPLICATION, 2021-2030 (USD THOUSAND)
TABLE 218 SOUTH AFRICA IMPLANTABLE PORTS MARKET, BY END USERS, 2021-2030 (USD THOUSAND)
TABLE 219 U.A.E IMPLANTABLE PORTS MARKET, BY TYPE, 2021-2030 (USD THOUSAND)
TABLE 220 U.A.E IMPLANTABLE PORTS MARKET, BY TYPE, 2021-2030 (THOUSANDS UNITS)
TABLE 221 U.A.E IMPLANTABLE PORTS MARKET, BY TYPE, 2021-2030 (ASP)
TABLE 222 U.A.E IMPLANTABLE PORTS MARKET, BY MATERIAL, 2021-2030 (USD THOUSAND)
TABLE 223 U.A.E IMPLANTABLE PORTS MARKET, BY APPLICATION, 2021-2030 (USD THOUSAND)
TABLE 224 U.A.E IMPLANTABLE PORTS MARKET, BY END USERS, 2021-2030 (USD THOUSAND)
TABLE 225 EGYPT IMPLANTABLE PORTS MARKET, BY TYPE, 2021-2030 (USD THOUSAND)
TABLE 226 EGYPT IMPLANTABLE PORTS MARKET, BY TYPE, 2021-2030 (THOUSANDS UNITS)
TABLE 227 EGYPT IMPLANTABLE PORTS MARKET, BY TYPE, 2021-2030 (ASP)
TABLE 228 EGYPT IMPLANTABLE PORTS MARKET, BY MATERIAL, 2021-2030 (USD THOUSAND)
TABLE 229 EGYPT IMPLANTABLE PORTS MARKET, BY APPLICATION, 2021-2030 (USD THOUSAND)
TABLE 230 EGYPT IMPLANTABLE PORTS MARKET, BY END USERS, 2021-2030 (USD THOUSAND)
TABLE 231 ISRAEL IMPLANTABLE PORTS MARKET, BY TYPE, 2021-2030 (USD THOUSAND)
TABLE 232 ISRAEL IMPLANTABLE PORTS MARKET, BY TYPE, 2021-2030 (THOUSANDS UNITS)
TABLE 233 ISRAEL IMPLANTABLE PORTS MARKET, BY TYPE, 2021-2030 (ASP)
TABLE 234 ISRAEL IMPLANTABLE PORTS MARKET, BY MATERIAL, 2021-2030 (USD THOUSAND)
TABLE 235 ISRAEL IMPLANTABLE PORTS MARKET, BY APPLICATION, 2021-2030 (USD THOUSAND)
TABLE 236 ISRAEL IMPLANTABLE PORTS MARKET, BY END USERS, 2021-2030 (USD THOUSAND)
TABLE 237 REST OF MIDDLE EAST AND AFRICA IMPLANTABLE PORTS MARKET, BY TYPE, 2021-2030 (USD THOUSAND)
List of Figure
FIGURE 1 GLOBAL IMPLANTABLE PORTS MARKET: SEGMENTATION
FIGURE 2 GLOBAL IMPLANTABLE PORTS MARKET: DATA TRIANGULATION
FIGURE 3 GLOBAL IMPLANTABLE PORTS MARKET: DROC ANALYSIS
FIGURE 4 GLOBAL IMPLANTABLE PORTS MARKET: GLOBAL VS REGIONAL MARKET ANALYSIS
FIGURE 5 GLOBAL IMPLANTABLE PORTS MARKET: COMPANY RESEARCH ANALYSIS
FIGURE 6 GLOBAL IMPLANTABLE PORTS MARKET: INTERVIEW DEMOGRAPHICS
FIGURE 7 GLOBAL IMPLANTABLE PORTS MARKET: MARKET END USERS COVERAGE GRID
FIGURE 8 GLOBAL IMPLANTABLE PORTS MARKET: DBMR MARKET POSITION GRID
FIGURE 9 GLOBAL IMPLANTABLE PORTS MARKET: VENDOR SHARE ANALYSIS
FIGURE 10 GLOBAL IMPLANTABLE PORTS MARKET: SEGMENTATION
FIGURE 11 THE RISING PREVALENCE OF CHRONIC DISEASES AND GROWING DEMAND FOR MINIMALLY INVASIVE PROCEDURES ARE EXPECTED TO DRIVE THE GROWTH OF THE GLOBAL IMPLANTABLE PORTS MARKET FROM 2023 TO 2030
FIGURE 12 THE SINGLE LUMEN SEGMENT, IS EXPECTED TO ACCOUNT FOR THE LARGEST SHARE OF THE GLOBAL IMPLANTABLE PORTS MARKET IN 2023 & 2030
FIGURE 13 NORTH AMERICA IS EXPECTED TO DOMINATE THE GLOBAL IMPLANTABLE PORTS MARKET AND IS EXPECTED TO GROW WITH THE HIGHEST CAGR IN THE FORECAST PERIOD OF 2023 TO 2030
FIGURE 14 NORTH AMERICA IS THE FASTEST-GROWING MARKET FOR GLOBAL IMPLANTABLE PORTS MARKET SERVICE PROVIDERS IN THE FORECAST PERIOD OF 2023 TO 2030
FIGURE 15 DRIVERS, RESTRAINTS, OPPORTUNITIES, AND CHALLENGES OF THE GLOBAL IMPLANTABLE PORTS MARKET
FIGURE 16 GLOBAL IMPLANTABLE PORTS MARKET: BY TYPE, 2022
FIGURE 17 GLOBAL IMPLANTABLE PORTS MARKET: BY TYPE, 2023-2030 (USD THOUSAND)
FIGURE 18 GLOBAL IMPLANTABLE PORTS MARKET: BY TYPE, CAGR (2023-2030)
FIGURE 19 GLOBAL IMPLANTABLE PORTS MARKET: BY TYPE, LIFELINE CURVE
FIGURE 20 GLOBAL IMPLANTABLE PORTS MARKET: BY MATERIAL, 2022
FIGURE 21 GLOBAL IMPLANTABLE PORTS MARKET: BY MATERIAL, 2023-2030 (USD THOUSAND)
FIGURE 22 GLOBAL IMPLANTABLE PORTS MARKET: BY MATERIAL, CAGR (2023-2030)
FIGURE 23 GLOBAL IMPLANTABLE PORTS MARKET: BY MATERIAL, LIFELINE CURVE
FIGURE 24 GLOBAL IMPLANTABLE PORTS MARKET: BY APPLICATION, 2022
FIGURE 25 GLOBAL IMPLANTABLE PORTS MARKET: BY APPLICATION, 2023-2030 (USD THOUSAND)
FIGURE 26 GLOBAL IMPLANTABLE PORTS MARKET: BY APPLICATION, CAGR (2023-2030)
FIGURE 27 GLOBAL IMPLANTABLE PORTS MARKET: BY APPLICATION, LIFELINE CURVE
FIGURE 28 GLOBAL IMPLANTABLE PORTS MARKET: BY END USERS, 2022
FIGURE 29 GLOBAL IMPLANTABLE PORTS MARKET: BY END USERS, 2023-2030 (USD THOUSAND)
FIGURE 30 GLOBAL IMPLANTABLE PORTS MARKET: BY END USERS, CAGR (2023-2030)
FIGURE 31 GLOBAL IMPLANTABLE PORTS MARKET: BY END USERS, LIFELINE CURVE
FIGURE 32 GLOBAL IMPLANTABLE PORTS MARKET: SNAPSHOT (2022)
FIGURE 33 GLOBAL IMPLANTABLE PORTS MARKET: BY REGION (2022)
FIGURE 34 GLOBAL IMPLANTABLE PORTS MARKET: BY REGION (2023 & 2030)
FIGURE 35 GLOBAL IMPLANTABLE PORTS MARKET: BY REGION (2022 & 2030)
FIGURE 36 GLOBAL IMPLANTABLE PORTS MARKET: BY TYPE (2023-2030)
FIGURE 37 NORTH AMERICA IMPLANTABLE PORTS MARKET: SNAPSHOT (2022)
FIGURE 38 NORTH AMERICA IMPLANTABLE PORTS MARKET: BY COUNTRY (2022)
FIGURE 39 NORTH AMERICA IMPLANTABLE PORTS MARKET: BY COUNTRY (2023 & 2030)
FIGURE 40 NORTH AMERICA IMPLANTABLE PORTS MARKET: BY COUNTRY (2022 & 2030)
FIGURE 41 NORTH AMERICA IMPLANTABLE PORTS MARKET: BY TYPE (2023-2030)
FIGURE 42 EUROPE IMPLANTABLE PORTS MARKET: SNAPSHOT (2022)
FIGURE 43 EUROPE IMPLANTABLE PORTS MARKET: BY COUNTRY (2022)
FIGURE 44 EUROPE IMPLANTABLE PORTS MARKET: BY COUNTRY (2023 & 2030)
FIGURE 45 EUROPE IMPLANTABLE PORTS MARKET: BY COUNTRY (2022 & 2030)
FIGURE 46 EUROPE IMPLANTABLE PORTS MARKET: BY TYPE (2023-2030)
FIGURE 47 ASIA-PACIFIC IMPLANTABLE PORTS MARKET: SNAPSHOT (2022)
FIGURE 48 ASIA-PACIFIC IMPLANTABLE PORTS MARKET: BY COUNTRY (2022)
FIGURE 49 ASIA-PACIFIC IMPLANTABLE PORTS MARKET: BY COUNTRY (2023 & 2030)
FIGURE 50 ASIA-PACIFIC IMPLANTABLE PORTS MARKET: BY COUNTRY (2022 & 2030)
FIGURE 51 ASIA-PACIFIC IMPLANTABLE PORTS MARKET: BY TYPE (2023-2030)
FIGURE 52 SOUTH AMERICA IMPLANTABLE PORTS MARKET: SNAPSHOT (2022)
FIGURE 53 SOUTH AMERICA IMPLANTABLE PORTS MARKET: BY COUNTRY (2022)
FIGURE 54 SOUTH AMERICA IMPLANTABLE PORTS MARKET: BY COUNTRY (2023 & 2030)
FIGURE 55 SOUTH AMERICA IMPLANTABLE PORTS MARKET: BY COUNTRY (2022 & 2030)
FIGURE 56 SOUTH AMERICA IMPLANTABLE PORTS MARKET: BY TYPE (2023-2030)
FIGURE 57 MIDDLE EAST & AFRICA IMPLANTABLE PORTS MARKET: SNAPSHOT (2022)
FIGURE 58 MIDDLE EAST & AFRICA IMPLANTABLE PORTS MARKET: BY COUNTRY (2022)
FIGURE 59 MIDDLE EAST & AFRICA IMPLANTABLE PORTS MARKET: BY COUNTRY (2023 & 2030)
FIGURE 60 MIDDLE EAST & AFRICA IMPLANTABLE PORTS MARKET: BY COUNTRY (2022 & 2030)
FIGURE 61 MIDDLE EAST & AFRICA IMPLANTABLE PORTS MARKET: BY TYPE (2023-2030)
FIGURE 62 GLOBAL IMPLANTABLE PORTS MARKET: COMPANY SHARE 2022 (%)
FIGURE 63 NORTH AMERICA IMPLANTABLE PORTS MARKET: COMPANY SHARE 2022 (%)
FIGURE 64 EUROPE IMPLANTABLE PORTS MARKET: COMPANY SHARE 2022 (%)
FIGURE 65 ASIA-PACIFIC IMPLANTABLE PORTS MARKET: COMPANY SHARE 2022 (%)
Data collection and base year analysis are done using data collection modules with large sample sizes. The stage includes obtaining market information or related data through various sources and strategies. It includes examining and planning all the data acquired from the past in advance. It likewise envelops the examination of information inconsistencies seen across different information sources. The market data is analysed and estimated using market statistical and coherent models. Also, market share analysis and key trend analysis are the major success factors in the market report. To know more, please request an analyst call or drop down your inquiry.
The key research methodology used by DBMR research team is data triangulation which involves data mining, analysis of the impact of data variables on the market and primary (industry expert) validation. Data models include Vendor Positioning Grid, Market Time Line Analysis, Market Overview and Guide, Company Positioning Grid, Patent Analysis, Pricing Analysis, Company Market Share Analysis, Standards of Measurement, Global versus Regional and Vendor Share Analysis. To know more about the research methodology, drop in an inquiry to speak to our industry experts.
Data Bridge Market Research is a leader in advanced formative research. We take pride in servicing our existing and new customers with data and analysis that match and suits their goal. The report can be customized to include price trend analysis of target brands understanding the market for additional countries (ask for the list of countries), clinical trial results data, literature review, refurbished market and product base analysis. Market analysis of target competitors can be analyzed from technology-based analysis to market portfolio strategies. We can add as many competitors that you require data about in the format and data style you are looking for. Our team of analysts can also provide you data in crude raw excel files pivot tables (Fact book) or can assist you in creating presentations from the data sets available in the report.


