
Global Indium Market
Market Size in USD Million
 USD
818.99 Million
USD
1,841.94 Million
2025
2033
USD
818.99 Million
USD
1,841.94 Million
2025
2033
| 2026 - 2033 | |
| USD 818.99 Million | |
| USD 1,841.94 Million | |
| % | |
|
Indium Market Size
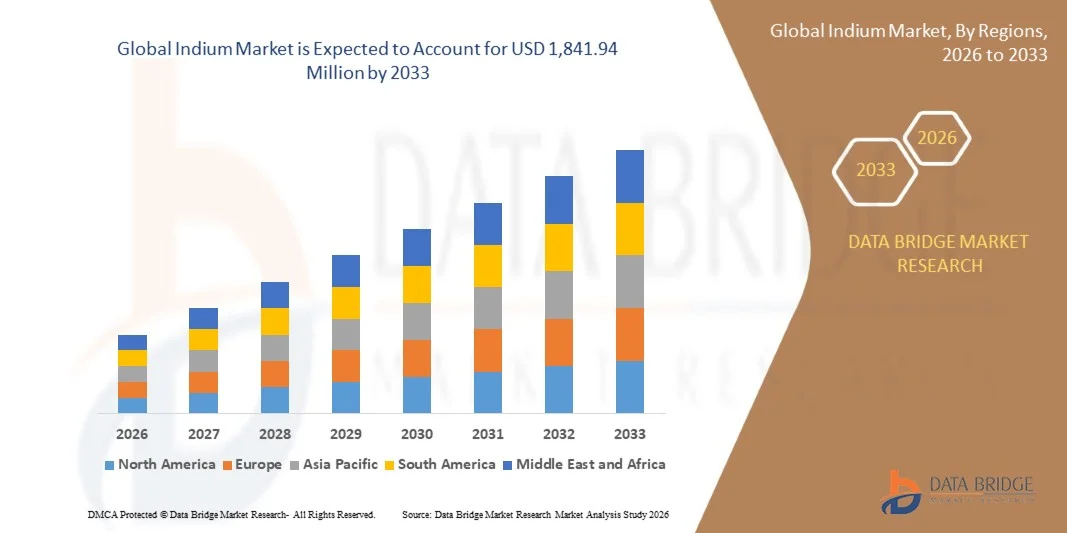
The Indium Market is expected to reach USD 1,841.94 Million by 2033 from USD 818.99 Million in 2025, growing with a substantial CAGR of 10.79% in the forecast period of 2026 to 2033. The market is experiencing consistent growth driven by rising demand for safe and realistic driver training solutions, rapid advancements in simulation hardware and software, and expanding applications across automotive R&D, defense, and professional motorsport.
The increasing demand for advanced consumer electronics, high-resolution display panels, and semiconductor devices is significantly driving the Indium Market. Growing adoption of smartphones, tablets, laptops, OLED/LCD displays, and emerging technologies such as flexible electronics is boosting the consumption of indium-based materials, particularly indium tin oxide (ITO). In addition, expanding investments in semiconductor manufacturing, renewable energy applications, and next-generation communication technologies are strengthening indium demand. Continuous technological advancements and the shift toward energy-efficient electronic components are further supporting the growth of the Indium Market.
Key Market Trends & Insights
- Asia-Pacific dominated the Indium Market with the largest revenue share of 51.77% in 2025, supported by the region’s strong electronics manufacturing base, extensive display panel production, significant semiconductor fabrication capacity, and the presence of major indium refining and processing facilities, particularly in China, Japan, South Korea, and Taiwan.
- Sputtering Targets segment led the market with a 28.22% share in 2025, driven by their widespread use in the deposition of indium tin oxide (ITO) coatings for LCD, OLED, touchscreen, photovoltaic, and semiconductor applications.
- Asia-Pacific is expected to be the fastest-growing region at a CAGR of 10.98% from 2026 to 2033, fueled by increasing investments in semiconductor manufacturing, expanding display panel production, rising consumer electronics demand, and growing adoption of advanced technologies across China, India, South Korea, and Southeast Asia.
- Sputtering Targets are the fastest-growing product type, projected to register a CAGR of 12.24%, reflecting increasing demand for high-performance display technologies, advanced semiconductors, and next-generation electronic devices.
- The Pure Indium Metal segment dominates the Material Composition category with a 52.78% revenue share in 2025, owing to its extensive use in indium tin oxide production, semiconductor manufacturing, low-temperature soldering, and thermal interface materials.
- 4N (99.99%) accounts for 25.20% of the market, preferred across electronics, display, and industrial applications due to its balance of high purity, reliable performance, and cost-effectiveness.
- The 6N (99.9999%) segment is the fastest-growing software category, with a CAGR of 11.57%, driven by rising demand for ultra-high-purity indium in advanced semiconductor devices, compound semiconductors, optoelectronics, photonics, and high-performance research applications.
Market Size & Forecast
- Global Market Value (2025): USD 818.99 Million
- Expected Market Value (2033): USD 1,841.94 Million
- Forecast CAGR (2026–2033): 10.79%
- Leading Region in 2025: Asia-Pacific
- Fastest Growing Region: Asia-Pacific
Report Scope and Indium Market Segmentation
|
Attributes |
Indium Key Market Insights |
|
Segments Covered |
· By Product Type: Ingots, Granules/Shots, Powder, Foil, Wire, Pellets, Paste, Sputtering Targets, Evaporation Materials, Solder Preforms, Ribbons, and Others · By Material Composition: Pure Indium Metal, Indium Alloys, Indium Compounds, and Others · By Purity Grade: (3N (99.9%), 4N (99.99%), 5N (99.999%), 6N (99.9999%), 7N (99.99999%), and Others · By Extraction Source: Primary Production and Secondary Production · By Distribution Channel: Direct Sales and Distributors & Traders · By Technology Platform: Indium Tin Oxide (ITO) Technology, CIGS Photovoltaic Technology, III-V Compound Semiconductor Technology, Low-Temperature Solder Technology, Thermal Management Material Technology, and Others · By End-User Industry: Consumer Electronics Industry, Semiconductor Industry, Display Panel Industry, Solar Photovoltaic Industry, Automotive Industry, Aerospace & Defense Industry, Optical & Photonics Industry, Medical Device Industry, Telecommunication Equipment Industry, Industrial Equipment Manufacturing, and Others |
|
Countries Covered |
North America · U.S. · Canada · Mexico Europe · France · Germany · Russia · Italy · Spain · Turkey · U.K. · Netherlands · Denmark · Switzerland · Belgium · Sweden · Norway · Finland · Rest Of Europe Asia-Pacific · China · India · Japan · Australia · South Korea · Indonesia · Thailand · Taiwan · Singapore · New Zealand · Malaysia · Philippines · Hong Kong · Rest of Asia-Pacific South America · Brazil · Argentina · Colombia · Peru · Chile · Ecuador · Venezuela · Bolivia · Uruguay · Paraguay · Rest of South America Middle East and Africa · South Africa · Egypt · Saudi Arabia · United Arab Emirates · Israel · Bahrain · Kuwait · Oman · Qatar · Rest of Middle East & Africa |
|
Key Market Players |
· Nyrstar NV (Belgium) · Umicore (Belgium) · Indium Wire Extrusion (U.S.) · Virgin Engineers (India) · Teck Resources Limited (Canada) · Vital Materials Co., Ltd. (China) · Yunnan Tin Company Group Limited (China) · Zhuzhou Keneng New Material Co., Ltd. (China) · Mitsubishi Materials Corporation (Japan) · Korea Zinc Co., Ltd. (South Korea) · 5N Plus Inc (Canada) · Guangxi Debang Technology Co., Ltd. (China) · Indium Corporation (U.S.) · American Elements (U.S.) · Jaytee (India) |
|
Market Opportunities |
· Rising Demand In 5G and Telecommunication Infrastructure · Advancements In Recycling Technologies · Emerging Applications in Medical Devices and Photonics. |
|
Value Added Data Infosets |
In addition to the insights on market scenarios such as market value, growth rate, segmentation, geographical coverage, and major players, the market reports curated by the Data Bridge Market Research also include import export analysis, production capacity overview, production consumption analysis, price trend analysis, climate change scenario, supply chain analysis, value chain analysis, raw material/consumables overview, vendor selection criteria, PESTLE Analysis, Porter Analysis, and regulatory framework. |
Indium Market Trends
Trend: Rising demand from display technologies
Indium plays an essential role in the production of indium tin oxide (ITO), a transparent conductive material widely used in LCD, OLED, touchscreen, and flexible display panels. The rapid expansion of consumer electronics, including smartphones, tablets, laptops, and advanced television systems, has significantly increased the consumption of high-performance display components. Continuous innovation in display quality, such as higher resolution, energy efficiency, and thinner screens, has further accelerated the reliance on indium-based materials. The growing penetration of smart devices and next-generation display technologies is strengthening indium demand, thereby acting as a strong driver for the growth of the Indium Market.
For instance, in June 2025, according to Omdia, global OLED panel revenues were projected to reach USD 53 billion, supported by strong demand for smartphones, laptops, and other consumer electronics. The growing adoption of OLED and advanced display technologies is increasing the use of indium tin oxide (ITO), thereby driving demand for indium in the global market
Indium Market Dynamics
Key Market Driver: Growth in semiconductor and optoelectronics industry
Indium is a critical material in III-V compound semiconductors, photodetectors, and high-speed optoelectronic devices due to its excellent electrical and thermal properties. Increasing demand for high-performance electronics, including LEDs, laser diodes, and infrared detectors, drives the consumption of high-purity indium grades, such as 5N and above. Continuous advancements in semiconductor fabrication and optoelectronic technologies, along with the rising deployment of 5G networks, data centers, and communication systems, further strengthen indium usage.
For instance, in Feburary 2026, as per the article published by Science Direct, Advanced waveguide designs using III-V materials like InAs and GaAs enable efficient single-mode light propagation in optoelectronic devices, improving performance in telecommunications, photonics, and integrated circuits. Such innovations in semiconductor and photonic components increase reliance on indium-based materials, driving demand and positioning the growth of the semiconductor and optoelectronics industry as a key driver for the Indium Market
Key Restraint/Challenge: Limited availability and supply constraints
Indium is not produced through primary mining but is predominantly recovered as a by-product of zinc ore processing, which creates a strong dependency on zinc production cycles. This indirect extraction process restricts the scalability of indium supply, even as demand rises across key industries such as consumer electronics, semiconductors, and solar photovoltaics. Variability in zinc mining output, along with declining ore quality in certain regions, further impacts the consistent availability of indium. In addition, the recovery of indium involves complex and costly refining processes, which limit efficient supply expansion.
For instance, In Feburary 2026, as per the article published by Global Banking and Finance, indium prices surged to decade highs (USD500–USD600/kg) due to Chinese market speculation and tightening supply, with China and South Korea controlling the majority of global production. The metal’s recovery as a byproduct of zinc and limited export volumes highlight inelastic supply, making price volatility and scarcity a key restraint on the growth of the Indium Market
Key Market Opportunity: Rising Demand in 5g and Telecommunication Infrastructure
The rapid deployment of 5G networks, optical fiber systems, and next-generation data centers is driving the need for high-performance radio frequency (RF) components, optical transceivers, and photonic devices, all of which rely on indium-based materials for superior electrical and thermal properties. Indium compounds, such as indium phosphide (InP) and indium gallium arsenide (InGaAs), are essential in high-speed communication devices due to their efficiency, reliability, and ability to handle high-frequency signals.
In Feburary 2024, as published by Science Direct, Indium Phosphide (InP), with electronic properties comparable to gallium arsenide (GaAs), is increasingly being explored for high-speed electronic devices in 5G networks and advanced telecommunication infrastructure. Its superior carrier mobility and frequency performance make it ideal for next-generation wireless communication systems. The growing adoption of InP in 5G and telecom applications acts as a key opportunity for the Indium Market.
Indium Market Scope
The Indium Market is segmented into seven notable segments based on product type, material composition, purity grade, extraction source, distribution channel, technology platform, and end-user industry.
By Product Type
On the basis of product type, the indium market is segmented into ingots, granules/shots, powder, foil, wire, pellets, paste, sputtering targets, evaporation materials, solder preforms, ribbons, and others. The ingots segment is further segmented into high-purity ingots and standard-purity ingots. The Sputtering Targets segment is expected to dominate the market with share of 28.22% in 2025, due to its critical role in indium tin oxide (ITO) deposition for flat panel displays, touchscreens, and advanced electronics, where high material utilization efficiency and thin-film uniformity are essential.
Sputtering targets are projected to be the fastest-growing segment with CAGR 12.2% due to rising demand in semiconductor manufacturing and advanced display technologies, where they are essential for thin-film deposition processes. Growth is further driven by expanding applications in solar panels, flat-panel displays, and electronics, requiring high-purity indium-based materials for enhanced performance and efficiency.
By Material Composition
On the basis of material composition, the indium market is segmented into pure indium metal, indium alloys, indium compounds, and others. The indium alloys segment is further segmented into indium–tin alloy, indium–gallium alloy, indium–silver alloy, indium–lead alloy, indium–bismuth alloy, and indium–zinc alloy. The indium compounds segment is further segmented into indium oxide, indium phosphide, indium nitride, indium arsenide, indium sulfide, and indium chloride. The Pure Indium Metal segment is expected to dominate the market with 52.78% market share in 2025, due to its widespread use as a base material for ITO production, solder applications, and compound synthesis, supported by strong demand from display panels and semiconductor manufacturing.
Indium compounds are projected to be the fastest-growing segment with a CAGR of 11.3%, driven by rising demand in advanced electronics, particularly in semiconductors, display technologies, and optoelectronic applications such as LEDs and LCDs. Additionally, increasing adoption in renewable energy applications, including thin-film solar cells, is further accelerating growth due to their superior conductivity and efficiency properties.
By Purity Grade
On the basis of purity grade, the indium market is segmented into 3N (99.9%), 4N (99.99%), 5N (99.999%), 6N (99.9999%), 7N (99.99999%), and others (ultra-high purity grades). The 4N (99.99%) segment is expected to dominate the market with 25.20% with share in 2025, due to its optimal balance between cost and performance, making it suitable for large-scale applications such as ITO coatings, solders, and general electronic component.
The 6N (99.9999%) indium segment is projected to be the fastest-growing, with a CAGR of 11.4%, driven by rising demand for ultra-high purity materials in advanced semiconductors, aerospace electronics, and optoelectronic applications. Its growth is further supported by increasing adoption in next-generation technologies such as 5G infrastructure, high-performance computing, and precision thin-film coatings, where superior material purity is critical for performance and reliability.
By Extraction Source
On the basis of extraction source, the indium market is segmented into primary production and secondary production. The primary production segment is further segmented into zinc ore processing and others, while the secondary production segment is further segmented into recycling and others. The Primary Production segment is expected to dominate the market with 54.14% share in 2025, due to the dependence of global indium supply on zinc ore processing, where indium is recovered as a by-product, ensuring higher volume availability compared to secondary source.
The secondary production segment is projected to be the fastest-growing segment with a CAGR of 11.57% in the indium market, driven by the increasing emphasis on recycling and resource efficiency amid limited primary indium reserves. Rising demand from electronics, semiconductors, and solar industries has accelerated the recovery of indium from scrap materials, making secondary production a cost-effective and sustainable supply source.
By Distribution Channel
On the basis of distribution channel, the indium market is segmented into direct sales and distributors & traders. The Direct Sales segment is expected to dominate the market with 65.91% share in 2025, due to long-term supply agreements between indium refiners and major electronics, semiconductor, and display manufacturers requiring consistent purity, traceability, and supply security.
The direct sales segment is projected to be the fastest-growing segment with a notable CAGR of 11.1% in the indium market, driven by increasing preference for direct procurement from manufacturers to ensure quality assurance, pricing transparency, and supply chain reliability. Additionally, growing demand from high-tech industries such as semiconductors, electronics, and renewable energy is encouraging end-users to establish direct relationships with suppliers for customized solutions and consistent material availability.
By Technology Platform
On the basis of technology platform, the indium market is segmented into indium tin oxide (ITO) technology, CIGS photovoltaic technology, III-V compound semiconductor technology, low-temperature solder technology, thermal management material technology, and others. The Indium Tin Oxide (ITO) Technology segment is expected to dominate the makret with share of 59.05% in 2025, due to its essential role as a transparent conductive material in LCD, OLED, and touchscreen devices, which continue to drive the majority of indium consumption globally.
The indium tin oxide (ITO) technology segment is projected to be the fastest-growing segment with a notable CAGR of 11.1% in the indium market, driven by its extensive use in touchscreens, flat-panel displays, and advanced electronic devices requiring transparent conductive coatings. Rising demand for consumer electronics, smart devices, and next-generation display technologies is further accelerating the adoption of ITO, supporting its rapid market expansion.
By End-User Industry
On the basis of end-user industry, the Indium Market is segmented into consumer electronics industry, semiconductor industry, display panel industry, solar photovoltaic industry, automotive industry, aerospace & defense industry, optical & photonics industry, medical device industry, telecommunication equipment industry, industrial equipment manufacturing, and others. The Consumer Electronics Industry segment is expected to dominate the Market with share of 38.44% in 2025, due to high consumption of indium in display technologies (LCD, OLED, micro-LED), touch panels, and next-generation electronic devices requiring transparent conductive coatings
The solar photovoltaic industry sales segment is projected to be the fastest-growing in the indium market, with a CAGR of 11.8%, driven by the rising adoption of thin-film solar technologies such as CIGS, where indium is a critical component for enhancing energy conversion efficiency. Additionally, increasing global investments in renewable energy and government incentives for solar power deployment are accelerating demand for indium in high-performance photovoltaic applications.
Indium Market Regional Analysis
- The Asia-Pacific is a key contributor to the Indium Market, accounting for the largest revenue share of 51.87% in 2026, supported by strong industrial growth, rising electric vehicle production, expansion of renewable energy projects, and significant investments in digital infrastructure, all of which drive the demand for indium-based materials in advanced technologies.
- North America is expected to be the fastest-growing market in the Global indium sector, registering a CAGR of 10.9% during the forecast period. Increasing adoption of smart grids, energy-efficient systems, and high-capacity data centers across Canada is accelerating indium demand, further supported by growing internet penetration and rapid industrial automation across the region.
- Ongoing modernization of manufacturing, automotive, and telecommunications infrastructure across Global is strengthening the need for high-performance electronic materials, where indium plays a critical role in ensuring efficient power distribution, semiconductor applications, and next-generation electronic devices.
Asia-Pacific Indium Market
Asia-Pacific is projected to account for a significant share of the Indium Market in 2025, supported by strong electronics manufacturing capabilities, rapid expansion of display panel production, and increasing demand for renewable energy technologies. Growth in the region is driven by rising consumption of indium tin oxide (ITO) in LCD, OLED, and touchscreen devices, along with growing solar photovoltaic installations. Countries across the region are heavily investing in semiconductor manufacturing, advanced materials, and clean energy infrastructure, which continues to boost indium demand. Additionally, increasing focus on high-performance electronics, 5G deployment, and digitalization further strengthens market penetration across Asia-Pacific.
China Indium Market Insight
China plays a dominant role in the indium market, primarily because indium is produced there as a by-product of zinc refining. The country is a key supplier to industries such as electronics, where indium is used in display panels, semiconductors, and solar technologies. Its market is shaped by steady industrial demand and strong domestic processing capabilities. In recent years, government policies and export controls have increased the strategic importance of indium. As a result, China significantly influences global supply dynamics and pricing trends.
India Indium Market Insight
The India indium market is witnessing steady growth, driven by increasing adoption of advanced technologies such as smart grids, energy-efficient systems, and high-capacity data centers. Rising demand for semiconductors, display technologies, and renewable energy solutions is further supporting market expansion. Additionally, growing industrial automation and digital transformation across sectors are enhancing the need for high-performance materials like indium. Government initiatives promoting clean energy and technological innovation are also playing a crucial role in strengthening Canada’s position in the regional indium market.
North America Indium Market Insight
The North America indium market is expected to witness steady growth over the forecast period, driven by strong demand from semiconductor, aerospace, and renewable energy industries. The region benefits from advanced research capabilities, high adoption of next-generation electronics, and increasing investments in domestic semiconductor manufacturing. Growing emphasis on supply chain resilience, critical mineral sourcing, and sustainable energy solutions further supports indium demand, particularly in photovoltaic and advanced electronics applications.
U.S. Indium Market Insight
The U.S. indium market accounted for the largest revenue share within North America in 2025, supported by strong demand from semiconductor manufacturing, defense electronics, and high-performance computing applications. Increasing use of indium in compound semiconductors, thermal interface materials, and advanced coatings is driving market growth. Additionally, government initiatives aimed at strengthening domestic chip production and reducing reliance on imports are further boosting demand for indium-based materials.
Canada Indium Market Insight
The Canada indium market is expected to grow steadily over the forecast period, supported by increasing focus on critical mineral development, clean energy technologies, and advanced materials research. Canada’s emphasis on sustainable mining practices and resource security is encouraging exploration and production of indium as a by-product of zinc refining. Additionally, rising demand for photovoltaic systems and electronics contributes to steady market expansion.
Europe Indium Market Insight
The European indium market is projected to grow at a healthy CAGR over the forecast period, driven by strong demand for renewable energy, advanced electronics, and sustainable material solutions. Increasing investments in solar power, electric vehicles, and semiconductor technologies are boosting indium consumption across the region. Additionally, strict environmental regulations and focus on circular economy practices are encouraging recycling and efficient utilization of indium resources.
U.K. Indium Market Insight
The U.K. indium market is expected to register notable growth during the forecast period, supported by increasing investments in advanced electronics, clean energy, and research-driven innovation. Rising adoption of photovoltaic systems and growing demand for high-performance electronic components are key growth drivers. Furthermore, government support for critical minerals and sustainable technology development continues to stimulate indium market expansion.
Germany Indium Market Insight
The Germany indium market is anticipated to expand at a considerable CAGR throughout the forecast period, driven by strong demand from automotive electronics, renewable energy, and industrial manufacturing sectors. Germany’s leadership in precision engineering, semiconductor innovation, and energy transition initiatives supports increased adoption of indium-based materials. Additionally, integration of indium in photovoltaic systems and advanced electronic components reinforces Germany’s position as a key market within Europe.
Indium Market Share
The indium industry is primarily led by well-established companies, including:
- Nyrstar NV (Belgium)
- Umicore (Belgium)
- Indium Wire Extrusion (U.S.)
- Virgin Engineers (India)
- Teck Resources Limited (Canada)
- Vital Materials Co., Ltd. (China)
- Yunnan Tin Company Group Limited (China)
- Zhuzhou Keneng New Material Co., Ltd. (China)
- Mitsubishi Materials Corporation (Japan)
- Korea Zinc Co., Ltd. (South Korea)
- 5N Plus Inc (Canada)
- Guangxi Debang Technology Co., Ltd. (China)
- Indium Corporation (U.S.)
- American Elements (U.S.)
- Jaytee (India)
Latest Developments in Indium Market
- In December 2025, Korea Zinc has entered a strategic partnership with the U.S. Department of War and the U.S. Department of Commerce to build a state-of-the-art critical minerals smelter in Clarksville, Tennessee, involving approximately $6.6 Million in capital expenditures as part of a total USD7.4 million investment. The facility will produce 13 non-ferrous metals most designated as critical minerals strengthening supply chain diversification and supporting advanced industries, with phased operations expected to begin by 2029.
- In February 2026, Indium Corporation will showcase its high-reliability liquid metal thermal interface materials (TIMs) and advanced metal TIM products at SEMI-THERM 2026 in San Jose, highlighting solutions designed for superior heat dissipation and enhanced reliability in power-dense electronic applications. This exposure at a major industry event strengthens Indium Corporation’s position in the market.
- In December 2025, Teck Resources and Anglo American have received approval from the Government of Canada under the Investment Canada Act for their planned “merger of equals.” The regulatory approval is a major milestone in creating a combined mining company that will operate globally as a critical minerals leader. As part of the merger, the companies outlined binding commitments that include Millions of dollars in investment in Canada over the coming years, including support for projects such as the Highland Valley Copper mine life extension and other future developments.
- In January 2025, 5N Plus Inc. announced that it was awarded a US$18.1 million grant by the U.S. Government to significantly increase capacity to recycle and refine high-purity germanium at its St. George, Utah facility. While this the expanded refining and recycling capability supports high-purity metals production overall.
- In February 2023, American Elements has launched a dedicated Fusion Energy Division, expanding production of ultra-high-purity oxides, stable isotopes, refractory metals, high-temperature ceramics and other advanced materials to support fusion energy research and scaled production for partners in the field. This new division is focused on supplying materials with extremely low trace impurities required for tokamaks and other fusion reaction assemblie.
SKU-

- Interactive Data Analysis Dashboard
- Company Analysis Dashboard for high growth potential opportunities
- Research Analyst Access for customization & queries
- Competitor Analysis with Interactive dashboard
- Latest News, Updates & Trend analysis
- Harness the Power of Benchmark Analysis for Comprehensive Competitor Tracking
Table of Content
1 INTRODUCTION
1.1 OBJECTIVES OF THE STUDY
1.2 MARKET DEFINITION
1.3 OVERVIEW OF GLOBAL INDIUM MARKET
1.4 CURRENCY AND PRICING
1.5 LIMITATIONS
1.6 MARKETS COVERED
2 MARKET SEGMENTATION
2.1 MARKETS COVERED
2.2 GEOGRAPHICAL SCOPE
2.3 YEARS CONSIDERED FOR THE STUDY
2.4 DBMR TRIPOD DATA VALIDATION MODEL
2.5 PRIMARY INTERVIEWS WITH KEY OPINION LEADERS
2.6 DBMR MARKET POSITION GRID
2.7 VENDOR SHARE ANALYSIS
2.8 MULTIVARIATE MODELING
2.9 PRODUCT TYPE TIMELINE CURVE
2.1 MARKET APPLICATION COVERAGE GRID
2.11 SECONDARY SOURCES
2.12 ASSUMPTIONS
3 EXECUTIVE SUMMARY
4 PREMIUM INSIGHTS
4.1 PORTER’S FIVE FROCES
4.2 PATENT ANALYSIS
4.2.1 PATENT QUALITY AND STRENGTH
4.2.2 PATENT FAMILIES
4.2.3 LICENSING AND COLLABORATIONS
4.2.4 REGIONAL PATENT LANDSCAPE
4.2.5 IP STRATEGY AND MANAGEMENT
4.2.6 CONCLUSION
4.3 COST ANALYSIS BREAKDOWN
4.3.1 INDIUM COST STRUCTURE
4.3.2 DIRECT LABOR AND WORKFORCE COSTS
4.3.3 MANUFACTURING OVERHEAD AND FACILITY COSTS
4.3.4 LOGISTICS, TRANSPORTATION, AND SUPPLY CHAIN COSTS
4.3.5 IMPACT OF GEOPOLITICAL CONFLICTS AND WAR ON COST STRUCTURE
4.3.6 CONCLUSION
4.4 PROFIT MARGINS SCENARIO
4.4.1 UPSTREAM PRODUCTION ECONOMICS AND RAW MATERIAL DEPENDENCY
4.4.2 REFINING AND PURIFICATION MARGIN STRUCTURE
4.4.3 DOWNSTREAM MANUFACTURING AND VALUE-ADDED MARGINS
4.4.4 IMPACT OF RECYCLING ON PROFIT MARGINS
4.4.5 PRICE VOLATILITY AND MARKET CYCLICALITY
4.4.6 GEOPOLITICAL CONFLICTS AND WAR IMPACT ON PROFIT MARGINS
4.4.7 FUTURE PROFIT MARGIN OUTLOOK
4.5 INNOVATION TRACKER AND STRATEGIC ANALYSIS
4.5.1 MAJOR DEALS AND STRATEGIC ALLIANCES ANALYSIS
4.5.2 JOINT VENTURES
4.5.3 MERGERS AND ACQUISITIONS
4.5.4 LICENSING AND PARTNERSHIP
4.5.5 TECHNOLOGY COLLABORATIONS
4.5.6 STRATEGIC DIVESTMENTS
4.5.7 NUMBER OF PRODUCTS IN DEVELOPMENT
4.5.8 STAGE OF DEVELOPMENT
4.5.9 TIMELINES AND MILESTONES
4.5.10 INNOVATION STRATEGIES AND METHODOLOGIES
4.5.11 RISK ASSESSMENT AND MITIGATION
4.5.12 FUTURE OUTLOOK
4.6 PRICING ANALYSIS
4.7 SUPPLY CHAIN ANALYSIS
4.7.1 OVERVIEW:
4.7.2 MINING & EXTRACTION:
4.7.3 REFINING & PROCESSING:
4.7.4 MANUFACTURING APPLICATIONS:
4.7.5 DISTRIBUTION & LOGISTICS:
4.7.6 END-USERS / OEMS:
4.7.7 CONCLUSION:
4.8 CLIMATE CHANGE SCENARIO
4.8.1 ENVIRONMENTAL CONCERNS
4.8.1.1 AIR POLLUTION:
4.8.1.2 WATER POLLUTION:
4.8.1.3 SOIL CONTAMINATION:
4.8.1.4 WASTE MANAGEMENT:
4.8.1.5 ENERGY CONSUMPTION AND CLIMATE IMPACT:
4.8.1.6 NOISE POLLUTION:
4.8.1.7 DEFORESTATION AND LAND USE:
4.8.1.8 REGULATORY CHALLENGES:
4.8.1.9 IMPACT OF THE IRAN WAR ON CLIMATE CHANGE AND THE INDIUM MARKET:
4.8.2 INDUSTRY RESPONSE
4.8.2.1 ADOPTION OF CLEANER TECHNOLOGIES:
4.8.2.2 WASTE MANAGEMENT AND RECYCLING INITIATIVES:
4.8.2.3 WATER CONSERVATION AND TREATMENT:
4.8.2.4 ENERGY EFFICIENCY AND RENEWABLE ENERGY ADOPTION:
4.8.2.5 NOISE AND ENVIRONMENTAL MONITORING:
4.8.2.6 SUSTAINABLE LAND USE AND REFORESTATION EFFORTS:
4.8.2.7 CORPORATE SOCIAL RESPONSIBILITY (CSR) AND COMMUNITY ENGAGEMENT:
4.8.2.8 COMPLIANCE AND REGULATORY ALIGNMENT:
4.8.3 GOVERNMENT’S ROLE
4.8.3.1 FORMULATION OF ENVIRONMENTAL POLICIES AND REGULATIONS:
4.8.3.2 MONITORING AND ENFORCEMENT:
4.8.3.3 PROMOTION OF SUSTAINABLE PRACTICES:
4.8.3.4 PUBLIC AWARENESS AND EDUCATION:
4.8.3.5 INFRASTRUCTURE AND SUPPORT FOR ENVIRONMENTAL MANAGEMENT:
4.8.3.6 COLLABORATION WITH INTERNATIONAL ORGANIZATIONS:
4.8.3.7 RESEARCH AND DEVELOPMENT SUPPORT:
4.8.4 ANALYST RECOMMENDATIONS
4.9 INDUSTRY ECOSYSTEM ANALYSIS
4.9.1 PROMINENT COMPANIES
4.9.2 SMALL & MEDIUM SIZE COMPANIES
4.9.3 END USERS
4.1 RAW MATERIAL COVERAGE
4.10.1 ZINC ORES (PRIMARY RAW MATERIAL SOURCE)
4.10.2 COPPER ORES (SECONDARY ASSOCIATED SOURCE)
4.10.3 LEAD AND TIN ORES (MINOR BY-PRODUCT SOURCES)
4.10.4 METALLURGICAL RESIDUES AND BY-PRODUCTS
4.10.5 SECONDARY SOURCES (RECYCLING AND E-WASTE)
4.10.6 MINE TAILINGS AND HISTORICAL WASTE DEPOSITS
4.11 TECHNOLOGICAL ADVANCEMENTS
4.11.1 ADVANCED REFINING TECHNIQUES FOR ULTRA-HIGH PURITY INDIUM
4.11.2 INNOVATIONS IN INDIUM TIN OXIDE (ITO) COATING TECHNOLOGIES
4.11.3 DEVELOPMENT OF INDIUM-BASED COMPOUND SEMICONDUCTORS
4.11.4 ADVANCEMENTS IN RECYCLING AND RECOVERY TECHNOLOGIES
4.11.5 EMERGENCE OF FLEXIBLE AND PRINTED ELECTRONICS
4.11.6 IMPROVED THERMAL INTERFACE MATERIALS (TIMS)
4.11.7 DEVELOPMENT OF CIGS THIN-FILM SOLAR TECHNOLOGIES
4.11.8 PRECISION MANUFACTURING OF SPUTTERING TARGETS AND SPECIALTY FORMS
4.12 VENDOR SELECTION CRITERIA –
4.12.1 PRODUCT QUALITY AND PURITY COMPLIANCE
4.12.2 COST COMPETITIVENESS AND TOTAL COST OF OWNERSHIP
4.12.3 SUPPLY RELIABILITY AND DELIVERY PERFORMANCE
4.12.4 TECHNICAL CAPABILITY AND PROCESSING EXPERTISE
4.12.5 FINANCIAL STABILITY AND BUSINESS CONTINUITY
4.12.6 REGULATORY COMPLIANCE AND ENVIRONMENTAL STANDARDS
4.12.7 SUPPLIER REPUTATION AND INDUSTRY EXPERIENCE
4.12.8 INNOVATION AND R&D CAPABILITIES
4.12.9 RISK MANAGEMENT AND SUPPLY CHAIN RESILIENCE
4.12.10 FLEXIBILITY AND CUSTOMIZATION CAPABILITIES
5 TARIFFS & IMPACT ON THE MARKET
5.1 CURRENT TARIFF RATE(S) IN TOP-5 COUNTRY MARKETS
5.2 OUTLOOK: LOCAL PRODUCTION V/S IMPORT RELIANCE
5.3 VENDOR SELECTION CRITERIA DYNAMICS
5.4 IMPACT OF SUPPLY CHAIN
5.4.1 RAW MATERIAL PROCUREMENT
5.4.2 MANUFACTURING AND PRODUCTION
5.4.3 LOGISTICS AND DISTRIBUTION
5.4.4 PRICE PITCHING AND POSITION OF MARKET
5.5 INDUSTRY PARTICIPANTS: PROACTIVE MOVES
5.5.1 SUPPLY CHAIN OPTIMIZATION
5.5.2 JOINT VENTURE ESTABLISHMENTS
5.6 IMPACT ON PRICES
5.7 REGULATORY INCLINATION
5.7.1 GEOPOLITICAL SITUATION
5.7.2 TRADE PARTNERSHIPS BETWEEN COUNTRIES
5.7.2.1 FREE TRADE AGREEMENTS
5.7.2.2 ALLIANCES ESTABLISHMENTS
5.7.3 STATUS ACCREDITATION (INCLUDING MFN)
5.7.4 DOMESTIC COURSE OF CORRECTION
5.7.4.1 INCENTIVE SCHEMES TO BOOST PRODUCTION OUTPUTS
5.7.4.2 ESTABLISHMENT OF SEZS / INDUSTRIAL PARKS
6 REGULATION COVERAGE
6.1 PRODUCT CODES
6.2 CERTIFIED STANDARDS
6.2.1 ASTM B32:
6.2.2 ASTM B1002-16(2020):
6.2.3 ASTM B1002-16(2025):
6.2.4 ISO 9001:2015:
6.2.5 ROHS:
6.2.6 REACH:
6.3 SAFETY STANDARDS
6.3.1 MATERIAL HANDLING & STORAGE
6.3.2 TRANSPORT & PRECAUTIONS
6.3.3 HAZARD IDENTIFICATION
7 MARKET OVERVIEW
7.1 DRIVER
7.1.1 RISING DEMAND FROM DISPLAY TECHNOLOGIES
7.1.2 GROWTH IN SEMICONDUCTOR AND OPTOELECTRONICS INDUSTRY
7.1.3 INCREASING ADOPTION OF SOLAR PHOTOVOLTAIC TECHNOLOGIES
7.1.4 ADVANCEMENTS IN AUTOMOTIVE ELECTRONICS AND ADAS
7.2 RESTRAINTS
7.2.1 LIMITED AVAILABILITY AND SUPPLY CONSTRAINTS
7.2.2 AVAILABILITY OF SUBSTITUTE MATERIALS
7.3 OPPORTUNITY
7.3.1 RISING DEMAND IN 5G AND TELECOMMUNICATION INFRASTRUCTURE
7.3.2 ADVANCEMENTS IN RECYCLING TECHNOLOGIES
7.3.3 EMERGING APPLICATIONS IN MEDICAL DEVICES AND PHOTONICS
7.4 CHALLENGES
7.4.1 HAZARDOUS NATURE AND HEALTH RISKS ASSOCIATED WITH INDIUM
7.4.2 EXPORT RESTRICTIONS AND TRADE BARRIERS
8 GLOBAL INDIUM MARKET, BY PRODUCT TYPE
8.1 OVERVIEW
8.2 GLOBAL INDIUM MARKET, BY PRODUCT TYPE, 2018-2033 (USD THOUSAND)
8.2.1 SPUTTERING TARGETS
8.2.2 INGOTS
8.2.3 EVAPORATION MATERIALS
8.2.4 PASTE
8.2.5 GRANULES / SHOTS
8.2.6 SOLDER PREFORMS
8.2.7 POWDER
8.2.8 FOIL
8.2.9 PELLETS
8.2.10 WIRE
8.2.11 RIBBONS
8.2.12 OTHERS
8.3 SPUTTERING TARGETS IN GLOBAL INDIUM MARKET, BY REGION, 2018-2033 (USD THOUSAND)
8.3.1 ASIA-PACIFIC
8.3.2 NORTH AMERICA
8.3.3 EUROPE
8.3.4 SOUTH AMERICA
8.3.5 MIDDLE EAST AND AFRICA
8.4 GLOBAL INGOTS IN INDIUM MARKET, BY TYPE, 2018-2033 (USD THOUSAND)
8.4.1 HIGH-PURITY INGOTS
8.4.2 STANDARD-PURITY INGOTS
8.5 INGOTS IN GLOBAL INDIUM MARKET, BY REGION, 2018-2033 (USD THOUSAND)
8.5.1 ASIA-PACIFIC
8.5.2 NORTH AMERICA
8.5.3 EUROPE
8.5.4 SOUTH AMERICA
8.5.5 MIDDLE EAST AND AFRICA
8.6 EVAPORATION MATERIALS IN GLOBAL INDIUM MARKET, BY REGION, 2018-2033 (USD THOUSAND)
8.6.1 ASIA-PACIFIC
8.6.2 NORTH AMERICA
8.6.3 EUROPE
8.6.4 SOUTH AMERICA
8.6.5 MIDDLE EAST AND AFRICA
8.7 PASTE IN GLOBAL INDIUM MARKET, BY REGION, 2018-2033 (USD THOUSAND)
8.7.1 ASIA-PACIFIC
8.7.2 NORTH AMERICA
8.7.3 EUROPE
8.7.4 SOUTH AMERICA
8.7.5 MIDDLE EAST AND AFRICA
8.8 GRANULES / SHOTS IN GLOBAL INDIUM MARKET, BY REGION, 2018-2033 (USD THOUSAND)
8.8.1 ASIA-PACIFIC
8.8.2 NORTH AMERICA
8.8.3 EUROPE
8.8.4 SOUTH AMERICA
8.8.5 MIDDLE EAST AND AFRICA
8.9 SOLDER PREFORMS IN GLOBAL INDIUM MARKET, BY REGION, 2018-2033 (USD THOUSAND)
8.9.1 ASIA-PACIFIC
8.9.2 NORTH AMERICA
8.9.3 EUROPE
8.9.4 SOUTH AMERICA
8.9.5 MIDDLE EAST AND AFRICA
8.1 POWDER IN GLOBAL INDIUM MARKET, BY REGION, 2018-2033 (USD THOUSAND)
8.10.1 ASIA-PACIFIC
8.10.2 NORTH AMERICA
8.10.3 EUROPE
8.10.4 SOUTH AMERICA
8.10.5 MIDDLE EAST AND AFRICA
8.11 FOIL IN GLOBAL INDIUM MARKET, BY REGION, 2018-2033 (USD THOUSAND)
8.11.1 ASIA-PACIFIC
8.11.2 NORTH AMERICA
8.11.3 EUROPE
8.11.4 SOUTH AMERICA
8.11.5 MIDDLE EAST AND AFRICA
8.12 PELLETS IN GLOBAL INDIUM MARKET, BY REGION, 2018-2033 (USD THOUSAND)
8.12.1 ASIA-PACIFIC
8.12.2 NORTH AMERICA
8.12.3 EUROPE
8.12.4 SOUTH AMERICA
8.12.5 MIDDLE EAST AND AFRICA
8.13 WIRE IN GLOBAL INDIUM MARKET, BY REGION, 2018-2033 (USD THOUSAND)
8.13.1 ASIA-PACIFIC
8.13.2 NORTH AMERICA
8.13.3 EUROPE
8.13.4 SOUTH AMERICA
8.13.5 MIDDLE EAST AND AFRICA
8.14 RIBBONS IN GLOBAL INDIUM MARKET, BY REGION, 2018-2033 (USD THOUSAND)
8.14.1 ASIA-PACIFIC
8.14.2 NORTH AMERICA
8.14.3 EUROPE
8.14.4 SOUTH AMERICA
8.14.5 MIDDLE EAST AND AFRICA
8.15 OTHERS IN GLOBAL INDIUM MARKET, BY REGION, 2018-2033 (USD THOUSAND)
8.15.1 ASIA-PACIFIC
8.15.2 NORTH AMERICA
8.15.3 EUROPE
8.15.4 SOUTH AMERICA
8.15.5 MIDDLE EAST AND AFRICA
9 GLOBAL INDIUM MARKET, BY MATERIAL COMPOSITION
9.1 OVERVIEW
9.2 GLOBAL INDIUM MARKET, BY MATERIAL COMPOSITION, 2018-2033 (USD THOUSAND)
9.2.1 PURE INDIUM METAL
9.2.2 INDIUM ALLOYS
9.2.3 INDIUM COMPOUNDS
9.3 PURE INDIUM METAL IN GLOBAL INDIUM MARKET, BY REGION, 2018-2033 (USD THOUSAND)
9.3.1 ASIA-PACIFIC
9.3.2 NORTH AMERICA
9.3.3 EUROPE
9.3.4 SOUTH AMERICA
9.3.5 MIDDLE EAST AND AFRICA
9.4 GLOBAL INDIUM ALLOYS IN INDIUM MARKET, BY TYPE, 2018-2033 (USD THOUSAND)
9.4.1 INDIUM–TIN ALLOY
9.4.2 INDIUM–GALLIUM ALLOY
9.4.3 INDIUM–BISMUTH ALLOY
9.4.4 INDIUM–SILVER ALLOY
9.4.5 INDIUM–LEAD ALLOY
9.4.6 INDIUM–ZINC ALLOY
9.5 INDIUM ALLOYS IN GLOBAL INDIUM MARKET, BY REGION, 2018-2033 (USD THOUSAND)
9.5.1 ASIA-PACIFIC
9.5.2 NORTH AMERICA
9.5.3 EUROPE
9.5.4 SOUTH AMERICA
9.5.5 MIDDLE EAST AND AFRICA
9.6 GLOBAL INDIUM COMPOUNDS IN INDIUM MARKET, BY TYPE, 2018-2033 (USD THOUSAND)
9.6.1 INDIUM OXIDE
9.6.2 INDIUM PHOSPHIDE
9.6.3 INDIUM ARSENIDE
9.6.4 INDIUM NITRIDE
9.6.5 INDIUM SULFIDE
9.6.6 INDIUM CHLORIDE
9.6.7 OTHERS
9.7 INDIUM COMPOUNDS IN GLOBAL INDIUM MARKET, BY REGION, 2018-2033 (USD THOUSAND)
9.7.1 ASIA-PACIFIC
9.7.2 NORTH AMERICA
9.7.3 EUROPE
9.7.4 SOUTH AMERICA
9.7.5 MIDDLE EAST AND AFRICA
10 GLOBAL INDIUM MARKET, BY PURITY GRADE
10.1 OVERVIEW
10.2 GLOBAL INDIUM MARKET, BY PURITY GRADE, 2018-2033 (USD THOUSAND)
10.2.1 4N (99.99%)
10.2.2 5N (99.999%)
10.2.3 3N (99.9%)
10.2.4 6N (99.9999%)
10.2.5 7N (99.99999%)
10.2.6 OTHERS
10.3 4N (99.99%) IN GLOBAL INDIUM MARKET, BY REGION, 2018-2033 (USD THOUSAND)
10.3.1 ASIA-PACIFIC
10.3.2 NORTH AMERICA
10.3.3 EUROPE
10.3.4 SOUTH AMERICA
10.3.5 MIDDLE EAST AND AFRICA
10.4 5N (99.999%) IN GLOBAL INDIUM MARKET, BY REGION, 2018-2033 (USD THOUSAND)
10.4.1 ASIA-PACIFIC
10.4.2 NORTH AMERICA
10.4.3 EUROPE
10.4.4 SOUTH AMERICA
10.4.5 MIDDLE EAST AND AFRICA
10.5 3N (99.9%) IN GLOBAL INDIUM MARKET, BY REGION, 2018-2033 (USD THOUSAND)
10.5.1 ASIA-PACIFIC
10.5.2 NORTH AMERICA
10.5.3 EUROPE
10.5.4 SOUTH AMERICA
10.5.5 MIDDLE EAST AND AFRICA
10.6 6N (99.9999%) IN GLOBAL INDIUM MARKET, BY REGION, 2018-2033 (USD THOUSAND)
10.6.1 ASIA-PACIFIC
10.6.2 NORTH AMERICA
10.6.3 EUROPE
10.6.4 SOUTH AMERICA
10.6.5 MIDDLE EAST AND AFRICA
10.7 7N (99.99999%) IN GLOBAL INDIUM MARKET, BY REGION, 2018-2033 (USD THOUSAND)
10.7.1 ASIA-PACIFIC
10.7.2 NORTH AMERICA
10.7.3 EUROPE
10.7.4 SOUTH AMERICA
10.7.5 MIDDLE EAST AND AFRICA
10.8 OTHERS IN GLOBAL INDIUM MARKET, BY REGION, 2018-2033 (USD THOUSAND)
10.8.1 ASIA-PACIFIC
10.8.2 NORTH AMERICA
10.8.3 EUROPE
10.8.4 SOUTH AMERICA
10.8.5 MIDDLE EAST AND AFRICA
11 GLOBAL INDIUM MARKET, BY EXTRACTION SOURCE
11.1 OVERVIEW
11.2 GLOBAL INDIUM MARKET, BY EXTRACTION SOURCE, 2018-2033 (USD THOUSAND)
11.2.1 PRIMARY PRODUCTION
11.2.2 SECONDARY PRODUCTION
11.3 GLOBAL PRIMARY PRODUCTION IN INDIUM MARKET, BY TYPE, 2018-2033 (USD THOUSAND)
11.3.1 ZINC ORE PROCESSING
11.3.2 OTHERS
11.4 PRIMARY PRODUCTION IN GLOBAL INDIUM MARKET, BY REGION, 2018-2033 (USD THOUSAND)
11.4.1 ASIA-PACIFIC
11.4.2 NORTH AMERICA
11.4.3 EUROPE
11.4.4 SOUTH AMERICA
11.4.5 MIDDLE EAST AND AFRICA
11.5 GLOBAL SECONDARY PRODUCTION IN INDIUM MARKET, BY TYPE, 2018-2033 (USD THOUSAND)
11.5.1 RECYCLING
11.5.2 OTHERS
11.6 SECONDARY PRODUCTION IN GLOBAL INDIUM MARKET, BY REGION, 2018-2033 (USD THOUSAND)
11.6.1 ASIA-PACIFIC
11.6.2 NORTH AMERICA
11.6.3 EUROPE
11.6.4 SOUTH AMERICA
11.6.5 MIDDLE EAST AND AFRICA
12 GLOBAL INDIUM MARKET, BY DISTRIBUTION CHANNEL
12.1 OVERVIEW
12.2 GLOBAL INDIUM MARKET, BY DISTRIBUTION CHANNEL, 2018-2033 (USD THOUSAND)
12.2.1 DIRECT SALES
12.2.2 DISTRIBUTORS & TRADERS
12.3 DIRECT SALES IN GLOBAL INDIUM MARKET, BY REGION, 2018-2033 (USD THOUSAND)
12.3.1 ASIA-PACIFIC
12.3.2 NORTH AMERICA
12.3.3 EUROPE
12.3.4 SOUTH AMERICA
12.3.5 MIDDLE EAST AND AFRICA
12.4 DISTRIBUTORS & TRADERS IN GLOBAL INDIUM MARKET, BY REGION, 2018-2033 (USD THOUSAND)
12.4.1 ASIA-PACIFIC
12.4.2 NORTH AMERICA
12.4.3 EUROPE
12.4.4 SOUTH AMERICA
12.4.5 MIDDLE EAST AND AFRICA
13 GLOBAL INDIUM MARKET, BY TECHNOLOGY PLATFORM
13.1 OVERVIEW
13.2 GLOBAL INDIUM MARKET, BY TECHNOLOGY PLATFORM, 2018-2033 (USD THOUSAND)
13.2.1 INDIUM TIN OXIDE (ITO) TECHNOLOGY
13.2.2 CIGS PHOTOVOLTAIC TECHNOLOGY
13.2.3 III-V COMPOUND SEMICONDUCTOR TECHNOLOGY
13.2.4 LOW-TEMPERATURE SOLDER TECHNOLOGY
13.2.5 THERMAL MANAGEMENT MATERIAL TECHNOLOGY
13.2.6 OTHERS
13.3 INDIUM TIN OXIDE (ITO) TECHNOLOGY IN GLOBAL INDIUM MARKET, BY REGION, 2018-2033 (USD THOUSAND)
13.3.1 ASIA-PACIFIC
13.3.2 NORTH AMERICA
13.3.3 EUROPE
13.3.4 SOUTH AMERICA
13.3.5 MIDDLE EAST AND AFRICA
13.4 CIGS PHOTOVOLTAIC TECHNOLOGY IN GLOBAL INDIUM MARKET, BY REGION, 2018-2033 (USD THOUSAND)
13.4.1 ASIA-PACIFIC
13.4.2 NORTH AMERICA
13.4.3 EUROPE
13.4.4 SOUTH AMERICA
13.4.5 MIDDLE EAST AND AFRICA
13.5 III-V COMPOUND SEMICONDUCTOR TECHNOLOGY IN GLOBAL INDIUM MARKET, BY REGION, 2018-2033 (USD THOUSAND)
13.5.1 ASIA-PACIFIC
13.5.2 NORTH AMERICA
13.5.3 EUROPE
13.5.4 SOUTH AMERICA
13.5.5 MIDDLE EAST AND AFRICA
13.6 LOW-TEMPERATURE SOLDER TECHNOLOGY IN GLOBAL INDIUM MARKET, BY REGION, 2018-2033 (USD THOUSAND)
13.6.1 ASIA-PACIFIC
13.6.2 NORTH AMERICA
13.6.3 EUROPE
13.6.4 SOUTH AMERICA
13.6.5 MIDDLE EAST AND AFRICA
13.7 THERMAL MANAGEMENT MATERIAL TECHNOLOGY IN GLOBAL INDIUM MARKET, BY REGION, 2018-2033 (USD THOUSAND)
13.7.1 ASIA-PACIFIC
13.7.2 NORTH AMERICA
13.7.3 EUROPE
13.7.4 SOUTH AMERICA
13.7.5 MIDDLE EAST AND AFRICA
13.8 OTHERS IN GLOBAL INDIUM MARKET, BY REGION, 2018-2033 (USD THOUSAND)
13.8.1 ASIA-PACIFIC
13.8.2 NORTH AMERICA
13.8.3 EUROPE
13.8.4 SOUTH AMERICA
13.8.5 MIDDLE EAST AND AFRICA
14 GLOBAL INDIUM MARKET, BY END-USER INDUSTRY
14.1 OVERVIEW
14.2 GLOBAL INDIUM MARKET, BY END-USER INDUSTRY, 2018-2033 (USD THOUSAND)
14.2.1 CONSUMER ELECTRONICS INDUSTRY
14.2.2 DISPLAY PANEL INDUSTRY
14.2.3 SEMICONDUCTOR INDUSTRY
14.2.4 SOLAR PHOTOVOLTAIC INDUSTRY
14.2.5 AUTOMOTIVE INDUSTRY
14.2.6 TELECOMMUNICATION EQUIPMENT INDUSTRY
14.2.7 OPTICAL & PHOTONICS INDUSTRY
14.2.8 AEROSPACE & DEFENSE INDUSTRY
14.2.9 MEDICAL DEVICE INDUSTRY
14.2.10 INDUSTRIAL EQUIPMENT MANUFACTURING
14.2.11 OTHERS
14.3 GLOBAL CONSUMER ELECTRONICS INDUSTRY IN INDIUM MARKET, BY TYPE, 2018-2033 (USD THOUSAND)
14.3.1 FLAT PANEL DISPLAYS (LCD/OLED/LED)
14.3.2 TRANSPARENT CONDUCTIVE COATINGS (ITO)
14.3.3 TOUCHSCREEN DISPLAYS
14.3.4 FLEXIBLE DISPLAYS & ELECTRONICS
14.3.5 WEARABLE ELECTRONICS DEVICES
14.3.6 CAMERA & OPTICAL SENSORS
14.3.7 MINI-LED BACKLIGHTING
14.3.8 MICRO-LED DISPLAYS
14.4 GLOBAL FLAT PANEL DISPLAYS (LCD/OLED/LED) IN INDIUM MARKET, BY PURITY GRADE, 2018-2033 (USD THOUSAND)
14.4.1 4N (99.99%)
14.4.2 5N (99.999%)
14.4.3 3N (99.9%)
14.4.4 6N (99.9999%)
14.4.5 7N (99.99999%)
14.4.6 OTHERS
14.5 GLOBAL TRANSPARENT CONDUCTIVE COATINGS (ITO) IN INDIUM MARKET, BY PURITY GRADE, 2018-2033 (USD THOUSAND)
14.5.1 4N (99.99%)
14.5.2 5N (99.999%)
14.5.3 3N (99.9%)
14.5.4 6N (99.9999%)
14.5.5 7N (99.99999%)
14.5.6 OTHERS
14.6 GLOBAL TOUCHSCREEN DISPLAYS IN INDIUM MARKET, BY PURITY GRADE, 2018-2033 (USD THOUSAND)
14.6.1 4N (99.99%)
14.6.2 5N (99.999%)
14.6.3 3N (99.9%)
14.6.4 6N (99.9999%)
14.6.5 7N (99.99999%)
14.6.6 OTHERS
14.7 GLOBAL FLEXIBLE DISPLAYS & ELECTRONICS IN INDIUM MARKET, BY PURITY GRADE, 2018-2033 (USD THOUSAND)
14.7.1 4N (99.99%)
14.7.2 5N (99.999%)
14.7.3 3N (99.9%)
14.7.4 6N (99.9999%)
14.7.5 7N (99.99999%)
14.7.6 OTHERS
14.8 GLOBAL WEARABLE ELECTRONICS DEVICES IN INDIUM MARKET, BY PURITY GRADE, 2018-2033 (USD THOUSAND)
14.8.1 4N (99.99%)
14.8.2 5N (99.999%)
14.8.3 3N (99.9%)
14.8.4 6N (99.9999%)
14.8.5 7N (99.99999%)
14.8.6 OTHERS
14.9 GLOBAL CAMERA & OPTICAL SENSORS IN INDIUM MARKET, BY PURITY GRADE, 2018-2033 (USD THOUSAND)
14.9.1 4N (99.99%)
14.9.2 5N (99.999%)
14.9.3 3N (99.9%)
14.9.4 6N (99.9999%)
14.9.5 7N (99.99999%)
14.9.6 OTHERS
14.1 GLOBAL MINI-LED BACKLIGHTING IN INDIUM MARKET, BY PURITY GRADE, 2018-2033 (USD THOUSAND)
14.10.1 4N (99.99%)
14.10.2 5N (99.999%)
14.10.3 3N (99.9%)
14.10.4 6N (99.9999%)
14.10.5 7N (99.99999%)
14.10.6 OTHERS
14.11 GLOBAL MICRO-LED DISPLAYS IN INDIUM MARKET, BY PURITY GRADE, 2018-2033 (USD THOUSAND)
14.11.1 4N (99.99%)
14.11.2 5N (99.999%)
14.11.3 3N (99.9%)
14.11.4 6N (99.9999%)
14.11.5 7N (99.99999%)
14.11.6 OTHERS
14.12 CONSUMER ELECTRONICS INDUSTRY IN GLOBAL INDIUM MARKET, BY REGION, 2018-2033 (USD THOUSAND)
14.12.1 ASIA-PACIFIC
14.12.2 NORTH AMERICA
14.12.3 EUROPE
14.12.4 SOUTH AMERICA
14.12.5 MIDDLE EAST AND AFRICA
14.13 GLOBAL DISPLAY PANEL INDUSTRY IN INDIUM MARKET, BY TYPE, 2018-2033 (USD THOUSAND)
14.13.1 LCD PANEL MANUFACTURING
14.13.2 OLED PANEL MANUFACTURING
14.13.3 DISPLAY PANEL MANUFACTURING
14.13.4 TOUCH PANEL SENSORS
14.13.5 TRANSPARENT CONDUCTIVE FILMS
14.13.6 FLEXIBLE & FOLDABLE DISPLAYS
14.13.7 AR/VR DISPLAYS
14.13.8 MICRODISPLAY DEVICES
14.13.9 BACKPLANE COATINGS
14.14 GLOBAL LCD PANEL MANUFACTURING IN INDIUM MARKET, BY PURITY GRADE, 2018-2033 (USD THOUSAND)
14.14.1 4N (99.99%)
14.14.2 5N (99.999%)
14.14.3 3N (99.9%)
14.14.4 6N (99.9999%)
14.14.5 7N (99.99999%)
14.14.6 OTHERS
14.15 GLOBAL OLED PANEL MANUFACTURING IN INDIUM MARKET, BY PURITY GRADE, 2018-2033 (USD THOUSAND)
14.15.1 4N (99.99%)
14.15.2 5N (99.999%)
14.15.3 3N (99.9%)
14.15.4 6N (99.9999%)
14.15.5 7N (99.99999%)
14.15.6 OTHERS
14.16 GLOBAL DISPLAY PANEL MANUFACTURING IN INDIUM MARKET, BY PURITY GRADE, 2018-2033 (USD THOUSAND)
14.16.1 4N (99.99%)
14.16.2 5N (99.999%)
14.16.3 3N (99.9%)
14.16.4 6N (99.9999%)
14.16.5 7N (99.99999%)
14.16.6 OTHERS
14.17 GLOBAL TOUCH PANEL SENSORS IN INDIUM MARKET, BY PURITY GRADE, 2018-2033 (USD THOUSAND)
14.17.1 4N (99.99%)
14.17.2 5N (99.999%)
14.17.3 3N (99.9%)
14.17.4 6N (99.9999%)
14.17.5 7N (99.99999%)
14.17.6 OTHERS
14.18 GLOBAL TRANSPARENT CONDUCTIVE FILMS IN INDIUM MARKET, BY PURITY GRADE, 2018-2033 (USD THOUSAND)
14.18.1 4N (99.99%)
14.18.2 5N (99.999%)
14.18.3 3N (99.9%)
14.18.4 6N (99.9999%)
14.18.5 7N (99.99999%)
14.18.6 OTHERS
14.19 GLOBAL FLEXIBLE & FOLDABLE DISPLAYS IN INDIUM MARKET, BY PURITY GRADE, 2018-2033 (USD THOUSAND)
14.19.1 4N (99.99%)
14.19.2 5N (99.999%)
14.19.3 3N (99.9%)
14.19.4 6N (99.9999%)
14.19.5 7N (99.99999%)
14.19.6 OTHERS
14.2 GLOBAL AR/VR DISPLAYS IN INDIUM MARKET, BY PURITY GRADE, 2018-2033 (USD THOUSAND)
14.20.1 4N (99.99%)
14.20.2 5N (99.999%)
14.20.3 3N (99.9%)
14.20.4 6N (99.9999%)
14.20.5 7N (99.99999%)
14.20.6 OTHERS
14.21 GLOBAL MICRODISPLAY DEVICES IN INDIUM MARKET, BY PURITY GRADE, 2018-2033 (USD THOUSAND)
14.21.1 4N (99.99%)
14.21.2 5N (99.999%)
14.21.3 3N (99.9%)
14.21.4 6N (99.9999%)
14.21.5 7N (99.99999%)
14.21.6 OTHERS
14.22 GLOBAL BACKPLANE COATINGS IN INDIUM MARKET, BY PURITY GRADE, 2018-2033 (USD THOUSAND)
14.22.1 4N (99.99%)
14.22.2 5N (99.999%)
14.22.3 3N (99.9%)
14.22.4 6N (99.9999%)
14.22.5 7N (99.99999%)
14.22.6 OTHERS
14.23 DISPLAY PANEL INDUSTRY IN GLOBAL INDIUM MARKET, BY REGION, 2018-2033 (USD THOUSAND)
14.23.1 ASIA-PACIFIC
14.23.2 NORTH AMERICA
14.23.3 EUROPE
14.23.4 SOUTH AMERICA
14.23.5 MIDDLE EAST AND AFRICA
14.24 GLOBAL SEMICONDUCTOR INDUSTRY IN INDIUM MARKET, BY TYPE, 2018-2033 (USD THOUSAND)
14.24.1 III-V COMPOUND SEMICONDUCTORS
14.24.2 HIGH-FREQUENCY RF COMPONENTS
14.24.3 SEMICONDUCTOR SUBSTRATES & EPITAXY
14.24.4 LASER DIODES
14.24.5 PHOTODETECTORS
14.24.6 HIGH-SPEED OPTOELECTRONICS
14.24.7 INFRARED DETECTORS
14.24.8 INTEGRATED PHOTONIC CIRCUITS
14.25 GLOBAL III-V COMPOUND SEMICONDUCTORS IN INDIUM MARKET, BY PURITY GRADE, 2018-2033 (USD THOUSAND)
14.25.1 4N (99.99%)
14.25.2 5N (99.999%)
14.25.3 3N (99.9%)
14.25.4 6N (99.9999%)
14.25.5 7N (99.99999%)
14.25.6 OTHERS
14.26 GLOBAL HIGH-FREQUENCY RF COMPONENTS IN INDIUM MARKET, BY PURITY GRADE, 2018-2033 (USD THOUSAND)
14.26.1 4N (99.99%)
14.26.2 5N (99.999%)
14.26.3 3N (99.9%)
14.26.4 6N (99.9999%)
14.26.5 7N (99.99999%)
14.26.6 OTHERS
14.27 GLOBAL SEMICONDUCTOR SUBSTRATES & EPITAXY IN INDIUM MARKET, BY PURITY GRADE, 2018-2033 (USD THOUSAND)
14.27.1 4N (99.99%)
14.27.2 5N (99.999%)
14.27.3 3N (99.9%)
14.27.4 6N (99.9999%)
14.27.5 7N (99.99999%)
14.27.6 OTHERS
14.28 GLOBAL LASER DIODES IN INDIUM MARKET, BY PURITY GRADE, 2018-2033 (USD THOUSAND)
14.28.1 4N (99.99%)
14.28.2 5N (99.999%)
14.28.3 3N (99.9%)
14.28.4 6N (99.9999%)
14.28.5 7N (99.99999%)
14.28.6 OTHERS
14.29 GLOBAL PHOTODETECTORS IN INDIUM MARKET, BY PURITY GRADE, 2018-2033 (USD THOUSAND)
14.29.1 4N (99.99%)
14.29.2 5N (99.999%)
14.29.3 3N (99.9%)
14.29.4 6N (99.9999%)
14.29.5 7N (99.99999%)
14.29.6 OTHERS
14.3 GLOBAL HIGH-SPEED OPTOELECTRONICS IN INDIUM MARKET, BY PURITY GRADE, 2018-2033 (USD THOUSAND)
14.30.1 4N (99.99%)
14.30.2 5N (99.999%)
14.30.3 3N (99.9%)
14.30.4 6N (99.9999%)
14.30.5 7N (99.99999%)
14.30.6 OTHERS
14.31 GLOBAL INFRARED DETECTORS IN INDIUM MARKET, BY PURITY GRADE, 2018-2033 (USD THOUSAND)
14.31.1 4N (99.99%)
14.31.2 5N (99.999%)
14.31.3 3N (99.9%)
14.31.4 6N (99.9999%)
14.31.5 7N (99.99999%)
14.31.6 OTHERS
14.32 GLOBAL INTEGRATED PHOTONIC CIRCUITS IN INDIUM MARKET, BY PURITY GRADE, 2018-2033 (USD THOUSAND)
14.32.1 4N (99.99%)
14.32.2 5N (99.999%)
14.32.3 3N (99.9%)
14.32.4 6N (99.9999%)
14.32.5 7N (99.99999%)
14.32.6 OTHERS
14.33 SEMICONDUCTOR INDUSTRY IN GLOBAL INDIUM MARKET, BY REGION, 2018-2033 (USD THOUSAND)
14.33.1 ASIA-PACIFIC
14.33.2 NORTH AMERICA
14.33.3 EUROPE
14.33.4 SOUTH AMERICA
14.33.5 MIDDLE EAST AND AFRICA
14.34 GLOBAL SOLAR PHOTOVOLTAIC INDUSTRY IN INDIUM MARKET, BY TYPE, 2018-2033 (USD THOUSAND)
14.34.1 CIGS THIN-FILM SOLAR CELLS
14.34.2 HIGH-EFFICIENCY MODULES
14.34.3 THIN-FILM COATINGS
14.34.4 TRANSPARENT ELECTRODES
14.34.5 BIPV
14.34.6 FLEXIBLE SOLAR PANELS
14.34.7 PORTABLE SOLAR SYSTEMS
14.34.8 CONCENTRATED PV
14.35 GLOBAL CIGS THIN-FILM SOLAR CELLS IN INDIUM MARKET, BY PURITY GRADE, 2018-2033 (USD THOUSAND)
14.35.1 4N (99.99%)
14.35.2 5N (99.999%)
14.35.3 3N (99.9%)
14.35.4 6N (99.9999%)
14.35.5 7N (99.99999%)
14.35.6 OTHERS
14.36 GLOBALHIGH-EFFICIENCY MODULES IN INDIUM MARKET, BY PURITY GRADE, 2018-2033 (USD THOUSAND)
14.36.1 4N (99.99%)
14.36.2 5N (99.999%)
14.36.3 3N (99.9%)
14.36.4 6N (99.9999%)
14.36.5 7N (99.99999%)
14.36.6 OTHERS
14.37 GLOBAL THIN-FILM COATINGS IN INDIUM MARKET, BY PURITY GRADE, 2018-2033 (USD THOUSAND)
14.37.1 4N (99.99%)
14.37.2 5N (99.999%)
14.37.3 3N (99.9%)
14.37.4 6N (99.9999%)
14.37.5 7N (99.99999%)
14.37.6 OTHERS
14.38 GLOBAL TRANSPARENT ELECTRODES IN INDIUM MARKET, BY PURITY GRADE, 2018-2033 (USD THOUSAND)
14.38.1 4N (99.99%)
14.38.2 5N (99.999%)
14.38.3 3N (99.9%)
14.38.4 6N (99.9999%)
14.38.5 7N (99.99999%)
14.38.6 OTHERS
14.39 GLOBAL BIPV IN INDIUM MARKET, BY PURITY GRADE, 2018-2033 (USD THOUSAND)
14.39.1 4N (99.99%)
14.39.2 5N (99.999%)
14.39.3 3N (99.9%)
14.39.4 6N (99.9999%)
14.39.5 7N (99.99999%)
14.39.6 OTHERS
14.4 GLOBAL FLEXIBLE SOLAR PANELS IN INDIUM MARKET, BY PURITY GRADE, 2018-2033 (USD THOUSAND)
14.40.1 4N (99.99%)
14.40.2 5N (99.999%)
14.40.3 3N (99.9%)
14.40.4 6N (99.9999%)
14.40.5 7N (99.99999%)
14.40.6 OTHERS
14.41 GLOBAL PORTABLE SOLAR SYSTEMS IN INDIUM MARKET, BY PURITY GRADE, 2018-2033 (USD THOUSAND)
14.41.1 4N (99.99%)
14.41.2 5N (99.999%)
14.41.3 3N (99.9%)
14.41.4 6N (99.9999%)
14.41.5 7N (99.99999%)
14.41.6 OTHERS
14.42 GLOBAL CONCENTRATED PV IN INDIUM MARKET, BY PURITY GRADE, 2018-2033 (USD THOUSAND)
14.42.1 4N (99.99%)
14.42.2 5N (99.999%)
14.42.3 3N (99.9%)
14.42.4 6N (99.9999%)
14.42.5 7N (99.99999%)
14.42.6 OTHERS
14.43 SOLAR PHOTOVOLTAIC INDUSTRY IN GLOBAL INDIUM MARKET, BY REGION, 2018-2033 (USD THOUSAND)
14.43.1 ASIA-PACIFIC
14.43.2 NORTH AMERICA
14.43.3 EUROPE
14.43.4 SOUTH AMERICA
14.43.5 MIDDLE EAST AND AFRICA
14.44 GLOBAL AUTOMOTIVE INDUSTRY IN INDIUM MARKET, BY TYPE, 2018-2033 (USD THOUSAND)
14.44.1 AUTOMOTIVE DISPLAY PANELS
14.44.2 ADAS SENSORS
14.44.3 VEHICLE CAMERA MODULES
14.44.4 AUTOMOTIVE OPTOELECTRONICS
14.44.5 POWER ELECTRONICS
14.44.6 TOUCHSCREEN INTERFACES
14.44.7 INFRARED SENSORS
14.44.8 SMART LIGHTING
14.45 GLOBAL AUTOMOTIVE DISPLAY PANELS IN INDIUM MARKET, BY PURITY GRADE, 2018-2033 (USD THOUSAND)
14.45.1 4N (99.99%)
14.45.2 5N (99.999%)
14.45.3 3N (99.9%)
14.45.4 6N (99.9999%)
14.45.5 7N (99.99999%)
14.45.6 OTHERS
14.46 GLOBALADAS SENSORS IN INDIUM MARKET, BY PURITY GRADE, 2018-2033 (USD THOUSAND)
14.46.1 4N (99.99%)
14.46.2 5N (99.999%)
14.46.3 3N (99.9%)
14.46.4 6N (99.9999%)
14.46.5 7N (99.99999%)
14.46.6 OTHERS
14.47 GLOBAL VEHICLE CAMERA MODULES IN INDIUM MARKET, BY PURITY GRADE, 2018-2033 (USD THOUSAND)
14.47.1 4N (99.99%)
14.47.2 5N (99.999%)
14.47.3 3N (99.9%)
14.47.4 6N (99.9999%)
14.47.5 7N (99.99999%)
14.47.6 OTHERS
14.48 GLOBAL AUTOMOTIVE OPTOELECTRONICS IN INDIUM MARKET, BY PURITY GRADE, 2018-2033 (USD THOUSAND)
14.48.1 4N (99.99%)
14.48.2 5N (99.999%)
14.48.3 3N (99.9%)
14.48.4 6N (99.9999%)
14.48.5 7N (99.99999%)
14.48.6 OTHERS
14.49 GLOBAL POWER ELECTRONICS IN INDIUM MARKET, BY PURITY GRADE, 2018-2033 (USD THOUSAND)
14.49.1 4N (99.99%)
14.49.2 5N (99.999%)
14.49.3 3N (99.9%)
14.49.4 6N (99.9999%)
14.49.5 7N (99.99999%)
14.49.6 OTHERS
14.5 GLOBAL TOUCHSCREEN INTERFACES IN INDIUM MARKET, BY PURITY GRADE, 2018-2033 (USD THOUSAND)
14.50.1 4N (99.99%)
14.50.2 5N (99.999%)
14.50.3 3N (99.9%)
14.50.4 6N (99.9999%)
14.50.5 7N (99.99999%)
14.50.6 OTHERS
14.51 GLOBAL INFRARED SENSORS IN INDIUM MARKET, BY PURITY GRADE, 2018-2033 (USD THOUSAND)
14.51.1 4N (99.99%)
14.51.2 5N (99.999%)
14.51.3 3N (99.9%)
14.51.4 6N (99.9999%)
14.51.5 7N (99.99999%)
14.51.6 OTHERS
14.52 GLOBAL SMART LIGHTING IN INDIUM MARKET, BY PURITY GRADE, 2018-2033 (USD THOUSAND)
14.52.1 4N (99.99%)
14.52.2 5N (99.999%)
14.52.3 3N (99.9%)
14.52.4 6N (99.9999%)
14.52.5 7N (99.99999%)
14.52.6 OTHERS
14.53 AUTOMOTIVE INDUSTRY IN GLOBAL INDIUM MARKET, BY REGION, 2018-2033 (USD THOUSAND)
14.53.1 ASIA-PACIFIC
14.53.2 NORTH AMERICA
14.53.3 EUROPE
14.53.4 SOUTH AMERICA
14.53.5 MIDDLE EAST AND AFRICA
14.54 GLOBAL TELECOMMUNICATION EQUIPMENT INDUSTRY IN INDIUM MARKET, BY TYPE, 2018-2033 (USD THOUSAND)
14.54.1 OPTICAL TRANSCEIVERS
14.54.2 RF POWER AMPLIFIERS
14.54.3 HIGH-FREQUENCY COMMUNICATION CHIPS
14.54.4 FIBER-OPTIC COMMUNICATION LASERS
14.54.5 PHOTODETECTORS FOR OPTICAL NETWORKS
14.54.6 5G INFRASTRUCTURE COMPONENTS
14.54.7 OPTICAL NETWORK SWITCHING DEVICES
14.54.8 SATELLITE COMMUNICATION MODULES
14.55 GLOBAL OPTICAL TRANSCEIVERS IN INDIUM MARKET, BY PURITY GRADE, 2018-2033 (USD THOUSAND)
14.55.1 4N (99.99%)
14.55.2 5N (99.999%)
14.55.3 3N (99.9%)
14.55.4 6N (99.9999%)
14.55.5 7N (99.99999%)
14.55.6 OTHERS
14.56 GLOBAL RF POWER AMPLIFIERS IN INDIUM MARKET, BY PURITY GRADE, 2018-2033 (USD THOUSAND)
14.56.1 4N (99.99%)
14.56.2 5N (99.999%)
14.56.3 3N (99.9%)
14.56.4 6N (99.9999%)
14.56.5 7N (99.99999%)
14.56.6 OTHERS
14.57 GLOBAL HIGH-FREQUENCY COMMUNICATION CHIPS IN INDIUM MARKET, BY PURITY GRADE, 2018-2033 (USD THOUSAND)
14.57.1 4N (99.99%)
14.57.2 5N (99.999%)
14.57.3 3N (99.9%)
14.57.4 6N (99.9999%)
14.57.5 7N (99.99999%)
14.57.6 OTHERS
14.58 GLOBAL FIBER-OPTIC COMMUNICATION LASERS IN INDIUM MARKET, BY PURITY GRADE, 2018-2033 (USD THOUSAND)
14.58.1 4N (99.99%)
14.58.2 5N (99.999%)
14.58.3 3N (99.9%)
14.58.4 6N (99.9999%)
14.58.5 7N (99.99999%)
14.58.6 OTHERS
14.59 GLOBAL PHOTODETECTORS FOR OPTICAL NETWORKS IN INDIUM MARKET, BY PURITY GRADE, 2018-2033 (USD THOUSAND)
14.59.1 4N (99.99%)
14.59.2 5N (99.999%)
14.59.3 3N (99.9%)
14.59.4 6N (99.9999%)
14.59.5 7N (99.99999%)
14.59.6 OTHERS
14.6 GLOBAL 5G INFRASTRUCTURE COMPONENTS IN INDIUM MARKET, BY PURITY GRADE, 2018-2033 (USD THOUSAND)
14.60.1 4N (99.99%)
14.60.2 5N (99.999%)
14.60.3 3N (99.9%)
14.60.4 6N (99.9999%)
14.60.5 7N (99.99999%)
14.60.6 OTHERS
14.61 GLOBAL OPTICAL NETWORK SWITCHING DEVICES IN INDIUM MARKET, BY PURITY GRADE, 2018-2033 (USD THOUSAND)
14.61.1 4N (99.99%)
14.61.2 5N (99.999%)
14.61.3 3N (99.9%)
14.61.4 6N (99.9999%)
14.61.5 7N (99.99999%)
14.61.6 OTHERS
14.62 GLOBAL SATELLITE COMMUNICATION MODULES IN INDIUM MARKET, BY PURITY GRADE, 2018-2033 (USD THOUSAND)
14.62.1 4N (99.99%)
14.62.2 5N (99.999%)
14.62.3 3N (99.9%)
14.62.4 6N (99.9999%)
14.62.5 7N (99.99999%)
14.62.6 OTHERS
14.63 TELECOMMUNICATION EQUIPMENT INDUSTRY IN GLOBAL INDIUM MARKET, BY REGION, 2018-2033 (USD THOUSAND)
14.63.1 ASIA-PACIFIC
14.63.2 NORTH AMERICA
14.63.3 EUROPE
14.63.4 SOUTH AMERICA
14.63.5 MIDDLE EAST AND AFRICA
14.64 GLOBAL OPTICAL & PHOTONICS INDUSTRY IN INDIUM MARKET, BY TYPE, 2018-2033 (USD THOUSAND)
14.64.1 OPTICAL COATINGS
14.64.2 FIBER OPTIC COMPONENTS
14.64.3 LASER COMPONENTS
14.64.4 OPTICAL SENSORS
14.64.5 INFRARED OPTICS
14.64.6 PICS
14.64.7 MIRRORS
14.64.8 SPECTROSCOPY
14.65 GLOBAL OPTICAL COATINGS IN INDIUM MARKET, BY PURITY GRADE, 2018-2033 (USD THOUSAND)
14.65.1 4N (99.99%)
14.65.2 5N (99.999%)
14.65.3 3N (99.9%)
14.65.4 6N (99.9999%)
14.65.5 7N (99.99999%)
14.65.6 OTHERS
14.66 GLOBAL FIBER OPTIC COMPONENTS IN INDIUM MARKET, BY PURITY GRADE, 2018-2033 (USD THOUSAND)
14.66.1 4N (99.99%)
14.66.2 5N (99.999%)
14.66.3 3N (99.9%)
14.66.4 6N (99.9999%)
14.66.5 7N (99.99999%)
14.66.6 OTHERS
14.67 GLOBAL LASER COMPONENTS IN INDIUM MARKET, BY PURITY GRADE, 2018-2033 (USD THOUSAND)
14.67.1 4N (99.99%)
14.67.2 5N (99.999%)
14.67.3 3N (99.9%)
14.67.4 6N (99.9999%)
14.67.5 7N (99.99999%)
14.67.6 OTHERS
14.68 GLOBAL OPTICAL SENSORS IN INDIUM MARKET, BY PURITY GRADE, 2018-2033 (USD THOUSAND)
14.68.1 4N (99.99%)
14.68.2 5N (99.999%)
14.68.3 3N (99.9%)
14.68.4 6N (99.9999%)
14.68.5 7N (99.99999%)
14.68.6 OTHERS
14.69 GLOBAL INFRARED OPTICS IN INDIUM MARKET, BY PURITY GRADE, 2018-2033 (USD THOUSAND)
14.69.1 4N (99.99%)
14.69.2 5N (99.999%)
14.69.3 3N (99.9%)
14.69.4 6N (99.9999%)
14.69.5 7N (99.99999%)
14.69.6 OTHERS
14.7 GLOBAL PICS IN INDIUM MARKET, BY PURITY GRADE, 2018-2033 (USD THOUSAND)
14.70.1 4N (99.99%)
14.70.2 5N (99.999%)
14.70.3 3N (99.9%)
14.70.4 6N (99.9999%)
14.70.5 7N (99.99999%)
14.70.6 OTHERS
14.71 GLOBAL MIRRORS IN INDIUM MARKET, BY PURITY GRADE, 2018-2033 (USD THOUSAND)
14.71.1 4N (99.99%)
14.71.2 5N (99.999%)
14.71.3 3N (99.9%)
14.71.4 6N (99.9999%)
14.71.5 7N (99.99999%)
14.71.6 OTHERS
14.72 GLOBAL SPECTROSCOPY IN INDIUM MARKET, BY PURITY GRADE, 2018-2033 (USD THOUSAND)
14.72.1 4N (99.99%)
14.72.2 5N (99.999%)
14.72.3 3N (99.9%)
14.72.4 6N (99.9999%)
14.72.5 7N (99.99999%)
14.72.6 OTHERS
14.73 OPTICAL & PHOTONICS INDUSTRY IN GLOBAL INDIUM MARKET, BY REGION, 2018-2033 (USD THOUSAND)
14.73.1 ASIA-PACIFIC
14.73.2 NORTH AMERICA
14.73.3 EUROPE
14.73.4 SOUTH AMERICA
14.73.5 MIDDLE EAST AND AFRICA
14.74 GLOBAL AEROSPACE & DEFENSE INDUSTRY IN INDIUM MARKET, BY TYPE, 2018-2033 (USD THOUSAND)
14.74.1 INFRARED IMAGING SYSTEMS
14.74.2 RADAR & RF COMPONENTS
14.74.3 SATELLITE COMMUNICATION
14.74.4 MILITARY OPTOELECTRONICS
14.74.5 AVIONICS DISPLAYS
14.74.6 SPACECRAFT SOLAR PANELS
14.74.7 THERMAL MATERIALS
14.74.8 CRYOGENIC MATERIALS
14.75 GLOBAL INFRARED IMAGING SYSTEMS IN INDIUM MARKET, BY PURITY GRADE, 2018-2033 (USD THOUSAND)
14.75.1 4N (99.99%)
14.75.2 5N (99.999%)
14.75.3 3N (99.9%)
14.75.4 6N (99.9999%)
14.75.5 7N (99.99999%)
14.75.6 OTHERS
14.76 GLOBAL RADAR & RF COMPONENTS IN INDIUM MARKET, BY PURITY GRADE, 2018-2033 (USD THOUSAND)
14.76.1 4N (99.99%)
14.76.2 5N (99.999%)
14.76.3 3N (99.9%)
14.76.4 6N (99.9999%)
14.76.5 7N (99.99999%)
14.76.6 OTHERS
14.77 GLOBAL SATELLITE COMMUNICATION IN INDIUM MARKET, BY PURITY GRADE, 2018-2033 (USD THOUSAND)
14.77.1 4N (99.99%)
14.77.2 5N (99.999%)
14.77.3 3N (99.9%)
14.77.4 6N (99.9999%)
14.77.5 7N (99.99999%)
14.77.6 OTHERS
14.78 GLOBAL MILITARY OPTOELECTRONICS IN INDIUM MARKET, BY PURITY GRADE, 2018-2033 (USD THOUSAND)
14.78.1 4N (99.99%)
14.78.2 5N (99.999%)
14.78.3 3N (99.9%)
14.78.4 6N (99.9999%)
14.78.5 7N (99.99999%)
14.78.6 OTHERS
14.79 GLOBAL AVIONICS DISPLAYS IN INDIUM MARKET, BY PURITY GRADE, 2018-2033 (USD THOUSAND)
14.79.1 4N (99.99%)
14.79.2 5N (99.999%)
14.79.3 3N (99.9%)
14.79.4 6N (99.9999%)
14.79.5 7N (99.99999%)
14.79.6 OTHERS
14.8 GLOBAL SPACECRAFT SOLAR PANELS IN INDIUM MARKET, BY PURITY GRADE, 2018-2033 (USD THOUSAND)
14.80.1 4N (99.99%)
14.80.2 5N (99.999%)
14.80.3 3N (99.9%)
14.80.4 6N (99.9999%)
14.80.5 7N (99.99999%)
14.80.6 OTHERS
14.81 GLOBAL THERMAL MATERIALS IN INDIUM MARKET, BY PURITY GRADE, 2018-2033 (USD THOUSAND)
14.81.1 4N (99.99%)
14.81.2 5N (99.999%)
14.81.3 3N (99.9%)
14.81.4 6N (99.9999%)
14.81.5 7N (99.99999%)
14.81.6 OTHERS
14.82 GLOBAL CRYOGENIC MATERIALS IN INDIUM MARKET, BY PURITY GRADE, 2018-2033 (USD THOUSAND)
14.82.1 4N (99.99%)
14.82.2 5N (99.999%)
14.82.3 3N (99.9%)
14.82.4 6N (99.9999%)
14.82.5 7N (99.99999%)
14.82.6 OTHERS
14.83 AEROSPACE & DEFENSE INDUSTRY IN GLOBAL INDIUM MARKET, BY REGION, 2018-2033 (USD THOUSAND)
14.83.1 ASIA-PACIFIC
14.83.2 NORTH AMERICA
14.83.3 EUROPE
14.83.4 SOUTH AMERICA
14.83.5 MIDDLE EAST AND AFRICA
14.84 GLOBAL MEDICAL DEVICE INDUSTRY IN INDIUM MARKET, BY TYPE, 2018-2033 (USD THOUSAND)
14.84.1 MEDICAL IMAGING SENSORS
14.84.2 DIAGNOSTIC EQUIPMENT DISPLAYS
14.84.3 ADVANCED DIAGNOSTIC INSTRUMENTS
14.84.4 LASER SURGICAL EQUIPMENT
14.84.5 BIOMEDICAL OPTICAL DEVICES
14.84.6 RADIATION DETECTION EQUIPMENT
14.84.7 INFRARED MEDICAL SENSORS
14.84.8 PHOTOTHERAPY DEVICES
14.85 GLOBAL MEDICAL IMAGING SENSORS IN INDIUM MARKET, BY PURITY GRADE, 2018-2033 (USD THOUSAND)
14.85.1 4N (99.99%)
14.85.2 5N (99.999%)
14.85.3 3N (99.9%)
14.85.4 6N (99.9999%)
14.85.5 7N (99.99999%)
14.85.6 OTHERS
14.86 GLOBAL DIAGNOSTIC EQUIPMENT DISPLAYS IN INDIUM MARKET, BY PURITY GRADE, 2018-2033 (USD THOUSAND)
14.86.1 4N (99.99%)
14.86.2 5N (99.999%)
14.86.3 3N (99.9%)
14.86.4 6N (99.9999%)
14.86.5 7N (99.99999%)
14.86.6 OTHERS
14.87 GLOBAL ADVANCED DIAGNOSTIC INSTRUMENTS IN INDIUM MARKET, BY PURITY GRADE, 2018-2033 (USD THOUSAND)
14.87.1 4N (99.99%)
14.87.2 5N (99.999%)
14.87.3 3N (99.9%)
14.87.4 6N (99.9999%)
14.87.5 7N (99.99999%)
14.87.6 OTHERS
14.88 GLOBAL LASER SURGICAL EQUIPMENT IN INDIUM MARKET, BY PURITY GRADE, 2018-2033 (USD THOUSAND)
14.88.1 4N (99.99%)
14.88.2 5N (99.999%)
14.88.3 3N (99.9%)
14.88.4 6N (99.9999%)
14.88.5 7N (99.99999%)
14.88.6 OTHERS
14.89 GLOBAL BIOMEDICAL OPTICAL DEVICES IN INDIUM MARKET, BY PURITY GRADE, 2018-2033 (USD THOUSAND)
14.89.1 4N (99.99%)
14.89.2 5N (99.999%)
14.89.3 3N (99.9%)
14.89.4 6N (99.9999%)
14.89.5 7N (99.99999%)
14.89.6 OTHERS
14.9 GLOBAL RADIATION DETECTION EQUIPMENT IN INDIUM MARKET, BY PURITY GRADE, 2018-2033 (USD THOUSAND)
14.90.1 4N (99.99%)
14.90.2 5N (99.999%)
14.90.3 3N (99.9%)
14.90.4 6N (99.9999%)
14.90.5 7N (99.99999%)
14.90.6 OTHERS
14.91 GLOBAL INFRARED MEDICAL SENSORS IN INDIUM MARKET, BY PURITY GRADE, 2018-2033 (USD THOUSAND)
14.91.1 4N (99.99%)
14.91.2 5N (99.999%)
14.91.3 3N (99.9%)
14.91.4 6N (99.9999%)
14.91.5 7N (99.99999%)
14.91.6 OTHERS
14.92 GLOBAL PHOTOTHERAPY DEVICES IN INDIUM MARKET, BY PURITY GRADE, 2018-2033 (USD THOUSAND)
14.92.1 4N (99.99%)
14.92.2 5N (99.999%)
14.92.3 3N (99.9%)
14.92.4 6N (99.9999%)
14.92.5 7N (99.99999%)
14.92.6 OTHERS
14.93 MEDICAL DEVICE INDUSTRY IN GLOBAL INDIUM MARKET, BY REGION, 2018-2033 (USD THOUSAND)
14.93.1 ASIA-PACIFIC
14.93.2 NORTH AMERICA
14.93.3 EUROPE
14.93.4 SOUTH AMERICA
14.93.5 MIDDLE EAST AND AFRICA
14.94 GLOBAL INDUSTRIAL EQUIPMENT MANUFACTURING IN INDIUM MARKET, BY TYPE, 2018-2033 (USD THOUSAND)
14.94.1 INDUSTRIAL SENSORS
14.94.2 VACUUM DEPOSITION COATINGS
14.94.3 PRECISION OPTICAL COMPONENTS
14.94.4 THERMAL INTERFACE MATERIALS
14.94.5 INDUSTRIAL LASER SYSTEMS
14.94.6 INDUSTRIAL INFRARED DETECTORS
14.94.7 PRECISION MEASUREMENT EQUIPMENT
14.94.8 SPECIALTY ELECTRONIC COMPONENTS
14.95 GLOBAL INDUSTRIAL SENSORS IN INDIUM MARKET, BY PURITY GRADE, 2018-2033 (USD THOUSAND)
14.95.1 4N (99.99%)
14.95.2 5N (99.999%)
14.95.3 3N (99.9%)
14.95.4 6N (99.9999%)
14.95.5 7N (99.99999%)
14.95.6 OTHERS
14.96 GLOBAL VACUUM DEPOSITION COATINGS IN INDIUM MARKET, BY PURITY GRADE, 2018-2033 (USD THOUSAND)
14.96.1 4N (99.99%)
14.96.2 5N (99.999%)
14.96.3 3N (99.9%)
14.96.4 6N (99.9999%)
14.96.5 7N (99.99999%)
14.96.6 OTHERS
14.97 GLOBAL PRECISION OPTICAL COMPONENTS IN INDIUM MARKET, BY PURITY GRADE, 2018-2033 (USD THOUSAND)
14.97.1 4N (99.99%)
14.97.2 5N (99.999%)
14.97.3 3N (99.9%)
14.97.4 6N (99.9999%)
14.97.5 7N (99.99999%)
14.97.6 OTHERS
14.98 GLOBAL THERMAL INTERFACE MATERIALS IN INDIUM MARKET, BY PURITY GRADE, 2018-2033 (USD THOUSAND)
14.98.1 4N (99.99%)
14.98.2 5N (99.999%)
14.98.3 3N (99.9%)
14.98.4 6N (99.9999%)
14.98.5 7N (99.99999%)
14.98.6 OTHERS
14.99 GLOBAL INDUSTRIAL LASER SYSTEMS IN INDIUM MARKET, BY PURITY GRADE, 2018-2033 (USD THOUSAND)
14.99.1 4N (99.99%)
14.99.2 5N (99.999%)
14.99.3 3N (99.9%)
14.99.4 6N (99.9999%)
14.99.5 7N (99.99999%)
14.99.6 OTHERS
14.1 GLOBAL INDUSTRIAL INFRARED DETECTORS IN INDIUM MARKET, BY PURITY GRADE, 2018-2033 (USD THOUSAND)
14.100.1 4N (99.99%)
14.100.2 5N (99.999%)
14.100.3 3N (99.9%)
14.100.4 6N (99.9999%)
14.100.5 7N (99.99999%)
14.100.6 OTHERS
14.101 GLOBAL PRECISION MEASUREMENT EQUIPMENT IN INDIUM MARKET, BY PURITY GRADE, 2018-2033 (USD THOUSAND)
14.101.1 4N (99.99%)
14.101.2 5N (99.999%)
14.101.3 3N (99.9%)
14.101.4 6N (99.9999%)
14.101.5 7N (99.99999%)
14.101.6 OTHERS
14.102 GLOBAL SPECIALTY ELECTRONIC COMPONENTS IN INDIUM MARKET, BY PURITY GRADE, 2018-2033 (USD THOUSAND)
14.102.1 4N (99.99%)
14.102.2 5N (99.999%)
14.102.3 3N (99.9%)
14.102.4 6N (99.9999%)
14.102.5 7N (99.99999%)
14.102.6 OTHERS
14.103 INDUSTRIAL EQUIPMENT MANUFACTURINGIN GLOBAL INDIUM MARKET, BY REGION, 2018-2033 (USD THOUSAND)
14.103.1 ASIA-PACIFIC
14.103.2 NORTH AMERICA
14.103.3 EUROPE
14.103.4 SOUTH AMERICA
14.103.5 MIDDLE EAST AND AFRICA
14.104 GLOBAL OTHERS IN INDIUM MARKET, BY TYPE, 2018-2033 (USD THOUSAND)
14.104.1 ADVANCED MATERIALS MANUFACTURING
14.104.2 SPECIALTY ALLOY PRODUCTION
14.104.3 THERMAL MANAGEMENT MATERIALS
14.104.4 PRECISION SCIENTIFIC INSTRUMENTS
14.104.5 RESEARCH INSTITUTES & UNIVERSITIES
14.104.6 NUCLEAR INDUSTRY APPLICATIONS
14.104.7 SPECIALTY CHEMICAL PRODUCTION
14.104.8 DEFENSE RESEARCH LABORATORIES
14.104.9 CRYOGENIC EQUIPMENT MANUFACTURING
14.105 GLOBAL ADVANCED MATERIALS MANUFACTURING IN INDIUM MARKET, BY PURITY GRADE, 2018-2033 (USD THOUSAND)
14.105.1 4N (99.99%)
14.105.2 5N (99.999%)
14.105.3 3N (99.9%)
14.105.4 6N (99.9999%)
14.105.5 7N (99.99999%)
14.105.6 OTHERS
14.106 GLOBAL SPECIALTY ALLOY PRODUCTION IN INDIUM MARKET, BY PURITY GRADE, 2018-2033 (USD THOUSAND)
14.106.1 4N (99.99%)
14.106.2 5N (99.999%)
14.106.3 3N (99.9%)
14.106.4 6N (99.9999%)
14.106.5 7N (99.99999%)
14.106.6 OTHERS
14.107 GLOBAL THERMAL MANAGEMENT MATERIALS IN INDIUM MARKET, BY PURITY GRADE, 2018-2033 (USD THOUSAND)
14.107.1 4N (99.99%)
14.107.2 5N (99.999%)
14.107.3 3N (99.9%)
14.107.4 6N (99.9999%)
14.107.5 7N (99.99999%)
14.107.6 OTHERS
14.108 GLOBAL PRECISION SCIENTIFIC INSTRUMENTS IN INDIUM MARKET, BY PURITY GRADE, 2018-2033 (USD THOUSAND)
14.108.1 4N (99.99%)
14.108.2 5N (99.999%)
14.108.3 3N (99.9%)
14.108.4 6N (99.9999%)
14.108.5 7N (99.99999%)
14.108.6 OTHERS
14.109 GLOBAL RESEARCH INSTITUTES & UNIVERSITIES IN INDIUM MARKET, BY PURITY GRADE, 2018-2033 (USD THOUSAND)
14.109.1 4N (99.99%)
14.109.2 5N (99.999%)
14.109.3 3N (99.9%)
14.109.4 6N (99.9999%)
14.109.5 7N (99.99999%)
14.109.6 OTHERS
14.11 GLOBAL NUCLEAR INDUSTRY APPLICATIONS IN INDIUM MARKET, BY PURITY GRADE, 2018-2033 (USD THOUSAND)
14.110.1 4N (99.99%)
14.110.2 5N (99.999%)
14.110.3 3N (99.9%)
14.110.4 6N (99.9999%)
14.110.5 7N (99.99999%)
14.110.6 OTHERS
14.111 GLOBAL SPECIALTY CHEMICAL PRODUCTION IN INDIUM MARKET, BY PURITY GRADE, 2018-2033 (USD THOUSAND)
14.111.1 4N (99.99%)
14.111.2 5N (99.999%)
14.111.3 3N (99.9%)
14.111.4 6N (99.9999%)
14.111.5 7N (99.99999%)
14.111.6 OTHERS
14.112 GLOBAL DEFENSE RESEARCH LABORATORIES IN INDIUM MARKET, BY PURITY GRADE, 2018-2033 (USD THOUSAND)
14.112.1 4N (99.99%)
14.112.2 5N (99.999%)
14.112.3 3N (99.9%)
14.112.4 6N (99.9999%)
14.112.5 7N (99.99999%)
14.112.6 OTHERS
14.113 GLOBAL CRYOGENIC EQUIPMENT MANUFACTURING IN INDIUM MARKET, BY PURITY GRADE, 2018-2033 (USD THOUSAND)
14.113.1 4N (99.99%)
14.113.2 5N (99.999%)
14.113.3 3N (99.9%)
14.113.4 6N (99.9999%)
14.113.5 7N (99.99999%)
14.113.6 OTHERS
14.114 OTHERS IN GLOBAL INDIUM MARKET, BY REGION, 2018-2033 (USD THOUSAND)
14.114.1 ASIA-PACIFIC
14.114.2 NORTH AMERICA
14.114.3 EUROPE
14.114.4 SOUTH AMERICA
14.114.5 MIDDLE EAST AND AFRICA
15 GLOBAL INDIUM MARKET, BY REGION
15.1 OVERVIEW
15.2 NORTH AMERICA
15.2.1 U.S.
15.2.2 CANADA
15.2.3 MEXICO
15.3 EUROPE
15.3.1 GERMANY
15.3.2 FRANCE
15.3.3 BELGIUM
15.3.4 UK
15.3.5 ITALY
15.3.6 SPAIN
15.3.7 NETHERLANDS
15.3.8 SWITZERLAND
15.3.9 TURKEY
15.3.10 RUSSIA
15.3.11 SWEDEN
15.3.12 FINLAND
15.3.13 DENMARK
15.3.14 NORWAY
15.3.15 REST OF EUROPE
15.4 ASIA-PACIFIC
15.4.1 CHINA
15.4.2 JAPAN
15.4.3 SOUTH KOREA
15.4.4 TAIWAN
15.4.5 INDIA
15.4.6 AUSTRALIA
15.4.7 SINGAPORE
15.4.8 MALAYSIA
15.4.9 THAILAND
15.4.10 INDONESIA
15.4.11 PHILIPPINES
15.4.12 HONG KONG
15.4.13 NEW ZEALAND
15.4.14 REST OF ASIA-PACIFIC
15.5 MIDDLE EAST & AFRICA
15.5.1 SOUTH AFRICA
15.5.2 SAUDI ARABIA
15.5.3 UNITED ARAB EMIRATES
15.5.4 ISRAEL
15.5.5 EGYPT
15.5.6 QATAR
15.5.7 KUWAIT
15.5.8 OMAN
15.5.9 BAHRAIN
15.5.10 REST OF MIDDLE EAST & AFRICA
15.6 SOUTH AMERICA
15.6.1 BRAZIL
15.6.2 PERU
15.6.3 CHILE
15.6.4 ARGENTINA
15.6.5 COLOMBIA
15.6.6 BOLIVIA
15.6.7 VENEZUELA
15.6.8 ECUADOR
15.6.9 URUGUAY
15.6.10 PARAGUAY
15.6.11 REST OF SOUTH AMERICA
16 GLOBAL INDIUM MARKET: COMPANY LANDSCAPE
16.1 MANUFACTURER COMPANY SHARE ANALYSIS: GLOBAL
16.2 COMPANY SHARE ANALYSIS: ASIA-PACIFIC
16.3 COMPANY SHARE ANALYSIS: NORTH AMERICA
16.4 COMPANY SHARE ANALYSIS: EUROPE
17 SWOT ANALYSIS
18 COMPANY PROFILE
18.1 KOREAZINC INC
18.1.1 COMPANY SNAPSHOT
18.1.2 REVENUE ANALYSIS
18.1.3 COMPANY SHARE ANALYSIS
18.1.4 PRODUCT PORTFOLIO
18.1.5 RECENT DEVELOPMENT
18.2 UMICORE SA
18.2.1 COMPANY SNAPSHOT
18.2.2 REVENUE ANALYSIS
18.2.3 COMPANY SHARE ANALYSIS
18.2.4 PRODUCT PORTFOLIO
18.2.5 RECENT DEVELOPMENT
18.3 INDIUM CORPORATION
18.3.1 COMPANY SNAPSHOT
18.3.2 COMPANY SHARE ANALYSIS
18.3.3 PRODUCT PORTFOLIO
18.3.4 RECENT DEVELOPMENT
18.4 YUNNAN TIN COMPANY GROUP LIMITED
18.4.1 COMPANY SNAPSHOT
18.4.2 COMPANY SHARE ANALYSIS
18.4.3 PRODUCT PORTFOLIO
18.4.4 RECENT DEVELOPMENT
18.5 TECK RESOURCES LIMITED
18.5.1 COMPANY SNAPSHOT
18.5.2 REVENUE ANALYSIS
18.5.3 COMPANY SHARE ANALYSIS
18.5.4 PRODUCT PORTFOLIO
18.5.5 RECENT DEVELOPMENT
18.6 5N PLUS INC.
18.6.1 COMPANY SNAPSHOT
18.6.2 REVENUE ANALYSIS
18.6.3 PRODUCT PORTFOLIO
18.6.4 RECENT DEVELOPMENT
18.7 AMERICAN ELEMENTS
18.7.1 COMPANY SNAPSHOT
18.7.2 PRODUCT PORTFOLIO
18.7.3 RECENT DEVELOPMENT
18.8 GUANGXI DEBANG TECHNOLOGY CO., LTD
18.8.1 COMPANY SNAPSHOT
18.8.2 PRODUCT PORTFOLIO
18.8.3 RECENT DEVELOPMENT
18.9 INDIUM WIRE EXTRUSION
18.9.1 COMPANY SNAPSHOT
18.9.2 PRODUCT PORTFOLIO
18.9.3 RECENT DEVELOPMENT
18.1 JAYTEE
18.10.1 COMPANY SNAPSHOT
18.10.2 PRODUCT PORTFOLIO
18.10.3 RECENT DEVELOPMENT
18.11 MITSUBISHI MATERIALS CORPORATION
18.11.1 COMPANY SNAPSHOT
18.11.2 REVENUE ANALYSIS
18.11.3 PRODUCT PORTFOLIO
18.11.4 RECENT DEVELOPMENT
18.12 NYRSTAR NV
18.12.1 COMPANY SNAPSHOT
18.12.2 REVENUE ANALYSIS
18.12.3 PRODUCT PORTFOLIO
18.12.4 RECENT DEVELOPMENT
18.13 VIRGIN ENGINEERS
18.13.1 COMPANY SNAPSHOT
18.13.2 PRODUCT PORTFOLIO
18.13.3 RECENT DEVELOPMENT
18.14 VITAL MATERIALS
18.14.1 COMPANY SNAPSHOT
18.14.2 PRODUCT PORTFOLIO
18.14.3 RECENT DEVELOPMENT
18.15 ZHUZHOU KENENG NEW MATERIAL CO., LTD.
18.15.1 COMPANY SNAPSHOT
18.15.2 PRODUCT PORTFOLIO
18.15.3 RECENT DEVELOPMENT
19 QUESTIONNAIRE
20 RELATED REPORTS
List of Table
TABLE 1 ANALYST RECOMMENDATIONS
TABLE 2 INDIUM PRODUCT CATEGORIES AND CORRESPONDING HS CODES
TABLE 3 U.S. STATE SOLAR PV INSTALLATION RANKINGS (2023–2025)
TABLE 4 GLOBAL INDIUM MARKET, BY PRODUCT TYPE, 2018-2033 (USD THOUSAND)
TABLE 5 SPUTTERING TARGETS IN GLOBAL INDIUM MARKET, BY REGION, 2018-2033 (USD THOUSAND)
TABLE 6 GLOBAL INGOTS IN INDIUM MARKET, BY TYPE, 2018-2033 (USD THOUSAND)
TABLE 7 INGOTS IN GLOBAL INDIUM MARKET, BY REGION, 2018-2033 (USD THOUSAND)
TABLE 8 EVAPORATION MATERIALS IN GLOBAL INDIUM MARKET, BY REGION, 2018-2033 (USD THOUSAND)
TABLE 9 PASTE IN GLOBAL INDIUM MARKET, BY REGION, 2018-2033 (USD THOUSAND)
TABLE 10 GRANULES / SHOTS IN GLOBAL INDIUM MARKET, BY REGION, 2018-2033 (USD THOUSAND)
TABLE 11 SOLDER PREFORMS IN GLOBAL INDIUM MARKET, BY REGION, 2018-2033 (USD THOUSAND)
TABLE 12 POWDER IN GLOBAL INDIUM MARKET, BY REGION, 2018-2033 (USD THOUSAND)
TABLE 13 FOIL IN GLOBAL INDIUM MARKET, BY REGION, 2018-2033 (USD THOUSAND)
TABLE 14 PELLETS IN GLOBAL INDIUM MARKET, BY REGION, 2018-2033 (USD THOUSAND)
TABLE 15 WIRE IN GLOBAL INDIUM MARKET, BY REGION, 2018-2033 (USD THOUSAND)
TABLE 16 RIBBONS IN GLOBAL INDIUM MARKET, BY REGION, 2018-2033 (USD THOUSAND)
TABLE 17 OTHERS IN GLOBAL INDIUM MARKET, BY REGION, 2018-2033 (USD THOUSAND)
TABLE 18 GLOBAL INDIUM MARKET, BY MATERIAL COMPOSITION, 2018-2033 (USD THOUSAND)
TABLE 19 PURE INDIUM METAL IN GLOBAL INDIUM MARKET, BY REGION, 2018-2033 (USD THOUSAND)
TABLE 20 GLOBAL INDIUM ALLOYS IN INDIUM MARKET, BY TYPE, 2018-2033 (USD THOUSAND)
TABLE 21 INDIUM ALLOYS IN GLOBAL INDIUM MARKET, BY REGION, 2018-2033 (USD THOUSAND)
TABLE 22 GLOBAL INDIUM COMPOUNDS IN INDIUM MARKET, BY TYPE, 2018-2033 (USD THOUSAND)
TABLE 23 INDIUM COMPOUNDS IN GLOBAL INDIUM MARKET, BY REGION, 2018-2033 (USD THOUSAND)
TABLE 24 GLOBAL INDIUM MARKET, BY PURITY GRADE, 2018-2033 (USD THOUSAND)
TABLE 25 4N (99.99%) IN GLOBAL INDIUM MARKET, BY REGION, 2018-2033 (USD THOUSAND)
TABLE 26 5N (99.999%) IN GLOBAL INDIUM MARKET, BY REGION, 2018-2033 (USD THOUSAND)
TABLE 27 3N (99.9%) IN GLOBAL INDIUM MARKET, BY REGION, 2018-2033 (USD THOUSAND)
TABLE 28 6N (99.9999%) IN GLOBAL INDIUM MARKET, BY REGION, 2018-2033 (USD THOUSAND)
TABLE 29 7N (99.99999%) IN GLOBAL INDIUM MARKET, BY REGION, 2018-2033 (USD THOUSAND)
TABLE 30 OTHERS IN GLOBAL INDIUM MARKET, BY REGION, 2018-2033 (USD THOUSAND)
TABLE 31 GLOBAL INDIUM MARKET, BY EXTRACTION SOURCE, 2018-2033 (USD THOUSAND)
TABLE 32 GLOBAL PRIMARY PRODUCTION IN INDIUM MARKET, BY TYPE, 2018-2033 (USD THOUSAND)
TABLE 33 PRIMARY PRODUCTION IN GLOBAL INDIUM MARKET, BY REGION, 2018-2033 (USD THOUSAND)
TABLE 34 GLOBAL SECONDARY PRODUCTION IN INDIUM MARKET, BY TYPE, 2018-2033 (USD THOUSAND)
TABLE 35 SECONDARY PRODUCTION IN GLOBAL INDIUM MARKET, BY REGION, 2018-2033 (USD THOUSAND)
TABLE 36 GLOBAL INDIUM MARKET, BY DISTRIBUTION CHANNEL, 2018-2033 (USD THOUSAND)
TABLE 37 DIRECT SALES IN GLOBAL INDIUM MARKET, BY REGION, 2018-2033 (USD THOUSAND)
TABLE 38 DISTRIBUTORS & TRADERS IN GLOBAL INDIUM MARKET, BY REGION, 2018-2033 (USD THOUSAND)
TABLE 39 GLOBAL INDIUM MARKET, BY TECHNOLOGY PLATFORM, 2018-2033 (USD THOUSAND)
TABLE 40 INDIUM TIN OXIDE (ITO) TECHNOLOGY IN GLOBAL INDIUM MARKET, BY REGION, 2018-2033 (USD THOUSAND)
TABLE 41 CIGS PHOTOVOLTAIC TECHNOLOGY IN GLOBAL INDIUM MARKET, BY REGION, 2018-2033 (USD THOUSAND)
TABLE 42 III-V COMPOUND SEMICONDUCTOR TECHNOLOGY IN GLOBAL INDIUM MARKET, BY REGION, 2018-2033 (USD THOUSAND)
TABLE 43 LOW-TEMPERATURE SOLDER TECHNOLOGY IN GLOBAL INDIUM MARKET, BY REGION, 2018-2033 (USD THOUSAND)
TABLE 44 THERMAL MANAGEMENT MATERIAL TECHNOLOGY IN GLOBAL INDIUM MARKET, BY REGION, 2018-2033 (USD THOUSAND)
TABLE 45 OTHERS IN GLOBAL INDIUM MARKET, BY REGION, 2018-2033 (USD THOUSAND)
TABLE 46 GLOBAL INDIUM MARKET, BY END-USER INDUSTRY, 2018-2033 (USD THOUSAND)
TABLE 47 GLOBAL CONSUMER ELECTRONICS INDUSTRY IN INDIUM MARKET, BY TYPE, 2018-2033 (USD THOUSAND)
TABLE 48 GLOBAL FLAT PANEL DISPLAYS (LCD/OLED/LED) IN INDIUM MARKET, BY PURITY GRADE, 2018-2033 (USD THOUSAND)
TABLE 49 GLOBAL TRANSPARENT CONDUCTIVE COATINGS (ITO) IN INDIUM MARKET, BY PURITY GRADE, 2018-2033 (USD THOUSAND)
TABLE 50 GLOBAL TOUCHSCREEN DISPLAYS IN INDIUM MARKET, BY PURITY GRADE, 2018-2033 (USD THOUSAND)
TABLE 51 GLOBAL FLEXIBLE DISPLAYS & ELECTRONICS IN INDIUM MARKET, BY PURITY GRADE, 2018-2033 (USD THOUSAND)
TABLE 52 GLOBAL WEARABLE ELECTRONICS DEVICES IN INDIUM MARKET, BY PURITY GRADE, 2018-2033 (USD THOUSAND)
TABLE 53 GLOBAL CAMERA & OPTICAL SENSORS IN INDIUM MARKET, BY PURITY GRADE, 2018-2033 (USD THOUSAND)
TABLE 54 GLOBAL MINI-LED BACKLIGHTING IN INDIUM MARKET, BY PURITY GRADE, 2018-2033 (USD THOUSAND)
TABLE 55 GLOBAL MICRO-LED DISPLAYS IN INDIUM MARKET, BY PURITY GRADE, 2018-2033 (USD THOUSAND)
TABLE 56 CONSUMER ELECTRONICS INDUSTRY IN GLOBAL INDIUM MARKET, BY REGION, 2018-2033 (USD THOUSAND)
TABLE 57 GLOBAL DISPLAY PANEL INDUSTRY IN INDIUM MARKET, BY TYPE, 2018-2033 (USD THOUSAND)
TABLE 58 GLOBAL LCD PANEL MANUFACTURING IN INDIUM MARKET, BY PURITY GRADE, 2018-2033 (USD THOUSAND)
TABLE 59 GLOBAL OLED PANEL MANUFACTURING IN INDIUM MARKET, BY PURITY GRADE, 2018-2033 (USD THOUSAND)
TABLE 60 GLOBAL DISPLAY PANEL MANUFACTURING IN INDIUM MARKET, BY PURITY GRADE, 2018-2033 (USD THOUSAND)
TABLE 61 GLOBAL TOUCH PANEL SENSORS IN INDIUM MARKET, BY PURITY GRADE, 2018-2033 (USD THOUSAND)
TABLE 62 GLOBAL TRANSPARENT CONDUCTIVE FILMS IN INDIUM MARKET, BY PURITY GRADE, 2018-2033 (USD THOUSAND)
TABLE 63 GLOBAL FLEXIBLE & FOLDABLE DISPLAYS IN INDIUM MARKET, BY PURITY GRADE, 2018-2033 (USD THOUSAND)
TABLE 64 GLOBAL AR/VR DISPLAYS IN INDIUM MARKET, BY PURITY GRADE, 2018-2033 (USD THOUSAND)
TABLE 65 GLOBAL MICRODISPLAY DEVICES IN INDIUM MARKET, BY PURITY GRADE, 2018-2033 (USD THOUSAND)
TABLE 66 GLOBAL BACKPLANE COATINGS IN INDIUM MARKET, BY PURITY GRADE, 2018-2033 (USD THOUSAND)
TABLE 67 DISPLAY PANEL INDUSTRY IN GLOBAL INDIUM MARKET, BY REGION, 2018-2033 (USD THOUSAND)
TABLE 68 GLOBAL SEMICONDUCTOR INDUSTRY IN INDIUM MARKET, BY TYPE, 2018-2033 (USD THOUSAND)
TABLE 69 GLOBAL III-V COMPOUND SEMICONDUCTORS IN INDIUM MARKET, BY PURITY GRADE, 2018-2033 (USD THOUSAND)
TABLE 70 GLOBAL HIGH-FREQUENCY RF COMPONENTS IN INDIUM MARKET, BY PURITY GRADE, 2018-2033 (USD THOUSAND)
TABLE 71 GLOBAL SEMICONDUCTOR SUBSTRATES & EPITAXY IN INDIUM MARKET, BY PURITY GRADE, 2018-2033 (USD THOUSAND)
TABLE 72 GLOBAL LASER DIODES IN INDIUM MARKET, BY PURITY GRADE, 2018-2033 (USD THOUSAND)
TABLE 73 GLOBAL PHOTODETECTORS IN INDIUM MARKET, BY PURITY GRADE, 2018-2033 (USD THOUSAND)
TABLE 74 GLOBAL HIGH-SPEED OPTOELECTRONICS IN INDIUM MARKET, BY PURITY GRADE, 2018-2033 (USD THOUSAND)
TABLE 75 GLOBAL INFRARED DETECTORS IN INDIUM MARKET, BY PURITY GRADE, 2018-2033 (USD THOUSAND)
TABLE 76 GLOBAL INTEGRATED PHOTONIC CIRCUITS IN INDIUM MARKET, BY PURITY GRADE, 2018-2033 (USD THOUSAND)
TABLE 77 SEMICONDUCTOR INDUSTRY IN GLOBAL INDIUM MARKET, BY REGION, 2018-2033 (USD THOUSAND)
TABLE 78 GLOBAL SOLAR PHOTOVOLTAIC INDUSTRY IN INDIUM MARKET, BY TYPE, 2018-2033 (USD THOUSAND)
TABLE 79 GLOBAL CIGS THIN-FILM SOLAR CELLS IN INDIUM MARKET, BY PURITY GRADE, 2018-2033 (USD THOUSAND)
TABLE 80 GLOBALHIGH-EFFICIENCY MODULES IN INDIUM MARKET, BY PURITY GRADE, 2018-2033 (USD THOUSAND)
TABLE 81 GLOBAL THIN-FILM COATINGS IN INDIUM MARKET, BY PURITY GRADE, 2018-2033 (USD THOUSAND)
TABLE 82 GLOBAL TRANSPARENT ELECTRODES IN INDIUM MARKET, BY PURITY GRADE, 2018-2033 (USD THOUSAND)
TABLE 83 GLOBAL BIPV IN INDIUM MARKET, BY PURITY GRADE, 2018-2033 (USD THOUSAND)
TABLE 84 GLOBAL FLEXIBLE SOLAR PANELS IN INDIUM MARKET, BY PURITY GRADE, 2018-2033 (USD THOUSAND)
TABLE 85 GLOBAL PORTABLE SOLAR SYSTEMS IN INDIUM MARKET, BY PURITY GRADE, 2018-2033 (USD THOUSAND)
TABLE 86 GLOBAL CONCENTRATED PV IN INDIUM MARKET, BY PURITY GRADE, 2018-2033 (USD THOUSAND)
TABLE 87 SOLAR PHOTOVOLTAIC INDUSTRY IN GLOBAL INDIUM MARKET, BY REGION, 2018-2033 (USD THOUSAND)
TABLE 88 GLOBAL AUTOMOTIVE INDUSTRY IN INDIUM MARKET, BY TYPE, 2018-2033 (USD THOUSAND)
TABLE 89 GLOBAL AUTOMOTIVE DISPLAY PANELS IN INDIUM MARKET, BY PURITY GRADE, 2018-2033 (USD THOUSAND)
TABLE 90 GLOBALADAS SENSORS IN INDIUM MARKET, BY PURITY GRADE, 2018-2033 (USD THOUSAND)
TABLE 91 GLOBAL VEHICLE CAMERA MODULES IN INDIUM MARKET, BY PURITY GRADE, 2018-2033 (USD THOUSAND)
TABLE 92 GLOBAL AUTOMOTIVE OPTOELECTRONICS IN INDIUM MARKET, BY PURITY GRADE, 2018-2033 (USD THOUSAND)
TABLE 93 GLOBAL POWER ELECTRONICS IN INDIUM MARKET, BY PURITY GRADE, 2018-2033 (USD THOUSAND)
TABLE 94 GLOBAL TOUCHSCREEN INTERFACES IN INDIUM MARKET, BY PURITY GRADE, 2018-2033 (USD THOUSAND)
TABLE 95 GLOBAL INFRARED SENSORS IN INDIUM MARKET, BY PURITY GRADE, 2018-2033 (USD THOUSAND)
TABLE 96 GLOBAL SMART LIGHTING IN INDIUM MARKET, BY PURITY GRADE, 2018-2033 (USD THOUSAND)
TABLE 97 AUTOMOTIVE INDUSTRY IN GLOBAL INDIUM MARKET, BY REGION, 2018-2033 (USD THOUSAND)
TABLE 98 GLOBAL TELECOMMUNICATION EQUIPMENT INDUSTRY IN INDIUM MARKET, BY TYPE, 2018-2033 (USD THOUSAND)
TABLE 99 GLOBAL OPTICAL TRANSCEIVERS IN INDIUM MARKET, BY PURITY GRADE, 2018-2033 (USD THOUSAND)
TABLE 100 GLOBAL RF POWER AMPLIFIERS IN INDIUM MARKET, BY PURITY GRADE, 2018-2033 (USD THOUSAND)
TABLE 101 GLOBAL HIGH-FREQUENCY COMMUNICATION CHIPS IN INDIUM MARKET, BY PURITY GRADE, 2018-2033 (USD THOUSAND)
TABLE 102 GLOBAL FIBER-OPTIC COMMUNICATION LASERS IN INDIUM MARKET, BY PURITY GRADE, 2018-2033 (USD THOUSAND)
TABLE 103 GLOBAL PHOTODETECTORS FOR OPTICAL NETWORKS IN INDIUM MARKET, BY PURITY GRADE, 2018-2033 (USD THOUSAND)
TABLE 104 GLOBAL 5G INFRASTRUCTURE COMPONENTS IN INDIUM MARKET, BY PURITY GRADE, 2018-2033 (USD THOUSAND)
TABLE 105 GLOBAL OPTICAL NETWORK SWITCHING DEVICES IN INDIUM MARKET, BY PURITY GRADE, 2018-2033 (USD THOUSAND)
TABLE 106 GLOBAL SATELLITE COMMUNICATION MODULES IN INDIUM MARKET, BY PURITY GRADE, 2018-2033 (USD THOUSAND)
TABLE 107 TELECOMMUNICATION EQUIPMENT INDUSTRY IN GLOBAL INDIUM MARKET, BY REGION, 2018-2033 (USD THOUSAND)
TABLE 108 GLOBAL OPTICAL & PHOTONICS INDUSTRY IN INDIUM MARKET, BY TYPE, 2018-2033 (USD THOUSAND)
TABLE 109 GLOBAL OPTICAL COATINGS IN INDIUM MARKET, BY PURITY GRADE, 2018-2033 (USD THOUSAND)
TABLE 110 GLOBAL FIBER OPTIC COMPONENTS IN INDIUM MARKET, BY PURITY GRADE, 2018-2033 (USD THOUSAND)
TABLE 111 GLOBAL LASER COMPONENTS IN INDIUM MARKET, BY PURITY GRADE, 2018-2033 (USD THOUSAND)
TABLE 112 GLOBAL OPTICAL SENSORS IN INDIUM MARKET, BY PURITY GRADE, 2018-2033 (USD THOUSAND)
TABLE 113 GLOBAL INFRARED OPTICS IN INDIUM MARKET, BY PURITY GRADE, 2018-2033 (USD THOUSAND)
TABLE 114 GLOBAL PICS IN INDIUM MARKET, BY PURITY GRADE, 2018-2033 (USD THOUSAND)
TABLE 115 GLOBAL MIRRORS IN INDIUM MARKET, BY PURITY GRADE, 2018-2033 (USD THOUSAND)
TABLE 116 GLOBAL SPECTROSCOPY IN INDIUM MARKET, BY PURITY GRADE, 2018-2033 (USD THOUSAND)
TABLE 117 OPTICAL & PHOTONICS INDUSTRY IN GLOBAL INDIUM MARKET, BY REGION, 2018-2033 (USD THOUSAND)
TABLE 118 GLOBAL AEROSPACE & DEFENSE INDUSTRY IN INDIUM MARKET, BY TYPE, 2018-2033 (USD THOUSAND)
TABLE 119 GLOBAL INFRARED IMAGING SYSTEMS IN INDIUM MARKET, BY PURITY GRADE, 2018-2033 (USD THOUSAND)
TABLE 120 GLOBAL RADAR & RF COMPONENTS IN INDIUM MARKET, BY PURITY GRADE, 2018-2033 (USD THOUSAND)
TABLE 121 GLOBAL SATELLITE COMMUNICATION IN INDIUM MARKET, BY PURITY GRADE, 2018-2033 (USD THOUSAND)
TABLE 122 GLOBAL MILITARY OPTOELECTRONICS IN INDIUM MARKET, BY PURITY GRADE, 2018-2033 (USD THOUSAND)
TABLE 123 GLOBAL AVIONICS DISPLAYS IN INDIUM MARKET, BY PURITY GRADE, 2018-2033 (USD THOUSAND)
TABLE 124 GLOBAL SPACECRAFT SOLAR PANELS IN INDIUM MARKET, BY PURITY GRADE, 2018-2033 (USD THOUSAND)
TABLE 125 GLOBAL THERMAL MATERIALS IN INDIUM MARKET, BY PURITY GRADE, 2018-2033 (USD THOUSAND)
TABLE 126 GLOBAL CRYOGENIC MATERIALS IN INDIUM MARKET, BY PURITY GRADE, 2018-2033 (USD THOUSAND)
TABLE 127 AEROSPACE & DEFENSE INDUSTRY IN GLOBAL INDIUM MARKET, BY REGION, 2018-2033 (USD THOUSAND)
TABLE 128 GLOBAL MEDICAL DEVICE INDUSTRY IN INDIUM MARKET, BY TYPE, 2018-2033 (USD THOUSAND)
TABLE 129 GLOBAL MEDICAL IMAGING SENSORS IN INDIUM MARKET, BY PURITY GRADE, 2018-2033 (USD THOUSAND)
TABLE 130 GLOBAL DIAGNOSTIC EQUIPMENT DISPLAYS IN INDIUM MARKET, BY PURITY GRADE, 2018-2033 (USD THOUSAND)
TABLE 131 GLOBAL ADVANCED DIAGNOSTIC INSTRUMENTS IN INDIUM MARKET, BY PURITY GRADE, 2018-2033 (USD THOUSAND)
TABLE 132 GLOBAL LASER SURGICAL EQUIPMENT IN INDIUM MARKET, BY PURITY GRADE, 2018-2033 (USD THOUSAND)
TABLE 133 GLOBAL BIOMEDICAL OPTICAL DEVICES IN INDIUM MARKET, BY PURITY GRADE, 2018-2033 (USD THOUSAND)
TABLE 134 GLOBAL RADIATION DETECTION EQUIPMENT IN INDIUM MARKET, BY PURITY GRADE, 2018-2033 (USD THOUSAND)
TABLE 135 GLOBAL INFRARED MEDICAL SENSORS IN INDIUM MARKET, BY PURITY GRADE, 2018-2033 (USD THOUSAND)
TABLE 136 GLOBAL PHOTOTHERAPY DEVICES IN INDIUM MARKET, BY PURITY GRADE, 2018-2033 (USD THOUSAND)
TABLE 137 MEDICAL DEVICE INDUSTRY IN GLOBAL INDIUM MARKET, BY REGION, 2018-2033 (USD THOUSAND)
TABLE 138 GLOBAL INDUSTRIAL EQUIPMENT MANUFACTURING IN INDIUM MARKET, BY TYPE, 2018-2033 (USD THOUSAND)
TABLE 139 GLOBAL INDUSTRIAL SENSORS IN INDIUM MARKET, BY PURITY GRADE, 2018-2033 (USD THOUSAND)
TABLE 140 GLOBAL VACUUM DEPOSITION COATINGS IN INDIUM MARKET, BY PURITY GRADE, 2018-2033 (USD THOUSAND)
TABLE 141 GLOBAL PRECISION OPTICAL COMPONENTS IN INDIUM MARKET, BY PURITY GRADE, 2018-2033 (USD THOUSAND)
TABLE 142 GLOBAL THERMAL INTERFACE MATERIALS IN INDIUM MARKET, BY PURITY GRADE, 2018-2033 (USD THOUSAND)
TABLE 143 GLOBAL INDUSTRIAL LASER SYSTEMS IN INDIUM MARKET, BY PURITY GRADE, 2018-2033 (USD THOUSAND)
TABLE 144 GLOBAL INDUSTRIAL INFRARED DETECTORS IN INDIUM MARKET, BY PURITY GRADE, 2018-2033 (USD THOUSAND)
TABLE 145 GLOBAL PRECISION MEASUREMENT EQUIPMENT IN INDIUM MARKET, BY PURITY GRADE, 2018-2033 (USD THOUSAND)
TABLE 146 GLOBAL SPECIALTY ELECTRONIC COMPONENTS IN INDIUM MARKET, BY PURITY GRADE, 2018-2033 (USD THOUSAND)
TABLE 147 INDUSTRIAL EQUIPMENT MANUFACTURINGIN GLOBAL INDIUM MARKET, BY REGION, 2018-2033 (USD THOUSAND)
TABLE 148 GLOBAL OTHERS IN INDIUM MARKET, BY TYPE, 2018-2033 (USD THOUSAND)
TABLE 149 GLOBAL ADVANCED MATERIALS MANUFACTURING IN INDIUM MARKET, BY PURITY GRADE, 2018-2033 (USD THOUSAND)
TABLE 150 GLOBAL SPECIALTY ALLOY PRODUCTION IN INDIUM MARKET, BY PURITY GRADE, 2018-2033 (USD THOUSAND)
TABLE 151 GLOBAL THERMAL MANAGEMENT MATERIALS IN INDIUM MARKET, BY PURITY GRADE, 2018-2033 (USD THOUSAND)
TABLE 152 GLOBAL PRECISION SCIENTIFIC INSTRUMENTS IN INDIUM MARKET, BY PURITY GRADE, 2018-2033 (USD THOUSAND)
TABLE 153 GLOBAL RESEARCH INSTITUTES & UNIVERSITIES IN INDIUM MARKET, BY PURITY GRADE, 2018-2033 (USD THOUSAND)
TABLE 154 GLOBAL NUCLEAR INDUSTRY APPLICATIONS IN INDIUM MARKET, BY PURITY GRADE, 2018-2033 (USD THOUSAND)
TABLE 155 GLOBAL SPECIALTY CHEMICAL PRODUCTION IN INDIUM MARKET, BY PURITY GRADE, 2018-2033 (USD THOUSAND)
TABLE 156 GLOBAL DEFENSE RESEARCH LABORATORIES IN INDIUM MARKET, BY PURITY GRADE, 2018-2033 (USD THOUSAND)
TABLE 157 GLOBAL CRYOGENIC EQUIPMENT MANUFACTURING IN INDIUM MARKET, BY PURITY GRADE, 2018-2033 (USD THOUSAND)
TABLE 158 OTHERS IN GLOBAL INDIUM MARKET, BY REGION, 2018-2033 (USD THOUSAND)
TABLE 159 GLOBAL INDIUM MARKET, BY REGION, 2018-2033 (USD THOUSAND)
TABLE 160 NORTH AMERICA INDIUM MARKET, BY COUNTRY, 2018-2033 (USD THOUSAND)
TABLE 161 NORTH AMERICA INDIUM MARKET, BY PRODUCT TYPE, 2018-2033 (USD THOUSAND)
TABLE 162 NORTH AMERICA INGOTS IN INDIUM MARKET, BY TYPE, 2018-2033 (USD THOUSAND)
TABLE 163 NORTH AMERICA INDIUM MARKET, BY MATERIAL COMPOSITION, 2018-2033 (USD THOUSAND)
TABLE 164 NORTH AMERICA INDIUM ALLOYS IN INDIUM MARKET, BY TYPE, 2018-2033 (USD THOUSAND)
TABLE 165 NORTH AMERICA INDIUM COMPOUNDS IN INDIUM MARKET, BY TYPE, 2018-2033 (USD THOUSAND)
TABLE 166 NORTH AMERICA INDIUM MARKET, BY PURITY GRADE, 2018-2033 (USD THOUSAND)
TABLE 167 NORTH AMERICA INDIUM MARKET, BY EXTRACTION SOURCE, 2018-2033 (USD THOUSAND)
TABLE 168 NORTH AMERICA PRIMARY PRODUCTION IN INDIUM MARKET, BY TYPE, 2018-2033 (USD THOUSAND)
TABLE 169 NORTH AMERICA SECONDARY PRODUCTION IN INDIUM MARKET, BY TYPE, 2018-2033 (USD THOUSAND)
TABLE 170 NORTH AMERICA INDIUM MARKET, BY DISTRIBUTION CHANNEL, 2018-2033 (USD THOUSAND)
TABLE 171 NORTH AMERICA INDIUM MARKET, BY TECHNOLOGY PLATFORM, 2018-2033 (USD THOUSAND)
TABLE 172 NORTH AMERICA INDIUM MARKET, BY END-USER INDUSTRY, 2018-2033 (USD THOUSAND)
TABLE 173 NORTH AMERICA CONSUMER ELECTRONICS INDUSTRY IN INDIUM MARKET, BY TYPE, 2018-2033 (USD THOUSAND)
TABLE 174 NORTH AMERICA FLAT PANEL DISPLAYS (LCD/OLED/LED) IN INDIUM MARKET, BY PURITY GRADE, 2018-2033 (USD THOUSAND)
TABLE 175 NORTH AMERICA TRANSPARENT CONDUCTIVE COATINGS (ITO) IN INDIUM MARKET, BY PURITY GRADE, 2018-2033 (USD THOUSAND)
TABLE 176 NORTH AMERICA TOUCHSCREEN DISPLAYS IN INDIUM MARKET, BY PURITY GRADE, 2018-2033 (USD THOUSAND)
TABLE 177 NORTH AMERICA FLEXIBLE DISPLAYS & ELECTRONICS IN INDIUM MARKET, BY PURITY GRADE, 2018-2033 (USD THOUSAND)
TABLE 178 NORTH AMERICA WEARABLE ELECTRONICS DEVICES IN INDIUM MARKET, BY PURITY GRADE, 2018-2033 (USD THOUSAND)
TABLE 179 NORTH AMERICA CAMERA & OPTICAL SENSORS IN INDIUM MARKET, BY PURITY GRADE, 2018-2033 (USD THOUSAND)
TABLE 180 NORTH AMERICA MINI-LED BACKLIGHTING IN INDIUM MARKET, BY PURITY GRADE, 2018-2033 (USD THOUSAND)
TABLE 181 NORTH AMERICA MICRO-LED DISPLAYS IN INDIUM MARKET, BY PURITY GRADE, 2018-2033 (USD THOUSAND)
TABLE 182 NORTH AMERICA DISPLAY PANEL INDUSTRY IN INDIUM MARKET, BY TYPE, 2018-2033 (USD THOUSAND)
TABLE 183 NORTH AMERICA LCD PANEL MANUFACTURING IN INDIUM MARKET, BY PURITY GRADE, 2018-2033 (USD THOUSAND)
TABLE 184 NORTH AMERICA OLED PANEL MANUFACTURING IN INDIUM MARKET, BY PURITY GRADE, 2018-2033 (USD THOUSAND)
TABLE 185 NORTH AMERICA DISPLAY PANEL MANUFACTURING IN INDIUM MARKET, BY PURITY GRADE, 2018-2033 (USD THOUSAND)
TABLE 186 NORTH AMERICA TOUCH PANEL SENSORS IN INDIUM MARKET, BY PURITY GRADE, 2018-2033 (USD THOUSAND)
TABLE 187 NORTH AMERICA TRANSPARENT CONDUCTIVE FILMS IN INDIUM MARKET, BY PURITY GRADE, 2018-2033 (USD THOUSAND)
TABLE 188 NORTH AMERICA FLEXIBLE & FOLDABLE DISPLAYS IN INDIUM MARKET, BY PURITY GRADE, 2018-2033 (USD THOUSAND)
TABLE 189 NORTH AMERICA AR/VR DISPLAYS IN INDIUM MARKET, BY PURITY GRADE, 2018-2033 (USD THOUSAND)
TABLE 190 NORTH AMERICA MICRODISPLAY DEVICES IN INDIUM MARKET, BY PURITY GRADE, 2018-2033 (USD THOUSAND)
TABLE 191 NORTH AMERICA BACKPLANE COATINGS IN INDIUM MARKET, BY PURITY GRADE, 2018-2033 (USD THOUSAND)
TABLE 192 NORTH AMERICA SEMICONDUCTOR INDUSTRY IN INDIUM MARKET, BY TYPE, 2018-2033 (USD THOUSAND)
TABLE 193 NORTH AMERICA III-V COMPOUND SEMICONDUCTORS IN INDIUM MARKET, BY PURITY GRADE, 2018-2033 (USD THOUSAND)
TABLE 194 NORTH AMERICA HIGH-FREQUENCY RF COMPONENTS IN INDIUM MARKET, BY PURITY GRADE, 2018-2033 (USD THOUSAND)
TABLE 195 NORTH AMERICA SEMICONDUCTOR SUBSTRATES & EPITAXY IN INDIUM MARKET, BY PURITY GRADE, 2018-2033 (USD THOUSAND)
TABLE 196 NORTH AMERICA LASER DIODES IN INDIUM MARKET, BY PURITY GRADE, 2018-2033 (USD THOUSAND)
TABLE 197 NORTH AMERICA PHOTODETECTORS IN INDIUM MARKET, BY PURITY GRADE, 2018-2033 (USD THOUSAND)
TABLE 198 NORTH AMERICA HIGH-SPEED OPTOELECTRONICS IN INDIUM MARKET, BY PURITY GRADE, 2018-2033 (USD THOUSAND)
TABLE 199 NORTH AMERICA INFRARED DETECTORS IN INDIUM MARKET, BY PURITY GRADE, 2018-2033 (USD THOUSAND)
TABLE 200 NORTH AMERICA INTEGRATED PHOTONIC CIRCUITS IN INDIUM MARKET, BY PURITY GRADE, 2018-2033 (USD THOUSAND)
TABLE 201 NORTH AMERICA SOLAR PHOTOVOLTAIC INDUSTRY IN INDIUM MARKET, BY TYPE, 2018-2033 (USD THOUSAND)
TABLE 202 NORTH AMERICA CIGS THIN-FILM SOLAR CELLS IN INDIUM MARKET, BY PURITY GRADE, 2018-2033 (USD THOUSAND)
TABLE 203 NORTH AMERICAHIGH-EFFICIENCY MODULES IN INDIUM MARKET, BY PURITY GRADE, 2018-2033 (USD THOUSAND)
TABLE 204 NORTH AMERICA THIN-FILM COATINGS IN INDIUM MARKET, BY PURITY GRADE, 2018-2033 (USD THOUSAND)
TABLE 205 NORTH AMERICA TRANSPARENT ELECTRODES IN INDIUM MARKET, BY PURITY GRADE, 2018-2033 (USD THOUSAND)
TABLE 206 NORTH AMERICA BIPV IN INDIUM MARKET, BY PURITY GRADE, 2018-2033 (USD THOUSAND)
TABLE 207 NORTH AMERICA FLEXIBLE SOLAR PANELS IN INDIUM MARKET, BY PURITY GRADE, 2018-2033 (USD THOUSAND)
TABLE 208 NORTH AMERICA PORTABLE SOLAR SYSTEMS IN INDIUM MARKET, BY PURITY GRADE, 2018-2033 (USD THOUSAND)
TABLE 209 NORTH AMERICA CONCENTRATED PV IN INDIUM MARKET, BY PURITY GRADE, 2018-2033 (USD THOUSAND)
TABLE 210 NORTH AMERICA AUTOMOTIVE INDUSTRY IN INDIUM MARKET, BY TYPE, 2018-2033 (USD THOUSAND)
TABLE 211 NORTH AMERICA AUTOMOTIVE DISPLAY PANELS IN INDIUM MARKET, BY PURITY GRADE, 2018-2033 (USD THOUSAND)
TABLE 212 NORTH AMERICAADAS SENSORS IN INDIUM MARKET, BY PURITY GRADE, 2018-2033 (USD THOUSAND)
TABLE 213 NORTH AMERICA VEHICLE CAMERA MODULES IN INDIUM MARKET, BY PURITY GRADE, 2018-2033 (USD THOUSAND)
TABLE 214 NORTH AMERICA AUTOMOTIVE OPTOELECTRONICS IN INDIUM MARKET, BY PURITY GRADE, 2018-2033 (USD THOUSAND)
TABLE 215 NORTH AMERICA POWER ELECTRONICS IN INDIUM MARKET, BY PURITY GRADE, 2018-2033 (USD THOUSAND)
TABLE 216 NORTH AMERICA TOUCHSCREEN INTERFACES IN INDIUM MARKET, BY PURITY GRADE, 2018-2033 (USD THOUSAND)
TABLE 217 NORTH AMERICA INFRARED SENSORS IN INDIUM MARKET, BY PURITY GRADE, 2018-2033 (USD THOUSAND)
TABLE 218 NORTH AMERICA SMART LIGHTING IN INDIUM MARKET, BY PURITY GRADE, 2018-2033 (USD THOUSAND)
TABLE 219 NORTH AMERICA TELECOMMUNICATION EQUIPMENT INDUSTRY IN INDIUM MARKET, BY TYPE, 2018-2033 (USD THOUSAND)
TABLE 220 NORTH AMERICA OPTICAL TRANSCEIVERS IN INDIUM MARKET, BY PURITY GRADE, 2018-2033 (USD THOUSAND)
TABLE 221 NORTH AMERICA RF POWER AMPLIFIERS IN INDIUM MARKET, BY PURITY GRADE, 2018-2033 (USD THOUSAND)
TABLE 222 NORTH AMERICA HIGH-FREQUENCY COMMUNICATION CHIPS IN INDIUM MARKET, BY PURITY GRADE, 2018-2033 (USD THOUSAND)
TABLE 223 NORTH AMERICA FIBER-OPTIC COMMUNICATION LASERS IN INDIUM MARKET, BY PURITY GRADE, 2018-2033 (USD THOUSAND)
TABLE 224 NORTH AMERICA PHOTODETECTORS FOR OPTICAL NETWORKS IN INDIUM MARKET, BY PURITY GRADE, 2018-2033 (USD THOUSAND)
TABLE 225 NORTH AMERICA 5G INFRASTRUCTURE COMPONENTS IN INDIUM MARKET, BY PURITY GRADE, 2018-2033 (USD THOUSAND)
TABLE 226 NORTH AMERICA OPTICAL NETWORK SWITCHING DEVICES IN INDIUM MARKET, BY PURITY GRADE, 2018-2033 (USD THOUSAND)
TABLE 227 NORTH AMERICA SATELLITE COMMUNICATION MODULES IN INDIUM MARKET, BY PURITY GRADE, 2018-2033 (USD THOUSAND)
TABLE 228 NORTH AMERICA OPTICAL & PHOTONICS INDUSTRY IN INDIUM MARKET, BY TYPE, 2018-2033 (USD THOUSAND)
TABLE 229 NORTH AMERICA OPTICAL COATINGS IN INDIUM MARKET, BY PURITY GRADE, 2018-2033 (USD THOUSAND)
TABLE 230 NORTH AMERICA FIBER OPTIC COMPONENTS IN INDIUM MARKET, BY PURITY GRADE, 2018-2033 (USD THOUSAND)
TABLE 231 NORTH AMERICA LASER COMPONENTS IN INDIUM MARKET, BY PURITY GRADE, 2018-2033 (USD THOUSAND)
TABLE 232 NORTH AMERICA OPTICAL SENSORS IN INDIUM MARKET, BY PURITY GRADE, 2018-2033 (USD THOUSAND)
TABLE 233 NORTH AMERICA INFRARED OPTICS IN INDIUM MARKET, BY PURITY GRADE, 2018-2033 (USD THOUSAND)
TABLE 234 NORTH AMERICA PICS IN INDIUM MARKET, BY PURITY GRADE, 2018-2033 (USD THOUSAND)
TABLE 235 NORTH AMERICA MIRRORS IN INDIUM MARKET, BY PURITY GRADE, 2018-2033 (USD THOUSAND)
TABLE 236 NORTH AMERICA SPECTROSCOPY IN INDIUM MARKET, BY PURITY GRADE, 2018-2033 (USD THOUSAND)
TABLE 237 NORTH AMERICA AEROSPACE & DEFENSE INDUSTRY IN INDIUM MARKET, BY TYPE, 2018-2033 (USD THOUSAND)
TABLE 238 NORTH AMERICA INFRARED IMAGING SYSTEMS IN INDIUM MARKET, BY PURITY GRADE, 2018-2033 (USD THOUSAND)
TABLE 239 NORTH AMERICA RADAR & RF COMPONENTS IN INDIUM MARKET, BY PURITY GRADE, 2018-2033 (USD THOUSAND)
TABLE 240 NORTH AMERICA SATELLITE COMMUNICATION IN INDIUM MARKET, BY PURITY GRADE, 2018-2033 (USD THOUSAND)
TABLE 241 NORTH AMERICA MILITARY OPTOELECTRONICS IN INDIUM MARKET, BY PURITY GRADE, 2018-2033 (USD THOUSAND)
TABLE 242 NORTH AMERICA AVIONICS DISPLAYS IN INDIUM MARKET, BY PURITY GRADE, 2018-2033 (USD THOUSAND)
TABLE 243 NORTH AMERICA SPACECRAFT SOLAR PANELS IN INDIUM MARKET, BY PURITY GRADE, 2018-2033 (USD THOUSAND)
TABLE 244 NORTH AMERICA THERMAL MATERIALS IN INDIUM MARKET, BY PURITY GRADE, 2018-2033 (USD THOUSAND)
TABLE 245 NORTH AMERICA CRYOGENIC MATERIALS IN INDIUM MARKET, BY PURITY GRADE, 2018-2033 (USD THOUSAND)
TABLE 246 NORTH AMERICA MEDICAL DEVICE INDUSTRY IN INDIUM MARKET, BY TYPE, 2018-2033 (USD THOUSAND)
TABLE 247 NORTH AMERICA MEDICAL IMAGING SENSORS IN INDIUM MARKET, BY PURITY GRADE, 2018-2033 (USD THOUSAND)
TABLE 248 NORTH AMERICA DIAGNOSTIC EQUIPMENT DISPLAYS IN INDIUM MARKET, BY PURITY GRADE, 2018-2033 (USD THOUSAND)
TABLE 249 NORTH AMERICA ADVANCED DIAGNOSTIC INSTRUMENTS IN INDIUM MARKET, BY PURITY GRADE, 2018-2033 (USD THOUSAND)
TABLE 250 NORTH AMERICA LASER SURGICAL EQUIPMENT IN INDIUM MARKET, BY PURITY GRADE, 2018-2033 (USD THOUSAND)
TABLE 251 NORTH AMERICA BIOMEDICAL OPTICAL DEVICES IN INDIUM MARKET, BY PURITY GRADE, 2018-2033 (USD THOUSAND)
TABLE 252 NORTH AMERICA RADIATION DETECTION EQUIPMENT IN INDIUM MARKET, BY PURITY GRADE, 2018-2033 (USD THOUSAND)
TABLE 253 NORTH AMERICA INFRARED MEDICAL SENSORS IN INDIUM MARKET, BY PURITY GRADE, 2018-2033 (USD THOUSAND)
TABLE 254 NORTH AMERICA PHOTOTHERAPY DEVICES IN INDIUM MARKET, BY PURITY GRADE, 2018-2033 (USD THOUSAND)
TABLE 255 NORTH AMERICA INDUSTRIAL EQUIPMENT MANUFACTURING IN INDIUM MARKET, BY TYPE, 2018-2033 (USD THOUSAND)
TABLE 256 NORTH AMERICA INDUSTRIAL SENSORS IN INDIUM MARKET, BY PURITY GRADE, 2018-2033 (USD THOUSAND)
TABLE 257 NORTH AMERICA VACUUM DEPOSITION COATINGS IN INDIUM MARKET, BY PURITY GRADE, 2018-2033 (USD THOUSAND)
TABLE 258 NORTH AMERICA PRECISION OPTICAL COMPONENTS IN INDIUM MARKET, BY PURITY GRADE, 2018-2033 (USD THOUSAND)
TABLE 259 NORTH AMERICA THERMAL INTERFACE MATERIALS IN INDIUM MARKET, BY PURITY GRADE, 2018-2033 (USD THOUSAND)
TABLE 260 NORTH AMERICA INDUSTRIAL LASER SYSTEMS IN INDIUM MARKET, BY PURITY GRADE, 2018-2033 (USD THOUSAND)
TABLE 261 NORTH AMERICA INDUSTRIAL INFRARED DETECTORS IN INDIUM MARKET, BY PURITY GRADE, 2018-2033 (USD THOUSAND)
TABLE 262 NORTH AMERICA PRECISION MEASUREMENT EQUIPMENT IN INDIUM MARKET, BY PURITY GRADE, 2018-2033 (USD THOUSAND)
TABLE 263 NORTH AMERICA SPECIALTY ELECTRONIC COMPONENTS IN INDIUM MARKET, BY PURITY GRADE, 2018-2033 (USD THOUSAND)
TABLE 264 NORTH AMERICA OTHERS IN INDIUM MARKET, BY TYPE, 2018-2033 (USD THOUSAND)
TABLE 265 NORTH AMERICA ADVANCED MATERIALS MANUFACTURING IN INDIUM MARKET, BY PURITY GRADE, 2018-2033 (USD THOUSAND)
TABLE 266 NORTH AMERICA SPECIALTY ALLOY PRODUCTION IN INDIUM MARKET, BY PURITY GRADE, 2018-2033 (USD THOUSAND)
TABLE 267 NORTH AMERICA THERMAL MANAGEMENT MATERIALS IN INDIUM MARKET, BY PURITY GRADE, 2018-2033 (USD THOUSAND)
TABLE 268 NORTH AMERICA PRECISION SCIENTIFIC INSTRUMENTS IN INDIUM MARKET, BY PURITY GRADE, 2018-2033 (USD THOUSAND)
TABLE 269 NORTH AMERICA RESEARCH INSTITUTES & UNIVERSITIES IN INDIUM MARKET, BY PURITY GRADE, 2018-2033 (USD THOUSAND)
TABLE 270 NORTH AMERICA NUCLEAR INDUSTRY APPLICATIONS IN INDIUM MARKET, BY PURITY GRADE, 2018-2033 (USD THOUSAND)
TABLE 271 NORTH AMERICA SPECIALTY CHEMICAL PRODUCTION IN INDIUM MARKET, BY PURITY GRADE, 2018-2033 (USD THOUSAND)
TABLE 272 NORTH AMERICA DEFENSE RESEARCH LABORATORIES IN INDIUM MARKET, BY PURITY GRADE, 2018-2033 (USD THOUSAND)
TABLE 273 NORTH AMERICA CRYOGENIC EQUIPMENT MANUFACTURING IN INDIUM MARKET, BY PURITY GRADE, 2018-2033 (USD THOUSAND)
TABLE 274 U.S. INDIUM MARKET, BY PRODUCT TYPE, 2018-2033 (USD THOUSAND)
TABLE 275 U.S. INGOTS IN INDIUM MARKET, BY TYPE, 2018-2033 (USD THOUSAND)
TABLE 276 U.S. INDIUM MARKET, BY MATERIAL COMPOSITION, 2018-2033 (USD THOUSAND)
TABLE 277 U.S. INDIUM ALLOYS IN INDIUM MARKET, BY TYPE, 2018-2033 (USD THOUSAND)
TABLE 278 U.S. INDIUM COMPOUNDS IN INDIUM MARKET, BY TYPE, 2018-2033 (USD THOUSAND)
TABLE 279 U.S. INDIUM MARKET, BY PURITY GRADE, 2018-2033 (USD THOUSAND)
TABLE 280 U.S. INDIUM MARKET, BY EXTRACTION SOURCE, 2018-2033 (USD THOUSAND)
TABLE 281 U.S. PRIMARY PRODUCTION IN INDIUM MARKET, BY TYPE, 2018-2033 (USD THOUSAND)
TABLE 282 U.S. SECONDARY PRODUCTION IN INDIUM MARKET, BY TYPE, 2018-2033 (USD THOUSAND)
TABLE 283 U.S. INDIUM MARKET, BY DISTRIBUTION CHANNEL, 2018-2033 (USD THOUSAND)
TABLE 284 U.S. INDIUM MARKET, BY TECHNOLOGY PLATFORM, 2018-2033 (USD THOUSAND)
TABLE 285 U.S. INDIUM MARKET, BY END-USER INDUSTRY, 2018-2033 (USD THOUSAND)
TABLE 286 U.S. CONSUMER ELECTRONICS INDUSTRY IN INDIUM MARKET, BY TYPE, 2018-2033 (USD THOUSAND)
TABLE 287 U.S. FLAT PANEL DISPLAYS (LCD/OLED/LED) IN INDIUM MARKET, BY PURITY GRADE, 2018-2033 (USD THOUSAND)
TABLE 288 U.S. TRANSPARENT CONDUCTIVE COATINGS (ITO) IN INDIUM MARKET, BY PURITY GRADE, 2018-2033 (USD THOUSAND)
TABLE 289 U.S. TOUCHSCREEN DISPLAYS IN INDIUM MARKET, BY PURITY GRADE, 2018-2033 (USD THOUSAND)
TABLE 290 U.S. FLEXIBLE DISPLAYS & ELECTRONICS IN INDIUM MARKET, BY PURITY GRADE, 2018-2033 (USD THOUSAND)
TABLE 291 U.S. WEARABLE ELECTRONICS DEVICES IN INDIUM MARKET, BY PURITY GRADE, 2018-2033 (USD THOUSAND)
TABLE 292 U.S. CAMERA & OPTICAL SENSORS IN INDIUM MARKET, BY PURITY GRADE, 2018-2033 (USD THOUSAND)
TABLE 293 U.S. MINI-LED BACKLIGHTING IN INDIUM MARKET, BY PURITY GRADE, 2018-2033 (USD THOUSAND)
TABLE 294 U.S. MICRO-LED DISPLAYS IN INDIUM MARKET, BY PURITY GRADE, 2018-2033 (USD THOUSAND)
TABLE 295 U.S. DISPLAY PANEL INDUSTRY IN INDIUM MARKET, BY TYPE, 2018-2033 (USD THOUSAND)
TABLE 296 U.S. LCD PANEL MANUFACTURING IN INDIUM MARKET, BY PURITY GRADE, 2018-2033 (USD THOUSAND)
TABLE 297 U.S. OLED PANEL MANUFACTURING IN INDIUM MARKET, BY PURITY GRADE, 2018-2033 (USD THOUSAND)
TABLE 298 U.S. DISPLAY PANEL MANUFACTURING IN INDIUM MARKET, BY PURITY GRADE, 2018-2033 (USD THOUSAND)
TABLE 299 U.S. TOUCH PANEL SENSORS IN INDIUM MARKET, BY PURITY GRADE, 2018-2033 (USD THOUSAND)
TABLE 300 U.S. TRANSPARENT CONDUCTIVE FILMS IN INDIUM MARKET, BY PURITY GRADE, 2018-2033 (USD THOUSAND)
TABLE 301 U.S. FLEXIBLE & FOLDABLE DISPLAYS IN INDIUM MARKET, BY PURITY GRADE, 2018-2033 (USD THOUSAND)
TABLE 302 U.S. AR/VR DISPLAYS IN INDIUM MARKET, BY PURITY GRADE, 2018-2033 (USD THOUSAND)
TABLE 303 U.S. MICRODISPLAY DEVICES IN INDIUM MARKET, BY PURITY GRADE, 2018-2033 (USD THOUSAND)
TABLE 304 U.S. BACKPLANE COATINGS IN INDIUM MARKET, BY PURITY GRADE, 2018-2033 (USD THOUSAND)
TABLE 305 U.S. SEMICONDUCTOR INDUSTRY IN INDIUM MARKET, BY TYPE, 2018-2033 (USD THOUSAND)
TABLE 306 U.S. III-V COMPOUND SEMICONDUCTORS IN INDIUM MARKET, BY PURITY GRADE, 2018-2033 (USD THOUSAND)
TABLE 307 U.S. HIGH-FREQUENCY RF COMPONENTS IN INDIUM MARKET, BY PURITY GRADE, 2018-2033 (USD THOUSAND)
TABLE 308 U.S. SEMICONDUCTOR SUBSTRATES & EPITAXY IN INDIUM MARKET, BY PURITY GRADE, 2018-2033 (USD THOUSAND)
TABLE 309 U.S. LASER DIODES IN INDIUM MARKET, BY PURITY GRADE, 2018-2033 (USD THOUSAND)
TABLE 310 U.S. PHOTODETECTORS IN INDIUM MARKET, BY PURITY GRADE, 2018-2033 (USD THOUSAND)
TABLE 311 U.S. HIGH-SPEED OPTOELECTRONICS IN INDIUM MARKET, BY PURITY GRADE, 2018-2033 (USD THOUSAND)
TABLE 312 U.S. INFRARED DETECTORS IN INDIUM MARKET, BY PURITY GRADE, 2018-2033 (USD THOUSAND)
TABLE 313 U.S. INTEGRATED PHOTONIC CIRCUITS IN INDIUM MARKET, BY PURITY GRADE, 2018-2033 (USD THOUSAND)
TABLE 314 U.S. SOLAR PHOTOVOLTAIC INDUSTRY IN INDIUM MARKET, BY TYPE, 2018-2033 (USD THOUSAND)
TABLE 315 U.S. CIGS THIN-FILM SOLAR CELLS IN INDIUM MARKET, BY PURITY GRADE, 2018-2033 (USD THOUSAND)
TABLE 316 U.S.HIGH-EFFICIENCY MODULES IN INDIUM MARKET, BY PURITY GRADE, 2018-2033 (USD THOUSAND)
TABLE 317 U.S. THIN-FILM COATINGS IN INDIUM MARKET, BY PURITY GRADE, 2018-2033 (USD THOUSAND)
TABLE 318 U.S. TRANSPARENT ELECTRODES IN INDIUM MARKET, BY PURITY GRADE, 2018-2033 (USD THOUSAND)
TABLE 319 U.S. BIPV IN INDIUM MARKET, BY PURITY GRADE, 2018-2033 (USD THOUSAND)
TABLE 320 U.S. FLEXIBLE SOLAR PANELS IN INDIUM MARKET, BY PURITY GRADE, 2018-2033 (USD THOUSAND)
TABLE 321 U.S. PORTABLE SOLAR SYSTEMS IN INDIUM MARKET, BY PURITY GRADE, 2018-2033 (USD THOUSAND)
TABLE 322 U.S. CONCENTRATED PV IN INDIUM MARKET, BY PURITY GRADE, 2018-2033 (USD THOUSAND)
TABLE 323 U.S. AUTOMOTIVE INDUSTRY IN INDIUM MARKET, BY TYPE, 2018-2033 (USD THOUSAND)
TABLE 324 U.S. AUTOMOTIVE DISPLAY PANELS IN INDIUM MARKET, BY PURITY GRADE, 2018-2033 (USD THOUSAND)
TABLE 325 U.S.ADAS SENSORS IN INDIUM MARKET, BY PURITY GRADE, 2018-2033 (USD THOUSAND)
TABLE 326 U.S. VEHICLE CAMERA MODULES IN INDIUM MARKET, BY PURITY GRADE, 2018-2033 (USD THOUSAND)
TABLE 327 U.S. AUTOMOTIVE OPTOELECTRONICS IN INDIUM MARKET, BY PURITY GRADE, 2018-2033 (USD THOUSAND)
TABLE 328 U.S. POWER ELECTRONICS IN INDIUM MARKET, BY PURITY GRADE, 2018-2033 (USD THOUSAND)
TABLE 329 U.S. TOUCHSCREEN INTERFACES IN INDIUM MARKET, BY PURITY GRADE, 2018-2033 (USD THOUSAND)
TABLE 330 U.S. INFRARED SENSORS IN INDIUM MARKET, BY PURITY GRADE, 2018-2033 (USD THOUSAND)
TABLE 331 U.S. SMART LIGHTING IN INDIUM MARKET, BY PURITY GRADE, 2018-2033 (USD THOUSAND)
TABLE 332 U.S. TELECOMMUNICATION EQUIPMENT INDUSTRY IN INDIUM MARKET, BY TYPE, 2018-2033 (USD THOUSAND)
TABLE 333 U.S. OPTICAL TRANSCEIVERS IN INDIUM MARKET, BY PURITY GRADE, 2018-2033 (USD THOUSAND)
TABLE 334 U.S. RF POWER AMPLIFIERS IN INDIUM MARKET, BY PURITY GRADE, 2018-2033 (USD THOUSAND)
TABLE 335 U.S. HIGH-FREQUENCY COMMUNICATION CHIPS IN INDIUM MARKET, BY PURITY GRADE, 2018-2033 (USD THOUSAND)
TABLE 336 U.S. FIBER-OPTIC COMMUNICATION LASERS IN INDIUM MARKET, BY PURITY GRADE, 2018-2033 (USD THOUSAND)
TABLE 337 U.S. PHOTODETECTORS FOR OPTICAL NETWORKS IN INDIUM MARKET, BY PURITY GRADE, 2018-2033 (USD THOUSAND)
TABLE 338 U.S. 5G INFRASTRUCTURE COMPONENTS IN INDIUM MARKET, BY PURITY GRADE, 2018-2033 (USD THOUSAND)
TABLE 339 U.S. OPTICAL NETWORK SWITCHING DEVICES IN INDIUM MARKET, BY PURITY GRADE, 2018-2033 (USD THOUSAND)
TABLE 340 U.S. SATELLITE COMMUNICATION MODULES IN INDIUM MARKET, BY PURITY GRADE, 2018-2033 (USD THOUSAND)
TABLE 341 U.S. OPTICAL & PHOTONICS INDUSTRY IN INDIUM MARKET, BY TYPE, 2018-2033 (USD THOUSAND)
TABLE 342 U.S. OPTICAL COATINGS IN INDIUM MARKET, BY PURITY GRADE, 2018-2033 (USD THOUSAND)
TABLE 343 U.S. FIBER OPTIC COMPONENTS IN INDIUM MARKET, BY PURITY GRADE, 2018-2033 (USD THOUSAND)
TABLE 344 U.S. LASER COMPONENTS IN INDIUM MARKET, BY PURITY GRADE, 2018-2033 (USD THOUSAND)
TABLE 345 U.S. OPTICAL SENSORS IN INDIUM MARKET, BY PURITY GRADE, 2018-2033 (USD THOUSAND)
TABLE 346 U.S. INFRARED OPTICS IN INDIUM MARKET, BY PURITY GRADE, 2018-2033 (USD THOUSAND)
TABLE 347 U.S. PICS IN INDIUM MARKET, BY PURITY GRADE, 2018-2033 (USD THOUSAND)
TABLE 348 U.S. MIRRORS IN INDIUM MARKET, BY PURITY GRADE, 2018-2033 (USD THOUSAND)
TABLE 349 U.S. SPECTROSCOPY IN INDIUM MARKET, BY PURITY GRADE, 2018-2033 (USD THOUSAND)
TABLE 350 U.S. AEROSPACE & DEFENSE INDUSTRY IN INDIUM MARKET, BY TYPE, 2018-2033 (USD THOUSAND)
TABLE 351 U.S. INFRARED IMAGING SYSTEMS IN INDIUM MARKET, BY PURITY GRADE, 2018-2033 (USD THOUSAND)
TABLE 352 U.S. RADAR & RF COMPONENTS IN INDIUM MARKET, BY PURITY GRADE, 2018-2033 (USD THOUSAND)
TABLE 353 U.S. SATELLITE COMMUNICATION IN INDIUM MARKET, BY PURITY GRADE, 2018-2033 (USD THOUSAND)
TABLE 354 U.S. MILITARY OPTOELECTRONICS IN INDIUM MARKET, BY PURITY GRADE, 2018-2033 (USD THOUSAND)
TABLE 355 U.S. AVIONICS DISPLAYS IN INDIUM MARKET, BY PURITY GRADE, 2018-2033 (USD THOUSAND)
TABLE 356 U.S. SPACECRAFT SOLAR PANELS IN INDIUM MARKET, BY PURITY GRADE, 2018-2033 (USD THOUSAND)
TABLE 357 U.S. THERMAL MATERIALS IN INDIUM MARKET, BY PURITY GRADE, 2018-2033 (USD THOUSAND)
TABLE 358 U.S. CRYOGENIC MATERIALS IN INDIUM MARKET, BY PURITY GRADE, 2018-2033 (USD THOUSAND)
TABLE 359 U.S. MEDICAL DEVICE INDUSTRY IN INDIUM MARKET, BY TYPE, 2018-2033 (USD THOUSAND)
TABLE 360 U.S. MEDICAL IMAGING SENSORS IN INDIUM MARKET, BY PURITY GRADE, 2018-2033 (USD THOUSAND)
TABLE 361 U.S. DIAGNOSTIC EQUIPMENT DISPLAYS IN INDIUM MARKET, BY PURITY GRADE, 2018-2033 (USD THOUSAND)
TABLE 362 U.S. ADVANCED DIAGNOSTIC INSTRUMENTS IN INDIUM MARKET, BY PURITY GRADE, 2018-2033 (USD THOUSAND)
TABLE 363 U.S. LASER SURGICAL EQUIPMENT IN INDIUM MARKET, BY PURITY GRADE, 2018-2033 (USD THOUSAND)
TABLE 364 U.S. BIOMEDICAL OPTICAL DEVICES IN INDIUM MARKET, BY PURITY GRADE, 2018-2033 (USD THOUSAND)
TABLE 365 U.S. RADIATION DETECTION EQUIPMENT IN INDIUM MARKET, BY PURITY GRADE, 2018-2033 (USD THOUSAND)
TABLE 366 U.S. INFRARED MEDICAL SENSORS IN INDIUM MARKET, BY PURITY GRADE, 2018-2033 (USD THOUSAND)
TABLE 367 U.S. PHOTOTHERAPY DEVICES IN INDIUM MARKET, BY PURITY GRADE, 2018-2033 (USD THOUSAND)
TABLE 368 U.S. INDUSTRIAL EQUIPMENT MANUFACTURING IN INDIUM MARKET, BY TYPE, 2018-2033 (USD THOUSAND)
TABLE 369 U.S. INDUSTRIAL SENSORS IN INDIUM MARKET, BY PURITY GRADE, 2018-2033 (USD THOUSAND)
TABLE 370 U.S. VACUUM DEPOSITION COATINGS IN INDIUM MARKET, BY PURITY GRADE, 2018-2033 (USD THOUSAND)
TABLE 371 U.S. PRECISION OPTICAL COMPONENTS IN INDIUM MARKET, BY PURITY GRADE, 2018-2033 (USD THOUSAND)
TABLE 372 U.S. THERMAL INTERFACE MATERIALS IN INDIUM MARKET, BY PURITY GRADE, 2018-2033 (USD THOUSAND)
TABLE 373 U.S. INDUSTRIAL LASER SYSTEMS IN INDIUM MARKET, BY PURITY GRADE, 2018-2033 (USD THOUSAND)
TABLE 374 U.S. INDUSTRIAL INFRARED DETECTORS IN INDIUM MARKET, BY PURITY GRADE, 2018-2033 (USD THOUSAND)
TABLE 375 U.S. PRECISION MEASUREMENT EQUIPMENT IN INDIUM MARKET, BY PURITY GRADE, 2018-2033 (USD THOUSAND)
TABLE 376 U.S. SPECIALTY ELECTRONIC COMPONENTS IN INDIUM MARKET, BY PURITY GRADE, 2018-2033 (USD THOUSAND)
TABLE 377 U.S. OTHERS IN INDIUM MARKET, BY TYPE, 2018-2033 (USD THOUSAND)
TABLE 378 U.S. ADVANCED MATERIALS MANUFACTURING IN INDIUM MARKET, BY PURITY GRADE, 2018-2033 (USD THOUSAND)
TABLE 379 U.S. SPECIALTY ALLOY PRODUCTION IN INDIUM MARKET, BY PURITY GRADE, 2018-2033 (USD THOUSAND)
TABLE 380 U.S. THERMAL MANAGEMENT MATERIALS IN INDIUM MARKET, BY PURITY GRADE, 2018-2033 (USD THOUSAND)
TABLE 381 U.S. PRECISION SCIENTIFIC INSTRUMENTS IN INDIUM MARKET, BY PURITY GRADE, 2018-2033 (USD THOUSAND)
TABLE 382 U.S. RESEARCH INSTITUTES & UNIVERSITIES IN INDIUM MARKET, BY PURITY GRADE, 2018-2033 (USD THOUSAND)
TABLE 383 U.S. NUCLEAR INDUSTRY APPLICATIONS IN INDIUM MARKET, BY PURITY GRADE, 2018-2033 (USD THOUSAND)
TABLE 384 U.S. SPECIALTY CHEMICAL PRODUCTION IN INDIUM MARKET, BY PURITY GRADE, 2018-2033 (USD THOUSAND)
TABLE 385 U.S. DEFENSE RESEARCH LABORATORIES IN INDIUM MARKET, BY PURITY GRADE, 2018-2033 (USD THOUSAND)
TABLE 386 U.S. CRYOGENIC EQUIPMENT MANUFACTURING IN INDIUM MARKET, BY PURITY GRADE, 2018-2033 (USD THOUSAND)
TABLE 387 CANADA INDIUM MARKET, BY PRODUCT TYPE, 2018-2033 (USD THOUSAND)
TABLE 388 CANADA INGOTS IN INDIUM MARKET, BY TYPE, 2018-2033 (USD THOUSAND)
TABLE 389 CANADA INDIUM MARKET, BY MATERIAL COMPOSITION, 2018-2033 (USD THOUSAND)
TABLE 390 CANADA INDIUM ALLOYS IN INDIUM MARKET, BY TYPE, 2018-2033 (USD THOUSAND)
TABLE 391 CANADA INDIUM COMPOUNDS IN INDIUM MARKET, BY TYPE, 2018-2033 (USD THOUSAND)
TABLE 392 CANADA INDIUM MARKET, BY PURITY GRADE, 2018-2033 (USD THOUSAND)
TABLE 393 CANADA INDIUM MARKET, BY EXTRACTION SOURCE, 2018-2033 (USD THOUSAND)
TABLE 394 CANADA PRIMARY PRODUCTION IN INDIUM MARKET, BY TYPE, 2018-2033 (USD THOUSAND)
TABLE 395 CANADA SECONDARY PRODUCTION IN INDIUM MARKET, BY TYPE, 2018-2033 (USD THOUSAND)
TABLE 396 CANADA INDIUM MARKET, BY DISTRIBUTION CHANNEL, 2018-2033 (USD THOUSAND)
TABLE 397 CANADA INDIUM MARKET, BY TECHNOLOGY PLATFORM, 2018-2033 (USD THOUSAND)
TABLE 398 CANADA INDIUM MARKET, BY END-USER INDUSTRY, 2018-2033 (USD THOUSAND)
TABLE 399 CANADA CONSUMER ELECTRONICS INDUSTRY IN INDIUM MARKET, BY TYPE, 2018-2033 (USD THOUSAND)
TABLE 400 CANADA FLAT PANEL DISPLAYS (LCD/OLED/LED) IN INDIUM MARKET, BY PURITY GRADE, 2018-2033 (USD THOUSAND)
TABLE 401 CANADA TRANSPARENT CONDUCTIVE COATINGS (ITO) IN INDIUM MARKET, BY PURITY GRADE, 2018-2033 (USD THOUSAND)
TABLE 402 CANADA TOUCHSCREEN DISPLAYS IN INDIUM MARKET, BY PURITY GRADE, 2018-2033 (USD THOUSAND)
TABLE 403 CANADA FLEXIBLE DISPLAYS & ELECTRONICS IN INDIUM MARKET, BY PURITY GRADE, 2018-2033 (USD THOUSAND)
TABLE 404 CANADA WEARABLE ELECTRONICS DEVICES IN INDIUM MARKET, BY PURITY GRADE, 2018-2033 (USD THOUSAND)
TABLE 405 CANADA CAMERA & OPTICAL SENSORS IN INDIUM MARKET, BY PURITY GRADE, 2018-2033 (USD THOUSAND)
TABLE 406 CANADA MINI-LED BACKLIGHTING IN INDIUM MARKET, BY PURITY GRADE, 2018-2033 (USD THOUSAND)
TABLE 407 CANADA MICRO-LED DISPLAYS IN INDIUM MARKET, BY PURITY GRADE, 2018-2033 (USD THOUSAND)
TABLE 408 CANADA DISPLAY PANEL INDUSTRY IN INDIUM MARKET, BY TYPE, 2018-2033 (USD THOUSAND)
TABLE 409 CANADA LCD PANEL MANUFACTURING IN INDIUM MARKET, BY PURITY GRADE, 2018-2033 (USD THOUSAND)
TABLE 410 CANADA OLED PANEL MANUFACTURING IN INDIUM MARKET, BY PURITY GRADE, 2018-2033 (USD THOUSAND)
TABLE 411 CANADA DISPLAY PANEL MANUFACTURING IN INDIUM MARKET, BY PURITY GRADE, 2018-2033 (USD THOUSAND)
TABLE 412 CANADA TOUCH PANEL SENSORS IN INDIUM MARKET, BY PURITY GRADE, 2018-2033 (USD THOUSAND)
TABLE 413 CANADA TRANSPARENT CONDUCTIVE FILMS IN INDIUM MARKET, BY PURITY GRADE, 2018-2033 (USD THOUSAND)
TABLE 414 CANADA FLEXIBLE & FOLDABLE DISPLAYS IN INDIUM MARKET, BY PURITY GRADE, 2018-2033 (USD THOUSAND)
TABLE 415 CANADA AR/VR DISPLAYS IN INDIUM MARKET, BY PURITY GRADE, 2018-2033 (USD THOUSAND)
TABLE 416 CANADA MICRODISPLAY DEVICES IN INDIUM MARKET, BY PURITY GRADE, 2018-2033 (USD THOUSAND)
TABLE 417 CANADA BACKPLANE COATINGS IN INDIUM MARKET, BY PURITY GRADE, 2018-2033 (USD THOUSAND)
TABLE 418 CANADA SEMICONDUCTOR INDUSTRY IN INDIUM MARKET, BY TYPE, 2018-2033 (USD THOUSAND)
TABLE 419 CANADA III-V COMPOUND SEMICONDUCTORS IN INDIUM MARKET, BY PURITY GRADE, 2018-2033 (USD THOUSAND)
TABLE 420 CANADA HIGH-FREQUENCY RF COMPONENTS IN INDIUM MARKET, BY PURITY GRADE, 2018-2033 (USD THOUSAND)
TABLE 421 CANADA SEMICONDUCTOR SUBSTRATES & EPITAXY IN INDIUM MARKET, BY PURITY GRADE, 2018-2033 (USD THOUSAND)
TABLE 422 CANADA LASER DIODES IN INDIUM MARKET, BY PURITY GRADE, 2018-2033 (USD THOUSAND)
TABLE 423 CANADA PHOTODETECTORS IN INDIUM MARKET, BY PURITY GRADE, 2018-2033 (USD THOUSAND)
TABLE 424 CANADA HIGH-SPEED OPTOELECTRONICS IN INDIUM MARKET, BY PURITY GRADE, 2018-2033 (USD THOUSAND)
TABLE 425 CANADA INFRARED DETECTORS IN INDIUM MARKET, BY PURITY GRADE, 2018-2033 (USD THOUSAND)
TABLE 426 CANADA INTEGRATED PHOTONIC CIRCUITS IN INDIUM MARKET, BY PURITY GRADE, 2018-2033 (USD THOUSAND)
TABLE 427 CANADA SOLAR PHOTOVOLTAIC INDUSTRY IN INDIUM MARKET, BY TYPE, 2018-2033 (USD THOUSAND)
TABLE 428 CANADA CIGS THIN-FILM SOLAR CELLS IN INDIUM MARKET, BY PURITY GRADE, 2018-2033 (USD THOUSAND)
TABLE 429 CANADAHIGH-EFFICIENCY MODULES IN INDIUM MARKET, BY PURITY GRADE, 2018-2033 (USD THOUSAND)
TABLE 430 CANADA THIN-FILM COATINGS IN INDIUM MARKET, BY PURITY GRADE, 2018-2033 (USD THOUSAND)
TABLE 431 CANADA TRANSPARENT ELECTRODES IN INDIUM MARKET, BY PURITY GRADE, 2018-2033 (USD THOUSAND)
TABLE 432 CANADA BIPV IN INDIUM MARKET, BY PURITY GRADE, 2018-2033 (USD THOUSAND)
TABLE 433 CANADA FLEXIBLE SOLAR PANELS IN INDIUM MARKET, BY PURITY GRADE, 2018-2033 (USD THOUSAND)
TABLE 434 CANADA PORTABLE SOLAR SYSTEMS IN INDIUM MARKET, BY PURITY GRADE, 2018-2033 (USD THOUSAND)
TABLE 435 CANADA CONCENTRATED PV IN INDIUM MARKET, BY PURITY GRADE, 2018-2033 (USD THOUSAND)
TABLE 436 CANADA AUTOMOTIVE INDUSTRY IN INDIUM MARKET, BY TYPE, 2018-2033 (USD THOUSAND)
TABLE 437 CANADA AUTOMOTIVE DISPLAY PANELS IN INDIUM MARKET, BY PURITY GRADE, 2018-2033 (USD THOUSAND)
TABLE 438 CANADAADAS SENSORS IN INDIUM MARKET, BY PURITY GRADE, 2018-2033 (USD THOUSAND)
TABLE 439 CANADA VEHICLE CAMERA MODULES IN INDIUM MARKET, BY PURITY GRADE, 2018-2033 (USD THOUSAND)
TABLE 440 CANADA AUTOMOTIVE OPTOELECTRONICS IN INDIUM MARKET, BY PURITY GRADE, 2018-2033 (USD THOUSAND)
TABLE 441 CANADA POWER ELECTRONICS IN INDIUM MARKET, BY PURITY GRADE, 2018-2033 (USD THOUSAND)
TABLE 442 CANADA TOUCHSCREEN INTERFACES IN INDIUM MARKET, BY PURITY GRADE, 2018-2033 (USD THOUSAND)
TABLE 443 CANADA INFRARED SENSORS IN INDIUM MARKET, BY PURITY GRADE, 2018-2033 (USD THOUSAND)
TABLE 444 CANADA SMART LIGHTING IN INDIUM MARKET, BY PURITY GRADE, 2018-2033 (USD THOUSAND)
TABLE 445 CANADA TELECOMMUNICATION EQUIPMENT INDUSTRY IN INDIUM MARKET, BY TYPE, 2018-2033 (USD THOUSAND)
TABLE 446 CANADA OPTICAL TRANSCEIVERS IN INDIUM MARKET, BY PURITY GRADE, 2018-2033 (USD THOUSAND)
TABLE 447 CANADA RF POWER AMPLIFIERS IN INDIUM MARKET, BY PURITY GRADE, 2018-2033 (USD THOUSAND)
TABLE 448 CANADA HIGH-FREQUENCY COMMUNICATION CHIPS IN INDIUM MARKET, BY PURITY GRADE, 2018-2033 (USD THOUSAND)
TABLE 449 CANADA FIBER-OPTIC COMMUNICATION LASERS IN INDIUM MARKET, BY PURITY GRADE, 2018-2033 (USD THOUSAND)
TABLE 450 CANADA PHOTODETECTORS FOR OPTICAL NETWORKS IN INDIUM MARKET, BY PURITY GRADE, 2018-2033 (USD THOUSAND)
TABLE 451 CANADA 5G INFRASTRUCTURE COMPONENTS IN INDIUM MARKET, BY PURITY GRADE, 2018-2033 (USD THOUSAND)
TABLE 452 CANADA OPTICAL NETWORK SWITCHING DEVICES IN INDIUM MARKET, BY PURITY GRADE, 2018-2033 (USD THOUSAND)
TABLE 453 CANADA SATELLITE COMMUNICATION MODULES IN INDIUM MARKET, BY PURITY GRADE, 2018-2033 (USD THOUSAND)
TABLE 454 CANADA OPTICAL & PHOTONICS INDUSTRY IN INDIUM MARKET, BY TYPE, 2018-2033 (USD THOUSAND)
TABLE 455 CANADA OPTICAL COATINGS IN INDIUM MARKET, BY PURITY GRADE, 2018-2033 (USD THOUSAND)
TABLE 456 CANADA FIBER OPTIC COMPONENTS IN INDIUM MARKET, BY PURITY GRADE, 2018-2033 (USD THOUSAND)
TABLE 457 CANADA LASER COMPONENTS IN INDIUM MARKET, BY PURITY GRADE, 2018-2033 (USD THOUSAND)
TABLE 458 CANADA OPTICAL SENSORS IN INDIUM MARKET, BY PURITY GRADE, 2018-2033 (USD THOUSAND)
TABLE 459 CANADA INFRARED OPTICS IN INDIUM MARKET, BY PURITY GRADE, 2018-2033 (USD THOUSAND)
TABLE 460 CANADA PICS IN INDIUM MARKET, BY PURITY GRADE, 2018-2033 (USD THOUSAND)
TABLE 461 CANADA MIRRORS IN INDIUM MARKET, BY PURITY GRADE, 2018-2033 (USD THOUSAND)
TABLE 462 CANADA SPECTROSCOPY IN INDIUM MARKET, BY PURITY GRADE, 2018-2033 (USD THOUSAND)
TABLE 463 CANADA AEROSPACE & DEFENSE INDUSTRY IN INDIUM MARKET, BY TYPE, 2018-2033 (USD THOUSAND)
TABLE 464 CANADA INFRARED IMAGING SYSTEMS IN INDIUM MARKET, BY PURITY GRADE, 2018-2033 (USD THOUSAND)
TABLE 465 CANADA RADAR & RF COMPONENTS IN INDIUM MARKET, BY PURITY GRADE, 2018-2033 (USD THOUSAND)
TABLE 466 CANADA SATELLITE COMMUNICATION IN INDIUM MARKET, BY PURITY GRADE, 2018-2033 (USD THOUSAND)
TABLE 467 CANADA MILITARY OPTOELECTRONICS IN INDIUM MARKET, BY PURITY GRADE, 2018-2033 (USD THOUSAND)
TABLE 468 CANADA AVIONICS DISPLAYS IN INDIUM MARKET, BY PURITY GRADE, 2018-2033 (USD THOUSAND)
TABLE 469 CANADA SPACECRAFT SOLAR PANELS IN INDIUM MARKET, BY PURITY GRADE, 2018-2033 (USD THOUSAND)
TABLE 470 CANADA THERMAL MATERIALS IN INDIUM MARKET, BY PURITY GRADE, 2018-2033 (USD THOUSAND)
TABLE 471 CANADA CRYOGENIC MATERIALS IN INDIUM MARKET, BY PURITY GRADE, 2018-2033 (USD THOUSAND)
TABLE 472 CANADA MEDICAL DEVICE INDUSTRY IN INDIUM MARKET, BY TYPE, 2018-2033 (USD THOUSAND)
TABLE 473 CANADA MEDICAL IMAGING SENSORS IN INDIUM MARKET, BY PURITY GRADE, 2018-2033 (USD THOUSAND)
TABLE 474 CANADA DIAGNOSTIC EQUIPMENT DISPLAYS IN INDIUM MARKET, BY PURITY GRADE, 2018-2033 (USD THOUSAND)
TABLE 475 CANADA ADVANCED DIAGNOSTIC INSTRUMENTS IN INDIUM MARKET, BY PURITY GRADE, 2018-2033 (USD THOUSAND)
TABLE 476 CANADA LASER SURGICAL EQUIPMENT IN INDIUM MARKET, BY PURITY GRADE, 2018-2033 (USD THOUSAND)
TABLE 477 CANADA BIOMEDICAL OPTICAL DEVICES IN INDIUM MARKET, BY PURITY GRADE, 2018-2033 (USD THOUSAND)
TABLE 478 CANADA RADIATION DETECTION EQUIPMENT IN INDIUM MARKET, BY PURITY GRADE, 2018-2033 (USD THOUSAND)
TABLE 479 CANADA INFRARED MEDICAL SENSORS IN INDIUM MARKET, BY PURITY GRADE, 2018-2033 (USD THOUSAND)
TABLE 480 CANADA PHOTOTHERAPY DEVICES IN INDIUM MARKET, BY PURITY GRADE, 2018-2033 (USD THOUSAND)
TABLE 481 CANADA INDUSTRIAL EQUIPMENT MANUFACTURING IN INDIUM MARKET, BY TYPE, 2018-2033 (USD THOUSAND)
TABLE 482 CANADA INDUSTRIAL SENSORS IN INDIUM MARKET, BY PURITY GRADE, 2018-2033 (USD THOUSAND)
TABLE 483 CANADA VACUUM DEPOSITION COATINGS IN INDIUM MARKET, BY PURITY GRADE, 2018-2033 (USD THOUSAND)
TABLE 484 CANADA PRECISION OPTICAL COMPONENTS IN INDIUM MARKET, BY PURITY GRADE, 2018-2033 (USD THOUSAND)
TABLE 485 CANADA THERMAL INTERFACE MATERIALS IN INDIUM MARKET, BY PURITY GRADE, 2018-2033 (USD THOUSAND)
TABLE 486 CANADA INDUSTRIAL LASER SYSTEMS IN INDIUM MARKET, BY PURITY GRADE, 2018-2033 (USD THOUSAND)
TABLE 487 CANADA INDUSTRIAL INFRARED DETECTORS IN INDIUM MARKET, BY PURITY GRADE, 2018-2033 (USD THOUSAND)
TABLE 488 CANADA PRECISION MEASUREMENT EQUIPMENT IN INDIUM MARKET, BY PURITY GRADE, 2018-2033 (USD THOUSAND)
TABLE 489 CANADA SPECIALTY ELECTRONIC COMPONENTS IN INDIUM MARKET, BY PURITY GRADE, 2018-2033 (USD THOUSAND)
TABLE 490 CANADA OTHERS IN INDIUM MARKET, BY TYPE, 2018-2033 (USD THOUSAND)
TABLE 491 CANADA ADVANCED MATERIALS MANUFACTURING IN INDIUM MARKET, BY PURITY GRADE, 2018-2033 (USD THOUSAND)
TABLE 492 CANADA SPECIALTY ALLOY PRODUCTION IN INDIUM MARKET, BY PURITY GRADE, 2018-2033 (USD THOUSAND)
TABLE 493 CANADA THERMAL MANAGEMENT MATERIALS IN INDIUM MARKET, BY PURITY GRADE, 2018-2033 (USD THOUSAND)
TABLE 494 CANADA PRECISION SCIENTIFIC INSTRUMENTS IN INDIUM MARKET, BY PURITY GRADE, 2018-2033 (USD THOUSAND)
TABLE 495 CANADA RESEARCH INSTITUTES & UNIVERSITIES IN INDIUM MARKET, BY PURITY GRADE, 2018-2033 (USD THOUSAND)
TABLE 496 CANADA NUCLEAR INDUSTRY APPLICATIONS IN INDIUM MARKET, BY PURITY GRADE, 2018-2033 (USD THOUSAND)
TABLE 497 CANADA SPECIALTY CHEMICAL PRODUCTION IN INDIUM MARKET, BY PURITY GRADE, 2018-2033 (USD THOUSAND)
TABLE 498 CANADA DEFENSE RESEARCH LABORATORIES IN INDIUM MARKET, BY PURITY GRADE, 2018-2033 (USD THOUSAND)
TABLE 499 CANADA CRYOGENIC EQUIPMENT MANUFACTURING IN INDIUM MARKET, BY PURITY GRADE, 2018-2033 (USD THOUSAND)
TABLE 500 MEXICO INDIUM MARKET, BY PRODUCT TYPE, 2018-2033 (USD THOUSAND)
TABLE 501 MEXICO INGOTS IN INDIUM MARKET, BY TYPE, 2018-2033 (USD THOUSAND)
TABLE 502 MEXICO INDIUM MARKET, BY MATERIAL COMPOSITION, 2018-2033 (USD THOUSAND)
TABLE 503 MEXICO INDIUM ALLOYS IN INDIUM MARKET, BY TYPE, 2018-2033 (USD THOUSAND)
TABLE 504 MEXICO INDIUM COMPOUNDS IN INDIUM MARKET, BY TYPE, 2018-2033 (USD THOUSAND)
TABLE 505 MEXICO INDIUM MARKET, BY PURITY GRADE, 2018-2033 (USD THOUSAND)
TABLE 506 MEXICO INDIUM MARKET, BY EXTRACTION SOURCE, 2018-2033 (USD THOUSAND)
TABLE 507 MEXICO PRIMARY PRODUCTION IN INDIUM MARKET, BY TYPE, 2018-2033 (USD THOUSAND)
TABLE 508 MEXICO SECONDARY PRODUCTION IN INDIUM MARKET, BY TYPE, 2018-2033 (USD THOUSAND)
TABLE 509 MEXICO INDIUM MARKET, BY DISTRIBUTION CHANNEL, 2018-2033 (USD THOUSAND)
TABLE 510 MEXICO INDIUM MARKET, BY TECHNOLOGY PLATFORM, 2018-2033 (USD THOUSAND)
TABLE 511 MEXICO INDIUM MARKET, BY END-USER INDUSTRY, 2018-2033 (USD THOUSAND)
TABLE 512 MEXICO CONSUMER ELECTRONICS INDUSTRY IN INDIUM MARKET, BY TYPE, 2018-2033 (USD THOUSAND)
TABLE 513 MEXICO FLAT PANEL DISPLAYS (LCD/OLED/LED) IN INDIUM MARKET, BY PURITY GRADE, 2018-2033 (USD THOUSAND)
TABLE 514 MEXICO TRANSPARENT CONDUCTIVE COATINGS (ITO) IN INDIUM MARKET, BY PURITY GRADE, 2018-2033 (USD THOUSAND)
TABLE 515 MEXICO TOUCHSCREEN DISPLAYS IN INDIUM MARKET, BY PURITY GRADE, 2018-2033 (USD THOUSAND)
TABLE 516 MEXICO FLEXIBLE DISPLAYS & ELECTRONICS IN INDIUM MARKET, BY PURITY GRADE, 2018-2033 (USD THOUSAND)
TABLE 517 MEXICO WEARABLE ELECTRONICS DEVICES IN INDIUM MARKET, BY PURITY GRADE, 2018-2033 (USD THOUSAND)
TABLE 518 MEXICO CAMERA & OPTICAL SENSORS IN INDIUM MARKET, BY PURITY GRADE, 2018-2033 (USD THOUSAND)
TABLE 519 MEXICO MINI-LED BACKLIGHTING IN INDIUM MARKET, BY PURITY GRADE, 2018-2033 (USD THOUSAND)
TABLE 520 MEXICO MICRO-LED DISPLAYS IN INDIUM MARKET, BY PURITY GRADE, 2018-2033 (USD THOUSAND)
TABLE 521 MEXICO DISPLAY PANEL INDUSTRY IN INDIUM MARKET, BY TYPE, 2018-2033 (USD THOUSAND)
TABLE 522 MEXICO LCD PANEL MANUFACTURING IN INDIUM MARKET, BY PURITY GRADE, 2018-2033 (USD THOUSAND)
TABLE 523 MEXICO OLED PANEL MANUFACTURING IN INDIUM MARKET, BY PURITY GRADE, 2018-2033 (USD THOUSAND)
TABLE 524 MEXICO DISPLAY PANEL MANUFACTURING IN INDIUM MARKET, BY PURITY GRADE, 2018-2033 (USD THOUSAND)
TABLE 525 MEXICO TOUCH PANEL SENSORS IN INDIUM MARKET, BY PURITY GRADE, 2018-2033 (USD THOUSAND)
TABLE 526 MEXICO TRANSPARENT CONDUCTIVE FILMS IN INDIUM MARKET, BY PURITY GRADE, 2018-2033 (USD THOUSAND)
TABLE 527 MEXICO FLEXIBLE & FOLDABLE DISPLAYS IN INDIUM MARKET, BY PURITY GRADE, 2018-2033 (USD THOUSAND)
TABLE 528 MEXICO AR/VR DISPLAYS IN INDIUM MARKET, BY PURITY GRADE, 2018-2033 (USD THOUSAND)
TABLE 529 MEXICO MICRODISPLAY DEVICES IN INDIUM MARKET, BY PURITY GRADE, 2018-2033 (USD THOUSAND)
TABLE 530 MEXICO BACKPLANE COATINGS IN INDIUM MARKET, BY PURITY GRADE, 2018-2033 (USD THOUSAND)
TABLE 531 MEXICO SEMICONDUCTOR INDUSTRY IN INDIUM MARKET, BY TYPE, 2018-2033 (USD THOUSAND)
TABLE 532 MEXICO III-V COMPOUND SEMICONDUCTORS IN INDIUM MARKET, BY PURITY GRADE, 2018-2033 (USD THOUSAND)
TABLE 533 MEXICO HIGH-FREQUENCY RF COMPONENTS IN INDIUM MARKET, BY PURITY GRADE, 2018-2033 (USD THOUSAND)
TABLE 534 MEXICO SEMICONDUCTOR SUBSTRATES & EPITAXY IN INDIUM MARKET, BY PURITY GRADE, 2018-2033 (USD THOUSAND)
TABLE 535 MEXICO LASER DIODES IN INDIUM MARKET, BY PURITY GRADE, 2018-2033 (USD THOUSAND)
TABLE 536 MEXICO PHOTODETECTORS IN INDIUM MARKET, BY PURITY GRADE, 2018-2033 (USD THOUSAND)
TABLE 537 MEXICO HIGH-SPEED OPTOELECTRONICS IN INDIUM MARKET, BY PURITY GRADE, 2018-2033 (USD THOUSAND)
TABLE 538 MEXICO INFRARED DETECTORS IN INDIUM MARKET, BY PURITY GRADE, 2018-2033 (USD THOUSAND)
TABLE 539 MEXICO INTEGRATED PHOTONIC CIRCUITS IN INDIUM MARKET, BY PURITY GRADE, 2018-2033 (USD THOUSAND)
TABLE 540 MEXICO SOLAR PHOTOVOLTAIC INDUSTRY IN INDIUM MARKET, BY TYPE, 2018-2033 (USD THOUSAND)
TABLE 541 MEXICO CIGS THIN-FILM SOLAR CELLS IN INDIUM MARKET, BY PURITY GRADE, 2018-2033 (USD THOUSAND)
TABLE 542 MEXICOHIGH-EFFICIENCY MODULES IN INDIUM MARKET, BY PURITY GRADE, 2018-2033 (USD THOUSAND)
TABLE 543 MEXICO THIN-FILM COATINGS IN INDIUM MARKET, BY PURITY GRADE, 2018-2033 (USD THOUSAND)
TABLE 544 MEXICO TRANSPARENT ELECTRODES IN INDIUM MARKET, BY PURITY GRADE, 2018-2033 (USD THOUSAND)
TABLE 545 MEXICO BIPV IN INDIUM MARKET, BY PURITY GRADE, 2018-2033 (USD THOUSAND)
TABLE 546 MEXICO FLEXIBLE SOLAR PANELS IN INDIUM MARKET, BY PURITY GRADE, 2018-2033 (USD THOUSAND)
TABLE 547 MEXICO PORTABLE SOLAR SYSTEMS IN INDIUM MARKET, BY PURITY GRADE, 2018-2033 (USD THOUSAND)
TABLE 548 MEXICO CONCENTRATED PV IN INDIUM MARKET, BY PURITY GRADE, 2018-2033 (USD THOUSAND)
TABLE 549 MEXICO AUTOMOTIVE INDUSTRY IN INDIUM MARKET, BY TYPE, 2018-2033 (USD THOUSAND)
TABLE 550 MEXICO AUTOMOTIVE DISPLAY PANELS IN INDIUM MARKET, BY PURITY GRADE, 2018-2033 (USD THOUSAND)
TABLE 551 MEXICOADAS SENSORS IN INDIUM MARKET, BY PURITY GRADE, 2018-2033 (USD THOUSAND)
TABLE 552 MEXICO VEHICLE CAMERA MODULES IN INDIUM MARKET, BY PURITY GRADE, 2018-2033 (USD THOUSAND)
TABLE 553 MEXICO AUTOMOTIVE OPTOELECTRONICS IN INDIUM MARKET, BY PURITY GRADE, 2018-2033 (USD THOUSAND)
TABLE 554 MEXICO POWER ELECTRONICS IN INDIUM MARKET, BY PURITY GRADE, 2018-2033 (USD THOUSAND)
TABLE 555 MEXICO TOUCHSCREEN INTERFACES IN INDIUM MARKET, BY PURITY GRADE, 2018-2033 (USD THOUSAND)
TABLE 556 MEXICO INFRARED SENSORS IN INDIUM MARKET, BY PURITY GRADE, 2018-2033 (USD THOUSAND)
TABLE 557 MEXICO SMART LIGHTING IN INDIUM MARKET, BY PURITY GRADE, 2018-2033 (USD THOUSAND)
TABLE 558 MEXICO TELECOMMUNICATION EQUIPMENT INDUSTRY IN INDIUM MARKET, BY TYPE, 2018-2033 (USD THOUSAND)
TABLE 559 MEXICO OPTICAL TRANSCEIVERS IN INDIUM MARKET, BY PURITY GRADE, 2018-2033 (USD THOUSAND)
TABLE 560 MEXICO RF POWER AMPLIFIERS IN INDIUM MARKET, BY PURITY GRADE, 2018-2033 (USD THOUSAND)
TABLE 561 MEXICO HIGH-FREQUENCY COMMUNICATION CHIPS IN INDIUM MARKET, BY PURITY GRADE, 2018-2033 (USD THOUSAND)
TABLE 562 MEXICO FIBER-OPTIC COMMUNICATION LASERS IN INDIUM MARKET, BY PURITY GRADE, 2018-2033 (USD THOUSAND)
TABLE 563 MEXICO PHOTODETECTORS FOR OPTICAL NETWORKS IN INDIUM MARKET, BY PURITY GRADE, 2018-2033 (USD THOUSAND)
TABLE 564 MEXICO 5G INFRASTRUCTURE COMPONENTS IN INDIUM MARKET, BY PURITY GRADE, 2018-2033 (USD THOUSAND)
TABLE 565 MEXICO OPTICAL NETWORK SWITCHING DEVICES IN INDIUM MARKET, BY PURITY GRADE, 2018-2033 (USD THOUSAND)
TABLE 566 MEXICO SATELLITE COMMUNICATION MODULES IN INDIUM MARKET, BY PURITY GRADE, 2018-2033 (USD THOUSAND)
TABLE 567 MEXICO OPTICAL & PHOTONICS INDUSTRY IN INDIUM MARKET, BY TYPE, 2018-2033 (USD THOUSAND)
TABLE 568 MEXICO OPTICAL COATINGS IN INDIUM MARKET, BY PURITY GRADE, 2018-2033 (USD THOUSAND)
TABLE 569 MEXICO FIBER OPTIC COMPONENTS IN INDIUM MARKET, BY PURITY GRADE, 2018-2033 (USD THOUSAND)
TABLE 570 MEXICO LASER COMPONENTS IN INDIUM MARKET, BY PURITY GRADE, 2018-2033 (USD THOUSAND)
TABLE 571 MEXICO OPTICAL SENSORS IN INDIUM MARKET, BY PURITY GRADE, 2018-2033 (USD THOUSAND)
TABLE 572 MEXICO INFRARED OPTICS IN INDIUM MARKET, BY PURITY GRADE, 2018-2033 (USD THOUSAND)
TABLE 573 MEXICO PICS IN INDIUM MARKET, BY PURITY GRADE, 2018-2033 (USD THOUSAND)
TABLE 574 MEXICO MIRRORS IN INDIUM MARKET, BY PURITY GRADE, 2018-2033 (USD THOUSAND)
TABLE 575 MEXICO SPECTROSCOPY IN INDIUM MARKET, BY PURITY GRADE, 2018-2033 (USD THOUSAND)
TABLE 576 MEXICO AEROSPACE & DEFENSE INDUSTRY IN INDIUM MARKET, BY TYPE, 2018-2033 (USD THOUSAND)
TABLE 577 MEXICO INFRARED IMAGING SYSTEMS IN INDIUM MARKET, BY PURITY GRADE, 2018-2033 (USD THOUSAND)
TABLE 578 MEXICO RADAR & RF COMPONENTS IN INDIUM MARKET, BY PURITY GRADE, 2018-2033 (USD THOUSAND)
TABLE 579 MEXICO SATELLITE COMMUNICATION IN INDIUM MARKET, BY PURITY GRADE, 2018-2033 (USD THOUSAND)
TABLE 580 MEXICO MILITARY OPTOELECTRONICS IN INDIUM MARKET, BY PURITY GRADE, 2018-2033 (USD THOUSAND)
TABLE 581 MEXICO AVIONICS DISPLAYS IN INDIUM MARKET, BY PURITY GRADE, 2018-2033 (USD THOUSAND)
TABLE 582 MEXICO SPACECRAFT SOLAR PANELS IN INDIUM MARKET, BY PURITY GRADE, 2018-2033 (USD THOUSAND)
TABLE 583 MEXICO THERMAL MATERIALS IN INDIUM MARKET, BY PURITY GRADE, 2018-2033 (USD THOUSAND)
TABLE 584 MEXICO CRYOGENIC MATERIALS IN INDIUM MARKET, BY PURITY GRADE, 2018-2033 (USD THOUSAND)
TABLE 585 MEXICO MEDICAL DEVICE INDUSTRY IN INDIUM MARKET, BY TYPE, 2018-2033 (USD THOUSAND)
TABLE 586 MEXICO MEDICAL IMAGING SENSORS IN INDIUM MARKET, BY PURITY GRADE, 2018-2033 (USD THOUSAND)
TABLE 587 MEXICO DIAGNOSTIC EQUIPMENT DISPLAYS IN INDIUM MARKET, BY PURITY GRADE, 2018-2033 (USD THOUSAND)
TABLE 588 MEXICO ADVANCED DIAGNOSTIC INSTRUMENTS IN INDIUM MARKET, BY PURITY GRADE, 2018-2033 (USD THOUSAND)
TABLE 589 MEXICO LASER SURGICAL EQUIPMENT IN INDIUM MARKET, BY PURITY GRADE, 2018-2033 (USD THOUSAND)
TABLE 590 MEXICO BIOMEDICAL OPTICAL DEVICES IN INDIUM MARKET, BY PURITY GRADE, 2018-2033 (USD THOUSAND)
TABLE 591 MEXICO RADIATION DETECTION EQUIPMENT IN INDIUM MARKET, BY PURITY GRADE, 2018-2033 (USD THOUSAND)
TABLE 592 MEXICO INFRARED MEDICAL SENSORS IN INDIUM MARKET, BY PURITY GRADE, 2018-2033 (USD THOUSAND)
TABLE 593 MEXICO PHOTOTHERAPY DEVICES IN INDIUM MARKET, BY PURITY GRADE, 2018-2033 (USD THOUSAND)
TABLE 594 MEXICO INDUSTRIAL EQUIPMENT MANUFACTURING IN INDIUM MARKET, BY TYPE, 2018-2033 (USD THOUSAND)
TABLE 595 MEXICO INDUSTRIAL SENSORS IN INDIUM MARKET, BY PURITY GRADE, 2018-2033 (USD THOUSAND)
TABLE 596 MEXICO VACUUM DEPOSITION COATINGS IN INDIUM MARKET, BY PURITY GRADE, 2018-2033 (USD THOUSAND)
TABLE 597 MEXICO PRECISION OPTICAL COMPONENTS IN INDIUM MARKET, BY PURITY GRADE, 2018-2033 (USD THOUSAND)
TABLE 598 MEXICO THERMAL INTERFACE MATERIALS IN INDIUM MARKET, BY PURITY GRADE, 2018-2033 (USD THOUSAND)
TABLE 599 MEXICO INDUSTRIAL LASER SYSTEMS IN INDIUM MARKET, BY PURITY GRADE, 2018-2033 (USD THOUSAND)
TABLE 600 MEXICO INDUSTRIAL INFRARED DETECTORS IN INDIUM MARKET, BY PURITY GRADE, 2018-2033 (USD THOUSAND)
TABLE 601 MEXICO PRECISION MEASUREMENT EQUIPMENT IN INDIUM MARKET, BY PURITY GRADE, 2018-2033 (USD THOUSAND)
TABLE 602 MEXICO SPECIALTY ELECTRONIC COMPONENTS IN INDIUM MARKET, BY PURITY GRADE, 2018-2033 (USD THOUSAND)
TABLE 603 MEXICO OTHERS IN INDIUM MARKET, BY TYPE, 2018-2033 (USD THOUSAND)
TABLE 604 MEXICO ADVANCED MATERIALS MANUFACTURING IN INDIUM MARKET, BY PURITY GRADE, 2018-2033 (USD THOUSAND)
TABLE 605 MEXICO SPECIALTY ALLOY PRODUCTION IN INDIUM MARKET, BY PURITY GRADE, 2018-2033 (USD THOUSAND)
TABLE 606 MEXICO THERMAL MANAGEMENT MATERIALS IN INDIUM MARKET, BY PURITY GRADE, 2018-2033 (USD THOUSAND)
TABLE 607 MEXICO PRECISION SCIENTIFIC INSTRUMENTS IN INDIUM MARKET, BY PURITY GRADE, 2018-2033 (USD THOUSAND)
TABLE 608 MEXICO RESEARCH INSTITUTES & UNIVERSITIES IN INDIUM MARKET, BY PURITY GRADE, 2018-2033 (USD THOUSAND)
TABLE 609 MEXICO NUCLEAR INDUSTRY APPLICATIONS IN INDIUM MARKET, BY PURITY GRADE, 2018-2033 (USD THOUSAND)
TABLE 610 MEXICO SPECIALTY CHEMICAL PRODUCTION IN INDIUM MARKET, BY PURITY GRADE, 2018-2033 (USD THOUSAND)
TABLE 611 MEXICO DEFENSE RESEARCH LABORATORIES IN INDIUM MARKET, BY PURITY GRADE, 2018-2033 (USD THOUSAND)
TABLE 612 MEXICO CRYOGENIC EQUIPMENT MANUFACTURING IN INDIUM MARKET, BY PURITY GRADE, 2018-2033 (USD THOUSAND)
TABLE 613 EUROPE INDIUM MARKET, BY COUNTRY, 2018-2033 (USD THOUSAND)
TABLE 614 EUROPE INDIUM MARKET, BY PRODUCT TYPE, 2018-2033 (USD THOUSAND)
TABLE 615 EUROPE INGOTS IN INDIUM MARKET, BY TYPE, 2018-2033 (USD THOUSAND)
TABLE 616 EUROPE INDIUM MARKET, BY MATERIAL COMPOSITION, 2018-2033 (USD THOUSAND)
TABLE 617 EUROPE INDIUM ALLOYS IN INDIUM MARKET, BY TYPE, 2018-2033 (USD THOUSAND)
TABLE 618 EUROPE INDIUM COMPOUNDS IN INDIUM MARKET, BY TYPE, 2018-2033 (USD THOUSAND)
TABLE 619 EUROPE INDIUM MARKET, BY PURITY GRADE, 2018-2033 (USD THOUSAND)
TABLE 620 EUROPE INDIUM MARKET, BY EXTRACTION SOURCE, 2018-2033 (USD THOUSAND)
TABLE 621 EUROPE PRIMARY PRODUCTION IN INDIUM MARKET, BY TYPE, 2018-2033 (USD THOUSAND)
TABLE 622 EUROPE SECONDARY PRODUCTION IN INDIUM MARKET, BY TYPE, 2018-2033 (USD THOUSAND)
TABLE 623 EUROPE INDIUM MARKET, BY DISTRIBUTION CHANNEL, 2018-2033 (USD THOUSAND)
TABLE 624 EUROPE INDIUM MARKET, BY TECHNOLOGY PLATFORM, 2018-2033 (USD THOUSAND)
TABLE 625 EUROPE INDIUM MARKET, BY END-USER INDUSTRY, 2018-2033 (USD THOUSAND)
TABLE 626 EUROPE CONSUMER ELECTRONICS INDUSTRY IN INDIUM MARKET, BY TYPE, 2018-2033 (USD THOUSAND)
TABLE 627 EUROPE FLAT PANEL DISPLAYS (LCD/OLED/LED) IN INDIUM MARKET, BY PURITY GRADE, 2018-2033 (USD THOUSAND)
TABLE 628 EUROPE TRANSPARENT CONDUCTIVE COATINGS (ITO) IN INDIUM MARKET, BY PURITY GRADE, 2018-2033 (USD THOUSAND)
TABLE 629 EUROPE TOUCHSCREEN DISPLAYS IN INDIUM MARKET, BY PURITY GRADE, 2018-2033 (USD THOUSAND)
TABLE 630 EUROPE FLEXIBLE DISPLAYS & ELECTRONICS IN INDIUM MARKET, BY PURITY GRADE, 2018-2033 (USD THOUSAND)
TABLE 631 EUROPE WEARABLE ELECTRONICS DEVICES IN INDIUM MARKET, BY PURITY GRADE, 2018-2033 (USD THOUSAND)
TABLE 632 EUROPE CAMERA & OPTICAL SENSORS IN INDIUM MARKET, BY PURITY GRADE, 2018-2033 (USD THOUSAND)
TABLE 633 EUROPE MINI-LED BACKLIGHTING IN INDIUM MARKET, BY PURITY GRADE, 2018-2033 (USD THOUSAND)
TABLE 634 EUROPE MICRO-LED DISPLAYS IN INDIUM MARKET, BY PURITY GRADE, 2018-2033 (USD THOUSAND)
TABLE 635 EUROPE DISPLAY PANEL INDUSTRY IN INDIUM MARKET, BY TYPE, 2018-2033 (USD THOUSAND)
TABLE 636 EUROPE LCD PANEL MANUFACTURING IN INDIUM MARKET, BY PURITY GRADE, 2018-2033 (USD THOUSAND)
TABLE 637 EUROPE OLED PANEL MANUFACTURING IN INDIUM MARKET, BY PURITY GRADE, 2018-2033 (USD THOUSAND)
TABLE 638 EUROPE DISPLAY PANEL MANUFACTURING IN INDIUM MARKET, BY PURITY GRADE, 2018-2033 (USD THOUSAND)
TABLE 639 EUROPE TOUCH PANEL SENSORS IN INDIUM MARKET, BY PURITY GRADE, 2018-2033 (USD THOUSAND)
TABLE 640 EUROPE TRANSPARENT CONDUCTIVE FILMS IN INDIUM MARKET, BY PURITY GRADE, 2018-2033 (USD THOUSAND)
TABLE 641 EUROPE FLEXIBLE & FOLDABLE DISPLAYS IN INDIUM MARKET, BY PURITY GRADE, 2018-2033 (USD THOUSAND)
TABLE 642 EUROPE AR/VR DISPLAYS IN INDIUM MARKET, BY PURITY GRADE, 2018-2033 (USD THOUSAND)
TABLE 643 EUROPE MICRODISPLAY DEVICES IN INDIUM MARKET, BY PURITY GRADE, 2018-2033 (USD THOUSAND)
TABLE 644 EUROPE BACKPLANE COATINGS IN INDIUM MARKET, BY PURITY GRADE, 2018-2033 (USD THOUSAND)
TABLE 645 EUROPE SEMICONDUCTOR INDUSTRY IN INDIUM MARKET, BY TYPE, 2018-2033 (USD THOUSAND)
TABLE 646 EUROPE III-V COMPOUND SEMICONDUCTORS IN INDIUM MARKET, BY PURITY GRADE, 2018-2033 (USD THOUSAND)
TABLE 647 EUROPE HIGH-FREQUENCY RF COMPONENTS IN INDIUM MARKET, BY PURITY GRADE, 2018-2033 (USD THOUSAND)
TABLE 648 EUROPE SEMICONDUCTOR SUBSTRATES & EPITAXY IN INDIUM MARKET, BY PURITY GRADE, 2018-2033 (USD THOUSAND)
TABLE 649 EUROPE LASER DIODES IN INDIUM MARKET, BY PURITY GRADE, 2018-2033 (USD THOUSAND)
TABLE 650 EUROPE PHOTODETECTORS IN INDIUM MARKET, BY PURITY GRADE, 2018-2033 (USD THOUSAND)
TABLE 651 EUROPE HIGH-SPEED OPTOELECTRONICS IN INDIUM MARKET, BY PURITY GRADE, 2018-2033 (USD THOUSAND)
TABLE 652 EUROPE INFRARED DETECTORS IN INDIUM MARKET, BY PURITY GRADE, 2018-2033 (USD THOUSAND)
TABLE 653 EUROPE INTEGRATED PHOTONIC CIRCUITS IN INDIUM MARKET, BY PURITY GRADE, 2018-2033 (USD THOUSAND)
TABLE 654 EUROPE SOLAR PHOTOVOLTAIC INDUSTRY IN INDIUM MARKET, BY TYPE, 2018-2033 (USD THOUSAND)
TABLE 655 EUROPE CIGS THIN-FILM SOLAR CELLS IN INDIUM MARKET, BY PURITY GRADE, 2018-2033 (USD THOUSAND)
TABLE 656 EUROPEHIGH-EFFICIENCY MODULES IN INDIUM MARKET, BY PURITY GRADE, 2018-2033 (USD THOUSAND)
TABLE 657 EUROPE THIN-FILM COATINGS IN INDIUM MARKET, BY PURITY GRADE, 2018-2033 (USD THOUSAND)
TABLE 658 EUROPE TRANSPARENT ELECTRODES IN INDIUM MARKET, BY PURITY GRADE, 2018-2033 (USD THOUSAND)
TABLE 659 EUROPE BIPV IN INDIUM MARKET, BY PURITY GRADE, 2018-2033 (USD THOUSAND)
TABLE 660 EUROPE FLEXIBLE SOLAR PANELS IN INDIUM MARKET, BY PURITY GRADE, 2018-2033 (USD THOUSAND)
TABLE 661 EUROPE PORTABLE SOLAR SYSTEMS IN INDIUM MARKET, BY PURITY GRADE, 2018-2033 (USD THOUSAND)
TABLE 662 EUROPE CONCENTRATED PV IN INDIUM MARKET, BY PURITY GRADE, 2018-2033 (USD THOUSAND)
TABLE 663 EUROPE AUTOMOTIVE INDUSTRY IN INDIUM MARKET, BY TYPE, 2018-2033 (USD THOUSAND)
TABLE 664 EUROPE AUTOMOTIVE DISPLAY PANELS IN INDIUM MARKET, BY PURITY GRADE, 2018-2033 (USD THOUSAND)
TABLE 665 EUROPEADAS SENSORS IN INDIUM MARKET, BY PURITY GRADE, 2018-2033 (USD THOUSAND)
TABLE 666 EUROPE VEHICLE CAMERA MODULES IN INDIUM MARKET, BY PURITY GRADE, 2018-2033 (USD THOUSAND)
TABLE 667 EUROPE AUTOMOTIVE OPTOELECTRONICS IN INDIUM MARKET, BY PURITY GRADE, 2018-2033 (USD THOUSAND)
TABLE 668 EUROPE POWER ELECTRONICS IN INDIUM MARKET, BY PURITY GRADE, 2018-2033 (USD THOUSAND)
TABLE 669 EUROPE TOUCHSCREEN INTERFACES IN INDIUM MARKET, BY PURITY GRADE, 2018-2033 (USD THOUSAND)
TABLE 670 EUROPE INFRARED SENSORS IN INDIUM MARKET, BY PURITY GRADE, 2018-2033 (USD THOUSAND)
TABLE 671 EUROPE SMART LIGHTING IN INDIUM MARKET, BY PURITY GRADE, 2018-2033 (USD THOUSAND)
TABLE 672 EUROPE TELECOMMUNICATION EQUIPMENT INDUSTRY IN INDIUM MARKET, BY TYPE, 2018-2033 (USD THOUSAND)
TABLE 673 EUROPE OPTICAL TRANSCEIVERS IN INDIUM MARKET, BY PURITY GRADE, 2018-2033 (USD THOUSAND)
TABLE 674 EUROPE RF POWER AMPLIFIERS IN INDIUM MARKET, BY PURITY GRADE, 2018-2033 (USD THOUSAND)
TABLE 675 EUROPE HIGH-FREQUENCY COMMUNICATION CHIPS IN INDIUM MARKET, BY PURITY GRADE, 2018-2033 (USD THOUSAND)
TABLE 676 EUROPE FIBER-OPTIC COMMUNICATION LASERS IN INDIUM MARKET, BY PURITY GRADE, 2018-2033 (USD THOUSAND)
TABLE 677 EUROPE PHOTODETECTORS FOR OPTICAL NETWORKS IN INDIUM MARKET, BY PURITY GRADE, 2018-2033 (USD THOUSAND)
TABLE 678 EUROPE 5G INFRASTRUCTURE COMPONENTS IN INDIUM MARKET, BY PURITY GRADE, 2018-2033 (USD THOUSAND)
TABLE 679 EUROPE OPTICAL NETWORK SWITCHING DEVICES IN INDIUM MARKET, BY PURITY GRADE, 2018-2033 (USD THOUSAND)
TABLE 680 EUROPE SATELLITE COMMUNICATION MODULES IN INDIUM MARKET, BY PURITY GRADE, 2018-2033 (USD THOUSAND)
TABLE 681 EUROPE OPTICAL & PHOTONICS INDUSTRY IN INDIUM MARKET, BY TYPE, 2018-2033 (USD THOUSAND)
TABLE 682 EUROPE OPTICAL COATINGS IN INDIUM MARKET, BY PURITY GRADE, 2018-2033 (USD THOUSAND)
TABLE 683 EUROPE FIBER OPTIC COMPONENTS IN INDIUM MARKET, BY PURITY GRADE, 2018-2033 (USD THOUSAND)
TABLE 684 EUROPE LASER COMPONENTS IN INDIUM MARKET, BY PURITY GRADE, 2018-2033 (USD THOUSAND)
TABLE 685 EUROPE OPTICAL SENSORS IN INDIUM MARKET, BY PURITY GRADE, 2018-2033 (USD THOUSAND)
TABLE 686 EUROPE INFRARED OPTICS IN INDIUM MARKET, BY PURITY GRADE, 2018-2033 (USD THOUSAND)
TABLE 687 EUROPE PICS IN INDIUM MARKET, BY PURITY GRADE, 2018-2033 (USD THOUSAND)
TABLE 688 EUROPE MIRRORS IN INDIUM MARKET, BY PURITY GRADE, 2018-2033 (USD THOUSAND)
TABLE 689 EUROPE SPECTROSCOPY IN INDIUM MARKET, BY PURITY GRADE, 2018-2033 (USD THOUSAND)
TABLE 690 EUROPE AEROSPACE & DEFENSE INDUSTRY IN INDIUM MARKET, BY TYPE, 2018-2033 (USD THOUSAND)
TABLE 691 EUROPE INFRARED IMAGING SYSTEMS IN INDIUM MARKET, BY PURITY GRADE, 2018-2033 (USD THOUSAND)
TABLE 692 EUROPE RADAR & RF COMPONENTS IN INDIUM MARKET, BY PURITY GRADE, 2018-2033 (USD THOUSAND)
TABLE 693 EUROPE SATELLITE COMMUNICATION IN INDIUM MARKET, BY PURITY GRADE, 2018-2033 (USD THOUSAND)
TABLE 694 EUROPE MILITARY OPTOELECTRONICS IN INDIUM MARKET, BY PURITY GRADE, 2018-2033 (USD THOUSAND)
TABLE 695 EUROPE AVIONICS DISPLAYS IN INDIUM MARKET, BY PURITY GRADE, 2018-2033 (USD THOUSAND)
TABLE 696 EUROPE SPACECRAFT SOLAR PANELS IN INDIUM MARKET, BY PURITY GRADE, 2018-2033 (USD THOUSAND)
TABLE 697 EUROPE THERMAL MATERIALS IN INDIUM MARKET, BY PURITY GRADE, 2018-2033 (USD THOUSAND)
TABLE 698 EUROPE CRYOGENIC MATERIALS IN INDIUM MARKET, BY PURITY GRADE, 2018-2033 (USD THOUSAND)
TABLE 699 EUROPE MEDICAL DEVICE INDUSTRY IN INDIUM MARKET, BY TYPE, 2018-2033 (USD THOUSAND)
TABLE 700 EUROPE MEDICAL IMAGING SENSORS IN INDIUM MARKET, BY PURITY GRADE, 2018-2033 (USD THOUSAND)
TABLE 701 EUROPE DIAGNOSTIC EQUIPMENT DISPLAYS IN INDIUM MARKET, BY PURITY GRADE, 2018-2033 (USD THOUSAND)
TABLE 702 EUROPE ADVANCED DIAGNOSTIC INSTRUMENTS IN INDIUM MARKET, BY PURITY GRADE, 2018-2033 (USD THOUSAND)
TABLE 703 EUROPE LASER SURGICAL EQUIPMENT IN INDIUM MARKET, BY PURITY GRADE, 2018-2033 (USD THOUSAND)
TABLE 704 EUROPE BIOMEDICAL OPTICAL DEVICES IN INDIUM MARKET, BY PURITY GRADE, 2018-2033 (USD THOUSAND)
TABLE 705 EUROPE RADIATION DETECTION EQUIPMENT IN INDIUM MARKET, BY PURITY GRADE, 2018-2033 (USD THOUSAND)
TABLE 706 EUROPE INFRARED MEDICAL SENSORS IN INDIUM MARKET, BY PURITY GRADE, 2018-2033 (USD THOUSAND)
TABLE 707 EUROPE PHOTOTHERAPY DEVICES IN INDIUM MARKET, BY PURITY GRADE, 2018-2033 (USD THOUSAND)
TABLE 708 EUROPE INDUSTRIAL EQUIPMENT MANUFACTURING IN INDIUM MARKET, BY TYPE, 2018-2033 (USD THOUSAND)
TABLE 709 EUROPE INDUSTRIAL SENSORS IN INDIUM MARKET, BY PURITY GRADE, 2018-2033 (USD THOUSAND)
TABLE 710 EUROPE VACUUM DEPOSITION COATINGS IN INDIUM MARKET, BY PURITY GRADE, 2018-2033 (USD THOUSAND)
TABLE 711 EUROPE PRECISION OPTICAL COMPONENTS IN INDIUM MARKET, BY PURITY GRADE, 2018-2033 (USD THOUSAND)
TABLE 712 EUROPE THERMAL INTERFACE MATERIALS IN INDIUM MARKET, BY PURITY GRADE, 2018-2033 (USD THOUSAND)
TABLE 713 EUROPE INDUSTRIAL LASER SYSTEMS IN INDIUM MARKET, BY PURITY GRADE, 2018-2033 (USD THOUSAND)
TABLE 714 EUROPE INDUSTRIAL INFRARED DETECTORS IN INDIUM MARKET, BY PURITY GRADE, 2018-2033 (USD THOUSAND)
TABLE 715 EUROPE PRECISION MEASUREMENT EQUIPMENT IN INDIUM MARKET, BY PURITY GRADE, 2018-2033 (USD THOUSAND)
TABLE 716 EUROPE SPECIALTY ELECTRONIC COMPONENTS IN INDIUM MARKET, BY PURITY GRADE, 2018-2033 (USD THOUSAND)
TABLE 717 EUROPE OTHERS IN INDIUM MARKET, BY TYPE, 2018-2033 (USD THOUSAND)
TABLE 718 EUROPE ADVANCED MATERIALS MANUFACTURING IN INDIUM MARKET, BY PURITY GRADE, 2018-2033 (USD THOUSAND)
TABLE 719 EUROPE SPECIALTY ALLOY PRODUCTION IN INDIUM MARKET, BY PURITY GRADE, 2018-2033 (USD THOUSAND)
TABLE 720 EUROPE THERMAL MANAGEMENT MATERIALS IN INDIUM MARKET, BY PURITY GRADE, 2018-2033 (USD THOUSAND)
TABLE 721 EUROPE PRECISION SCIENTIFIC INSTRUMENTS IN INDIUM MARKET, BY PURITY GRADE, 2018-2033 (USD THOUSAND)
TABLE 722 EUROPE RESEARCH INSTITUTES & UNIVERSITIES IN INDIUM MARKET, BY PURITY GRADE, 2018-2033 (USD THOUSAND)
TABLE 723 EUROPE NUCLEAR INDUSTRY APPLICATIONS IN INDIUM MARKET, BY PURITY GRADE, 2018-2033 (USD THOUSAND)
TABLE 724 EUROPE SPECIALTY CHEMICAL PRODUCTION IN INDIUM MARKET, BY PURITY GRADE, 2018-2033 (USD THOUSAND)
TABLE 725 EUROPE DEFENSE RESEARCH LABORATORIES IN INDIUM MARKET, BY PURITY GRADE, 2018-2033 (USD THOUSAND)
TABLE 726 EUROPE CRYOGENIC EQUIPMENT MANUFACTURING IN INDIUM MARKET, BY PURITY GRADE, 2018-2033 (USD THOUSAND)
TABLE 727 GERMANY INDIUM MARKET, BY PRODUCT TYPE, 2018-2033 (USD THOUSAND)
TABLE 728 GERMANY INGOTS IN INDIUM MARKET, BY TYPE, 2018-2033 (USD THOUSAND)
TABLE 729 GERMANY INDIUM MARKET, BY MATERIAL COMPOSITION, 2018-2033 (USD THOUSAND)
TABLE 730 GERMANY INDIUM ALLOYS IN INDIUM MARKET, BY TYPE, 2018-2033 (USD THOUSAND)
TABLE 731 GERMANY INDIUM COMPOUNDS IN INDIUM MARKET, BY TYPE, 2018-2033 (USD THOUSAND)
TABLE 732 GERMANY INDIUM MARKET, BY PURITY GRADE, 2018-2033 (USD THOUSAND)
TABLE 733 GERMANY INDIUM MARKET, BY EXTRACTION SOURCE, 2018-2033 (USD THOUSAND)
TABLE 734 GERMANY PRIMARY PRODUCTION IN INDIUM MARKET, BY TYPE, 2018-2033 (USD THOUSAND)
TABLE 735 GERMANY SECONDARY PRODUCTION IN INDIUM MARKET, BY TYPE, 2018-2033 (USD THOUSAND)
TABLE 736 GERMANY INDIUM MARKET, BY DISTRIBUTION CHANNEL, 2018-2033 (USD THOUSAND)
TABLE 737 GERMANY INDIUM MARKET, BY TECHNOLOGY PLATFORM, 2018-2033 (USD THOUSAND)
TABLE 738 GERMANY INDIUM MARKET, BY END-USER INDUSTRY, 2018-2033 (USD THOUSAND)
TABLE 739 GERMANY CONSUMER ELECTRONICS INDUSTRY IN INDIUM MARKET, BY TYPE, 2018-2033 (USD THOUSAND)
TABLE 740 GERMANY FLAT PANEL DISPLAYS (LCD/OLED/LED) IN INDIUM MARKET, BY PURITY GRADE, 2018-2033 (USD THOUSAND)
TABLE 741 GERMANY TRANSPARENT CONDUCTIVE COATINGS (ITO) IN INDIUM MARKET, BY PURITY GRADE, 2018-2033 (USD THOUSAND)
TABLE 742 GERMANY TOUCHSCREEN DISPLAYS IN INDIUM MARKET, BY PURITY GRADE, 2018-2033 (USD THOUSAND)
TABLE 743 GERMANY FLEXIBLE DISPLAYS & ELECTRONICS IN INDIUM MARKET, BY PURITY GRADE, 2018-2033 (USD THOUSAND)
TABLE 744 GERMANY WEARABLE ELECTRONICS DEVICES IN INDIUM MARKET, BY PURITY GRADE, 2018-2033 (USD THOUSAND)
TABLE 745 GERMANY CAMERA & OPTICAL SENSORS IN INDIUM MARKET, BY PURITY GRADE, 2018-2033 (USD THOUSAND)
TABLE 746 GERMANY MINI-LED BACKLIGHTING IN INDIUM MARKET, BY PURITY GRADE, 2018-2033 (USD THOUSAND)
TABLE 747 GERMANY MICRO-LED DISPLAYS IN INDIUM MARKET, BY PURITY GRADE, 2018-2033 (USD THOUSAND)
TABLE 748 GERMANY DISPLAY PANEL INDUSTRY IN INDIUM MARKET, BY TYPE, 2018-2033 (USD THOUSAND)
TABLE 749 GERMANY LCD PANEL MANUFACTURING IN INDIUM MARKET, BY PURITY GRADE, 2018-2033 (USD THOUSAND)
TABLE 750 GERMANY OLED PANEL MANUFACTURING IN INDIUM MARKET, BY PURITY GRADE, 2018-2033 (USD THOUSAND)
TABLE 751 GERMANY DISPLAY PANEL MANUFACTURING IN INDIUM MARKET, BY PURITY GRADE, 2018-2033 (USD THOUSAND)
TABLE 752 GERMANY TOUCH PANEL SENSORS IN INDIUM MARKET, BY PURITY GRADE, 2018-2033 (USD THOUSAND)
TABLE 753 GERMANY TRANSPARENT CONDUCTIVE FILMS IN INDIUM MARKET, BY PURITY GRADE, 2018-2033 (USD THOUSAND)
TABLE 754 GERMANY FLEXIBLE & FOLDABLE DISPLAYS IN INDIUM MARKET, BY PURITY GRADE, 2018-2033 (USD THOUSAND)
TABLE 755 GERMANY AR/VR DISPLAYS IN INDIUM MARKET, BY PURITY GRADE, 2018-2033 (USD THOUSAND)
TABLE 756 GERMANY MICRODISPLAY DEVICES IN INDIUM MARKET, BY PURITY GRADE, 2018-2033 (USD THOUSAND)
TABLE 757 GERMANY BACKPLANE COATINGS IN INDIUM MARKET, BY PURITY GRADE, 2018-2033 (USD THOUSAND)
TABLE 758 GERMANY SEMICONDUCTOR INDUSTRY IN INDIUM MARKET, BY TYPE, 2018-2033 (USD THOUSAND)
TABLE 759 GERMANY III-V COMPOUND SEMICONDUCTORS IN INDIUM MARKET, BY PURITY GRADE, 2018-2033 (USD THOUSAND)
TABLE 760 GERMANY HIGH-FREQUENCY RF COMPONENTS IN INDIUM MARKET, BY PURITY GRADE, 2018-2033 (USD THOUSAND)
TABLE 761 GERMANY SEMICONDUCTOR SUBSTRATES & EPITAXY IN INDIUM MARKET, BY PURITY GRADE, 2018-2033 (USD THOUSAND)
TABLE 762 GERMANY LASER DIODES IN INDIUM MARKET, BY PURITY GRADE, 2018-2033 (USD THOUSAND)
TABLE 763 GERMANY PHOTODETECTORS IN INDIUM MARKET, BY PURITY GRADE, 2018-2033 (USD THOUSAND)
TABLE 764 GERMANY HIGH-SPEED OPTOELECTRONICS IN INDIUM MARKET, BY PURITY GRADE, 2018-2033 (USD THOUSAND)
TABLE 765 GERMANY INFRARED DETECTORS IN INDIUM MARKET, BY PURITY GRADE, 2018-2033 (USD THOUSAND)
TABLE 766 GERMANY INTEGRATED PHOTONIC CIRCUITS IN INDIUM MARKET, BY PURITY GRADE, 2018-2033 (USD THOUSAND)
TABLE 767 GERMANY SOLAR PHOTOVOLTAIC INDUSTRY IN INDIUM MARKET, BY TYPE, 2018-2033 (USD THOUSAND)
TABLE 768 GERMANY CIGS THIN-FILM SOLAR CELLS IN INDIUM MARKET, BY PURITY GRADE, 2018-2033 (USD THOUSAND)
TABLE 769 GERMANYHIGH-EFFICIENCY MODULES IN INDIUM MARKET, BY PURITY GRADE, 2018-2033 (USD THOUSAND)
TABLE 770 GERMANY THIN-FILM COATINGS IN INDIUM MARKET, BY PURITY GRADE, 2018-2033 (USD THOUSAND)
TABLE 771 GERMANY TRANSPARENT ELECTRODES IN INDIUM MARKET, BY PURITY GRADE, 2018-2033 (USD THOUSAND)
TABLE 772 GERMANY BIPV IN INDIUM MARKET, BY PURITY GRADE, 2018-2033 (USD THOUSAND)
TABLE 773 GERMANY FLEXIBLE SOLAR PANELS IN INDIUM MARKET, BY PURITY GRADE, 2018-2033 (USD THOUSAND)
TABLE 774 GERMANY PORTABLE SOLAR SYSTEMS IN INDIUM MARKET, BY PURITY GRADE, 2018-2033 (USD THOUSAND)
TABLE 775 GERMANY CONCENTRATED PV IN INDIUM MARKET, BY PURITY GRADE, 2018-2033 (USD THOUSAND)
TABLE 776 GERMANY AUTOMOTIVE INDUSTRY IN INDIUM MARKET, BY TYPE, 2018-2033 (USD THOUSAND)
TABLE 777 GERMANY AUTOMOTIVE DISPLAY PANELS IN INDIUM MARKET, BY PURITY GRADE, 2018-2033 (USD THOUSAND)
TABLE 778 GERMANYADAS SENSORS IN INDIUM MARKET, BY PURITY GRADE, 2018-2033 (USD THOUSAND)
TABLE 779 GERMANY VEHICLE CAMERA MODULES IN INDIUM MARKET, BY PURITY GRADE, 2018-2033 (USD THOUSAND)
TABLE 780 GERMANY AUTOMOTIVE OPTOELECTRONICS IN INDIUM MARKET, BY PURITY GRADE, 2018-2033 (USD THOUSAND)
TABLE 781 GERMANY POWER ELECTRONICS IN INDIUM MARKET, BY PURITY GRADE, 2018-2033 (USD THOUSAND)
TABLE 782 GERMANY TOUCHSCREEN INTERFACES IN INDIUM MARKET, BY PURITY GRADE, 2018-2033 (USD THOUSAND)
TABLE 783 GERMANY INFRARED SENSORS IN INDIUM MARKET, BY PURITY GRADE, 2018-2033 (USD THOUSAND)
TABLE 784 GERMANY SMART LIGHTING IN INDIUM MARKET, BY PURITY GRADE, 2018-2033 (USD THOUSAND)
TABLE 785 GERMANY TELECOMMUNICATION EQUIPMENT INDUSTRY IN INDIUM MARKET, BY TYPE, 2018-2033 (USD THOUSAND)
TABLE 786 GERMANY OPTICAL TRANSCEIVERS IN INDIUM MARKET, BY PURITY GRADE, 2018-2033 (USD THOUSAND)
TABLE 787 GERMANY RF POWER AMPLIFIERS IN INDIUM MARKET, BY PURITY GRADE, 2018-2033 (USD THOUSAND)
TABLE 788 GERMANY HIGH-FREQUENCY COMMUNICATION CHIPS IN INDIUM MARKET, BY PURITY GRADE, 2018-2033 (USD THOUSAND)
TABLE 789 GERMANY FIBER-OPTIC COMMUNICATION LASERS IN INDIUM MARKET, BY PURITY GRADE, 2018-2033 (USD THOUSAND)
TABLE 790 GERMANY PHOTODETECTORS FOR OPTICAL NETWORKS IN INDIUM MARKET, BY PURITY GRADE, 2018-2033 (USD THOUSAND)
TABLE 791 GERMANY 5G INFRASTRUCTURE COMPONENTS IN INDIUM MARKET, BY PURITY GRADE, 2018-2033 (USD THOUSAND)
TABLE 792 GERMANY OPTICAL NETWORK SWITCHING DEVICES IN INDIUM MARKET, BY PURITY GRADE, 2018-2033 (USD THOUSAND)
TABLE 793 GERMANY SATELLITE COMMUNICATION MODULES IN INDIUM MARKET, BY PURITY GRADE, 2018-2033 (USD THOUSAND)
TABLE 794 GERMANY OPTICAL & PHOTONICS INDUSTRY IN INDIUM MARKET, BY TYPE, 2018-2033 (USD THOUSAND)
TABLE 795 GERMANY OPTICAL COATINGS IN INDIUM MARKET, BY PURITY GRADE, 2018-2033 (USD THOUSAND)
TABLE 796 GERMANY FIBER OPTIC COMPONENTS IN INDIUM MARKET, BY PURITY GRADE, 2018-2033 (USD THOUSAND)
TABLE 797 GERMANY LASER COMPONENTS IN INDIUM MARKET, BY PURITY GRADE, 2018-2033 (USD THOUSAND)
TABLE 798 GERMANY OPTICAL SENSORS IN INDIUM MARKET, BY PURITY GRADE, 2018-2033 (USD THOUSAND)
TABLE 799 GERMANY INFRARED OPTICS IN INDIUM MARKET, BY PURITY GRADE, 2018-2033 (USD THOUSAND)
TABLE 800 GERMANY PICS IN INDIUM MARKET, BY PURITY GRADE, 2018-2033 (USD THOUSAND)
TABLE 801 GERMANY MIRRORS IN INDIUM MARKET, BY PURITY GRADE, 2018-2033 (USD THOUSAND)
TABLE 802 GERMANY SPECTROSCOPY IN INDIUM MARKET, BY PURITY GRADE, 2018-2033 (USD THOUSAND)
TABLE 803 GERMANY AEROSPACE & DEFENSE INDUSTRY IN INDIUM MARKET, BY TYPE, 2018-2033 (USD THOUSAND)
TABLE 804 GERMANY INFRARED IMAGING SYSTEMS IN INDIUM MARKET, BY PURITY GRADE, 2018-2033 (USD THOUSAND)
TABLE 805 GERMANY RADAR & RF COMPONENTS IN INDIUM MARKET, BY PURITY GRADE, 2018-2033 (USD THOUSAND)
TABLE 806 GERMANY SATELLITE COMMUNICATION IN INDIUM MARKET, BY PURITY GRADE, 2018-2033 (USD THOUSAND)
TABLE 807 GERMANY MILITARY OPTOELECTRONICS IN INDIUM MARKET, BY PURITY GRADE, 2018-2033 (USD THOUSAND)
TABLE 808 GERMANY AVIONICS DISPLAYS IN INDIUM MARKET, BY PURITY GRADE, 2018-2033 (USD THOUSAND)
TABLE 809 GERMANY SPACECRAFT SOLAR PANELS IN INDIUM MARKET, BY PURITY GRADE, 2018-2033 (USD THOUSAND)
TABLE 810 GERMANY THERMAL MATERIALS IN INDIUM MARKET, BY PURITY GRADE, 2018-2033 (USD THOUSAND)
TABLE 811 GERMANY CRYOGENIC MATERIALS IN INDIUM MARKET, BY PURITY GRADE, 2018-2033 (USD THOUSAND)
TABLE 812 GERMANY MEDICAL DEVICE INDUSTRY IN INDIUM MARKET, BY TYPE, 2018-2033 (USD THOUSAND)
TABLE 813 GERMANY MEDICAL IMAGING SENSORS IN INDIUM MARKET, BY PURITY GRADE, 2018-2033 (USD THOUSAND)
TABLE 814 GERMANY DIAGNOSTIC EQUIPMENT DISPLAYS IN INDIUM MARKET, BY PURITY GRADE, 2018-2033 (USD THOUSAND)
TABLE 815 GERMANY ADVANCED DIAGNOSTIC INSTRUMENTS IN INDIUM MARKET, BY PURITY GRADE, 2018-2033 (USD THOUSAND)
TABLE 816 GERMANY LASER SURGICAL EQUIPMENT IN INDIUM MARKET, BY PURITY GRADE, 2018-2033 (USD THOUSAND)
TABLE 817 GERMANY BIOMEDICAL OPTICAL DEVICES IN INDIUM MARKET, BY PURITY GRADE, 2018-2033 (USD THOUSAND)
TABLE 818 GERMANY RADIATION DETECTION EQUIPMENT IN INDIUM MARKET, BY PURITY GRADE, 2018-2033 (USD THOUSAND)
TABLE 819 GERMANY INFRARED MEDICAL SENSORS IN INDIUM MARKET, BY PURITY GRADE, 2018-2033 (USD THOUSAND)
TABLE 820 GERMANY PHOTOTHERAPY DEVICES IN INDIUM MARKET, BY PURITY GRADE, 2018-2033 (USD THOUSAND)
TABLE 821 GERMANY INDUSTRIAL EQUIPMENT MANUFACTURING IN INDIUM MARKET, BY TYPE, 2018-2033 (USD THOUSAND)
TABLE 822 GERMANY INDUSTRIAL SENSORS IN INDIUM MARKET, BY PURITY GRADE, 2018-2033 (USD THOUSAND)
TABLE 823 GERMANY VACUUM DEPOSITION COATINGS IN INDIUM MARKET, BY PURITY GRADE, 2018-2033 (USD THOUSAND)
TABLE 824 GERMANY PRECISION OPTICAL COMPONENTS IN INDIUM MARKET, BY PURITY GRADE, 2018-2033 (USD THOUSAND)
TABLE 825 GERMANY THERMAL INTERFACE MATERIALS IN INDIUM MARKET, BY PURITY GRADE, 2018-2033 (USD THOUSAND)
TABLE 826 GERMANY INDUSTRIAL LASER SYSTEMS IN INDIUM MARKET, BY PURITY GRADE, 2018-2033 (USD THOUSAND)
TABLE 827 GERMANY INDUSTRIAL INFRARED DETECTORS IN INDIUM MARKET, BY PURITY GRADE, 2018-2033 (USD THOUSAND)
TABLE 828 GERMANY PRECISION MEASUREMENT EQUIPMENT IN INDIUM MARKET, BY PURITY GRADE, 2018-2033 (USD THOUSAND)
TABLE 829 GERMANY SPECIALTY ELECTRONIC COMPONENTS IN INDIUM MARKET, BY PURITY GRADE, 2018-2033 (USD THOUSAND)
TABLE 830 GERMANY OTHERS IN INDIUM MARKET, BY TYPE, 2018-2033 (USD THOUSAND)
TABLE 831 GERMANY ADVANCED MATERIALS MANUFACTURING IN INDIUM MARKET, BY PURITY GRADE, 2018-2033 (USD THOUSAND)
TABLE 832 GERMANY SPECIALTY ALLOY PRODUCTION IN INDIUM MARKET, BY PURITY GRADE, 2018-2033 (USD THOUSAND)
TABLE 833 GERMANY THERMAL MANAGEMENT MATERIALS IN INDIUM MARKET, BY PURITY GRADE, 2018-2033 (USD THOUSAND)
TABLE 834 GERMANY PRECISION SCIENTIFIC INSTRUMENTS IN INDIUM MARKET, BY PURITY GRADE, 2018-2033 (USD THOUSAND)
TABLE 835 GERMANY RESEARCH INSTITUTES & UNIVERSITIES IN INDIUM MARKET, BY PURITY GRADE, 2018-2033 (USD THOUSAND)
TABLE 836 GERMANY NUCLEAR INDUSTRY APPLICATIONS IN INDIUM MARKET, BY PURITY GRADE, 2018-2033 (USD THOUSAND)
TABLE 837 GERMANY SPECIALTY CHEMICAL PRODUCTION IN INDIUM MARKET, BY PURITY GRADE, 2018-2033 (USD THOUSAND)
TABLE 838 GERMANY DEFENSE RESEARCH LABORATORIES IN INDIUM MARKET, BY PURITY GRADE, 2018-2033 (USD THOUSAND)
TABLE 839 GERMANY CRYOGENIC EQUIPMENT MANUFACTURING IN INDIUM MARKET, BY PURITY GRADE, 2018-2033 (USD THOUSAND)
TABLE 840 FRANCE INDIUM MARKET, BY PRODUCT TYPE, 2018-2033 (USD THOUSAND)
TABLE 841 FRANCE INGOTS IN INDIUM MARKET, BY TYPE, 2018-2033 (USD THOUSAND)
TABLE 842 FRANCE INDIUM MARKET, BY MATERIAL COMPOSITION, 2018-2033 (USD THOUSAND)
TABLE 843 FRANCE INDIUM ALLOYS IN INDIUM MARKET, BY TYPE, 2018-2033 (USD THOUSAND)
TABLE 844 FRANCE INDIUM COMPOUNDS IN INDIUM MARKET, BY TYPE, 2018-2033 (USD THOUSAND)
TABLE 845 FRANCE INDIUM MARKET, BY PURITY GRADE, 2018-2033 (USD THOUSAND)
TABLE 846 FRANCE INDIUM MARKET, BY EXTRACTION SOURCE, 2018-2033 (USD THOUSAND)
TABLE 847 FRANCE PRIMARY PRODUCTION IN INDIUM MARKET, BY TYPE, 2018-2033 (USD THOUSAND)
TABLE 848 FRANCE SECONDARY PRODUCTION IN INDIUM MARKET, BY TYPE, 2018-2033 (USD THOUSAND)
TABLE 849 FRANCE INDIUM MARKET, BY DISTRIBUTION CHANNEL, 2018-2033 (USD THOUSAND)
TABLE 850 FRANCE INDIUM MARKET, BY TECHNOLOGY PLATFORM, 2018-2033 (USD THOUSAND)
TABLE 851 FRANCE INDIUM MARKET, BY END-USER INDUSTRY, 2018-2033 (USD THOUSAND)
TABLE 852 FRANCE CONSUMER ELECTRONICS INDUSTRY IN INDIUM MARKET, BY TYPE, 2018-2033 (USD THOUSAND)
TABLE 853 FRANCE FLAT PANEL DISPLAYS (LCD/OLED/LED) IN INDIUM MARKET, BY PURITY GRADE, 2018-2033 (USD THOUSAND)
TABLE 854 FRANCE TRANSPARENT CONDUCTIVE COATINGS (ITO) IN INDIUM MARKET, BY PURITY GRADE, 2018-2033 (USD THOUSAND)
TABLE 855 FRANCE TOUCHSCREEN DISPLAYS IN INDIUM MARKET, BY PURITY GRADE, 2018-2033 (USD THOUSAND)
TABLE 856 FRANCE FLEXIBLE DISPLAYS & ELECTRONICS IN INDIUM MARKET, BY PURITY GRADE, 2018-2033 (USD THOUSAND)
TABLE 857 FRANCE WEARABLE ELECTRONICS DEVICES IN INDIUM MARKET, BY PURITY GRADE, 2018-2033 (USD THOUSAND)
TABLE 858 FRANCE CAMERA & OPTICAL SENSORS IN INDIUM MARKET, BY PURITY GRADE, 2018-2033 (USD THOUSAND)
TABLE 859 FRANCE MINI-LED BACKLIGHTING IN INDIUM MARKET, BY PURITY GRADE, 2018-2033 (USD THOUSAND)
TABLE 860 FRANCE MICRO-LED DISPLAYS IN INDIUM MARKET, BY PURITY GRADE, 2018-2033 (USD THOUSAND)
TABLE 861 FRANCE DISPLAY PANEL INDUSTRY IN INDIUM MARKET, BY TYPE, 2018-2033 (USD THOUSAND)
TABLE 862 FRANCE LCD PANEL MANUFACTURING IN INDIUM MARKET, BY PURITY GRADE, 2018-2033 (USD THOUSAND)
TABLE 863 FRANCE OLED PANEL MANUFACTURING IN INDIUM MARKET, BY PURITY GRADE, 2018-2033 (USD THOUSAND)
TABLE 864 FRANCE DISPLAY PANEL MANUFACTURING IN INDIUM MARKET, BY PURITY GRADE, 2018-2033 (USD THOUSAND)
TABLE 865 FRANCE TOUCH PANEL SENSORS IN INDIUM MARKET, BY PURITY GRADE, 2018-2033 (USD THOUSAND)
TABLE 866 FRANCE TRANSPARENT CONDUCTIVE FILMS IN INDIUM MARKET, BY PURITY GRADE, 2018-2033 (USD THOUSAND)
TABLE 867 FRANCE FLEXIBLE & FOLDABLE DISPLAYS IN INDIUM MARKET, BY PURITY GRADE, 2018-2033 (USD THOUSAND)
TABLE 868 FRANCE AR/VR DISPLAYS IN INDIUM MARKET, BY PURITY GRADE, 2018-2033 (USD THOUSAND)
TABLE 869 FRANCE MICRODISPLAY DEVICES IN INDIUM MARKET, BY PURITY GRADE, 2018-2033 (USD THOUSAND)
TABLE 870 FRANCE BACKPLANE COATINGS IN INDIUM MARKET, BY PURITY GRADE, 2018-2033 (USD THOUSAND)
TABLE 871 FRANCE SEMICONDUCTOR INDUSTRY IN INDIUM MARKET, BY TYPE, 2018-2033 (USD THOUSAND)
TABLE 872 FRANCE III-V COMPOUND SEMICONDUCTORS IN INDIUM MARKET, BY PURITY GRADE, 2018-2033 (USD THOUSAND)
TABLE 873 FRANCE HIGH-FREQUENCY RF COMPONENTS IN INDIUM MARKET, BY PURITY GRADE, 2018-2033 (USD THOUSAND)
TABLE 874 FRANCE SEMICONDUCTOR SUBSTRATES & EPITAXY IN INDIUM MARKET, BY PURITY GRADE, 2018-2033 (USD THOUSAND)
TABLE 875 FRANCE LASER DIODES IN INDIUM MARKET, BY PURITY GRADE, 2018-2033 (USD THOUSAND)
TABLE 876 FRANCE PHOTODETECTORS IN INDIUM MARKET, BY PURITY GRADE, 2018-2033 (USD THOUSAND)
TABLE 877 FRANCE HIGH-SPEED OPTOELECTRONICS IN INDIUM MARKET, BY PURITY GRADE, 2018-2033 (USD THOUSAND)
TABLE 878 FRANCE INFRARED DETECTORS IN INDIUM MARKET, BY PURITY GRADE, 2018-2033 (USD THOUSAND)
TABLE 879 FRANCE INTEGRATED PHOTONIC CIRCUITS IN INDIUM MARKET, BY PURITY GRADE, 2018-2033 (USD THOUSAND)
TABLE 880 FRANCE SOLAR PHOTOVOLTAIC INDUSTRY IN INDIUM MARKET, BY TYPE, 2018-2033 (USD THOUSAND)
TABLE 881 FRANCE CIGS THIN-FILM SOLAR CELLS IN INDIUM MARKET, BY PURITY GRADE, 2018-2033 (USD THOUSAND)
TABLE 882 FRANCEHIGH-EFFICIENCY MODULES IN INDIUM MARKET, BY PURITY GRADE, 2018-2033 (USD THOUSAND)
TABLE 883 FRANCE THIN-FILM COATINGS IN INDIUM MARKET, BY PURITY GRADE, 2018-2033 (USD THOUSAND)
TABLE 884 FRANCE TRANSPARENT ELECTRODES IN INDIUM MARKET, BY PURITY GRADE, 2018-2033 (USD THOUSAND)
TABLE 885 FRANCE BIPV IN INDIUM MARKET, BY PURITY GRADE, 2018-2033 (USD THOUSAND)
TABLE 886 FRANCE FLEXIBLE SOLAR PANELS IN INDIUM MARKET, BY PURITY GRADE, 2018-2033 (USD THOUSAND)
TABLE 887 FRANCE PORTABLE SOLAR SYSTEMS IN INDIUM MARKET, BY PURITY GRADE, 2018-2033 (USD THOUSAND)
TABLE 888 FRANCE CONCENTRATED PV IN INDIUM MARKET, BY PURITY GRADE, 2018-2033 (USD THOUSAND)
TABLE 889 FRANCE AUTOMOTIVE INDUSTRY IN INDIUM MARKET, BY TYPE, 2018-2033 (USD THOUSAND)
TABLE 890 FRANCE AUTOMOTIVE DISPLAY PANELS IN INDIUM MARKET, BY PURITY GRADE, 2018-2033 (USD THOUSAND)
TABLE 891 FRANCEADAS SENSORS IN INDIUM MARKET, BY PURITY GRADE, 2018-2033 (USD THOUSAND)
TABLE 892 FRANCE VEHICLE CAMERA MODULES IN INDIUM MARKET, BY PURITY GRADE, 2018-2033 (USD THOUSAND)
TABLE 893 FRANCE AUTOMOTIVE OPTOELECTRONICS IN INDIUM MARKET, BY PURITY GRADE, 2018-2033 (USD THOUSAND)
TABLE 894 FRANCE POWER ELECTRONICS IN INDIUM MARKET, BY PURITY GRADE, 2018-2033 (USD THOUSAND)
TABLE 895 FRANCE TOUCHSCREEN INTERFACES IN INDIUM MARKET, BY PURITY GRADE, 2018-2033 (USD THOUSAND)
TABLE 896 FRANCE INFRARED SENSORS IN INDIUM MARKET, BY PURITY GRADE, 2018-2033 (USD THOUSAND)
TABLE 897 FRANCE SMART LIGHTING IN INDIUM MARKET, BY PURITY GRADE, 2018-2033 (USD THOUSAND)
TABLE 898 FRANCE TELECOMMUNICATION EQUIPMENT INDUSTRY IN INDIUM MARKET, BY TYPE, 2018-2033 (USD THOUSAND)
TABLE 899 FRANCE OPTICAL TRANSCEIVERS IN INDIUM MARKET, BY PURITY GRADE, 2018-2033 (USD THOUSAND)
TABLE 900 FRANCE RF POWER AMPLIFIERS IN INDIUM MARKET, BY PURITY GRADE, 2018-2033 (USD THOUSAND)
TABLE 901 FRANCE HIGH-FREQUENCY COMMUNICATION CHIPS IN INDIUM MARKET, BY PURITY GRADE, 2018-2033 (USD THOUSAND)
TABLE 902 FRANCE FIBER-OPTIC COMMUNICATION LASERS IN INDIUM MARKET, BY PURITY GRADE, 2018-2033 (USD THOUSAND)
TABLE 903 FRANCE PHOTODETECTORS FOR OPTICAL NETWORKS IN INDIUM MARKET, BY PURITY GRADE, 2018-2033 (USD THOUSAND)
TABLE 904 FRANCE 5G INFRASTRUCTURE COMPONENTS IN INDIUM MARKET, BY PURITY GRADE, 2018-2033 (USD THOUSAND)
TABLE 905 FRANCE OPTICAL NETWORK SWITCHING DEVICES IN INDIUM MARKET, BY PURITY GRADE, 2018-2033 (USD THOUSAND)
TABLE 906 FRANCE SATELLITE COMMUNICATION MODULES IN INDIUM MARKET, BY PURITY GRADE, 2018-2033 (USD THOUSAND)
TABLE 907 FRANCE OPTICAL & PHOTONICS INDUSTRY IN INDIUM MARKET, BY TYPE, 2018-2033 (USD THOUSAND)
TABLE 908 FRANCE OPTICAL COATINGS IN INDIUM MARKET, BY PURITY GRADE, 2018-2033 (USD THOUSAND)
TABLE 909 FRANCE FIBER OPTIC COMPONENTS IN INDIUM MARKET, BY PURITY GRADE, 2018-2033 (USD THOUSAND)
TABLE 910 FRANCE LASER COMPONENTS IN INDIUM MARKET, BY PURITY GRADE, 2018-2033 (USD THOUSAND)
TABLE 911 FRANCE OPTICAL SENSORS IN INDIUM MARKET, BY PURITY GRADE, 2018-2033 (USD THOUSAND)
TABLE 912 FRANCE INFRARED OPTICS IN INDIUM MARKET, BY PURITY GRADE, 2018-2033 (USD THOUSAND)
TABLE 913 FRANCE PICS IN INDIUM MARKET, BY PURITY GRADE, 2018-2033 (USD THOUSAND)
TABLE 914 FRANCE MIRRORS IN INDIUM MARKET, BY PURITY GRADE, 2018-2033 (USD THOUSAND)
TABLE 915 FRANCE SPECTROSCOPY IN INDIUM MARKET, BY PURITY GRADE, 2018-2033 (USD THOUSAND)
TABLE 916 FRANCE AEROSPACE & DEFENSE INDUSTRY IN INDIUM MARKET, BY TYPE, 2018-2033 (USD THOUSAND)
TABLE 917 FRANCE INFRARED IMAGING SYSTEMS IN INDIUM MARKET, BY PURITY GRADE, 2018-2033 (USD THOUSAND)
TABLE 918 FRANCE RADAR & RF COMPONENTS IN INDIUM MARKET, BY PURITY GRADE, 2018-2033 (USD THOUSAND)
TABLE 919 FRANCE SATELLITE COMMUNICATION IN INDIUM MARKET, BY PURITY GRADE, 2018-2033 (USD THOUSAND)
TABLE 920 FRANCE MILITARY OPTOELECTRONICS IN INDIUM MARKET, BY PURITY GRADE, 2018-2033 (USD THOUSAND)
TABLE 921 FRANCE AVIONICS DISPLAYS IN INDIUM MARKET, BY PURITY GRADE, 2018-2033 (USD THOUSAND)
TABLE 922 FRANCE SPACECRAFT SOLAR PANELS IN INDIUM MARKET, BY PURITY GRADE, 2018-2033 (USD THOUSAND)
TABLE 923 FRANCE THERMAL MATERIALS IN INDIUM MARKET, BY PURITY GRADE, 2018-2033 (USD THOUSAND)
TABLE 924 FRANCE CRYOGENIC MATERIALS IN INDIUM MARKET, BY PURITY GRADE, 2018-2033 (USD THOUSAND)
TABLE 925 FRANCE MEDICAL DEVICE INDUSTRY IN INDIUM MARKET, BY TYPE, 2018-2033 (USD THOUSAND)
TABLE 926 FRANCE MEDICAL IMAGING SENSORS IN INDIUM MARKET, BY PURITY GRADE, 2018-2033 (USD THOUSAND)
TABLE 927 FRANCE DIAGNOSTIC EQUIPMENT DISPLAYS IN INDIUM MARKET, BY PURITY GRADE, 2018-2033 (USD THOUSAND)
TABLE 928 FRANCE ADVANCED DIAGNOSTIC INSTRUMENTS IN INDIUM MARKET, BY PURITY GRADE, 2018-2033 (USD THOUSAND)
TABLE 929 FRANCE LASER SURGICAL EQUIPMENT IN INDIUM MARKET, BY PURITY GRADE, 2018-2033 (USD THOUSAND)
TABLE 930 FRANCE BIOMEDICAL OPTICAL DEVICES IN INDIUM MARKET, BY PURITY GRADE, 2018-2033 (USD THOUSAND)
TABLE 931 FRANCE RADIATION DETECTION EQUIPMENT IN INDIUM MARKET, BY PURITY GRADE, 2018-2033 (USD THOUSAND)
TABLE 932 FRANCE INFRARED MEDICAL SENSORS IN INDIUM MARKET, BY PURITY GRADE, 2018-2033 (USD THOUSAND)
TABLE 933 FRANCE PHOTOTHERAPY DEVICES IN INDIUM MARKET, BY PURITY GRADE, 2018-2033 (USD THOUSAND)
TABLE 934 FRANCE INDUSTRIAL EQUIPMENT MANUFACTURING IN INDIUM MARKET, BY TYPE, 2018-2033 (USD THOUSAND)
TABLE 935 FRANCE INDUSTRIAL SENSORS IN INDIUM MARKET, BY PURITY GRADE, 2018-2033 (USD THOUSAND)
TABLE 936 FRANCE VACUUM DEPOSITION COATINGS IN INDIUM MARKET, BY PURITY GRADE, 2018-2033 (USD THOUSAND)
TABLE 937 FRANCE PRECISION OPTICAL COMPONENTS IN INDIUM MARKET, BY PURITY GRADE, 2018-2033 (USD THOUSAND)
TABLE 938 FRANCE THERMAL INTERFACE MATERIALS IN INDIUM MARKET, BY PURITY GRADE, 2018-2033 (USD THOUSAND)
TABLE 939 FRANCE INDUSTRIAL LASER SYSTEMS IN INDIUM MARKET, BY PURITY GRADE, 2018-2033 (USD THOUSAND)
TABLE 940 FRANCE INDUSTRIAL INFRARED DETECTORS IN INDIUM MARKET, BY PURITY GRADE, 2018-2033 (USD THOUSAND)
TABLE 941 FRANCE PRECISION MEASUREMENT EQUIPMENT IN INDIUM MARKET, BY PURITY GRADE, 2018-2033 (USD THOUSAND)
TABLE 942 FRANCE SPECIALTY ELECTRONIC COMPONENTS IN INDIUM MARKET, BY PURITY GRADE, 2018-2033 (USD THOUSAND)
TABLE 943 FRANCE OTHERS IN INDIUM MARKET, BY TYPE, 2018-2033 (USD THOUSAND)
TABLE 944 FRANCE ADVANCED MATERIALS MANUFACTURING IN INDIUM MARKET, BY PURITY GRADE, 2018-2033 (USD THOUSAND)
TABLE 945 FRANCE SPECIALTY ALLOY PRODUCTION IN INDIUM MARKET, BY PURITY GRADE, 2018-2033 (USD THOUSAND)
TABLE 946 FRANCE THERMAL MANAGEMENT MATERIALS IN INDIUM MARKET, BY PURITY GRADE, 2018-2033 (USD THOUSAND)
TABLE 947 FRANCE PRECISION SCIENTIFIC INSTRUMENTS IN INDIUM MARKET, BY PURITY GRADE, 2018-2033 (USD THOUSAND)
TABLE 948 FRANCE RESEARCH INSTITUTES & UNIVERSITIES IN INDIUM MARKET, BY PURITY GRADE, 2018-2033 (USD THOUSAND)
TABLE 949 FRANCE NUCLEAR INDUSTRY APPLICATIONS IN INDIUM MARKET, BY PURITY GRADE, 2018-2033 (USD THOUSAND)
TABLE 950 FRANCE SPECIALTY CHEMICAL PRODUCTION IN INDIUM MARKET, BY PURITY GRADE, 2018-2033 (USD THOUSAND)
TABLE 951 FRANCE DEFENSE RESEARCH LABORATORIES IN INDIUM MARKET, BY PURITY GRADE, 2018-2033 (USD THOUSAND)
TABLE 952 FRANCE CRYOGENIC EQUIPMENT MANUFACTURING IN INDIUM MARKET, BY PURITY GRADE, 2018-2033 (USD THOUSAND)
TABLE 953 BELGIUM INDIUM MARKET, BY PRODUCT TYPE, 2018-2033 (USD THOUSAND)
TABLE 954 BELGIUM INGOTS IN INDIUM MARKET, BY TYPE, 2018-2033 (USD THOUSAND)
TABLE 955 BELGIUM INDIUM MARKET, BY MATERIAL COMPOSITION, 2018-2033 (USD THOUSAND)
TABLE 956 BELGIUM INDIUM ALLOYS IN INDIUM MARKET, BY TYPE, 2018-2033 (USD THOUSAND)
TABLE 957 BELGIUM INDIUM COMPOUNDS IN INDIUM MARKET, BY TYPE, 2018-2033 (USD THOUSAND)
TABLE 958 BELGIUM INDIUM MARKET, BY PURITY GRADE, 2018-2033 (USD THOUSAND)
TABLE 959 BELGIUM INDIUM MARKET, BY EXTRACTION SOURCE, 2018-2033 (USD THOUSAND)
TABLE 960 BELGIUM PRIMARY PRODUCTION IN INDIUM MARKET, BY TYPE, 2018-2033 (USD THOUSAND)
TABLE 961 BELGIUM SECONDARY PRODUCTION IN INDIUM MARKET, BY TYPE, 2018-2033 (USD THOUSAND)
TABLE 962 BELGIUM INDIUM MARKET, BY DISTRIBUTION CHANNEL, 2018-2033 (USD THOUSAND)
TABLE 963 BELGIUM INDIUM MARKET, BY TECHNOLOGY PLATFORM, 2018-2033 (USD THOUSAND)
TABLE 964 BELGIUM INDIUM MARKET, BY END-USER INDUSTRY, 2018-2033 (USD THOUSAND)
TABLE 965 BELGIUM CONSUMER ELECTRONICS INDUSTRY IN INDIUM MARKET, BY TYPE, 2018-2033 (USD THOUSAND)
TABLE 966 BELGIUM FLAT PANEL DISPLAYS (LCD/OLED/LED) IN INDIUM MARKET, BY PURITY GRADE, 2018-2033 (USD THOUSAND)
TABLE 967 BELGIUM TRANSPARENT CONDUCTIVE COATINGS (ITO) IN INDIUM MARKET, BY PURITY GRADE, 2018-2033 (USD THOUSAND)
TABLE 968 BELGIUM TOUCHSCREEN DISPLAYS IN INDIUM MARKET, BY PURITY GRADE, 2018-2033 (USD THOUSAND)
TABLE 969 BELGIUM FLEXIBLE DISPLAYS & ELECTRONICS IN INDIUM MARKET, BY PURITY GRADE, 2018-2033 (USD THOUSAND)
TABLE 970 BELGIUM WEARABLE ELECTRONICS DEVICES IN INDIUM MARKET, BY PURITY GRADE, 2018-2033 (USD THOUSAND)
TABLE 971 BELGIUM CAMERA & OPTICAL SENSORS IN INDIUM MARKET, BY PURITY GRADE, 2018-2033 (USD THOUSAND)
TABLE 972 BELGIUM MINI-LED BACKLIGHTING IN INDIUM MARKET, BY PURITY GRADE, 2018-2033 (USD THOUSAND)
TABLE 973 BELGIUM MICRO-LED DISPLAYS IN INDIUM MARKET, BY PURITY GRADE, 2018-2033 (USD THOUSAND)
TABLE 974 BELGIUM DISPLAY PANEL INDUSTRY IN INDIUM MARKET, BY TYPE, 2018-2033 (USD THOUSAND)
TABLE 975 BELGIUM LCD PANEL MANUFACTURING IN INDIUM MARKET, BY PURITY GRADE, 2018-2033 (USD THOUSAND)
TABLE 976 BELGIUM OLED PANEL MANUFACTURING IN INDIUM MARKET, BY PURITY GRADE, 2018-2033 (USD THOUSAND)
TABLE 977 BELGIUM DISPLAY PANEL MANUFACTURING IN INDIUM MARKET, BY PURITY GRADE, 2018-2033 (USD THOUSAND)
TABLE 978 BELGIUM TOUCH PANEL SENSORS IN INDIUM MARKET, BY PURITY GRADE, 2018-2033 (USD THOUSAND)
TABLE 979 BELGIUM TRANSPARENT CONDUCTIVE FILMS IN INDIUM MARKET, BY PURITY GRADE, 2018-2033 (USD THOUSAND)
TABLE 980 BELGIUM FLEXIBLE & FOLDABLE DISPLAYS IN INDIUM MARKET, BY PURITY GRADE, 2018-2033 (USD THOUSAND)
TABLE 981 BELGIUM AR/VR DISPLAYS IN INDIUM MARKET, BY PURITY GRADE, 2018-2033 (USD THOUSAND)
TABLE 982 BELGIUM MICRODISPLAY DEVICES IN INDIUM MARKET, BY PURITY GRADE, 2018-2033 (USD THOUSAND)
TABLE 983 BELGIUM BACKPLANE COATINGS IN INDIUM MARKET, BY PURITY GRADE, 2018-2033 (USD THOUSAND)
TABLE 984 BELGIUM SEMICONDUCTOR INDUSTRY IN INDIUM MARKET, BY TYPE, 2018-2033 (USD THOUSAND)
TABLE 985 BELGIUM III-V COMPOUND SEMICONDUCTORS IN INDIUM MARKET, BY PURITY GRADE, 2018-2033 (USD THOUSAND)
TABLE 986 BELGIUM HIGH-FREQUENCY RF COMPONENTS IN INDIUM MARKET, BY PURITY GRADE, 2018-2033 (USD THOUSAND)
TABLE 987 BELGIUM SEMICONDUCTOR SUBSTRATES & EPITAXY IN INDIUM MARKET, BY PURITY GRADE, 2018-2033 (USD THOUSAND)
TABLE 988 BELGIUM LASER DIODES IN INDIUM MARKET, BY PURITY GRADE, 2018-2033 (USD THOUSAND)
TABLE 989 BELGIUM PHOTODETECTORS IN INDIUM MARKET, BY PURITY GRADE, 2018-2033 (USD THOUSAND)
TABLE 990 BELGIUM HIGH-SPEED OPTOELECTRONICS IN INDIUM MARKET, BY PURITY GRADE, 2018-2033 (USD THOUSAND)
TABLE 991 BELGIUM INFRARED DETECTORS IN INDIUM MARKET, BY PURITY GRADE, 2018-2033 (USD THOUSAND)
TABLE 992 BELGIUM INTEGRATED PHOTONIC CIRCUITS IN INDIUM MARKET, BY PURITY GRADE, 2018-2033 (USD THOUSAND)
TABLE 993 BELGIUM SOLAR PHOTOVOLTAIC INDUSTRY IN INDIUM MARKET, BY TYPE, 2018-2033 (USD THOUSAND)
TABLE 994 BELGIUM CIGS THIN-FILM SOLAR CELLS IN INDIUM MARKET, BY PURITY GRADE, 2018-2033 (USD THOUSAND)
TABLE 995 BELGIUMHIGH-EFFICIENCY MODULES IN INDIUM MARKET, BY PURITY GRADE, 2018-2033 (USD THOUSAND)
TABLE 996 BELGIUM THIN-FILM COATINGS IN INDIUM MARKET, BY PURITY GRADE, 2018-2033 (USD THOUSAND)
TABLE 997 BELGIUM TRANSPARENT ELECTRODES IN INDIUM MARKET, BY PURITY GRADE, 2018-2033 (USD THOUSAND)
TABLE 998 BELGIUM BIPV IN INDIUM MARKET, BY PURITY GRADE, 2018-2033 (USD THOUSAND)
TABLE 999 BELGIUM FLEXIBLE SOLAR PANELS IN INDIUM MARKET, BY PURITY GRADE, 2018-2033 (USD THOUSAND)
TABLE 1000 BELGIUM PORTABLE SOLAR SYSTEMS IN INDIUM MARKET, BY PURITY GRADE, 2018-2033 (USD THOUSAND)
TABLE 1001 BELGIUM CONCENTRATED PV IN INDIUM MARKET, BY PURITY GRADE, 2018-2033 (USD THOUSAND)
TABLE 1002 BELGIUM AUTOMOTIVE INDUSTRY IN INDIUM MARKET, BY TYPE, 2018-2033 (USD THOUSAND)
TABLE 1003 BELGIUM AUTOMOTIVE DISPLAY PANELS IN INDIUM MARKET, BY PURITY GRADE, 2018-2033 (USD THOUSAND)
TABLE 1004 BELGIUMADAS SENSORS IN INDIUM MARKET, BY PURITY GRADE, 2018-2033 (USD THOUSAND)
TABLE 1005 BELGIUM VEHICLE CAMERA MODULES IN INDIUM MARKET, BY PURITY GRADE, 2018-2033 (USD THOUSAND)
TABLE 1006 BELGIUM AUTOMOTIVE OPTOELECTRONICS IN INDIUM MARKET, BY PURITY GRADE, 2018-2033 (USD THOUSAND)
TABLE 1007 BELGIUM POWER ELECTRONICS IN INDIUM MARKET, BY PURITY GRADE, 2018-2033 (USD THOUSAND)
TABLE 1008 BELGIUM TOUCHSCREEN INTERFACES IN INDIUM MARKET, BY PURITY GRADE, 2018-2033 (USD THOUSAND)
TABLE 1009 BELGIUM INFRARED SENSORS IN INDIUM MARKET, BY PURITY GRADE, 2018-2033 (USD THOUSAND)
TABLE 1010 BELGIUM SMART LIGHTING IN INDIUM MARKET, BY PURITY GRADE, 2018-2033 (USD THOUSAND)
TABLE 1011 BELGIUM TELECOMMUNICATION EQUIPMENT INDUSTRY IN INDIUM MARKET, BY TYPE, 2018-2033 (USD THOUSAND)
TABLE 1012 BELGIUM OPTICAL TRANSCEIVERS IN INDIUM MARKET, BY PURITY GRADE, 2018-2033 (USD THOUSAND)
TABLE 1013 BELGIUM RF POWER AMPLIFIERS IN INDIUM MARKET, BY PURITY GRADE, 2018-2033 (USD THOUSAND)
TABLE 1014 BELGIUM HIGH-FREQUENCY COMMUNICATION CHIPS IN INDIUM MARKET, BY PURITY GRADE, 2018-2033 (USD THOUSAND)
TABLE 1015 BELGIUM FIBER-OPTIC COMMUNICATION LASERS IN INDIUM MARKET, BY PURITY GRADE, 2018-2033 (USD THOUSAND)
TABLE 1016 BELGIUM PHOTODETECTORS FOR OPTICAL NETWORKS IN INDIUM MARKET, BY PURITY GRADE, 2018-2033 (USD THOUSAND)
TABLE 1017 BELGIUM 5G INFRASTRUCTURE COMPONENTS IN INDIUM MARKET, BY PURITY GRADE, 2018-2033 (USD THOUSAND)
TABLE 1018 BELGIUM OPTICAL NETWORK SWITCHING DEVICES IN INDIUM MARKET, BY PURITY GRADE, 2018-2033 (USD THOUSAND)
TABLE 1019 BELGIUM SATELLITE COMMUNICATION MODULES IN INDIUM MARKET, BY PURITY GRADE, 2018-2033 (USD THOUSAND)
TABLE 1020 BELGIUM OPTICAL & PHOTONICS INDUSTRY IN INDIUM MARKET, BY TYPE, 2018-2033 (USD THOUSAND)
TABLE 1021 BELGIUM OPTICAL COATINGS IN INDIUM MARKET, BY PURITY GRADE, 2018-2033 (USD THOUSAND)
TABLE 1022 BELGIUM FIBER OPTIC COMPONENTS IN INDIUM MARKET, BY PURITY GRADE, 2018-2033 (USD THOUSAND)
TABLE 1023 BELGIUM LASER COMPONENTS IN INDIUM MARKET, BY PURITY GRADE, 2018-2033 (USD THOUSAND)
TABLE 1024 BELGIUM OPTICAL SENSORS IN INDIUM MARKET, BY PURITY GRADE, 2018-2033 (USD THOUSAND)
TABLE 1025 BELGIUM INFRARED OPTICS IN INDIUM MARKET, BY PURITY GRADE, 2018-2033 (USD THOUSAND)
TABLE 1026 BELGIUM PICS IN INDIUM MARKET, BY PURITY GRADE, 2018-2033 (USD THOUSAND)
TABLE 1027 BELGIUM MIRRORS IN INDIUM MARKET, BY PURITY GRADE, 2018-2033 (USD THOUSAND)
TABLE 1028 BELGIUM SPECTROSCOPY IN INDIUM MARKET, BY PURITY GRADE, 2018-2033 (USD THOUSAND)
TABLE 1029 BELGIUM AEROSPACE & DEFENSE INDUSTRY IN INDIUM MARKET, BY TYPE, 2018-2033 (USD THOUSAND)
TABLE 1030 BELGIUM INFRARED IMAGING SYSTEMS IN INDIUM MARKET, BY PURITY GRADE, 2018-2033 (USD THOUSAND)
TABLE 1031 BELGIUM RADAR & RF COMPONENTS IN INDIUM MARKET, BY PURITY GRADE, 2018-2033 (USD THOUSAND)
TABLE 1032 BELGIUM SATELLITE COMMUNICATION IN INDIUM MARKET, BY PURITY GRADE, 2018-2033 (USD THOUSAND)
TABLE 1033 BELGIUM MILITARY OPTOELECTRONICS IN INDIUM MARKET, BY PURITY GRADE, 2018-2033 (USD THOUSAND)
TABLE 1034 BELGIUM AVIONICS DISPLAYS IN INDIUM MARKET, BY PURITY GRADE, 2018-2033 (USD THOUSAND)
TABLE 1035 BELGIUM SPACECRAFT SOLAR PANELS IN INDIUM MARKET, BY PURITY GRADE, 2018-2033 (USD THOUSAND)
TABLE 1036 BELGIUM THERMAL MATERIALS IN INDIUM MARKET, BY PURITY GRADE, 2018-2033 (USD THOUSAND)
TABLE 1037 BELGIUM CRYOGENIC MATERIALS IN INDIUM MARKET, BY PURITY GRADE, 2018-2033 (USD THOUSAND)
TABLE 1038 BELGIUM MEDICAL DEVICE INDUSTRY IN INDIUM MARKET, BY TYPE, 2018-2033 (USD THOUSAND)
TABLE 1039 BELGIUM MEDICAL IMAGING SENSORS IN INDIUM MARKET, BY PURITY GRADE, 2018-2033 (USD THOUSAND)
TABLE 1040 BELGIUM DIAGNOSTIC EQUIPMENT DISPLAYS IN INDIUM MARKET, BY PURITY GRADE, 2018-2033 (USD THOUSAND)
TABLE 1041 BELGIUM ADVANCED DIAGNOSTIC INSTRUMENTS IN INDIUM MARKET, BY PURITY GRADE, 2018-2033 (USD THOUSAND)
TABLE 1042 BELGIUM LASER SURGICAL EQUIPMENT IN INDIUM MARKET, BY PURITY GRADE, 2018-2033 (USD THOUSAND)
TABLE 1043 BELGIUM BIOMEDICAL OPTICAL DEVICES IN INDIUM MARKET, BY PURITY GRADE, 2018-2033 (USD THOUSAND)
TABLE 1044 BELGIUM RADIATION DETECTION EQUIPMENT IN INDIUM MARKET, BY PURITY GRADE, 2018-2033 (USD THOUSAND)
TABLE 1045 BELGIUM INFRARED MEDICAL SENSORS IN INDIUM MARKET, BY PURITY GRADE, 2018-2033 (USD THOUSAND)
TABLE 1046 BELGIUM PHOTOTHERAPY DEVICES IN INDIUM MARKET, BY PURITY GRADE, 2018-2033 (USD THOUSAND)
TABLE 1047 BELGIUM INDUSTRIAL EQUIPMENT MANUFACTURING IN INDIUM MARKET, BY TYPE, 2018-2033 (USD THOUSAND)
TABLE 1048 BELGIUM INDUSTRIAL SENSORS IN INDIUM MARKET, BY PURITY GRADE, 2018-2033 (USD THOUSAND)
TABLE 1049 BELGIUM VACUUM DEPOSITION COATINGS IN INDIUM MARKET, BY PURITY GRADE, 2018-2033 (USD THOUSAND)
TABLE 1050 BELGIUM PRECISION OPTICAL COMPONENTS IN INDIUM MARKET, BY PURITY GRADE, 2018-2033 (USD THOUSAND)
TABLE 1051 BELGIUM THERMAL INTERFACE MATERIALS IN INDIUM MARKET, BY PURITY GRADE, 2018-2033 (USD THOUSAND)
TABLE 1052 BELGIUM INDUSTRIAL LASER SYSTEMS IN INDIUM MARKET, BY PURITY GRADE, 2018-2033 (USD THOUSAND)
TABLE 1053 BELGIUM INDUSTRIAL INFRARED DETECTORS IN INDIUM MARKET, BY PURITY GRADE, 2018-2033 (USD THOUSAND)
TABLE 1054 BELGIUM PRECISION MEASUREMENT EQUIPMENT IN INDIUM MARKET, BY PURITY GRADE, 2018-2033 (USD THOUSAND)
TABLE 1055 BELGIUM SPECIALTY ELECTRONIC COMPONENTS IN INDIUM MARKET, BY PURITY GRADE, 2018-2033 (USD THOUSAND)
TABLE 1056 BELGIUM OTHERS IN INDIUM MARKET, BY TYPE, 2018-2033 (USD THOUSAND)
TABLE 1057 BELGIUM ADVANCED MATERIALS MANUFACTURING IN INDIUM MARKET, BY PURITY GRADE, 2018-2033 (USD THOUSAND)
TABLE 1058 BELGIUM SPECIALTY ALLOY PRODUCTION IN INDIUM MARKET, BY PURITY GRADE, 2018-2033 (USD THOUSAND)
TABLE 1059 BELGIUM THERMAL MANAGEMENT MATERIALS IN INDIUM MARKET, BY PURITY GRADE, 2018-2033 (USD THOUSAND)
TABLE 1060 BELGIUM PRECISION SCIENTIFIC INSTRUMENTS IN INDIUM MARKET, BY PURITY GRADE, 2018-2033 (USD THOUSAND)
TABLE 1061 BELGIUM RESEARCH INSTITUTES & UNIVERSITIES IN INDIUM MARKET, BY PURITY GRADE, 2018-2033 (USD THOUSAND)
TABLE 1062 BELGIUM NUCLEAR INDUSTRY APPLICATIONS IN INDIUM MARKET, BY PURITY GRADE, 2018-2033 (USD THOUSAND)
TABLE 1063 BELGIUM SPECIALTY CHEMICAL PRODUCTION IN INDIUM MARKET, BY PURITY GRADE, 2018-2033 (USD THOUSAND)
TABLE 1064 BELGIUM DEFENSE RESEARCH LABORATORIES IN INDIUM MARKET, BY PURITY GRADE, 2018-2033 (USD THOUSAND)
TABLE 1065 BELGIUM CRYOGENIC EQUIPMENT MANUFACTURING IN INDIUM MARKET, BY PURITY GRADE, 2018-2033 (USD THOUSAND)
TABLE 1066 UK INDIUM MARKET, BY PRODUCT TYPE, 2018-2033 (USD THOUSAND)
TABLE 1067 UK INGOTS IN INDIUM MARKET, BY TYPE, 2018-2033 (USD THOUSAND)
TABLE 1068 UK INDIUM MARKET, BY MATERIAL COMPOSITION, 2018-2033 (USD THOUSAND)
TABLE 1069 UK INDIUM ALLOYS IN INDIUM MARKET, BY TYPE, 2018-2033 (USD THOUSAND)
TABLE 1070 UK INDIUM COMPOUNDS IN INDIUM MARKET, BY TYPE, 2018-2033 (USD THOUSAND)
TABLE 1071 UK INDIUM MARKET, BY PURITY GRADE, 2018-2033 (USD THOUSAND)
TABLE 1072 UK INDIUM MARKET, BY EXTRACTION SOURCE, 2018-2033 (USD THOUSAND)
TABLE 1073 UK PRIMARY PRODUCTION IN INDIUM MARKET, BY TYPE, 2018-2033 (USD THOUSAND)
TABLE 1074 UK SECONDARY PRODUCTION IN INDIUM MARKET, BY TYPE, 2018-2033 (USD THOUSAND)
TABLE 1075 UK INDIUM MARKET, BY DISTRIBUTION CHANNEL, 2018-2033 (USD THOUSAND)
TABLE 1076 UK INDIUM MARKET, BY TECHNOLOGY PLATFORM, 2018-2033 (USD THOUSAND)
TABLE 1077 UK INDIUM MARKET, BY END-USER INDUSTRY, 2018-2033 (USD THOUSAND)
TABLE 1078 UK CONSUMER ELECTRONICS INDUSTRY IN INDIUM MARKET, BY TYPE, 2018-2033 (USD THOUSAND)
TABLE 1079 UK FLAT PANEL DISPLAYS (LCD/OLED/LED) IN INDIUM MARKET, BY PURITY GRADE, 2018-2033 (USD THOUSAND)
TABLE 1080 UK TRANSPARENT CONDUCTIVE COATINGS (ITO) IN INDIUM MARKET, BY PURITY GRADE, 2018-2033 (USD THOUSAND)
TABLE 1081 UK TOUCHSCREEN DISPLAYS IN INDIUM MARKET, BY PURITY GRADE, 2018-2033 (USD THOUSAND)
TABLE 1082 UK FLEXIBLE DISPLAYS & ELECTRONICS IN INDIUM MARKET, BY PURITY GRADE, 2018-2033 (USD THOUSAND)
TABLE 1083 UK WEARABLE ELECTRONICS DEVICES IN INDIUM MARKET, BY PURITY GRADE, 2018-2033 (USD THOUSAND)
TABLE 1084 UK CAMERA & OPTICAL SENSORS IN INDIUM MARKET, BY PURITY GRADE, 2018-2033 (USD THOUSAND)
TABLE 1085 UK MINI-LED BACKLIGHTING IN INDIUM MARKET, BY PURITY GRADE, 2018-2033 (USD THOUSAND)
TABLE 1086 UK MICRO-LED DISPLAYS IN INDIUM MARKET, BY PURITY GRADE, 2018-2033 (USD THOUSAND)
TABLE 1087 UK DISPLAY PANEL INDUSTRY IN INDIUM MARKET, BY TYPE, 2018-2033 (USD THOUSAND)
TABLE 1088 UK LCD PANEL MANUFACTURING IN INDIUM MARKET, BY PURITY GRADE, 2018-2033 (USD THOUSAND)
TABLE 1089 UK OLED PANEL MANUFACTURING IN INDIUM MARKET, BY PURITY GRADE, 2018-2033 (USD THOUSAND)
TABLE 1090 UK DISPLAY PANEL MANUFACTURING IN INDIUM MARKET, BY PURITY GRADE, 2018-2033 (USD THOUSAND)
TABLE 1091 UK TOUCH PANEL SENSORS IN INDIUM MARKET, BY PURITY GRADE, 2018-2033 (USD THOUSAND)
TABLE 1092 UK TRANSPARENT CONDUCTIVE FILMS IN INDIUM MARKET, BY PURITY GRADE, 2018-2033 (USD THOUSAND)
TABLE 1093 UK FLEXIBLE & FOLDABLE DISPLAYS IN INDIUM MARKET, BY PURITY GRADE, 2018-2033 (USD THOUSAND)
TABLE 1094 UK AR/VR DISPLAYS IN INDIUM MARKET, BY PURITY GRADE, 2018-2033 (USD THOUSAND)
TABLE 1095 UK MICRODISPLAY DEVICES IN INDIUM MARKET, BY PURITY GRADE, 2018-2033 (USD THOUSAND)
TABLE 1096 UK BACKPLANE COATINGS IN INDIUM MARKET, BY PURITY GRADE, 2018-2033 (USD THOUSAND)
TABLE 1097 UK SEMICONDUCTOR INDUSTRY IN INDIUM MARKET, BY TYPE, 2018-2033 (USD THOUSAND)
TABLE 1098 UK III-V COMPOUND SEMICONDUCTORS IN INDIUM MARKET, BY PURITY GRADE, 2018-2033 (USD THOUSAND)
TABLE 1099 UK HIGH-FREQUENCY RF COMPONENTS IN INDIUM MARKET, BY PURITY GRADE, 2018-2033 (USD THOUSAND)
TABLE 1100 UK SEMICONDUCTOR SUBSTRATES & EPITAXY IN INDIUM MARKET, BY PURITY GRADE, 2018-2033 (USD THOUSAND)
TABLE 1101 UK LASER DIODES IN INDIUM MARKET, BY PURITY GRADE, 2018-2033 (USD THOUSAND)
TABLE 1102 UK PHOTODETECTORS IN INDIUM MARKET, BY PURITY GRADE, 2018-2033 (USD THOUSAND)
TABLE 1103 UK HIGH-SPEED OPTOELECTRONICS IN INDIUM MARKET, BY PURITY GRADE, 2018-2033 (USD THOUSAND)
TABLE 1104 UK INFRARED DETECTORS IN INDIUM MARKET, BY PURITY GRADE, 2018-2033 (USD THOUSAND)
TABLE 1105 UK INTEGRATED PHOTONIC CIRCUITS IN INDIUM MARKET, BY PURITY GRADE, 2018-2033 (USD THOUSAND)
TABLE 1106 UK SOLAR PHOTOVOLTAIC INDUSTRY IN INDIUM MARKET, BY TYPE, 2018-2033 (USD THOUSAND)
TABLE 1107 UK CIGS THIN-FILM SOLAR CELLS IN INDIUM MARKET, BY PURITY GRADE, 2018-2033 (USD THOUSAND)
TABLE 1108 UKHIGH-EFFICIENCY MODULES IN INDIUM MARKET, BY PURITY GRADE, 2018-2033 (USD THOUSAND)
TABLE 1109 UK THIN-FILM COATINGS IN INDIUM MARKET, BY PURITY GRADE, 2018-2033 (USD THOUSAND)
TABLE 1110 UK TRANSPARENT ELECTRODES IN INDIUM MARKET, BY PURITY GRADE, 2018-2033 (USD THOUSAND)
TABLE 1111 UK BIPV IN INDIUM MARKET, BY PURITY GRADE, 2018-2033 (USD THOUSAND)
TABLE 1112 UK FLEXIBLE SOLAR PANELS IN INDIUM MARKET, BY PURITY GRADE, 2018-2033 (USD THOUSAND)
TABLE 1113 UK PORTABLE SOLAR SYSTEMS IN INDIUM MARKET, BY PURITY GRADE, 2018-2033 (USD THOUSAND)
TABLE 1114 UK CONCENTRATED PV IN INDIUM MARKET, BY PURITY GRADE, 2018-2033 (USD THOUSAND)
TABLE 1115 UK AUTOMOTIVE INDUSTRY IN INDIUM MARKET, BY TYPE, 2018-2033 (USD THOUSAND)
TABLE 1116 UK AUTOMOTIVE DISPLAY PANELS IN INDIUM MARKET, BY PURITY GRADE, 2018-2033 (USD THOUSAND)
TABLE 1117 UKADAS SENSORS IN INDIUM MARKET, BY PURITY GRADE, 2018-2033 (USD THOUSAND)
TABLE 1118 UK VEHICLE CAMERA MODULES IN INDIUM MARKET, BY PURITY GRADE, 2018-2033 (USD THOUSAND)
TABLE 1119 UK AUTOMOTIVE OPTOELECTRONICS IN INDIUM MARKET, BY PURITY GRADE, 2018-2033 (USD THOUSAND)
TABLE 1120 UK POWER ELECTRONICS IN INDIUM MARKET, BY PURITY GRADE, 2018-2033 (USD THOUSAND)
TABLE 1121 UK TOUCHSCREEN INTERFACES IN INDIUM MARKET, BY PURITY GRADE, 2018-2033 (USD THOUSAND)
TABLE 1122 UK INFRARED SENSORS IN INDIUM MARKET, BY PURITY GRADE, 2018-2033 (USD THOUSAND)
TABLE 1123 UK SMART LIGHTING IN INDIUM MARKET, BY PURITY GRADE, 2018-2033 (USD THOUSAND)
TABLE 1124 UK TELECOMMUNICATION EQUIPMENT INDUSTRY IN INDIUM MARKET, BY TYPE, 2018-2033 (USD THOUSAND)
TABLE 1125 UK OPTICAL TRANSCEIVERS IN INDIUM MARKET, BY PURITY GRADE, 2018-2033 (USD THOUSAND)
TABLE 1126 UK RF POWER AMPLIFIERS IN INDIUM MARKET, BY PURITY GRADE, 2018-2033 (USD THOUSAND)
TABLE 1127 UK HIGH-FREQUENCY COMMUNICATION CHIPS IN INDIUM MARKET, BY PURITY GRADE, 2018-2033 (USD THOUSAND)
TABLE 1128 UK FIBER-OPTIC COMMUNICATION LASERS IN INDIUM MARKET, BY PURITY GRADE, 2018-2033 (USD THOUSAND)
TABLE 1129 UK PHOTODETECTORS FOR OPTICAL NETWORKS IN INDIUM MARKET, BY PURITY GRADE, 2018-2033 (USD THOUSAND)
TABLE 1130 UK 5G INFRASTRUCTURE COMPONENTS IN INDIUM MARKET, BY PURITY GRADE, 2018-2033 (USD THOUSAND)
TABLE 1131 UK OPTICAL NETWORK SWITCHING DEVICES IN INDIUM MARKET, BY PURITY GRADE, 2018-2033 (USD THOUSAND)
TABLE 1132 UK SATELLITE COMMUNICATION MODULES IN INDIUM MARKET, BY PURITY GRADE, 2018-2033 (USD THOUSAND)
TABLE 1133 UK OPTICAL & PHOTONICS INDUSTRY IN INDIUM MARKET, BY TYPE, 2018-2033 (USD THOUSAND)
TABLE 1134 UK OPTICAL COATINGS IN INDIUM MARKET, BY PURITY GRADE, 2018-2033 (USD THOUSAND)
TABLE 1135 UK FIBER OPTIC COMPONENTS IN INDIUM MARKET, BY PURITY GRADE, 2018-2033 (USD THOUSAND)
TABLE 1136 UK LASER COMPONENTS IN INDIUM MARKET, BY PURITY GRADE, 2018-2033 (USD THOUSAND)
TABLE 1137 UK OPTICAL SENSORS IN INDIUM MARKET, BY PURITY GRADE, 2018-2033 (USD THOUSAND)
TABLE 1138 UK INFRARED OPTICS IN INDIUM MARKET, BY PURITY GRADE, 2018-2033 (USD THOUSAND)
TABLE 1139 UK PICS IN INDIUM MARKET, BY PURITY GRADE, 2018-2033 (USD THOUSAND)
TABLE 1140 UK MIRRORS IN INDIUM MARKET, BY PURITY GRADE, 2018-2033 (USD THOUSAND)
TABLE 1141 UK SPECTROSCOPY IN INDIUM MARKET, BY PURITY GRADE, 2018-2033 (USD THOUSAND)
TABLE 1142 UK AEROSPACE & DEFENSE INDUSTRY IN INDIUM MARKET, BY TYPE, 2018-2033 (USD THOUSAND)
TABLE 1143 UK INFRARED IMAGING SYSTEMS IN INDIUM MARKET, BY PURITY GRADE, 2018-2033 (USD THOUSAND)
TABLE 1144 UK RADAR & RF COMPONENTS IN INDIUM MARKET, BY PURITY GRADE, 2018-2033 (USD THOUSAND)
TABLE 1145 UK SATELLITE COMMUNICATION IN INDIUM MARKET, BY PURITY GRADE, 2018-2033 (USD THOUSAND)
TABLE 1146 UK MILITARY OPTOELECTRONICS IN INDIUM MARKET, BY PURITY GRADE, 2018-2033 (USD THOUSAND)
TABLE 1147 UK AVIONICS DISPLAYS IN INDIUM MARKET, BY PURITY GRADE, 2018-2033 (USD THOUSAND)
TABLE 1148 UK SPACECRAFT SOLAR PANELS IN INDIUM MARKET, BY PURITY GRADE, 2018-2033 (USD THOUSAND)
TABLE 1149 UK THERMAL MATERIALS IN INDIUM MARKET, BY PURITY GRADE, 2018-2033 (USD THOUSAND)
TABLE 1150 UK CRYOGENIC MATERIALS IN INDIUM MARKET, BY PURITY GRADE, 2018-2033 (USD THOUSAND)
TABLE 1151 UK MEDICAL DEVICE INDUSTRY IN INDIUM MARKET, BY TYPE, 2018-2033 (USD THOUSAND)
TABLE 1152 UK MEDICAL IMAGING SENSORS IN INDIUM MARKET, BY PURITY GRADE, 2018-2033 (USD THOUSAND)
TABLE 1153 UK DIAGNOSTIC EQUIPMENT DISPLAYS IN INDIUM MARKET, BY PURITY GRADE, 2018-2033 (USD THOUSAND)
TABLE 1154 UK ADVANCED DIAGNOSTIC INSTRUMENTS IN INDIUM MARKET, BY PURITY GRADE, 2018-2033 (USD THOUSAND)
TABLE 1155 UK LASER SURGICAL EQUIPMENT IN INDIUM MARKET, BY PURITY GRADE, 2018-2033 (USD THOUSAND)
TABLE 1156 UK BIOMEDICAL OPTICAL DEVICES IN INDIUM MARKET, BY PURITY GRADE, 2018-2033 (USD THOUSAND)
TABLE 1157 UK RADIATION DETECTION EQUIPMENT IN INDIUM MARKET, BY PURITY GRADE, 2018-2033 (USD THOUSAND)
TABLE 1158 UK INFRARED MEDICAL SENSORS IN INDIUM MARKET, BY PURITY GRADE, 2018-2033 (USD THOUSAND)
TABLE 1159 UK PHOTOTHERAPY DEVICES IN INDIUM MARKET, BY PURITY GRADE, 2018-2033 (USD THOUSAND)
TABLE 1160 UK INDUSTRIAL EQUIPMENT MANUFACTURING IN INDIUM MARKET, BY TYPE, 2018-2033 (USD THOUSAND)
TABLE 1161 UK INDUSTRIAL SENSORS IN INDIUM MARKET, BY PURITY GRADE, 2018-2033 (USD THOUSAND)
TABLE 1162 UK VACUUM DEPOSITION COATINGS IN INDIUM MARKET, BY PURITY GRADE, 2018-2033 (USD THOUSAND)
TABLE 1163 UK PRECISION OPTICAL COMPONENTS IN INDIUM MARKET, BY PURITY GRADE, 2018-2033 (USD THOUSAND)
TABLE 1164 UK THERMAL INTERFACE MATERIALS IN INDIUM MARKET, BY PURITY GRADE, 2018-2033 (USD THOUSAND)
TABLE 1165 UK INDUSTRIAL LASER SYSTEMS IN INDIUM MARKET, BY PURITY GRADE, 2018-2033 (USD THOUSAND)
TABLE 1166 UK INDUSTRIAL INFRARED DETECTORS IN INDIUM MARKET, BY PURITY GRADE, 2018-2033 (USD THOUSAND)
TABLE 1167 UK PRECISION MEASUREMENT EQUIPMENT IN INDIUM MARKET, BY PURITY GRADE, 2018-2033 (USD THOUSAND)
TABLE 1168 UK SPECIALTY ELECTRONIC COMPONENTS IN INDIUM MARKET, BY PURITY GRADE, 2018-2033 (USD THOUSAND)
TABLE 1169 UK OTHERS IN INDIUM MARKET, BY TYPE, 2018-2033 (USD THOUSAND)
TABLE 1170 UK ADVANCED MATERIALS MANUFACTURING IN INDIUM MARKET, BY PURITY GRADE, 2018-2033 (USD THOUSAND)
TABLE 1171 UK SPECIALTY ALLOY PRODUCTION IN INDIUM MARKET, BY PURITY GRADE, 2018-2033 (USD THOUSAND)
TABLE 1172 UK THERMAL MANAGEMENT MATERIALS IN INDIUM MARKET, BY PURITY GRADE, 2018-2033 (USD THOUSAND)
TABLE 1173 UK PRECISION SCIENTIFIC INSTRUMENTS IN INDIUM MARKET, BY PURITY GRADE, 2018-2033 (USD THOUSAND)
TABLE 1174 UK RESEARCH INSTITUTES & UNIVERSITIES IN INDIUM MARKET, BY PURITY GRADE, 2018-2033 (USD THOUSAND)
TABLE 1175 UK NUCLEAR INDUSTRY APPLICATIONS IN INDIUM MARKET, BY PURITY GRADE, 2018-2033 (USD THOUSAND)
TABLE 1176 UK SPECIALTY CHEMICAL PRODUCTION IN INDIUM MARKET, BY PURITY GRADE, 2018-2033 (USD THOUSAND)
TABLE 1177 UK DEFENSE RESEARCH LABORATORIES IN INDIUM MARKET, BY PURITY GRADE, 2018-2033 (USD THOUSAND)
TABLE 1178 UK CRYOGENIC EQUIPMENT MANUFACTURING IN INDIUM MARKET, BY PURITY GRADE, 2018-2033 (USD THOUSAND)
TABLE 1179 ITALY INDIUM MARKET, BY PRODUCT TYPE, 2018-2033 (USD THOUSAND)
TABLE 1180 ITALY INGOTS IN INDIUM MARKET, BY TYPE, 2018-2033 (USD THOUSAND)
TABLE 1181 ITALY INDIUM MARKET, BY MATERIAL COMPOSITION, 2018-2033 (USD THOUSAND)
TABLE 1182 ITALY INDIUM ALLOYS IN INDIUM MARKET, BY TYPE, 2018-2033 (USD THOUSAND)
TABLE 1183 ITALY INDIUM COMPOUNDS IN INDIUM MARKET, BY TYPE, 2018-2033 (USD THOUSAND)
TABLE 1184 ITALY INDIUM MARKET, BY PURITY GRADE, 2018-2033 (USD THOUSAND)
TABLE 1185 ITALY INDIUM MARKET, BY EXTRACTION SOURCE, 2018-2033 (USD THOUSAND)
TABLE 1186 ITALY PRIMARY PRODUCTION IN INDIUM MARKET, BY TYPE, 2018-2033 (USD THOUSAND)
TABLE 1187 ITALY SECONDARY PRODUCTION IN INDIUM MARKET, BY TYPE, 2018-2033 (USD THOUSAND)
TABLE 1188 ITALY INDIUM MARKET, BY DISTRIBUTION CHANNEL, 2018-2033 (USD THOUSAND)
TABLE 1189 ITALY INDIUM MARKET, BY TECHNOLOGY PLATFORM, 2018-2033 (USD THOUSAND)
TABLE 1190 ITALY INDIUM MARKET, BY END-USER INDUSTRY, 2018-2033 (USD THOUSAND)
TABLE 1191 ITALY CONSUMER ELECTRONICS INDUSTRY IN INDIUM MARKET, BY TYPE, 2018-2033 (USD THOUSAND)
TABLE 1192 ITALY FLAT PANEL DISPLAYS (LCD/OLED/LED) IN INDIUM MARKET, BY PURITY GRADE, 2018-2033 (USD THOUSAND)
TABLE 1193 ITALY TRANSPARENT CONDUCTIVE COATINGS (ITO) IN INDIUM MARKET, BY PURITY GRADE, 2018-2033 (USD THOUSAND)
TABLE 1194 ITALY TOUCHSCREEN DISPLAYS IN INDIUM MARKET, BY PURITY GRADE, 2018-2033 (USD THOUSAND)
TABLE 1195 ITALY FLEXIBLE DISPLAYS & ELECTRONICS IN INDIUM MARKET, BY PURITY GRADE, 2018-2033 (USD THOUSAND)
TABLE 1196 ITALY WEARABLE ELECTRONICS DEVICES IN INDIUM MARKET, BY PURITY GRADE, 2018-2033 (USD THOUSAND)
TABLE 1197 ITALY CAMERA & OPTICAL SENSORS IN INDIUM MARKET, BY PURITY GRADE, 2018-2033 (USD THOUSAND)
TABLE 1198 ITALY MINI-LED BACKLIGHTING IN INDIUM MARKET, BY PURITY GRADE, 2018-2033 (USD THOUSAND)
TABLE 1199 ITALY MICRO-LED DISPLAYS IN INDIUM MARKET, BY PURITY GRADE, 2018-2033 (USD THOUSAND)
TABLE 1200 ITALY DISPLAY PANEL INDUSTRY IN INDIUM MARKET, BY TYPE, 2018-2033 (USD THOUSAND)
TABLE 1201 ITALY LCD PANEL MANUFACTURING IN INDIUM MARKET, BY PURITY GRADE, 2018-2033 (USD THOUSAND)
TABLE 1202 ITALY OLED PANEL MANUFACTURING IN INDIUM MARKET, BY PURITY GRADE, 2018-2033 (USD THOUSAND)
TABLE 1203 ITALY DISPLAY PANEL MANUFACTURING IN INDIUM MARKET, BY PURITY GRADE, 2018-2033 (USD THOUSAND)
TABLE 1204 ITALY TOUCH PANEL SENSORS IN INDIUM MARKET, BY PURITY GRADE, 2018-2033 (USD THOUSAND)
TABLE 1205 ITALY TRANSPARENT CONDUCTIVE FILMS IN INDIUM MARKET, BY PURITY GRADE, 2018-2033 (USD THOUSAND)
TABLE 1206 ITALY FLEXIBLE & FOLDABLE DISPLAYS IN INDIUM MARKET, BY PURITY GRADE, 2018-2033 (USD THOUSAND)
TABLE 1207 ITALY AR/VR DISPLAYS IN INDIUM MARKET, BY PURITY GRADE, 2018-2033 (USD THOUSAND)
TABLE 1208 ITALY MICRODISPLAY DEVICES IN INDIUM MARKET, BY PURITY GRADE, 2018-2033 (USD THOUSAND)
TABLE 1209 ITALY BACKPLANE COATINGS IN INDIUM MARKET, BY PURITY GRADE, 2018-2033 (USD THOUSAND)
TABLE 1210 ITALY SEMICONDUCTOR INDUSTRY IN INDIUM MARKET, BY TYPE, 2018-2033 (USD THOUSAND)
TABLE 1211 ITALY III-V COMPOUND SEMICONDUCTORS IN INDIUM MARKET, BY PURITY GRADE, 2018-2033 (USD THOUSAND)
TABLE 1212 ITALY HIGH-FREQUENCY RF COMPONENTS IN INDIUM MARKET, BY PURITY GRADE, 2018-2033 (USD THOUSAND)
TABLE 1213 ITALY SEMICONDUCTOR SUBSTRATES & EPITAXY IN INDIUM MARKET, BY PURITY GRADE, 2018-2033 (USD THOUSAND)
TABLE 1214 ITALY LASER DIODES IN INDIUM MARKET, BY PURITY GRADE, 2018-2033 (USD THOUSAND)
TABLE 1215 ITALY PHOTODETECTORS IN INDIUM MARKET, BY PURITY GRADE, 2018-2033 (USD THOUSAND)
TABLE 1216 ITALY HIGH-SPEED OPTOELECTRONICS IN INDIUM MARKET, BY PURITY GRADE, 2018-2033 (USD THOUSAND)
TABLE 1217 ITALY INFRARED DETECTORS IN INDIUM MARKET, BY PURITY GRADE, 2018-2033 (USD THOUSAND)
TABLE 1218 ITALY INTEGRATED PHOTONIC CIRCUITS IN INDIUM MARKET, BY PURITY GRADE, 2018-2033 (USD THOUSAND)
TABLE 1219 ITALY SOLAR PHOTOVOLTAIC INDUSTRY IN INDIUM MARKET, BY TYPE, 2018-2033 (USD THOUSAND)
TABLE 1220 ITALY CIGS THIN-FILM SOLAR CELLS IN INDIUM MARKET, BY PURITY GRADE, 2018-2033 (USD THOUSAND)
TABLE 1221 ITALYHIGH-EFFICIENCY MODULES IN INDIUM MARKET, BY PURITY GRADE, 2018-2033 (USD THOUSAND)
TABLE 1222 ITALY THIN-FILM COATINGS IN INDIUM MARKET, BY PURITY GRADE, 2018-2033 (USD THOUSAND)
TABLE 1223 ITALY TRANSPARENT ELECTRODES IN INDIUM MARKET, BY PURITY GRADE, 2018-2033 (USD THOUSAND)
TABLE 1224 ITALY BIPV IN INDIUM MARKET, BY PURITY GRADE, 2018-2033 (USD THOUSAND)
TABLE 1225 ITALY FLEXIBLE SOLAR PANELS IN INDIUM MARKET, BY PURITY GRADE, 2018-2033 (USD THOUSAND)
TABLE 1226 ITALY PORTABLE SOLAR SYSTEMS IN INDIUM MARKET, BY PURITY GRADE, 2018-2033 (USD THOUSAND)
TABLE 1227 ITALY CONCENTRATED PV IN INDIUM MARKET, BY PURITY GRADE, 2018-2033 (USD THOUSAND)
TABLE 1228 ITALY AUTOMOTIVE INDUSTRY IN INDIUM MARKET, BY TYPE, 2018-2033 (USD THOUSAND)
TABLE 1229 ITALY AUTOMOTIVE DISPLAY PANELS IN INDIUM MARKET, BY PURITY GRADE, 2018-2033 (USD THOUSAND)
TABLE 1230 ITALYADAS SENSORS IN INDIUM MARKET, BY PURITY GRADE, 2018-2033 (USD THOUSAND)
TABLE 1231 ITALY VEHICLE CAMERA MODULES IN INDIUM MARKET, BY PURITY GRADE, 2018-2033 (USD THOUSAND)
TABLE 1232 ITALY AUTOMOTIVE OPTOELECTRONICS IN INDIUM MARKET, BY PURITY GRADE, 2018-2033 (USD THOUSAND)
TABLE 1233 ITALY POWER ELECTRONICS IN INDIUM MARKET, BY PURITY GRADE, 2018-2033 (USD THOUSAND)
TABLE 1234 ITALY TOUCHSCREEN INTERFACES IN INDIUM MARKET, BY PURITY GRADE, 2018-2033 (USD THOUSAND)
TABLE 1235 ITALY INFRARED SENSORS IN INDIUM MARKET, BY PURITY GRADE, 2018-2033 (USD THOUSAND)
TABLE 1236 ITALY SMART LIGHTING IN INDIUM MARKET, BY PURITY GRADE, 2018-2033 (USD THOUSAND)
TABLE 1237 ITALY TELECOMMUNICATION EQUIPMENT INDUSTRY IN INDIUM MARKET, BY TYPE, 2018-2033 (USD THOUSAND)
TABLE 1238 ITALY OPTICAL TRANSCEIVERS IN INDIUM MARKET, BY PURITY GRADE, 2018-2033 (USD THOUSAND)
TABLE 1239 ITALY RF POWER AMPLIFIERS IN INDIUM MARKET, BY PURITY GRADE, 2018-2033 (USD THOUSAND)
TABLE 1240 ITALY HIGH-FREQUENCY COMMUNICATION CHIPS IN INDIUM MARKET, BY PURITY GRADE, 2018-2033 (USD THOUSAND)
TABLE 1241 ITALY FIBER-OPTIC COMMUNICATION LASERS IN INDIUM MARKET, BY PURITY GRADE, 2018-2033 (USD THOUSAND)
TABLE 1242 ITALY PHOTODETECTORS FOR OPTICAL NETWORKS IN INDIUM MARKET, BY PURITY GRADE, 2018-2033 (USD THOUSAND)
TABLE 1243 ITALY 5G INFRASTRUCTURE COMPONENTS IN INDIUM MARKET, BY PURITY GRADE, 2018-2033 (USD THOUSAND)
TABLE 1244 ITALY OPTICAL NETWORK SWITCHING DEVICES IN INDIUM MARKET, BY PURITY GRADE, 2018-2033 (USD THOUSAND)
TABLE 1245 ITALY SATELLITE COMMUNICATION MODULES IN INDIUM MARKET, BY PURITY GRADE, 2018-2033 (USD THOUSAND)
TABLE 1246 ITALY OPTICAL & PHOTONICS INDUSTRY IN INDIUM MARKET, BY TYPE, 2018-2033 (USD THOUSAND)
TABLE 1247 ITALY OPTICAL COATINGS IN INDIUM MARKET, BY PURITY GRADE, 2018-2033 (USD THOUSAND)
TABLE 1248 ITALY FIBER OPTIC COMPONENTS IN INDIUM MARKET, BY PURITY GRADE, 2018-2033 (USD THOUSAND)
TABLE 1249 ITALY LASER COMPONENTS IN INDIUM MARKET, BY PURITY GRADE, 2018-2033 (USD THOUSAND)
TABLE 1250 ITALY OPTICAL SENSORS IN INDIUM MARKET, BY PURITY GRADE, 2018-2033 (USD THOUSAND)
TABLE 1251 ITALY INFRARED OPTICS IN INDIUM MARKET, BY PURITY GRADE, 2018-2033 (USD THOUSAND)
TABLE 1252 ITALY PICS IN INDIUM MARKET, BY PURITY GRADE, 2018-2033 (USD THOUSAND)
TABLE 1253 ITALY MIRRORS IN INDIUM MARKET, BY PURITY GRADE, 2018-2033 (USD THOUSAND)
TABLE 1254 ITALY SPECTROSCOPY IN INDIUM MARKET, BY PURITY GRADE, 2018-2033 (USD THOUSAND)
TABLE 1255 ITALY AEROSPACE & DEFENSE INDUSTRY IN INDIUM MARKET, BY TYPE, 2018-2033 (USD THOUSAND)
TABLE 1256 ITALY INFRARED IMAGING SYSTEMS IN INDIUM MARKET, BY PURITY GRADE, 2018-2033 (USD THOUSAND)
TABLE 1257 ITALY RADAR & RF COMPONENTS IN INDIUM MARKET, BY PURITY GRADE, 2018-2033 (USD THOUSAND)
TABLE 1258 ITALY SATELLITE COMMUNICATION IN INDIUM MARKET, BY PURITY GRADE, 2018-2033 (USD THOUSAND)
TABLE 1259 ITALY MILITARY OPTOELECTRONICS IN INDIUM MARKET, BY PURITY GRADE, 2018-2033 (USD THOUSAND)
TABLE 1260 ITALY AVIONICS DISPLAYS IN INDIUM MARKET, BY PURITY GRADE, 2018-2033 (USD THOUSAND)
TABLE 1261 ITALY SPACECRAFT SOLAR PANELS IN INDIUM MARKET, BY PURITY GRADE, 2018-2033 (USD THOUSAND)
TABLE 1262 ITALY THERMAL MATERIALS IN INDIUM MARKET, BY PURITY GRADE, 2018-2033 (USD THOUSAND)
TABLE 1263 ITALY CRYOGENIC MATERIALS IN INDIUM MARKET, BY PURITY GRADE, 2018-2033 (USD THOUSAND)
TABLE 1264 ITALY MEDICAL DEVICE INDUSTRY IN INDIUM MARKET, BY TYPE, 2018-2033 (USD THOUSAND)
TABLE 1265 ITALY MEDICAL IMAGING SENSORS IN INDIUM MARKET, BY PURITY GRADE, 2018-2033 (USD THOUSAND)
TABLE 1266 ITALY DIAGNOSTIC EQUIPMENT DISPLAYS IN INDIUM MARKET, BY PURITY GRADE, 2018-2033 (USD THOUSAND)
TABLE 1267 ITALY ADVANCED DIAGNOSTIC INSTRUMENTS IN INDIUM MARKET, BY PURITY GRADE, 2018-2033 (USD THOUSAND)
TABLE 1268 ITALY LASER SURGICAL EQUIPMENT IN INDIUM MARKET, BY PURITY GRADE, 2018-2033 (USD THOUSAND)
TABLE 1269 ITALY BIOMEDICAL OPTICAL DEVICES IN INDIUM MARKET, BY PURITY GRADE, 2018-2033 (USD THOUSAND)
TABLE 1270 ITALY RADIATION DETECTION EQUIPMENT IN INDIUM MARKET, BY PURITY GRADE, 2018-2033 (USD THOUSAND)
TABLE 1271 ITALY INFRARED MEDICAL SENSORS IN INDIUM MARKET, BY PURITY GRADE, 2018-2033 (USD THOUSAND)
TABLE 1272 ITALY PHOTOTHERAPY DEVICES IN INDIUM MARKET, BY PURITY GRADE, 2018-2033 (USD THOUSAND)
TABLE 1273 ITALY INDUSTRIAL EQUIPMENT MANUFACTURING IN INDIUM MARKET, BY TYPE, 2018-2033 (USD THOUSAND)
TABLE 1274 ITALY INDUSTRIAL SENSORS IN INDIUM MARKET, BY PURITY GRADE, 2018-2033 (USD THOUSAND)
TABLE 1275 ITALY VACUUM DEPOSITION COATINGS IN INDIUM MARKET, BY PURITY GRADE, 2018-2033 (USD THOUSAND)
TABLE 1276 ITALY PRECISION OPTICAL COMPONENTS IN INDIUM MARKET, BY PURITY GRADE, 2018-2033 (USD THOUSAND)
TABLE 1277 ITALY THERMAL INTERFACE MATERIALS IN INDIUM MARKET, BY PURITY GRADE, 2018-2033 (USD THOUSAND)
TABLE 1278 ITALY INDUSTRIAL LASER SYSTEMS IN INDIUM MARKET, BY PURITY GRADE, 2018-2033 (USD THOUSAND)
TABLE 1279 ITALY INDUSTRIAL INFRARED DETECTORS IN INDIUM MARKET, BY PURITY GRADE, 2018-2033 (USD THOUSAND)
TABLE 1280 ITALY PRECISION MEASUREMENT EQUIPMENT IN INDIUM MARKET, BY PURITY GRADE, 2018-2033 (USD THOUSAND)
TABLE 1281 ITALY SPECIALTY ELECTRONIC COMPONENTS IN INDIUM MARKET, BY PURITY GRADE, 2018-2033 (USD THOUSAND)
TABLE 1282 ITALY OTHERS IN INDIUM MARKET, BY TYPE, 2018-2033 (USD THOUSAND)
TABLE 1283 ITALY ADVANCED MATERIALS MANUFACTURING IN INDIUM MARKET, BY PURITY GRADE, 2018-2033 (USD THOUSAND)
TABLE 1284 ITALY SPECIALTY ALLOY PRODUCTION IN INDIUM MARKET, BY PURITY GRADE, 2018-2033 (USD THOUSAND)
TABLE 1285 ITALY THERMAL MANAGEMENT MATERIALS IN INDIUM MARKET, BY PURITY GRADE, 2018-2033 (USD THOUSAND)
TABLE 1286 ITALY PRECISION SCIENTIFIC INSTRUMENTS IN INDIUM MARKET, BY PURITY GRADE, 2018-2033 (USD THOUSAND)
TABLE 1287 ITALY RESEARCH INSTITUTES & UNIVERSITIES IN INDIUM MARKET, BY PURITY GRADE, 2018-2033 (USD THOUSAND)
TABLE 1288 ITALY NUCLEAR INDUSTRY APPLICATIONS IN INDIUM MARKET, BY PURITY GRADE, 2018-2033 (USD THOUSAND)
TABLE 1289 ITALY SPECIALTY CHEMICAL PRODUCTION IN INDIUM MARKET, BY PURITY GRADE, 2018-2033 (USD THOUSAND)
TABLE 1290 ITALY DEFENSE RESEARCH LABORATORIES IN INDIUM MARKET, BY PURITY GRADE, 2018-2033 (USD THOUSAND)
TABLE 1291 ITALY CRYOGENIC EQUIPMENT MANUFACTURING IN INDIUM MARKET, BY PURITY GRADE, 2018-2033 (USD THOUSAND)
TABLE 1292 SPAIN INDIUM MARKET, BY PRODUCT TYPE, 2018-2033 (USD THOUSAND)
TABLE 1293 SPAIN INGOTS IN INDIUM MARKET, BY TYPE, 2018-2033 (USD THOUSAND)
TABLE 1294 SPAIN INDIUM MARKET, BY MATERIAL COMPOSITION, 2018-2033 (USD THOUSAND)
TABLE 1295 SPAIN INDIUM ALLOYS IN INDIUM MARKET, BY TYPE, 2018-2033 (USD THOUSAND)
TABLE 1296 SPAIN INDIUM COMPOUNDS IN INDIUM MARKET, BY TYPE, 2018-2033 (USD THOUSAND)
TABLE 1297 SPAIN INDIUM MARKET, BY PURITY GRADE, 2018-2033 (USD THOUSAND)
TABLE 1298 SPAIN INDIUM MARKET, BY EXTRACTION SOURCE, 2018-2033 (USD THOUSAND)
TABLE 1299 SPAIN PRIMARY PRODUCTION IN INDIUM MARKET, BY TYPE, 2018-2033 (USD THOUSAND)
TABLE 1300 SPAIN SECONDARY PRODUCTION IN INDIUM MARKET, BY TYPE, 2018-2033 (USD THOUSAND)
TABLE 1301 SPAIN INDIUM MARKET, BY DISTRIBUTION CHANNEL, 2018-2033 (USD THOUSAND)
TABLE 1302 SPAIN INDIUM MARKET, BY TECHNOLOGY PLATFORM, 2018-2033 (USD THOUSAND)
TABLE 1303 SPAIN INDIUM MARKET, BY END-USER INDUSTRY, 2018-2033 (USD THOUSAND)
TABLE 1304 SPAIN CONSUMER ELECTRONICS INDUSTRY IN INDIUM MARKET, BY TYPE, 2018-2033 (USD THOUSAND)
TABLE 1305 SPAIN FLAT PANEL DISPLAYS (LCD/OLED/LED) IN INDIUM MARKET, BY PURITY GRADE, 2018-2033 (USD THOUSAND)
TABLE 1306 SPAIN TRANSPARENT CONDUCTIVE COATINGS (ITO) IN INDIUM MARKET, BY PURITY GRADE, 2018-2033 (USD THOUSAND)
TABLE 1307 SPAIN TOUCHSCREEN DISPLAYS IN INDIUM MARKET, BY PURITY GRADE, 2018-2033 (USD THOUSAND)
TABLE 1308 SPAIN FLEXIBLE DISPLAYS & ELECTRONICS IN INDIUM MARKET, BY PURITY GRADE, 2018-2033 (USD THOUSAND)
TABLE 1309 SPAIN WEARABLE ELECTRONICS DEVICES IN INDIUM MARKET, BY PURITY GRADE, 2018-2033 (USD THOUSAND)
TABLE 1310 SPAIN CAMERA & OPTICAL SENSORS IN INDIUM MARKET, BY PURITY GRADE, 2018-2033 (USD THOUSAND)
TABLE 1311 SPAIN MINI-LED BACKLIGHTING IN INDIUM MARKET, BY PURITY GRADE, 2018-2033 (USD THOUSAND)
TABLE 1312 SPAIN MICRO-LED DISPLAYS IN INDIUM MARKET, BY PURITY GRADE, 2018-2033 (USD THOUSAND)
TABLE 1313 SPAIN DISPLAY PANEL INDUSTRY IN INDIUM MARKET, BY TYPE, 2018-2033 (USD THOUSAND)
TABLE 1314 SPAIN LCD PANEL MANUFACTURING IN INDIUM MARKET, BY PURITY GRADE, 2018-2033 (USD THOUSAND)
TABLE 1315 SPAIN OLED PANEL MANUFACTURING IN INDIUM MARKET, BY PURITY GRADE, 2018-2033 (USD THOUSAND)
TABLE 1316 SPAIN DISPLAY PANEL MANUFACTURING IN INDIUM MARKET, BY PURITY GRADE, 2018-2033 (USD THOUSAND)
TABLE 1317 SPAIN TOUCH PANEL SENSORS IN INDIUM MARKET, BY PURITY GRADE, 2018-2033 (USD THOUSAND)
TABLE 1318 SPAIN TRANSPARENT CONDUCTIVE FILMS IN INDIUM MARKET, BY PURITY GRADE, 2018-2033 (USD THOUSAND)
TABLE 1319 SPAIN FLEXIBLE & FOLDABLE DISPLAYS IN INDIUM MARKET, BY PURITY GRADE, 2018-2033 (USD THOUSAND)
TABLE 1320 SPAIN AR/VR DISPLAYS IN INDIUM MARKET, BY PURITY GRADE, 2018-2033 (USD THOUSAND)
TABLE 1321 SPAIN MICRODISPLAY DEVICES IN INDIUM MARKET, BY PURITY GRADE, 2018-2033 (USD THOUSAND)
TABLE 1322 SPAIN BACKPLANE COATINGS IN INDIUM MARKET, BY PURITY GRADE, 2018-2033 (USD THOUSAND)
TABLE 1323 SPAIN SEMICONDUCTOR INDUSTRY IN INDIUM MARKET, BY TYPE, 2018-2033 (USD THOUSAND)
TABLE 1324 SPAIN III-V COMPOUND SEMICONDUCTORS IN INDIUM MARKET, BY PURITY GRADE, 2018-2033 (USD THOUSAND)
TABLE 1325 SPAIN HIGH-FREQUENCY RF COMPONENTS IN INDIUM MARKET, BY PURITY GRADE, 2018-2033 (USD THOUSAND)
TABLE 1326 SPAIN SEMICONDUCTOR SUBSTRATES & EPITAXY IN INDIUM MARKET, BY PURITY GRADE, 2018-2033 (USD THOUSAND)
TABLE 1327 SPAIN LASER DIODES IN INDIUM MARKET, BY PURITY GRADE, 2018-2033 (USD THOUSAND)
TABLE 1328 SPAIN PHOTODETECTORS IN INDIUM MARKET, BY PURITY GRADE, 2018-2033 (USD THOUSAND)
TABLE 1329 SPAIN HIGH-SPEED OPTOELECTRONICS IN INDIUM MARKET, BY PURITY GRADE, 2018-2033 (USD THOUSAND)
TABLE 1330 SPAIN INFRARED DETECTORS IN INDIUM MARKET, BY PURITY GRADE, 2018-2033 (USD THOUSAND)
TABLE 1331 SPAIN INTEGRATED PHOTONIC CIRCUITS IN INDIUM MARKET, BY PURITY GRADE, 2018-2033 (USD THOUSAND)
TABLE 1332 SPAIN SOLAR PHOTOVOLTAIC INDUSTRY IN INDIUM MARKET, BY TYPE, 2018-2033 (USD THOUSAND)
TABLE 1333 SPAIN CIGS THIN-FILM SOLAR CELLS IN INDIUM MARKET, BY PURITY GRADE, 2018-2033 (USD THOUSAND)
TABLE 1334 SPAINHIGH-EFFICIENCY MODULES IN INDIUM MARKET, BY PURITY GRADE, 2018-2033 (USD THOUSAND)
TABLE 1335 SPAIN THIN-FILM COATINGS IN INDIUM MARKET, BY PURITY GRADE, 2018-2033 (USD THOUSAND)
TABLE 1336 SPAIN TRANSPARENT ELECTRODES IN INDIUM MARKET, BY PURITY GRADE, 2018-2033 (USD THOUSAND)
TABLE 1337 SPAIN BIPV IN INDIUM MARKET, BY PURITY GRADE, 2018-2033 (USD THOUSAND)
TABLE 1338 SPAIN FLEXIBLE SOLAR PANELS IN INDIUM MARKET, BY PURITY GRADE, 2018-2033 (USD THOUSAND)
TABLE 1339 SPAIN PORTABLE SOLAR SYSTEMS IN INDIUM MARKET, BY PURITY GRADE, 2018-2033 (USD THOUSAND)
TABLE 1340 SPAIN CONCENTRATED PV IN INDIUM MARKET, BY PURITY GRADE, 2018-2033 (USD THOUSAND)
TABLE 1341 SPAIN AUTOMOTIVE INDUSTRY IN INDIUM MARKET, BY TYPE, 2018-2033 (USD THOUSAND)
TABLE 1342 SPAIN AUTOMOTIVE DISPLAY PANELS IN INDIUM MARKET, BY PURITY GRADE, 2018-2033 (USD THOUSAND)
TABLE 1343 SPAINADAS SENSORS IN INDIUM MARKET, BY PURITY GRADE, 2018-2033 (USD THOUSAND)
TABLE 1344 SPAIN VEHICLE CAMERA MODULES IN INDIUM MARKET, BY PURITY GRADE, 2018-2033 (USD THOUSAND)
TABLE 1345 SPAIN AUTOMOTIVE OPTOELECTRONICS IN INDIUM MARKET, BY PURITY GRADE, 2018-2033 (USD THOUSAND)
TABLE 1346 SPAIN POWER ELECTRONICS IN INDIUM MARKET, BY PURITY GRADE, 2018-2033 (USD THOUSAND)
TABLE 1347 SPAIN TOUCHSCREEN INTERFACES IN INDIUM MARKET, BY PURITY GRADE, 2018-2033 (USD THOUSAND)
TABLE 1348 SPAIN INFRARED SENSORS IN INDIUM MARKET, BY PURITY GRADE, 2018-2033 (USD THOUSAND)
TABLE 1349 SPAIN SMART LIGHTING IN INDIUM MARKET, BY PURITY GRADE, 2018-2033 (USD THOUSAND)
TABLE 1350 SPAIN TELECOMMUNICATION EQUIPMENT INDUSTRY IN INDIUM MARKET, BY TYPE, 2018-2033 (USD THOUSAND)
TABLE 1351 SPAIN OPTICAL TRANSCEIVERS IN INDIUM MARKET, BY PURITY GRADE, 2018-2033 (USD THOUSAND)
TABLE 1352 SPAIN RF POWER AMPLIFIERS IN INDIUM MARKET, BY PURITY GRADE, 2018-2033 (USD THOUSAND)
TABLE 1353 SPAIN HIGH-FREQUENCY COMMUNICATION CHIPS IN INDIUM MARKET, BY PURITY GRADE, 2018-2033 (USD THOUSAND)
TABLE 1354 SPAIN FIBER-OPTIC COMMUNICATION LASERS IN INDIUM MARKET, BY PURITY GRADE, 2018-2033 (USD THOUSAND)
TABLE 1355 SPAIN PHOTODETECTORS FOR OPTICAL NETWORKS IN INDIUM MARKET, BY PURITY GRADE, 2018-2033 (USD THOUSAND)
TABLE 1356 SPAIN 5G INFRASTRUCTURE COMPONENTS IN INDIUM MARKET, BY PURITY GRADE, 2018-2033 (USD THOUSAND)
TABLE 1357 SPAIN OPTICAL NETWORK SWITCHING DEVICES IN INDIUM MARKET, BY PURITY GRADE, 2018-2033 (USD THOUSAND)
TABLE 1358 SPAIN SATELLITE COMMUNICATION MODULES IN INDIUM MARKET, BY PURITY GRADE, 2018-2033 (USD THOUSAND)
TABLE 1359 SPAIN OPTICAL & PHOTONICS INDUSTRY IN INDIUM MARKET, BY TYPE, 2018-2033 (USD THOUSAND)
TABLE 1360 SPAIN OPTICAL COATINGS IN INDIUM MARKET, BY PURITY GRADE, 2018-2033 (USD THOUSAND)
TABLE 1361 SPAIN FIBER OPTIC COMPONENTS IN INDIUM MARKET, BY PURITY GRADE, 2018-2033 (USD THOUSAND)
TABLE 1362 SPAIN LASER COMPONENTS IN INDIUM MARKET, BY PURITY GRADE, 2018-2033 (USD THOUSAND)
TABLE 1363 SPAIN OPTICAL SENSORS IN INDIUM MARKET, BY PURITY GRADE, 2018-2033 (USD THOUSAND)
TABLE 1364 SPAIN INFRARED OPTICS IN INDIUM MARKET, BY PURITY GRADE, 2018-2033 (USD THOUSAND)
TABLE 1365 SPAIN PICS IN INDIUM MARKET, BY PURITY GRADE, 2018-2033 (USD THOUSAND)
TABLE 1366 SPAIN MIRRORS IN INDIUM MARKET, BY PURITY GRADE, 2018-2033 (USD THOUSAND)
TABLE 1367 SPAIN SPECTROSCOPY IN INDIUM MARKET, BY PURITY GRADE, 2018-2033 (USD THOUSAND)
TABLE 1368 SPAIN AEROSPACE & DEFENSE INDUSTRY IN INDIUM MARKET, BY TYPE, 2018-2033 (USD THOUSAND)
TABLE 1369 SPAIN INFRARED IMAGING SYSTEMS IN INDIUM MARKET, BY PURITY GRADE, 2018-2033 (USD THOUSAND)
TABLE 1370 SPAIN RADAR & RF COMPONENTS IN INDIUM MARKET, BY PURITY GRADE, 2018-2033 (USD THOUSAND)
TABLE 1371 SPAIN SATELLITE COMMUNICATION IN INDIUM MARKET, BY PURITY GRADE, 2018-2033 (USD THOUSAND)
TABLE 1372 SPAIN MILITARY OPTOELECTRONICS IN INDIUM MARKET, BY PURITY GRADE, 2018-2033 (USD THOUSAND)
TABLE 1373 SPAIN AVIONICS DISPLAYS IN INDIUM MARKET, BY PURITY GRADE, 2018-2033 (USD THOUSAND)
TABLE 1374 SPAIN SPACECRAFT SOLAR PANELS IN INDIUM MARKET, BY PURITY GRADE, 2018-2033 (USD THOUSAND)
TABLE 1375 SPAIN THERMAL MATERIALS IN INDIUM MARKET, BY PURITY GRADE, 2018-2033 (USD THOUSAND)
TABLE 1376 SPAIN CRYOGENIC MATERIALS IN INDIUM MARKET, BY PURITY GRADE, 2018-2033 (USD THOUSAND)
TABLE 1377 SPAIN MEDICAL DEVICE INDUSTRY IN INDIUM MARKET, BY TYPE, 2018-2033 (USD THOUSAND)
TABLE 1378 SPAIN MEDICAL IMAGING SENSORS IN INDIUM MARKET, BY PURITY GRADE, 2018-2033 (USD THOUSAND)
TABLE 1379 SPAIN DIAGNOSTIC EQUIPMENT DISPLAYS IN INDIUM MARKET, BY PURITY GRADE, 2018-2033 (USD THOUSAND)
TABLE 1380 SPAIN ADVANCED DIAGNOSTIC INSTRUMENTS IN INDIUM MARKET, BY PURITY GRADE, 2018-2033 (USD THOUSAND)
TABLE 1381 SPAIN LASER SURGICAL EQUIPMENT IN INDIUM MARKET, BY PURITY GRADE, 2018-2033 (USD THOUSAND)
TABLE 1382 SPAIN BIOMEDICAL OPTICAL DEVICES IN INDIUM MARKET, BY PURITY GRADE, 2018-2033 (USD THOUSAND)
TABLE 1383 SPAIN RADIATION DETECTION EQUIPMENT IN INDIUM MARKET, BY PURITY GRADE, 2018-2033 (USD THOUSAND)
TABLE 1384 SPAIN INFRARED MEDICAL SENSORS IN INDIUM MARKET, BY PURITY GRADE, 2018-2033 (USD THOUSAND)
TABLE 1385 SPAIN PHOTOTHERAPY DEVICES IN INDIUM MARKET, BY PURITY GRADE, 2018-2033 (USD THOUSAND)
TABLE 1386 SPAIN INDUSTRIAL EQUIPMENT MANUFACTURING IN INDIUM MARKET, BY TYPE, 2018-2033 (USD THOUSAND)
TABLE 1387 SPAIN INDUSTRIAL SENSORS IN INDIUM MARKET, BY PURITY GRADE, 2018-2033 (USD THOUSAND)
TABLE 1388 SPAIN VACUUM DEPOSITION COATINGS IN INDIUM MARKET, BY PURITY GRADE, 2018-2033 (USD THOUSAND)
TABLE 1389 SPAIN PRECISION OPTICAL COMPONENTS IN INDIUM MARKET, BY PURITY GRADE, 2018-2033 (USD THOUSAND)
TABLE 1390 SPAIN THERMAL INTERFACE MATERIALS IN INDIUM MARKET, BY PURITY GRADE, 2018-2033 (USD THOUSAND)
TABLE 1391 SPAIN INDUSTRIAL LASER SYSTEMS IN INDIUM MARKET, BY PURITY GRADE, 2018-2033 (USD THOUSAND)
TABLE 1392 SPAIN INDUSTRIAL INFRARED DETECTORS IN INDIUM MARKET, BY PURITY GRADE, 2018-2033 (USD THOUSAND)
TABLE 1393 SPAIN PRECISION MEASUREMENT EQUIPMENT IN INDIUM MARKET, BY PURITY GRADE, 2018-2033 (USD THOUSAND)
TABLE 1394 SPAIN SPECIALTY ELECTRONIC COMPONENTS IN INDIUM MARKET, BY PURITY GRADE, 2018-2033 (USD THOUSAND)
TABLE 1395 SPAIN OTHERS IN INDIUM MARKET, BY TYPE, 2018-2033 (USD THOUSAND)
TABLE 1396 SPAIN ADVANCED MATERIALS MANUFACTURING IN INDIUM MARKET, BY PURITY GRADE, 2018-2033 (USD THOUSAND)
TABLE 1397 SPAIN SPECIALTY ALLOY PRODUCTION IN INDIUM MARKET, BY PURITY GRADE, 2018-2033 (USD THOUSAND)
TABLE 1398 SPAIN THERMAL MANAGEMENT MATERIALS IN INDIUM MARKET, BY PURITY GRADE, 2018-2033 (USD THOUSAND)
TABLE 1399 SPAIN PRECISION SCIENTIFIC INSTRUMENTS IN INDIUM MARKET, BY PURITY GRADE, 2018-2033 (USD THOUSAND)
TABLE 1400 SPAIN RESEARCH INSTITUTES & UNIVERSITIES IN INDIUM MARKET, BY PURITY GRADE, 2018-2033 (USD THOUSAND)
TABLE 1401 SPAIN NUCLEAR INDUSTRY APPLICATIONS IN INDIUM MARKET, BY PURITY GRADE, 2018-2033 (USD THOUSAND)
TABLE 1402 SPAIN SPECIALTY CHEMICAL PRODUCTION IN INDIUM MARKET, BY PURITY GRADE, 2018-2033 (USD THOUSAND)
TABLE 1403 SPAIN DEFENSE RESEARCH LABORATORIES IN INDIUM MARKET, BY PURITY GRADE, 2018-2033 (USD THOUSAND)
TABLE 1404 SPAIN CRYOGENIC EQUIPMENT MANUFACTURING IN INDIUM MARKET, BY PURITY GRADE, 2018-2033 (USD THOUSAND)
TABLE 1405 NETHERLANDS INDIUM MARKET, BY PRODUCT TYPE, 2018-2033 (USD THOUSAND)
TABLE 1406 NETHERLANDS INGOTS IN INDIUM MARKET, BY TYPE, 2018-2033 (USD THOUSAND)
TABLE 1407 NETHERLANDS INDIUM MARKET, BY MATERIAL COMPOSITION, 2018-2033 (USD THOUSAND)
TABLE 1408 NETHERLANDS INDIUM ALLOYS IN INDIUM MARKET, BY TYPE, 2018-2033 (USD THOUSAND)
TABLE 1409 NETHERLANDS INDIUM COMPOUNDS IN INDIUM MARKET, BY TYPE, 2018-2033 (USD THOUSAND)
TABLE 1410 NETHERLANDS INDIUM MARKET, BY PURITY GRADE, 2018-2033 (USD THOUSAND)
TABLE 1411 NETHERLANDS INDIUM MARKET, BY EXTRACTION SOURCE, 2018-2033 (USD THOUSAND)
TABLE 1412 NETHERLANDS PRIMARY PRODUCTION IN INDIUM MARKET, BY TYPE, 2018-2033 (USD THOUSAND)
TABLE 1413 NETHERLANDS SECONDARY PRODUCTION IN INDIUM MARKET, BY TYPE, 2018-2033 (USD THOUSAND)
TABLE 1414 NETHERLANDS INDIUM MARKET, BY DISTRIBUTION CHANNEL, 2018-2033 (USD THOUSAND)
TABLE 1415 NETHERLANDS INDIUM MARKET, BY TECHNOLOGY PLATFORM, 2018-2033 (USD THOUSAND)
TABLE 1416 NETHERLANDS INDIUM MARKET, BY END-USER INDUSTRY, 2018-2033 (USD THOUSAND)
TABLE 1417 NETHERLANDS CONSUMER ELECTRONICS INDUSTRY IN INDIUM MARKET, BY TYPE, 2018-2033 (USD THOUSAND)
TABLE 1418 NETHERLANDS FLAT PANEL DISPLAYS (LCD/OLED/LED) IN INDIUM MARKET, BY PURITY GRADE, 2018-2033 (USD THOUSAND)
TABLE 1419 NETHERLANDS TRANSPARENT CONDUCTIVE COATINGS (ITO) IN INDIUM MARKET, BY PURITY GRADE, 2018-2033 (USD THOUSAND)
TABLE 1420 NETHERLANDS TOUCHSCREEN DISPLAYS IN INDIUM MARKET, BY PURITY GRADE, 2018-2033 (USD THOUSAND)
TABLE 1421 NETHERLANDS FLEXIBLE DISPLAYS & ELECTRONICS IN INDIUM MARKET, BY PURITY GRADE, 2018-2033 (USD THOUSAND)
TABLE 1422 NETHERLANDS WEARABLE ELECTRONICS DEVICES IN INDIUM MARKET, BY PURITY GRADE, 2018-2033 (USD THOUSAND)
TABLE 1423 NETHERLANDS CAMERA & OPTICAL SENSORS IN INDIUM MARKET, BY PURITY GRADE, 2018-2033 (USD THOUSAND)
TABLE 1424 NETHERLANDS MINI-LED BACKLIGHTING IN INDIUM MARKET, BY PURITY GRADE, 2018-2033 (USD THOUSAND)
TABLE 1425 NETHERLANDS MICRO-LED DISPLAYS IN INDIUM MARKET, BY PURITY GRADE, 2018-2033 (USD THOUSAND)
TABLE 1426 NETHERLANDS DISPLAY PANEL INDUSTRY IN INDIUM MARKET, BY TYPE, 2018-2033 (USD THOUSAND)
TABLE 1427 NETHERLANDS LCD PANEL MANUFACTURING IN INDIUM MARKET, BY PURITY GRADE, 2018-2033 (USD THOUSAND)
TABLE 1428 NETHERLANDS OLED PANEL MANUFACTURING IN INDIUM MARKET, BY PURITY GRADE, 2018-2033 (USD THOUSAND)
TABLE 1429 NETHERLANDS DISPLAY PANEL MANUFACTURING IN INDIUM MARKET, BY PURITY GRADE, 2018-2033 (USD THOUSAND)
TABLE 1430 NETHERLANDS TOUCH PANEL SENSORS IN INDIUM MARKET, BY PURITY GRADE, 2018-2033 (USD THOUSAND)
TABLE 1431 NETHERLANDS TRANSPARENT CONDUCTIVE FILMS IN INDIUM MARKET, BY PURITY GRADE, 2018-2033 (USD THOUSAND)
TABLE 1432 NETHERLANDS FLEXIBLE & FOLDABLE DISPLAYS IN INDIUM MARKET, BY PURITY GRADE, 2018-2033 (USD THOUSAND)
TABLE 1433 NETHERLANDS AR/VR DISPLAYS IN INDIUM MARKET, BY PURITY GRADE, 2018-2033 (USD THOUSAND)
TABLE 1434 NETHERLANDS MICRODISPLAY DEVICES IN INDIUM MARKET, BY PURITY GRADE, 2018-2033 (USD THOUSAND)
TABLE 1435 NETHERLANDS BACKPLANE COATINGS IN INDIUM MARKET, BY PURITY GRADE, 2018-2033 (USD THOUSAND)
TABLE 1436 NETHERLANDS SEMICONDUCTOR INDUSTRY IN INDIUM MARKET, BY TYPE, 2018-2033 (USD THOUSAND)
TABLE 1437 NETHERLANDS III-V COMPOUND SEMICONDUCTORS IN INDIUM MARKET, BY PURITY GRADE, 2018-2033 (USD THOUSAND)
TABLE 1438 NETHERLANDS HIGH-FREQUENCY RF COMPONENTS IN INDIUM MARKET, BY PURITY GRADE, 2018-2033 (USD THOUSAND)
TABLE 1439 NETHERLANDS SEMICONDUCTOR SUBSTRATES & EPITAXY IN INDIUM MARKET, BY PURITY GRADE, 2018-2033 (USD THOUSAND)
TABLE 1440 NETHERLANDS LASER DIODES IN INDIUM MARKET, BY PURITY GRADE, 2018-2033 (USD THOUSAND)
TABLE 1441 NETHERLANDS PHOTODETECTORS IN INDIUM MARKET, BY PURITY GRADE, 2018-2033 (USD THOUSAND)
TABLE 1442 NETHERLANDS HIGH-SPEED OPTOELECTRONICS IN INDIUM MARKET, BY PURITY GRADE, 2018-2033 (USD THOUSAND)
TABLE 1443 NETHERLANDS INFRARED DETECTORS IN INDIUM MARKET, BY PURITY GRADE, 2018-2033 (USD THOUSAND)
TABLE 1444 NETHERLANDS INTEGRATED PHOTONIC CIRCUITS IN INDIUM MARKET, BY PURITY GRADE, 2018-2033 (USD THOUSAND)
TABLE 1445 NETHERLANDS SOLAR PHOTOVOLTAIC INDUSTRY IN INDIUM MARKET, BY TYPE, 2018-2033 (USD THOUSAND)
TABLE 1446 NETHERLANDS CIGS THIN-FILM SOLAR CELLS IN INDIUM MARKET, BY PURITY GRADE, 2018-2033 (USD THOUSAND)
TABLE 1447 NETHERLANDSHIGH-EFFICIENCY MODULES IN INDIUM MARKET, BY PURITY GRADE, 2018-2033 (USD THOUSAND)
TABLE 1448 NETHERLANDS THIN-FILM COATINGS IN INDIUM MARKET, BY PURITY GRADE, 2018-2033 (USD THOUSAND)
TABLE 1449 NETHERLANDS TRANSPARENT ELECTRODES IN INDIUM MARKET, BY PURITY GRADE, 2018-2033 (USD THOUSAND)
TABLE 1450 NETHERLANDS BIPV IN INDIUM MARKET, BY PURITY GRADE, 2018-2033 (USD THOUSAND)
TABLE 1451 NETHERLANDS FLEXIBLE SOLAR PANELS IN INDIUM MARKET, BY PURITY GRADE, 2018-2033 (USD THOUSAND)
TABLE 1452 NETHERLANDS PORTABLE SOLAR SYSTEMS IN INDIUM MARKET, BY PURITY GRADE, 2018-2033 (USD THOUSAND)
TABLE 1453 NETHERLANDS CONCENTRATED PV IN INDIUM MARKET, BY PURITY GRADE, 2018-2033 (USD THOUSAND)
TABLE 1454 NETHERLANDS AUTOMOTIVE INDUSTRY IN INDIUM MARKET, BY TYPE, 2018-2033 (USD THOUSAND)
TABLE 1455 NETHERLANDS AUTOMOTIVE DISPLAY PANELS IN INDIUM MARKET, BY PURITY GRADE, 2018-2033 (USD THOUSAND)
TABLE 1456 NETHERLANDSADAS SENSORS IN INDIUM MARKET, BY PURITY GRADE, 2018-2033 (USD THOUSAND)
TABLE 1457 NETHERLANDS VEHICLE CAMERA MODULES IN INDIUM MARKET, BY PURITY GRADE, 2018-2033 (USD THOUSAND)
TABLE 1458 NETHERLANDS AUTOMOTIVE OPTOELECTRONICS IN INDIUM MARKET, BY PURITY GRADE, 2018-2033 (USD THOUSAND)
TABLE 1459 NETHERLANDS POWER ELECTRONICS IN INDIUM MARKET, BY PURITY GRADE, 2018-2033 (USD THOUSAND)
TABLE 1460 NETHERLANDS TOUCHSCREEN INTERFACES IN INDIUM MARKET, BY PURITY GRADE, 2018-2033 (USD THOUSAND)
TABLE 1461 NETHERLANDS INFRARED SENSORS IN INDIUM MARKET, BY PURITY GRADE, 2018-2033 (USD THOUSAND)
TABLE 1462 NETHERLANDS SMART LIGHTING IN INDIUM MARKET, BY PURITY GRADE, 2018-2033 (USD THOUSAND)
TABLE 1463 NETHERLANDS TELECOMMUNICATION EQUIPMENT INDUSTRY IN INDIUM MARKET, BY TYPE, 2018-2033 (USD THOUSAND)
TABLE 1464 NETHERLANDS OPTICAL TRANSCEIVERS IN INDIUM MARKET, BY PURITY GRADE, 2018-2033 (USD THOUSAND)
TABLE 1465 NETHERLANDS RF POWER AMPLIFIERS IN INDIUM MARKET, BY PURITY GRADE, 2018-2033 (USD THOUSAND)
TABLE 1466 NETHERLANDS HIGH-FREQUENCY COMMUNICATION CHIPS IN INDIUM MARKET, BY PURITY GRADE, 2018-2033 (USD THOUSAND)
TABLE 1467 NETHERLANDS FIBER-OPTIC COMMUNICATION LASERS IN INDIUM MARKET, BY PURITY GRADE, 2018-2033 (USD THOUSAND)
TABLE 1468 NETHERLANDS PHOTODETECTORS FOR OPTICAL NETWORKS IN INDIUM MARKET, BY PURITY GRADE, 2018-2033 (USD THOUSAND)
TABLE 1469 NETHERLANDS 5G INFRASTRUCTURE COMPONENTS IN INDIUM MARKET, BY PURITY GRADE, 2018-2033 (USD THOUSAND)
TABLE 1470 NETHERLANDS OPTICAL NETWORK SWITCHING DEVICES IN INDIUM MARKET, BY PURITY GRADE, 2018-2033 (USD THOUSAND)
TABLE 1471 NETHERLANDS SATELLITE COMMUNICATION MODULES IN INDIUM MARKET, BY PURITY GRADE, 2018-2033 (USD THOUSAND)
TABLE 1472 NETHERLANDS OPTICAL & PHOTONICS INDUSTRY IN INDIUM MARKET, BY TYPE, 2018-2033 (USD THOUSAND)
TABLE 1473 NETHERLANDS OPTICAL COATINGS IN INDIUM MARKET, BY PURITY GRADE, 2018-2033 (USD THOUSAND)
TABLE 1474 NETHERLANDS FIBER OPTIC COMPONENTS IN INDIUM MARKET, BY PURITY GRADE, 2018-2033 (USD THOUSAND)
TABLE 1475 NETHERLANDS LASER COMPONENTS IN INDIUM MARKET, BY PURITY GRADE, 2018-2033 (USD THOUSAND)
TABLE 1476 NETHERLANDS OPTICAL SENSORS IN INDIUM MARKET, BY PURITY GRADE, 2018-2033 (USD THOUSAND)
TABLE 1477 NETHERLANDS INFRARED OPTICS IN INDIUM MARKET, BY PURITY GRADE, 2018-2033 (USD THOUSAND)
TABLE 1478 NETHERLANDS PICS IN INDIUM MARKET, BY PURITY GRADE, 2018-2033 (USD THOUSAND)
TABLE 1479 NETHERLANDS MIRRORS IN INDIUM MARKET, BY PURITY GRADE, 2018-2033 (USD THOUSAND)
TABLE 1480 NETHERLANDS SPECTROSCOPY IN INDIUM MARKET, BY PURITY GRADE, 2018-2033 (USD THOUSAND)
TABLE 1481 NETHERLANDS AEROSPACE & DEFENSE INDUSTRY IN INDIUM MARKET, BY TYPE, 2018-2033 (USD THOUSAND)
TABLE 1482 NETHERLANDS INFRARED IMAGING SYSTEMS IN INDIUM MARKET, BY PURITY GRADE, 2018-2033 (USD THOUSAND)
TABLE 1483 NETHERLANDS RADAR & RF COMPONENTS IN INDIUM MARKET, BY PURITY GRADE, 2018-2033 (USD THOUSAND)
TABLE 1484 NETHERLANDS SATELLITE COMMUNICATION IN INDIUM MARKET, BY PURITY GRADE, 2018-2033 (USD THOUSAND)
TABLE 1485 NETHERLANDS MILITARY OPTOELECTRONICS IN INDIUM MARKET, BY PURITY GRADE, 2018-2033 (USD THOUSAND)
TABLE 1486 NETHERLANDS AVIONICS DISPLAYS IN INDIUM MARKET, BY PURITY GRADE, 2018-2033 (USD THOUSAND)
TABLE 1487 NETHERLANDS SPACECRAFT SOLAR PANELS IN INDIUM MARKET, BY PURITY GRADE, 2018-2033 (USD THOUSAND)
TABLE 1488 NETHERLANDS THERMAL MATERIALS IN INDIUM MARKET, BY PURITY GRADE, 2018-2033 (USD THOUSAND)
TABLE 1489 NETHERLANDS CRYOGENIC MATERIALS IN INDIUM MARKET, BY PURITY GRADE, 2018-2033 (USD THOUSAND)
TABLE 1490 NETHERLANDS MEDICAL DEVICE INDUSTRY IN INDIUM MARKET, BY TYPE, 2018-2033 (USD THOUSAND)
TABLE 1491 NETHERLANDS MEDICAL IMAGING SENSORS IN INDIUM MARKET, BY PURITY GRADE, 2018-2033 (USD THOUSAND)
TABLE 1492 NETHERLANDS DIAGNOSTIC EQUIPMENT DISPLAYS IN INDIUM MARKET, BY PURITY GRADE, 2018-2033 (USD THOUSAND)
TABLE 1493 NETHERLANDS ADVANCED DIAGNOSTIC INSTRUMENTS IN INDIUM MARKET, BY PURITY GRADE, 2018-2033 (USD THOUSAND)
TABLE 1494 NETHERLANDS LASER SURGICAL EQUIPMENT IN INDIUM MARKET, BY PURITY GRADE, 2018-2033 (USD THOUSAND)
TABLE 1495 NETHERLANDS BIOMEDICAL OPTICAL DEVICES IN INDIUM MARKET, BY PURITY GRADE, 2018-2033 (USD THOUSAND)
TABLE 1496 NETHERLANDS RADIATION DETECTION EQUIPMENT IN INDIUM MARKET, BY PURITY GRADE, 2018-2033 (USD THOUSAND)
TABLE 1497 NETHERLANDS INFRARED MEDICAL SENSORS IN INDIUM MARKET, BY PURITY GRADE, 2018-2033 (USD THOUSAND)
TABLE 1498 NETHERLANDS PHOTOTHERAPY DEVICES IN INDIUM MARKET, BY PURITY GRADE, 2018-2033 (USD THOUSAND)
TABLE 1499 NETHERLANDS INDUSTRIAL EQUIPMENT MANUFACTURING IN INDIUM MARKET, BY TYPE, 2018-2033 (USD THOUSAND)
TABLE 1500 NETHERLANDS INDUSTRIAL SENSORS IN INDIUM MARKET, BY PURITY GRADE, 2018-2033 (USD THOUSAND)
TABLE 1501 NETHERLANDS VACUUM DEPOSITION COATINGS IN INDIUM MARKET, BY PURITY GRADE, 2018-2033 (USD THOUSAND)
TABLE 1502 NETHERLANDS PRECISION OPTICAL COMPONENTS IN INDIUM MARKET, BY PURITY GRADE, 2018-2033 (USD THOUSAND)
TABLE 1503 NETHERLANDS THERMAL INTERFACE MATERIALS IN INDIUM MARKET, BY PURITY GRADE, 2018-2033 (USD THOUSAND)
TABLE 1504 NETHERLANDS INDUSTRIAL LASER SYSTEMS IN INDIUM MARKET, BY PURITY GRADE, 2018-2033 (USD THOUSAND)
TABLE 1505 NETHERLANDS INDUSTRIAL INFRARED DETECTORS IN INDIUM MARKET, BY PURITY GRADE, 2018-2033 (USD THOUSAND)
TABLE 1506 NETHERLANDS PRECISION MEASUREMENT EQUIPMENT IN INDIUM MARKET, BY PURITY GRADE, 2018-2033 (USD THOUSAND)
TABLE 1507 NETHERLANDS SPECIALTY ELECTRONIC COMPONENTS IN INDIUM MARKET, BY PURITY GRADE, 2018-2033 (USD THOUSAND)
TABLE 1508 NETHERLANDS OTHERS IN INDIUM MARKET, BY TYPE, 2018-2033 (USD THOUSAND)
TABLE 1509 NETHERLANDS ADVANCED MATERIALS MANUFACTURING IN INDIUM MARKET, BY PURITY GRADE, 2018-2033 (USD THOUSAND)
TABLE 1510 NETHERLANDS SPECIALTY ALLOY PRODUCTION IN INDIUM MARKET, BY PURITY GRADE, 2018-2033 (USD THOUSAND)
TABLE 1511 NETHERLANDS THERMAL MANAGEMENT MATERIALS IN INDIUM MARKET, BY PURITY GRADE, 2018-2033 (USD THOUSAND)
TABLE 1512 NETHERLANDS PRECISION SCIENTIFIC INSTRUMENTS IN INDIUM MARKET, BY PURITY GRADE, 2018-2033 (USD THOUSAND)
TABLE 1513 NETHERLANDS RESEARCH INSTITUTES & UNIVERSITIES IN INDIUM MARKET, BY PURITY GRADE, 2018-2033 (USD THOUSAND)
TABLE 1514 NETHERLANDS NUCLEAR INDUSTRY APPLICATIONS IN INDIUM MARKET, BY PURITY GRADE, 2018-2033 (USD THOUSAND)
TABLE 1515 NETHERLANDS SPECIALTY CHEMICAL PRODUCTION IN INDIUM MARKET, BY PURITY GRADE, 2018-2033 (USD THOUSAND)
TABLE 1516 NETHERLANDS DEFENSE RESEARCH LABORATORIES IN INDIUM MARKET, BY PURITY GRADE, 2018-2033 (USD THOUSAND)
TABLE 1517 NETHERLANDS CRYOGENIC EQUIPMENT MANUFACTURING IN INDIUM MARKET, BY PURITY GRADE, 2018-2033 (USD THOUSAND)
TABLE 1518 SWITZERLAND INDIUM MARKET, BY PRODUCT TYPE, 2018-2033 (USD THOUSAND)
TABLE 1519 SWITZERLAND INGOTS IN INDIUM MARKET, BY TYPE, 2018-2033 (USD THOUSAND)
TABLE 1520 SWITZERLAND INDIUM MARKET, BY MATERIAL COMPOSITION, 2018-2033 (USD THOUSAND)
TABLE 1521 SWITZERLAND INDIUM ALLOYS IN INDIUM MARKET, BY TYPE, 2018-2033 (USD THOUSAND)
TABLE 1522 SWITZERLAND INDIUM COMPOUNDS IN INDIUM MARKET, BY TYPE, 2018-2033 (USD THOUSAND)
TABLE 1523 SWITZERLAND INDIUM MARKET, BY PURITY GRADE, 2018-2033 (USD THOUSAND)
TABLE 1524 SWITZERLAND INDIUM MARKET, BY EXTRACTION SOURCE, 2018-2033 (USD THOUSAND)
TABLE 1525 SWITZERLAND PRIMARY PRODUCTION IN INDIUM MARKET, BY TYPE, 2018-2033 (USD THOUSAND)
TABLE 1526 SWITZERLAND SECONDARY PRODUCTION IN INDIUM MARKET, BY TYPE, 2018-2033 (USD THOUSAND)
TABLE 1527 SWITZERLAND INDIUM MARKET, BY DISTRIBUTION CHANNEL, 2018-2033 (USD THOUSAND)
TABLE 1528 SWITZERLAND INDIUM MARKET, BY TECHNOLOGY PLATFORM, 2018-2033 (USD THOUSAND)
TABLE 1529 SWITZERLAND INDIUM MARKET, BY END-USER INDUSTRY, 2018-2033 (USD THOUSAND)
TABLE 1530 SWITZERLAND CONSUMER ELECTRONICS INDUSTRY IN INDIUM MARKET, BY TYPE, 2018-2033 (USD THOUSAND)
TABLE 1531 SWITZERLAND FLAT PANEL DISPLAYS (LCD/OLED/LED) IN INDIUM MARKET, BY PURITY GRADE, 2018-2033 (USD THOUSAND)
TABLE 1532 SWITZERLAND TRANSPARENT CONDUCTIVE COATINGS (ITO) IN INDIUM MARKET, BY PURITY GRADE, 2018-2033 (USD THOUSAND)
TABLE 1533 SWITZERLAND TOUCHSCREEN DISPLAYS IN INDIUM MARKET, BY PURITY GRADE, 2018-2033 (USD THOUSAND)
TABLE 1534 SWITZERLAND FLEXIBLE DISPLAYS & ELECTRONICS IN INDIUM MARKET, BY PURITY GRADE, 2018-2033 (USD THOUSAND)
TABLE 1535 SWITZERLAND WEARABLE ELECTRONICS DEVICES IN INDIUM MARKET, BY PURITY GRADE, 2018-2033 (USD THOUSAND)
TABLE 1536 SWITZERLAND CAMERA & OPTICAL SENSORS IN INDIUM MARKET, BY PURITY GRADE, 2018-2033 (USD THOUSAND)
TABLE 1537 SWITZERLAND MINI-LED BACKLIGHTING IN INDIUM MARKET, BY PURITY GRADE, 2018-2033 (USD THOUSAND)
TABLE 1538 SWITZERLAND MICRO-LED DISPLAYS IN INDIUM MARKET, BY PURITY GRADE, 2018-2033 (USD THOUSAND)
TABLE 1539 SWITZERLAND DISPLAY PANEL INDUSTRY IN INDIUM MARKET, BY TYPE, 2018-2033 (USD THOUSAND)
TABLE 1540 SWITZERLAND LCD PANEL MANUFACTURING IN INDIUM MARKET, BY PURITY GRADE, 2018-2033 (USD THOUSAND)
TABLE 1541 SWITZERLAND OLED PANEL MANUFACTURING IN INDIUM MARKET, BY PURITY GRADE, 2018-2033 (USD THOUSAND)
TABLE 1542 SWITZERLAND DISPLAY PANEL MANUFACTURING IN INDIUM MARKET, BY PURITY GRADE, 2018-2033 (USD THOUSAND)
TABLE 1543 SWITZERLAND TOUCH PANEL SENSORS IN INDIUM MARKET, BY PURITY GRADE, 2018-2033 (USD THOUSAND)
TABLE 1544 SWITZERLAND TRANSPARENT CONDUCTIVE FILMS IN INDIUM MARKET, BY PURITY GRADE, 2018-2033 (USD THOUSAND)
TABLE 1545 SWITZERLAND FLEXIBLE & FOLDABLE DISPLAYS IN INDIUM MARKET, BY PURITY GRADE, 2018-2033 (USD THOUSAND)
TABLE 1546 SWITZERLAND AR/VR DISPLAYS IN INDIUM MARKET, BY PURITY GRADE, 2018-2033 (USD THOUSAND)
TABLE 1547 SWITZERLAND MICRODISPLAY DEVICES IN INDIUM MARKET, BY PURITY GRADE, 2018-2033 (USD THOUSAND)
TABLE 1548 SWITZERLAND BACKPLANE COATINGS IN INDIUM MARKET, BY PURITY GRADE, 2018-2033 (USD THOUSAND)
TABLE 1549 SWITZERLAND SEMICONDUCTOR INDUSTRY IN INDIUM MARKET, BY TYPE, 2018-2033 (USD THOUSAND)
TABLE 1550 SWITZERLAND III-V COMPOUND SEMICONDUCTORS IN INDIUM MARKET, BY PURITY GRADE, 2018-2033 (USD THOUSAND)
TABLE 1551 SWITZERLAND HIGH-FREQUENCY RF COMPONENTS IN INDIUM MARKET, BY PURITY GRADE, 2018-2033 (USD THOUSAND)
TABLE 1552 SWITZERLAND SEMICONDUCTOR SUBSTRATES & EPITAXY IN INDIUM MARKET, BY PURITY GRADE, 2018-2033 (USD THOUSAND)
TABLE 1553 SWITZERLAND LASER DIODES IN INDIUM MARKET, BY PURITY GRADE, 2018-2033 (USD THOUSAND)
TABLE 1554 SWITZERLAND PHOTODETECTORS IN INDIUM MARKET, BY PURITY GRADE, 2018-2033 (USD THOUSAND)
TABLE 1555 SWITZERLAND HIGH-SPEED OPTOELECTRONICS IN INDIUM MARKET, BY PURITY GRADE, 2018-2033 (USD THOUSAND)
TABLE 1556 SWITZERLAND INFRARED DETECTORS IN INDIUM MARKET, BY PURITY GRADE, 2018-2033 (USD THOUSAND)
TABLE 1557 SWITZERLAND INTEGRATED PHOTONIC CIRCUITS IN INDIUM MARKET, BY PURITY GRADE, 2018-2033 (USD THOUSAND)
TABLE 1558 SWITZERLAND SOLAR PHOTOVOLTAIC INDUSTRY IN INDIUM MARKET, BY TYPE, 2018-2033 (USD THOUSAND)
TABLE 1559 SWITZERLAND CIGS THIN-FILM SOLAR CELLS IN INDIUM MARKET, BY PURITY GRADE, 2018-2033 (USD THOUSAND)
TABLE 1560 SWITZERLANDHIGH-EFFICIENCY MODULES IN INDIUM MARKET, BY PURITY GRADE, 2018-2033 (USD THOUSAND)
TABLE 1561 SWITZERLAND THIN-FILM COATINGS IN INDIUM MARKET, BY PURITY GRADE, 2018-2033 (USD THOUSAND)
TABLE 1562 SWITZERLAND TRANSPARENT ELECTRODES IN INDIUM MARKET, BY PURITY GRADE, 2018-2033 (USD THOUSAND)
TABLE 1563 SWITZERLAND BIPV IN INDIUM MARKET, BY PURITY GRADE, 2018-2033 (USD THOUSAND)
TABLE 1564 SWITZERLAND FLEXIBLE SOLAR PANELS IN INDIUM MARKET, BY PURITY GRADE, 2018-2033 (USD THOUSAND)
TABLE 1565 SWITZERLAND PORTABLE SOLAR SYSTEMS IN INDIUM MARKET, BY PURITY GRADE, 2018-2033 (USD THOUSAND)
TABLE 1566 SWITZERLAND CONCENTRATED PV IN INDIUM MARKET, BY PURITY GRADE, 2018-2033 (USD THOUSAND)
TABLE 1567 SWITZERLAND AUTOMOTIVE INDUSTRY IN INDIUM MARKET, BY TYPE, 2018-2033 (USD THOUSAND)
TABLE 1568 SWITZERLAND AUTOMOTIVE DISPLAY PANELS IN INDIUM MARKET, BY PURITY GRADE, 2018-2033 (USD THOUSAND)
TABLE 1569 SWITZERLANDADAS SENSORS IN INDIUM MARKET, BY PURITY GRADE, 2018-2033 (USD THOUSAND)
TABLE 1570 SWITZERLAND VEHICLE CAMERA MODULES IN INDIUM MARKET, BY PURITY GRADE, 2018-2033 (USD THOUSAND)
TABLE 1571 SWITZERLAND AUTOMOTIVE OPTOELECTRONICS IN INDIUM MARKET, BY PURITY GRADE, 2018-2033 (USD THOUSAND)
TABLE 1572 SWITZERLAND POWER ELECTRONICS IN INDIUM MARKET, BY PURITY GRADE, 2018-2033 (USD THOUSAND)
TABLE 1573 SWITZERLAND TOUCHSCREEN INTERFACES IN INDIUM MARKET, BY PURITY GRADE, 2018-2033 (USD THOUSAND)
TABLE 1574 SWITZERLAND INFRARED SENSORS IN INDIUM MARKET, BY PURITY GRADE, 2018-2033 (USD THOUSAND)
TABLE 1575 SWITZERLAND SMART LIGHTING IN INDIUM MARKET, BY PURITY GRADE, 2018-2033 (USD THOUSAND)
TABLE 1576 SWITZERLAND TELECOMMUNICATION EQUIPMENT INDUSTRY IN INDIUM MARKET, BY TYPE, 2018-2033 (USD THOUSAND)
TABLE 1577 SWITZERLAND OPTICAL TRANSCEIVERS IN INDIUM MARKET, BY PURITY GRADE, 2018-2033 (USD THOUSAND)
TABLE 1578 SWITZERLAND RF POWER AMPLIFIERS IN INDIUM MARKET, BY PURITY GRADE, 2018-2033 (USD THOUSAND)
TABLE 1579 SWITZERLAND HIGH-FREQUENCY COMMUNICATION CHIPS IN INDIUM MARKET, BY PURITY GRADE, 2018-2033 (USD THOUSAND)
TABLE 1580 SWITZERLAND FIBER-OPTIC COMMUNICATION LASERS IN INDIUM MARKET, BY PURITY GRADE, 2018-2033 (USD THOUSAND)
TABLE 1581 SWITZERLAND PHOTODETECTORS FOR OPTICAL NETWORKS IN INDIUM MARKET, BY PURITY GRADE, 2018-2033 (USD THOUSAND)
TABLE 1582 SWITZERLAND 5G INFRASTRUCTURE COMPONENTS IN INDIUM MARKET, BY PURITY GRADE, 2018-2033 (USD THOUSAND)
TABLE 1583 SWITZERLAND OPTICAL NETWORK SWITCHING DEVICES IN INDIUM MARKET, BY PURITY GRADE, 2018-2033 (USD THOUSAND)
TABLE 1584 SWITZERLAND SATELLITE COMMUNICATION MODULES IN INDIUM MARKET, BY PURITY GRADE, 2018-2033 (USD THOUSAND)
TABLE 1585 SWITZERLAND OPTICAL & PHOTONICS INDUSTRY IN INDIUM MARKET, BY TYPE, 2018-2033 (USD THOUSAND)
TABLE 1586 SWITZERLAND OPTICAL COATINGS IN INDIUM MARKET, BY PURITY GRADE, 2018-2033 (USD THOUSAND)
TABLE 1587 SWITZERLAND FIBER OPTIC COMPONENTS IN INDIUM MARKET, BY PURITY GRADE, 2018-2033 (USD THOUSAND)
TABLE 1588 SWITZERLAND LASER COMPONENTS IN INDIUM MARKET, BY PURITY GRADE, 2018-2033 (USD THOUSAND)
TABLE 1589 SWITZERLAND OPTICAL SENSORS IN INDIUM MARKET, BY PURITY GRADE, 2018-2033 (USD THOUSAND)
TABLE 1590 SWITZERLAND INFRARED OPTICS IN INDIUM MARKET, BY PURITY GRADE, 2018-2033 (USD THOUSAND)
TABLE 1591 SWITZERLAND PICS IN INDIUM MARKET, BY PURITY GRADE, 2018-2033 (USD THOUSAND)
TABLE 1592 SWITZERLAND MIRRORS IN INDIUM MARKET, BY PURITY GRADE, 2018-2033 (USD THOUSAND)
TABLE 1593 SWITZERLAND SPECTROSCOPY IN INDIUM MARKET, BY PURITY GRADE, 2018-2033 (USD THOUSAND)
TABLE 1594 SWITZERLAND AEROSPACE & DEFENSE INDUSTRY IN INDIUM MARKET, BY TYPE, 2018-2033 (USD THOUSAND)
TABLE 1595 SWITZERLAND INFRARED IMAGING SYSTEMS IN INDIUM MARKET, BY PURITY GRADE, 2018-2033 (USD THOUSAND)
TABLE 1596 SWITZERLAND RADAR & RF COMPONENTS IN INDIUM MARKET, BY PURITY GRADE, 2018-2033 (USD THOUSAND)
TABLE 1597 SWITZERLAND SATELLITE COMMUNICATION IN INDIUM MARKET, BY PURITY GRADE, 2018-2033 (USD THOUSAND)
TABLE 1598 SWITZERLAND MILITARY OPTOELECTRONICS IN INDIUM MARKET, BY PURITY GRADE, 2018-2033 (USD THOUSAND)
TABLE 1599 SWITZERLAND AVIONICS DISPLAYS IN INDIUM MARKET, BY PURITY GRADE, 2018-2033 (USD THOUSAND)
TABLE 1600 SWITZERLAND SPACECRAFT SOLAR PANELS IN INDIUM MARKET, BY PURITY GRADE, 2018-2033 (USD THOUSAND)
TABLE 1601 SWITZERLAND THERMAL MATERIALS IN INDIUM MARKET, BY PURITY GRADE, 2018-2033 (USD THOUSAND)
TABLE 1602 SWITZERLAND CRYOGENIC MATERIALS IN INDIUM MARKET, BY PURITY GRADE, 2018-2033 (USD THOUSAND)
TABLE 1603 SWITZERLAND MEDICAL DEVICE INDUSTRY IN INDIUM MARKET, BY TYPE, 2018-2033 (USD THOUSAND)
TABLE 1604 SWITZERLAND MEDICAL IMAGING SENSORS IN INDIUM MARKET, BY PURITY GRADE, 2018-2033 (USD THOUSAND)
TABLE 1605 SWITZERLAND DIAGNOSTIC EQUIPMENT DISPLAYS IN INDIUM MARKET, BY PURITY GRADE, 2018-2033 (USD THOUSAND)
TABLE 1606 SWITZERLAND ADVANCED DIAGNOSTIC INSTRUMENTS IN INDIUM MARKET, BY PURITY GRADE, 2018-2033 (USD THOUSAND)
TABLE 1607 SWITZERLAND LASER SURGICAL EQUIPMENT IN INDIUM MARKET, BY PURITY GRADE, 2018-2033 (USD THOUSAND)
TABLE 1608 SWITZERLAND BIOMEDICAL OPTICAL DEVICES IN INDIUM MARKET, BY PURITY GRADE, 2018-2033 (USD THOUSAND)
TABLE 1609 SWITZERLAND RADIATION DETECTION EQUIPMENT IN INDIUM MARKET, BY PURITY GRADE, 2018-2033 (USD THOUSAND)
TABLE 1610 SWITZERLAND INFRARED MEDICAL SENSORS IN INDIUM MARKET, BY PURITY GRADE, 2018-2033 (USD THOUSAND)
TABLE 1611 SWITZERLAND PHOTOTHERAPY DEVICES IN INDIUM MARKET, BY PURITY GRADE, 2018-2033 (USD THOUSAND)
TABLE 1612 SWITZERLAND INDUSTRIAL EQUIPMENT MANUFACTURING IN INDIUM MARKET, BY TYPE, 2018-2033 (USD THOUSAND)
TABLE 1613 SWITZERLAND INDUSTRIAL SENSORS IN INDIUM MARKET, BY PURITY GRADE, 2018-2033 (USD THOUSAND)
TABLE 1614 SWITZERLAND VACUUM DEPOSITION COATINGS IN INDIUM MARKET, BY PURITY GRADE, 2018-2033 (USD THOUSAND)
TABLE 1615 SWITZERLAND PRECISION OPTICAL COMPONENTS IN INDIUM MARKET, BY PURITY GRADE, 2018-2033 (USD THOUSAND)
TABLE 1616 SWITZERLAND THERMAL INTERFACE MATERIALS IN INDIUM MARKET, BY PURITY GRADE, 2018-2033 (USD THOUSAND)
TABLE 1617 SWITZERLAND INDUSTRIAL LASER SYSTEMS IN INDIUM MARKET, BY PURITY GRADE, 2018-2033 (USD THOUSAND)
TABLE 1618 SWITZERLAND INDUSTRIAL INFRARED DETECTORS IN INDIUM MARKET, BY PURITY GRADE, 2018-2033 (USD THOUSAND)
TABLE 1619 SWITZERLAND PRECISION MEASUREMENT EQUIPMENT IN INDIUM MARKET, BY PURITY GRADE, 2018-2033 (USD THOUSAND)
TABLE 1620 SWITZERLAND SPECIALTY ELECTRONIC COMPONENTS IN INDIUM MARKET, BY PURITY GRADE, 2018-2033 (USD THOUSAND)
TABLE 1621 SWITZERLAND OTHERS IN INDIUM MARKET, BY TYPE, 2018-2033 (USD THOUSAND)
TABLE 1622 SWITZERLAND ADVANCED MATERIALS MANUFACTURING IN INDIUM MARKET, BY PURITY GRADE, 2018-2033 (USD THOUSAND)
TABLE 1623 SWITZERLAND SPECIALTY ALLOY PRODUCTION IN INDIUM MARKET, BY PURITY GRADE, 2018-2033 (USD THOUSAND)
TABLE 1624 SWITZERLAND THERMAL MANAGEMENT MATERIALS IN INDIUM MARKET, BY PURITY GRADE, 2018-2033 (USD THOUSAND)
TABLE 1625 SWITZERLAND PRECISION SCIENTIFIC INSTRUMENTS IN INDIUM MARKET, BY PURITY GRADE, 2018-2033 (USD THOUSAND)
TABLE 1626 SWITZERLAND RESEARCH INSTITUTES & UNIVERSITIES IN INDIUM MARKET, BY PURITY GRADE, 2018-2033 (USD THOUSAND)
TABLE 1627 SWITZERLAND NUCLEAR INDUSTRY APPLICATIONS IN INDIUM MARKET, BY PURITY GRADE, 2018-2033 (USD THOUSAND)
TABLE 1628 SWITZERLAND SPECIALTY CHEMICAL PRODUCTION IN INDIUM MARKET, BY PURITY GRADE, 2018-2033 (USD THOUSAND)
TABLE 1629 SWITZERLAND DEFENSE RESEARCH LABORATORIES IN INDIUM MARKET, BY PURITY GRADE, 2018-2033 (USD THOUSAND)
TABLE 1630 SWITZERLAND CRYOGENIC EQUIPMENT MANUFACTURING IN INDIUM MARKET, BY PURITY GRADE, 2018-2033 (USD THOUSAND)
TABLE 1631 TURKEY INDIUM MARKET, BY PRODUCT TYPE, 2018-2033 (USD THOUSAND)
TABLE 1632 TURKEY INGOTS IN INDIUM MARKET, BY TYPE, 2018-2033 (USD THOUSAND)
TABLE 1633 TURKEY INDIUM MARKET, BY MATERIAL COMPOSITION, 2018-2033 (USD THOUSAND)
TABLE 1634 TURKEY INDIUM ALLOYS IN INDIUM MARKET, BY TYPE, 2018-2033 (USD THOUSAND)
TABLE 1635 TURKEY INDIUM COMPOUNDS IN INDIUM MARKET, BY TYPE, 2018-2033 (USD THOUSAND)
TABLE 1636 TURKEY INDIUM MARKET, BY PURITY GRADE, 2018-2033 (USD THOUSAND)
TABLE 1637 TURKEY INDIUM MARKET, BY EXTRACTION SOURCE, 2018-2033 (USD THOUSAND)
TABLE 1638 TURKEY PRIMARY PRODUCTION IN INDIUM MARKET, BY TYPE, 2018-2033 (USD THOUSAND)
TABLE 1639 TURKEY SECONDARY PRODUCTION IN INDIUM MARKET, BY TYPE, 2018-2033 (USD THOUSAND)
TABLE 1640 TURKEY INDIUM MARKET, BY DISTRIBUTION CHANNEL, 2018-2033 (USD THOUSAND)
TABLE 1641 TURKEY INDIUM MARKET, BY TECHNOLOGY PLATFORM, 2018-2033 (USD THOUSAND)
TABLE 1642 TURKEY INDIUM MARKET, BY END-USER INDUSTRY, 2018-2033 (USD THOUSAND)
TABLE 1643 TURKEY CONSUMER ELECTRONICS INDUSTRY IN INDIUM MARKET, BY TYPE, 2018-2033 (USD THOUSAND)
TABLE 1644 TURKEY FLAT PANEL DISPLAYS (LCD/OLED/LED) IN INDIUM MARKET, BY PURITY GRADE, 2018-2033 (USD THOUSAND)
TABLE 1645 TURKEY TRANSPARENT CONDUCTIVE COATINGS (ITO) IN INDIUM MARKET, BY PURITY GRADE, 2018-2033 (USD THOUSAND)
TABLE 1646 TURKEY TOUCHSCREEN DISPLAYS IN INDIUM MARKET, BY PURITY GRADE, 2018-2033 (USD THOUSAND)
TABLE 1647 TURKEY FLEXIBLE DISPLAYS & ELECTRONICS IN INDIUM MARKET, BY PURITY GRADE, 2018-2033 (USD THOUSAND)
TABLE 1648 TURKEY WEARABLE ELECTRONICS DEVICES IN INDIUM MARKET, BY PURITY GRADE, 2018-2033 (USD THOUSAND)
TABLE 1649 TURKEY CAMERA & OPTICAL SENSORS IN INDIUM MARKET, BY PURITY GRADE, 2018-2033 (USD THOUSAND)
TABLE 1650 TURKEY MINI-LED BACKLIGHTING IN INDIUM MARKET, BY PURITY GRADE, 2018-2033 (USD THOUSAND)
TABLE 1651 TURKEY MICRO-LED DISPLAYS IN INDIUM MARKET, BY PURITY GRADE, 2018-2033 (USD THOUSAND)
TABLE 1652 TURKEY DISPLAY PANEL INDUSTRY IN INDIUM MARKET, BY TYPE, 2018-2033 (USD THOUSAND)
TABLE 1653 TURKEY LCD PANEL MANUFACTURING IN INDIUM MARKET, BY PURITY GRADE, 2018-2033 (USD THOUSAND)
TABLE 1654 TURKEY OLED PANEL MANUFACTURING IN INDIUM MARKET, BY PURITY GRADE, 2018-2033 (USD THOUSAND)
TABLE 1655 TURKEY DISPLAY PANEL MANUFACTURING IN INDIUM MARKET, BY PURITY GRADE, 2018-2033 (USD THOUSAND)
TABLE 1656 TURKEY TOUCH PANEL SENSORS IN INDIUM MARKET, BY PURITY GRADE, 2018-2033 (USD THOUSAND)
TABLE 1657 TURKEY TRANSPARENT CONDUCTIVE FILMS IN INDIUM MARKET, BY PURITY GRADE, 2018-2033 (USD THOUSAND)
TABLE 1658 TURKEY FLEXIBLE & FOLDABLE DISPLAYS IN INDIUM MARKET, BY PURITY GRADE, 2018-2033 (USD THOUSAND)
TABLE 1659 TURKEY AR/VR DISPLAYS IN INDIUM MARKET, BY PURITY GRADE, 2018-2033 (USD THOUSAND)
TABLE 1660 TURKEY MICRODISPLAY DEVICES IN INDIUM MARKET, BY PURITY GRADE, 2018-2033 (USD THOUSAND)
TABLE 1661 TURKEY BACKPLANE COATINGS IN INDIUM MARKET, BY PURITY GRADE, 2018-2033 (USD THOUSAND)
TABLE 1662 TURKEY SEMICONDUCTOR INDUSTRY IN INDIUM MARKET, BY TYPE, 2018-2033 (USD THOUSAND)
TABLE 1663 TURKEY III-V COMPOUND SEMICONDUCTORS IN INDIUM MARKET, BY PURITY GRADE, 2018-2033 (USD THOUSAND)
TABLE 1664 TURKEY HIGH-FREQUENCY RF COMPONENTS IN INDIUM MARKET, BY PURITY GRADE, 2018-2033 (USD THOUSAND)
TABLE 1665 TURKEY SEMICONDUCTOR SUBSTRATES & EPITAXY IN INDIUM MARKET, BY PURITY GRADE, 2018-2033 (USD THOUSAND)
TABLE 1666 TURKEY LASER DIODES IN INDIUM MARKET, BY PURITY GRADE, 2018-2033 (USD THOUSAND)
TABLE 1667 TURKEY PHOTODETECTORS IN INDIUM MARKET, BY PURITY GRADE, 2018-2033 (USD THOUSAND)
TABLE 1668 TURKEY HIGH-SPEED OPTOELECTRONICS IN INDIUM MARKET, BY PURITY GRADE, 2018-2033 (USD THOUSAND)
TABLE 1669 TURKEY INFRARED DETECTORS IN INDIUM MARKET, BY PURITY GRADE, 2018-2033 (USD THOUSAND)
TABLE 1670 TURKEY INTEGRATED PHOTONIC CIRCUITS IN INDIUM MARKET, BY PURITY GRADE, 2018-2033 (USD THOUSAND)
TABLE 1671 TURKEY SOLAR PHOTOVOLTAIC INDUSTRY IN INDIUM MARKET, BY TYPE, 2018-2033 (USD THOUSAND)
TABLE 1672 TURKEY CIGS THIN-FILM SOLAR CELLS IN INDIUM MARKET, BY PURITY GRADE, 2018-2033 (USD THOUSAND)
TABLE 1673 TURKEYHIGH-EFFICIENCY MODULES IN INDIUM MARKET, BY PURITY GRADE, 2018-2033 (USD THOUSAND)
TABLE 1674 TURKEY THIN-FILM COATINGS IN INDIUM MARKET, BY PURITY GRADE, 2018-2033 (USD THOUSAND)
TABLE 1675 TURKEY TRANSPARENT ELECTRODES IN INDIUM MARKET, BY PURITY GRADE, 2018-2033 (USD THOUSAND)
TABLE 1676 TURKEY BIPV IN INDIUM MARKET, BY PURITY GRADE, 2018-2033 (USD THOUSAND)
TABLE 1677 TURKEY FLEXIBLE SOLAR PANELS IN INDIUM MARKET, BY PURITY GRADE, 2018-2033 (USD THOUSAND)
TABLE 1678 TURKEY PORTABLE SOLAR SYSTEMS IN INDIUM MARKET, BY PURITY GRADE, 2018-2033 (USD THOUSAND)
TABLE 1679 TURKEY CONCENTRATED PV IN INDIUM MARKET, BY PURITY GRADE, 2018-2033 (USD THOUSAND)
TABLE 1680 TURKEY AUTOMOTIVE INDUSTRY IN INDIUM MARKET, BY TYPE, 2018-2033 (USD THOUSAND)
TABLE 1681 TURKEY AUTOMOTIVE DISPLAY PANELS IN INDIUM MARKET, BY PURITY GRADE, 2018-2033 (USD THOUSAND)
TABLE 1682 TURKEYADAS SENSORS IN INDIUM MARKET, BY PURITY GRADE, 2018-2033 (USD THOUSAND)
TABLE 1683 TURKEY VEHICLE CAMERA MODULES IN INDIUM MARKET, BY PURITY GRADE, 2018-2033 (USD THOUSAND)
TABLE 1684 TURKEY AUTOMOTIVE OPTOELECTRONICS IN INDIUM MARKET, BY PURITY GRADE, 2018-2033 (USD THOUSAND)
TABLE 1685 TURKEY POWER ELECTRONICS IN INDIUM MARKET, BY PURITY GRADE, 2018-2033 (USD THOUSAND)
TABLE 1686 TURKEY TOUCHSCREEN INTERFACES IN INDIUM MARKET, BY PURITY GRADE, 2018-2033 (USD THOUSAND)
TABLE 1687 TURKEY INFRARED SENSORS IN INDIUM MARKET, BY PURITY GRADE, 2018-2033 (USD THOUSAND)
TABLE 1688 TURKEY SMART LIGHTING IN INDIUM MARKET, BY PURITY GRADE, 2018-2033 (USD THOUSAND)
TABLE 1689 TURKEY TELECOMMUNICATION EQUIPMENT INDUSTRY IN INDIUM MARKET, BY TYPE, 2018-2033 (USD THOUSAND)
TABLE 1690 TURKEY OPTICAL TRANSCEIVERS IN INDIUM MARKET, BY PURITY GRADE, 2018-2033 (USD THOUSAND)
TABLE 1691 TURKEY RF POWER AMPLIFIERS IN INDIUM MARKET, BY PURITY GRADE, 2018-2033 (USD THOUSAND)
TABLE 1692 TURKEY HIGH-FREQUENCY COMMUNICATION CHIPS IN INDIUM MARKET, BY PURITY GRADE, 2018-2033 (USD THOUSAND)
TABLE 1693 TURKEY FIBER-OPTIC COMMUNICATION LASERS IN INDIUM MARKET, BY PURITY GRADE, 2018-2033 (USD THOUSAND)
TABLE 1694 TURKEY PHOTODETECTORS FOR OPTICAL NETWORKS IN INDIUM MARKET, BY PURITY GRADE, 2018-2033 (USD THOUSAND)
TABLE 1695 TURKEY 5G INFRASTRUCTURE COMPONENTS IN INDIUM MARKET, BY PURITY GRADE, 2018-2033 (USD THOUSAND)
TABLE 1696 TURKEY OPTICAL NETWORK SWITCHING DEVICES IN INDIUM MARKET, BY PURITY GRADE, 2018-2033 (USD THOUSAND)
TABLE 1697 TURKEY SATELLITE COMMUNICATION MODULES IN INDIUM MARKET, BY PURITY GRADE, 2018-2033 (USD THOUSAND)
TABLE 1698 TURKEY OPTICAL & PHOTONICS INDUSTRY IN INDIUM MARKET, BY TYPE, 2018-2033 (USD THOUSAND)
TABLE 1699 TURKEY OPTICAL COATINGS IN INDIUM MARKET, BY PURITY GRADE, 2018-2033 (USD THOUSAND)
TABLE 1700 TURKEY FIBER OPTIC COMPONENTS IN INDIUM MARKET, BY PURITY GRADE, 2018-2033 (USD THOUSAND)
TABLE 1701 TURKEY LASER COMPONENTS IN INDIUM MARKET, BY PURITY GRADE, 2018-2033 (USD THOUSAND)
TABLE 1702 TURKEY OPTICAL SENSORS IN INDIUM MARKET, BY PURITY GRADE, 2018-2033 (USD THOUSAND)
TABLE 1703 TURKEY INFRARED OPTICS IN INDIUM MARKET, BY PURITY GRADE, 2018-2033 (USD THOUSAND)
TABLE 1704 TURKEY PICS IN INDIUM MARKET, BY PURITY GRADE, 2018-2033 (USD THOUSAND)
TABLE 1705 TURKEY MIRRORS IN INDIUM MARKET, BY PURITY GRADE, 2018-2033 (USD THOUSAND)
TABLE 1706 TURKEY SPECTROSCOPY IN INDIUM MARKET, BY PURITY GRADE, 2018-2033 (USD THOUSAND)
TABLE 1707 TURKEY AEROSPACE & DEFENSE INDUSTRY IN INDIUM MARKET, BY TYPE, 2018-2033 (USD THOUSAND)
TABLE 1708 TURKEY INFRARED IMAGING SYSTEMS IN INDIUM MARKET, BY PURITY GRADE, 2018-2033 (USD THOUSAND)
TABLE 1709 TURKEY RADAR & RF COMPONENTS IN INDIUM MARKET, BY PURITY GRADE, 2018-2033 (USD THOUSAND)
TABLE 1710 TURKEY SATELLITE COMMUNICATION IN INDIUM MARKET, BY PURITY GRADE, 2018-2033 (USD THOUSAND)
TABLE 1711 TURKEY MILITARY OPTOELECTRONICS IN INDIUM MARKET, BY PURITY GRADE, 2018-2033 (USD THOUSAND)
TABLE 1712 TURKEY AVIONICS DISPLAYS IN INDIUM MARKET, BY PURITY GRADE, 2018-2033 (USD THOUSAND)
TABLE 1713 TURKEY SPACECRAFT SOLAR PANELS IN INDIUM MARKET, BY PURITY GRADE, 2018-2033 (USD THOUSAND)
TABLE 1714 TURKEY THERMAL MATERIALS IN INDIUM MARKET, BY PURITY GRADE, 2018-2033 (USD THOUSAND)
TABLE 1715 TURKEY CRYOGENIC MATERIALS IN INDIUM MARKET, BY PURITY GRADE, 2018-2033 (USD THOUSAND)
TABLE 1716 TURKEY MEDICAL DEVICE INDUSTRY IN INDIUM MARKET, BY TYPE, 2018-2033 (USD THOUSAND)
TABLE 1717 TURKEY MEDICAL IMAGING SENSORS IN INDIUM MARKET, BY PURITY GRADE, 2018-2033 (USD THOUSAND)
TABLE 1718 TURKEY DIAGNOSTIC EQUIPMENT DISPLAYS IN INDIUM MARKET, BY PURITY GRADE, 2018-2033 (USD THOUSAND)
TABLE 1719 TURKEY ADVANCED DIAGNOSTIC INSTRUMENTS IN INDIUM MARKET, BY PURITY GRADE, 2018-2033 (USD THOUSAND)
TABLE 1720 TURKEY LASER SURGICAL EQUIPMENT IN INDIUM MARKET, BY PURITY GRADE, 2018-2033 (USD THOUSAND)
TABLE 1721 TURKEY BIOMEDICAL OPTICAL DEVICES IN INDIUM MARKET, BY PURITY GRADE, 2018-2033 (USD THOUSAND)
TABLE 1722 TURKEY RADIATION DETECTION EQUIPMENT IN INDIUM MARKET, BY PURITY GRADE, 2018-2033 (USD THOUSAND)
TABLE 1723 TURKEY INFRARED MEDICAL SENSORS IN INDIUM MARKET, BY PURITY GRADE, 2018-2033 (USD THOUSAND)
TABLE 1724 TURKEY PHOTOTHERAPY DEVICES IN INDIUM MARKET, BY PURITY GRADE, 2018-2033 (USD THOUSAND)
TABLE 1725 TURKEY INDUSTRIAL EQUIPMENT MANUFACTURING IN INDIUM MARKET, BY TYPE, 2018-2033 (USD THOUSAND)
TABLE 1726 TURKEY INDUSTRIAL SENSORS IN INDIUM MARKET, BY PURITY GRADE, 2018-2033 (USD THOUSAND)
TABLE 1727 TURKEY VACUUM DEPOSITION COATINGS IN INDIUM MARKET, BY PURITY GRADE, 2018-2033 (USD THOUSAND)
TABLE 1728 TURKEY PRECISION OPTICAL COMPONENTS IN INDIUM MARKET, BY PURITY GRADE, 2018-2033 (USD THOUSAND)
TABLE 1729 TURKEY THERMAL INTERFACE MATERIALS IN INDIUM MARKET, BY PURITY GRADE, 2018-2033 (USD THOUSAND)
TABLE 1730 TURKEY INDUSTRIAL LASER SYSTEMS IN INDIUM MARKET, BY PURITY GRADE, 2018-2033 (USD THOUSAND)
TABLE 1731 TURKEY INDUSTRIAL INFRARED DETECTORS IN INDIUM MARKET, BY PURITY GRADE, 2018-2033 (USD THOUSAND)
TABLE 1732 TURKEY PRECISION MEASUREMENT EQUIPMENT IN INDIUM MARKET, BY PURITY GRADE, 2018-2033 (USD THOUSAND)
TABLE 1733 TURKEY SPECIALTY ELECTRONIC COMPONENTS IN INDIUM MARKET, BY PURITY GRADE, 2018-2033 (USD THOUSAND)
TABLE 1734 TURKEY OTHERS IN INDIUM MARKET, BY TYPE, 2018-2033 (USD THOUSAND)
TABLE 1735 TURKEY ADVANCED MATERIALS MANUFACTURING IN INDIUM MARKET, BY PURITY GRADE, 2018-2033 (USD THOUSAND)
TABLE 1736 TURKEY SPECIALTY ALLOY PRODUCTION IN INDIUM MARKET, BY PURITY GRADE, 2018-2033 (USD THOUSAND)
TABLE 1737 TURKEY THERMAL MANAGEMENT MATERIALS IN INDIUM MARKET, BY PURITY GRADE, 2018-2033 (USD THOUSAND)
TABLE 1738 TURKEY PRECISION SCIENTIFIC INSTRUMENTS IN INDIUM MARKET, BY PURITY GRADE, 2018-2033 (USD THOUSAND)
TABLE 1739 TURKEY RESEARCH INSTITUTES & UNIVERSITIES IN INDIUM MARKET, BY PURITY GRADE, 2018-2033 (USD THOUSAND)
TABLE 1740 TURKEY NUCLEAR INDUSTRY APPLICATIONS IN INDIUM MARKET, BY PURITY GRADE, 2018-2033 (USD THOUSAND)
TABLE 1741 TURKEY SPECIALTY CHEMICAL PRODUCTION IN INDIUM MARKET, BY PURITY GRADE, 2018-2033 (USD THOUSAND)
TABLE 1742 TURKEY DEFENSE RESEARCH LABORATORIES IN INDIUM MARKET, BY PURITY GRADE, 2018-2033 (USD THOUSAND)
TABLE 1743 TURKEY CRYOGENIC EQUIPMENT MANUFACTURING IN INDIUM MARKET, BY PURITY GRADE, 2018-2033 (USD THOUSAND)
TABLE 1744 RUSSIA INDIUM MARKET, BY PRODUCT TYPE, 2018-2033 (USD THOUSAND)
TABLE 1745 RUSSIA INGOTS IN INDIUM MARKET, BY TYPE, 2018-2033 (USD THOUSAND)
TABLE 1746 RUSSIA INDIUM MARKET, BY MATERIAL COMPOSITION, 2018-2033 (USD THOUSAND)
TABLE 1747 RUSSIA INDIUM ALLOYS IN INDIUM MARKET, BY TYPE, 2018-2033 (USD THOUSAND)
TABLE 1748 RUSSIA INDIUM COMPOUNDS IN INDIUM MARKET, BY TYPE, 2018-2033 (USD THOUSAND)
TABLE 1749 RUSSIA INDIUM MARKET, BY PURITY GRADE, 2018-2033 (USD THOUSAND)
TABLE 1750 RUSSIA INDIUM MARKET, BY EXTRACTION SOURCE, 2018-2033 (USD THOUSAND)
TABLE 1751 RUSSIA PRIMARY PRODUCTION IN INDIUM MARKET, BY TYPE, 2018-2033 (USD THOUSAND)
TABLE 1752 RUSSIA SECONDARY PRODUCTION IN INDIUM MARKET, BY TYPE, 2018-2033 (USD THOUSAND)
TABLE 1753 RUSSIA INDIUM MARKET, BY DISTRIBUTION CHANNEL, 2018-2033 (USD THOUSAND)
TABLE 1754 RUSSIA INDIUM MARKET, BY TECHNOLOGY PLATFORM, 2018-2033 (USD THOUSAND)
TABLE 1755 RUSSIA INDIUM MARKET, BY END-USER INDUSTRY, 2018-2033 (USD THOUSAND)
TABLE 1756 RUSSIA CONSUMER ELECTRONICS INDUSTRY IN INDIUM MARKET, BY TYPE, 2018-2033 (USD THOUSAND)
TABLE 1757 RUSSIA FLAT PANEL DISPLAYS (LCD/OLED/LED) IN INDIUM MARKET, BY PURITY GRADE, 2018-2033 (USD THOUSAND)
TABLE 1758 RUSSIA TRANSPARENT CONDUCTIVE COATINGS (ITO) IN INDIUM MARKET, BY PURITY GRADE, 2018-2033 (USD THOUSAND)
TABLE 1759 RUSSIA TOUCHSCREEN DISPLAYS IN INDIUM MARKET, BY PURITY GRADE, 2018-2033 (USD THOUSAND)
TABLE 1760 RUSSIA FLEXIBLE DISPLAYS & ELECTRONICS IN INDIUM MARKET, BY PURITY GRADE, 2018-2033 (USD THOUSAND)
TABLE 1761 RUSSIA WEARABLE ELECTRONICS DEVICES IN INDIUM MARKET, BY PURITY GRADE, 2018-2033 (USD THOUSAND)
TABLE 1762 RUSSIA CAMERA & OPTICAL SENSORS IN INDIUM MARKET, BY PURITY GRADE, 2018-2033 (USD THOUSAND)
TABLE 1763 RUSSIA MINI-LED BACKLIGHTING IN INDIUM MARKET, BY PURITY GRADE, 2018-2033 (USD THOUSAND)
TABLE 1764 RUSSIA MICRO-LED DISPLAYS IN INDIUM MARKET, BY PURITY GRADE, 2018-2033 (USD THOUSAND)
TABLE 1765 RUSSIA DISPLAY PANEL INDUSTRY IN INDIUM MARKET, BY TYPE, 2018-2033 (USD THOUSAND)
TABLE 1766 RUSSIA LCD PANEL MANUFACTURING IN INDIUM MARKET, BY PURITY GRADE, 2018-2033 (USD THOUSAND)
TABLE 1767 RUSSIA OLED PANEL MANUFACTURING IN INDIUM MARKET, BY PURITY GRADE, 2018-2033 (USD THOUSAND)
TABLE 1768 RUSSIA DISPLAY PANEL MANUFACTURING IN INDIUM MARKET, BY PURITY GRADE, 2018-2033 (USD THOUSAND)
TABLE 1769 RUSSIA TOUCH PANEL SENSORS IN INDIUM MARKET, BY PURITY GRADE, 2018-2033 (USD THOUSAND)
TABLE 1770 RUSSIA TRANSPARENT CONDUCTIVE FILMS IN INDIUM MARKET, BY PURITY GRADE, 2018-2033 (USD THOUSAND)
TABLE 1771 RUSSIA FLEXIBLE & FOLDABLE DISPLAYS IN INDIUM MARKET, BY PURITY GRADE, 2018-2033 (USD THOUSAND)
TABLE 1772 RUSSIA AR/VR DISPLAYS IN INDIUM MARKET, BY PURITY GRADE, 2018-2033 (USD THOUSAND)
TABLE 1773 RUSSIA MICRODISPLAY DEVICES IN INDIUM MARKET, BY PURITY GRADE, 2018-2033 (USD THOUSAND)
TABLE 1774 RUSSIA BACKPLANE COATINGS IN INDIUM MARKET, BY PURITY GRADE, 2018-2033 (USD THOUSAND)
TABLE 1775 RUSSIA SEMICONDUCTOR INDUSTRY IN INDIUM MARKET, BY TYPE, 2018-2033 (USD THOUSAND)
TABLE 1776 RUSSIA III-V COMPOUND SEMICONDUCTORS IN INDIUM MARKET, BY PURITY GRADE, 2018-2033 (USD THOUSAND)
TABLE 1777 RUSSIA HIGH-FREQUENCY RF COMPONENTS IN INDIUM MARKET, BY PURITY GRADE, 2018-2033 (USD THOUSAND)
TABLE 1778 RUSSIA SEMICONDUCTOR SUBSTRATES & EPITAXY IN INDIUM MARKET, BY PURITY GRADE, 2018-2033 (USD THOUSAND)
TABLE 1779 RUSSIA LASER DIODES IN INDIUM MARKET, BY PURITY GRADE, 2018-2033 (USD THOUSAND)
TABLE 1780 RUSSIA PHOTODETECTORS IN INDIUM MARKET, BY PURITY GRADE, 2018-2033 (USD THOUSAND)
TABLE 1781 RUSSIA HIGH-SPEED OPTOELECTRONICS IN INDIUM MARKET, BY PURITY GRADE, 2018-2033 (USD THOUSAND)
TABLE 1782 RUSSIA INFRARED DETECTORS IN INDIUM MARKET, BY PURITY GRADE, 2018-2033 (USD THOUSAND)
TABLE 1783 RUSSIA INTEGRATED PHOTONIC CIRCUITS IN INDIUM MARKET, BY PURITY GRADE, 2018-2033 (USD THOUSAND)
TABLE 1784 RUSSIA SOLAR PHOTOVOLTAIC INDUSTRY IN INDIUM MARKET, BY TYPE, 2018-2033 (USD THOUSAND)
TABLE 1785 RUSSIA CIGS THIN-FILM SOLAR CELLS IN INDIUM MARKET, BY PURITY GRADE, 2018-2033 (USD THOUSAND)
TABLE 1786 RUSSIAHIGH-EFFICIENCY MODULES IN INDIUM MARKET, BY PURITY GRADE, 2018-2033 (USD THOUSAND)
TABLE 1787 RUSSIA THIN-FILM COATINGS IN INDIUM MARKET, BY PURITY GRADE, 2018-2033 (USD THOUSAND)
TABLE 1788 RUSSIA TRANSPARENT ELECTRODES IN INDIUM MARKET, BY PURITY GRADE, 2018-2033 (USD THOUSAND)
TABLE 1789 RUSSIA BIPV IN INDIUM MARKET, BY PURITY GRADE, 2018-2033 (USD THOUSAND)
TABLE 1790 RUSSIA FLEXIBLE SOLAR PANELS IN INDIUM MARKET, BY PURITY GRADE, 2018-2033 (USD THOUSAND)
TABLE 1791 RUSSIA PORTABLE SOLAR SYSTEMS IN INDIUM MARKET, BY PURITY GRADE, 2018-2033 (USD THOUSAND)
TABLE 1792 RUSSIA CONCENTRATED PV IN INDIUM MARKET, BY PURITY GRADE, 2018-2033 (USD THOUSAND)
TABLE 1793 RUSSIA AUTOMOTIVE INDUSTRY IN INDIUM MARKET, BY TYPE, 2018-2033 (USD THOUSAND)
TABLE 1794 RUSSIA AUTOMOTIVE DISPLAY PANELS IN INDIUM MARKET, BY PURITY GRADE, 2018-2033 (USD THOUSAND)
TABLE 1795 RUSSIAADAS SENSORS IN INDIUM MARKET, BY PURITY GRADE, 2018-2033 (USD THOUSAND)
TABLE 1796 RUSSIA VEHICLE CAMERA MODULES IN INDIUM MARKET, BY PURITY GRADE, 2018-2033 (USD THOUSAND)
TABLE 1797 RUSSIA AUTOMOTIVE OPTOELECTRONICS IN INDIUM MARKET, BY PURITY GRADE, 2018-2033 (USD THOUSAND)
TABLE 1798 RUSSIA POWER ELECTRONICS IN INDIUM MARKET, BY PURITY GRADE, 2018-2033 (USD THOUSAND)
TABLE 1799 RUSSIA TOUCHSCREEN INTERFACES IN INDIUM MARKET, BY PURITY GRADE, 2018-2033 (USD THOUSAND)
TABLE 1800 RUSSIA INFRARED SENSORS IN INDIUM MARKET, BY PURITY GRADE, 2018-2033 (USD THOUSAND)
TABLE 1801 RUSSIA SMART LIGHTING IN INDIUM MARKET, BY PURITY GRADE, 2018-2033 (USD THOUSAND)
TABLE 1802 RUSSIA TELECOMMUNICATION EQUIPMENT INDUSTRY IN INDIUM MARKET, BY TYPE, 2018-2033 (USD THOUSAND)
TABLE 1803 RUSSIA OPTICAL TRANSCEIVERS IN INDIUM MARKET, BY PURITY GRADE, 2018-2033 (USD THOUSAND)
TABLE 1804 RUSSIA RF POWER AMPLIFIERS IN INDIUM MARKET, BY PURITY GRADE, 2018-2033 (USD THOUSAND)
TABLE 1805 RUSSIA HIGH-FREQUENCY COMMUNICATION CHIPS IN INDIUM MARKET, BY PURITY GRADE, 2018-2033 (USD THOUSAND)
TABLE 1806 RUSSIA FIBER-OPTIC COMMUNICATION LASERS IN INDIUM MARKET, BY PURITY GRADE, 2018-2033 (USD THOUSAND)
TABLE 1807 RUSSIA PHOTODETECTORS FOR OPTICAL NETWORKS IN INDIUM MARKET, BY PURITY GRADE, 2018-2033 (USD THOUSAND)
TABLE 1808 RUSSIA 5G INFRASTRUCTURE COMPONENTS IN INDIUM MARKET, BY PURITY GRADE, 2018-2033 (USD THOUSAND)
TABLE 1809 RUSSIA OPTICAL NETWORK SWITCHING DEVICES IN INDIUM MARKET, BY PURITY GRADE, 2018-2033 (USD THOUSAND)
TABLE 1810 RUSSIA SATELLITE COMMUNICATION MODULES IN INDIUM MARKET, BY PURITY GRADE, 2018-2033 (USD THOUSAND)
TABLE 1811 RUSSIA OPTICAL & PHOTONICS INDUSTRY IN INDIUM MARKET, BY TYPE, 2018-2033 (USD THOUSAND)
TABLE 1812 RUSSIA OPTICAL COATINGS IN INDIUM MARKET, BY PURITY GRADE, 2018-2033 (USD THOUSAND)
TABLE 1813 RUSSIA FIBER OPTIC COMPONENTS IN INDIUM MARKET, BY PURITY GRADE, 2018-2033 (USD THOUSAND)
TABLE 1814 RUSSIA LASER COMPONENTS IN INDIUM MARKET, BY PURITY GRADE, 2018-2033 (USD THOUSAND)
TABLE 1815 RUSSIA OPTICAL SENSORS IN INDIUM MARKET, BY PURITY GRADE, 2018-2033 (USD THOUSAND)
TABLE 1816 RUSSIA INFRARED OPTICS IN INDIUM MARKET, BY PURITY GRADE, 2018-2033 (USD THOUSAND)
TABLE 1817 RUSSIA PICS IN INDIUM MARKET, BY PURITY GRADE, 2018-2033 (USD THOUSAND)
TABLE 1818 RUSSIA MIRRORS IN INDIUM MARKET, BY PURITY GRADE, 2018-2033 (USD THOUSAND)
TABLE 1819 RUSSIA SPECTROSCOPY IN INDIUM MARKET, BY PURITY GRADE, 2018-2033 (USD THOUSAND)
TABLE 1820 RUSSIA AEROSPACE & DEFENSE INDUSTRY IN INDIUM MARKET, BY TYPE, 2018-2033 (USD THOUSAND)
TABLE 1821 RUSSIA INFRARED IMAGING SYSTEMS IN INDIUM MARKET, BY PURITY GRADE, 2018-2033 (USD THOUSAND)
TABLE 1822 RUSSIA RADAR & RF COMPONENTS IN INDIUM MARKET, BY PURITY GRADE, 2018-2033 (USD THOUSAND)
TABLE 1823 RUSSIA SATELLITE COMMUNICATION IN INDIUM MARKET, BY PURITY GRADE, 2018-2033 (USD THOUSAND)
TABLE 1824 RUSSIA MILITARY OPTOELECTRONICS IN INDIUM MARKET, BY PURITY GRADE, 2018-2033 (USD THOUSAND)
TABLE 1825 RUSSIA AVIONICS DISPLAYS IN INDIUM MARKET, BY PURITY GRADE, 2018-2033 (USD THOUSAND)
TABLE 1826 RUSSIA SPACECRAFT SOLAR PANELS IN INDIUM MARKET, BY PURITY GRADE, 2018-2033 (USD THOUSAND)
TABLE 1827 RUSSIA THERMAL MATERIALS IN INDIUM MARKET, BY PURITY GRADE, 2018-2033 (USD THOUSAND)
TABLE 1828 RUSSIA CRYOGENIC MATERIALS IN INDIUM MARKET, BY PURITY GRADE, 2018-2033 (USD THOUSAND)
TABLE 1829 RUSSIA MEDICAL DEVICE INDUSTRY IN INDIUM MARKET, BY TYPE, 2018-2033 (USD THOUSAND)
TABLE 1830 RUSSIA MEDICAL IMAGING SENSORS IN INDIUM MARKET, BY PURITY GRADE, 2018-2033 (USD THOUSAND)
TABLE 1831 RUSSIA DIAGNOSTIC EQUIPMENT DISPLAYS IN INDIUM MARKET, BY PURITY GRADE, 2018-2033 (USD THOUSAND)
TABLE 1832 RUSSIA ADVANCED DIAGNOSTIC INSTRUMENTS IN INDIUM MARKET, BY PURITY GRADE, 2018-2033 (USD THOUSAND)
TABLE 1833 RUSSIA LASER SURGICAL EQUIPMENT IN INDIUM MARKET, BY PURITY GRADE, 2018-2033 (USD THOUSAND)
TABLE 1834 RUSSIA BIOMEDICAL OPTICAL DEVICES IN INDIUM MARKET, BY PURITY GRADE, 2018-2033 (USD THOUSAND)
TABLE 1835 RUSSIA RADIATION DETECTION EQUIPMENT IN INDIUM MARKET, BY PURITY GRADE, 2018-2033 (USD THOUSAND)
TABLE 1836 RUSSIA INFRARED MEDICAL SENSORS IN INDIUM MARKET, BY PURITY GRADE, 2018-2033 (USD THOUSAND)
TABLE 1837 RUSSIA PHOTOTHERAPY DEVICES IN INDIUM MARKET, BY PURITY GRADE, 2018-2033 (USD THOUSAND)
TABLE 1838 RUSSIA INDUSTRIAL EQUIPMENT MANUFACTURING IN INDIUM MARKET, BY TYPE, 2018-2033 (USD THOUSAND)
TABLE 1839 RUSSIA INDUSTRIAL SENSORS IN INDIUM MARKET, BY PURITY GRADE, 2018-2033 (USD THOUSAND)
TABLE 1840 RUSSIA VACUUM DEPOSITION COATINGS IN INDIUM MARKET, BY PURITY GRADE, 2018-2033 (USD THOUSAND)
TABLE 1841 RUSSIA PRECISION OPTICAL COMPONENTS IN INDIUM MARKET, BY PURITY GRADE, 2018-2033 (USD THOUSAND)
TABLE 1842 RUSSIA THERMAL INTERFACE MATERIALS IN INDIUM MARKET, BY PURITY GRADE, 2018-2033 (USD THOUSAND)
TABLE 1843 RUSSIA INDUSTRIAL LASER SYSTEMS IN INDIUM MARKET, BY PURITY GRADE, 2018-2033 (USD THOUSAND)
TABLE 1844 RUSSIA INDUSTRIAL INFRARED DETECTORS IN INDIUM MARKET, BY PURITY GRADE, 2018-2033 (USD THOUSAND)
TABLE 1845 RUSSIA PRECISION MEASUREMENT EQUIPMENT IN INDIUM MARKET, BY PURITY GRADE, 2018-2033 (USD THOUSAND)
TABLE 1846 RUSSIA SPECIALTY ELECTRONIC COMPONENTS IN INDIUM MARKET, BY PURITY GRADE, 2018-2033 (USD THOUSAND)
TABLE 1847 RUSSIA OTHERS IN INDIUM MARKET, BY TYPE, 2018-2033 (USD THOUSAND)
TABLE 1848 RUSSIA ADVANCED MATERIALS MANUFACTURING IN INDIUM MARKET, BY PURITY GRADE, 2018-2033 (USD THOUSAND)
TABLE 1849 RUSSIA SPECIALTY ALLOY PRODUCTION IN INDIUM MARKET, BY PURITY GRADE, 2018-2033 (USD THOUSAND)
TABLE 1850 RUSSIA THERMAL MANAGEMENT MATERIALS IN INDIUM MARKET, BY PURITY GRADE, 2018-2033 (USD THOUSAND)
TABLE 1851 RUSSIA PRECISION SCIENTIFIC INSTRUMENTS IN INDIUM MARKET, BY PURITY GRADE, 2018-2033 (USD THOUSAND)
TABLE 1852 RUSSIA RESEARCH INSTITUTES & UNIVERSITIES IN INDIUM MARKET, BY PURITY GRADE, 2018-2033 (USD THOUSAND)
TABLE 1853 RUSSIA NUCLEAR INDUSTRY APPLICATIONS IN INDIUM MARKET, BY PURITY GRADE, 2018-2033 (USD THOUSAND)
TABLE 1854 RUSSIA SPECIALTY CHEMICAL PRODUCTION IN INDIUM MARKET, BY PURITY GRADE, 2018-2033 (USD THOUSAND)
TABLE 1855 RUSSIA DEFENSE RESEARCH LABORATORIES IN INDIUM MARKET, BY PURITY GRADE, 2018-2033 (USD THOUSAND)
TABLE 1856 RUSSIA CRYOGENIC EQUIPMENT MANUFACTURING IN INDIUM MARKET, BY PURITY GRADE, 2018-2033 (USD THOUSAND)
TABLE 1857 SWEDEN INDIUM MARKET, BY PRODUCT TYPE, 2018-2033 (USD THOUSAND)
TABLE 1858 SWEDEN INGOTS IN INDIUM MARKET, BY TYPE, 2018-2033 (USD THOUSAND)
TABLE 1859 SWEDEN INDIUM MARKET, BY MATERIAL COMPOSITION, 2018-2033 (USD THOUSAND)
TABLE 1860 SWEDEN INDIUM ALLOYS IN INDIUM MARKET, BY TYPE, 2018-2033 (USD THOUSAND)
TABLE 1861 SWEDEN INDIUM COMPOUNDS IN INDIUM MARKET, BY TYPE, 2018-2033 (USD THOUSAND)
TABLE 1862 SWEDEN INDIUM MARKET, BY PURITY GRADE, 2018-2033 (USD THOUSAND)
TABLE 1863 SWEDEN INDIUM MARKET, BY EXTRACTION SOURCE, 2018-2033 (USD THOUSAND)
TABLE 1864 SWEDEN PRIMARY PRODUCTION IN INDIUM MARKET, BY TYPE, 2018-2033 (USD THOUSAND)
TABLE 1865 SWEDEN SECONDARY PRODUCTION IN INDIUM MARKET, BY TYPE, 2018-2033 (USD THOUSAND)
TABLE 1866 SWEDEN INDIUM MARKET, BY DISTRIBUTION CHANNEL, 2018-2033 (USD THOUSAND)
TABLE 1867 SWEDEN INDIUM MARKET, BY TECHNOLOGY PLATFORM, 2018-2033 (USD THOUSAND)
TABLE 1868 SWEDEN INDIUM MARKET, BY END-USER INDUSTRY, 2018-2033 (USD THOUSAND)
TABLE 1869 SWEDEN CONSUMER ELECTRONICS INDUSTRY IN INDIUM MARKET, BY TYPE, 2018-2033 (USD THOUSAND)
TABLE 1870 SWEDEN FLAT PANEL DISPLAYS (LCD/OLED/LED) IN INDIUM MARKET, BY PURITY GRADE, 2018-2033 (USD THOUSAND)
TABLE 1871 SWEDEN TRANSPARENT CONDUCTIVE COATINGS (ITO) IN INDIUM MARKET, BY PURITY GRADE, 2018-2033 (USD THOUSAND)
TABLE 1872 SWEDEN TOUCHSCREEN DISPLAYS IN INDIUM MARKET, BY PURITY GRADE, 2018-2033 (USD THOUSAND)
TABLE 1873 SWEDEN FLEXIBLE DISPLAYS & ELECTRONICS IN INDIUM MARKET, BY PURITY GRADE, 2018-2033 (USD THOUSAND)
TABLE 1874 SWEDEN WEARABLE ELECTRONICS DEVICES IN INDIUM MARKET, BY PURITY GRADE, 2018-2033 (USD THOUSAND)
TABLE 1875 SWEDEN CAMERA & OPTICAL SENSORS IN INDIUM MARKET, BY PURITY GRADE, 2018-2033 (USD THOUSAND)
TABLE 1876 SWEDEN MINI-LED BACKLIGHTING IN INDIUM MARKET, BY PURITY GRADE, 2018-2033 (USD THOUSAND)
TABLE 1877 SWEDEN MICRO-LED DISPLAYS IN INDIUM MARKET, BY PURITY GRADE, 2018-2033 (USD THOUSAND)
TABLE 1878 SWEDEN DISPLAY PANEL INDUSTRY IN INDIUM MARKET, BY TYPE, 2018-2033 (USD THOUSAND)
TABLE 1879 SWEDEN LCD PANEL MANUFACTURING IN INDIUM MARKET, BY PURITY GRADE, 2018-2033 (USD THOUSAND)
TABLE 1880 SWEDEN OLED PANEL MANUFACTURING IN INDIUM MARKET, BY PURITY GRADE, 2018-2033 (USD THOUSAND)
TABLE 1881 SWEDEN DISPLAY PANEL MANUFACTURING IN INDIUM MARKET, BY PURITY GRADE, 2018-2033 (USD THOUSAND)
TABLE 1882 SWEDEN TOUCH PANEL SENSORS IN INDIUM MARKET, BY PURITY GRADE, 2018-2033 (USD THOUSAND)
TABLE 1883 SWEDEN TRANSPARENT CONDUCTIVE FILMS IN INDIUM MARKET, BY PURITY GRADE, 2018-2033 (USD THOUSAND)
TABLE 1884 SWEDEN FLEXIBLE & FOLDABLE DISPLAYS IN INDIUM MARKET, BY PURITY GRADE, 2018-2033 (USD THOUSAND)
TABLE 1885 SWEDEN AR/VR DISPLAYS IN INDIUM MARKET, BY PURITY GRADE, 2018-2033 (USD THOUSAND)
TABLE 1886 SWEDEN MICRODISPLAY DEVICES IN INDIUM MARKET, BY PURITY GRADE, 2018-2033 (USD THOUSAND)
TABLE 1887 SWEDEN BACKPLANE COATINGS IN INDIUM MARKET, BY PURITY GRADE, 2018-2033 (USD THOUSAND)
TABLE 1888 SWEDEN SEMICONDUCTOR INDUSTRY IN INDIUM MARKET, BY TYPE, 2018-2033 (USD THOUSAND)
TABLE 1889 SWEDEN III-V COMPOUND SEMICONDUCTORS IN INDIUM MARKET, BY PURITY GRADE, 2018-2033 (USD THOUSAND)
TABLE 1890 SWEDEN HIGH-FREQUENCY RF COMPONENTS IN INDIUM MARKET, BY PURITY GRADE, 2018-2033 (USD THOUSAND)
TABLE 1891 SWEDEN SEMICONDUCTOR SUBSTRATES & EPITAXY IN INDIUM MARKET, BY PURITY GRADE, 2018-2033 (USD THOUSAND)
TABLE 1892 SWEDEN LASER DIODES IN INDIUM MARKET, BY PURITY GRADE, 2018-2033 (USD THOUSAND)
TABLE 1893 SWEDEN PHOTODETECTORS IN INDIUM MARKET, BY PURITY GRADE, 2018-2033 (USD THOUSAND)
TABLE 1894 SWEDEN HIGH-SPEED OPTOELECTRONICS IN INDIUM MARKET, BY PURITY GRADE, 2018-2033 (USD THOUSAND)
TABLE 1895 SWEDEN INFRARED DETECTORS IN INDIUM MARKET, BY PURITY GRADE, 2018-2033 (USD THOUSAND)
TABLE 1896 SWEDEN INTEGRATED PHOTONIC CIRCUITS IN INDIUM MARKET, BY PURITY GRADE, 2018-2033 (USD THOUSAND)
TABLE 1897 SWEDEN SOLAR PHOTOVOLTAIC INDUSTRY IN INDIUM MARKET, BY TYPE, 2018-2033 (USD THOUSAND)
TABLE 1898 SWEDEN CIGS THIN-FILM SOLAR CELLS IN INDIUM MARKET, BY PURITY GRADE, 2018-2033 (USD THOUSAND)
TABLE 1899 SWEDENHIGH-EFFICIENCY MODULES IN INDIUM MARKET, BY PURITY GRADE, 2018-2033 (USD THOUSAND)
TABLE 1900 SWEDEN THIN-FILM COATINGS IN INDIUM MARKET, BY PURITY GRADE, 2018-2033 (USD THOUSAND)
TABLE 1901 SWEDEN TRANSPARENT ELECTRODES IN INDIUM MARKET, BY PURITY GRADE, 2018-2033 (USD THOUSAND)
TABLE 1902 SWEDEN BIPV IN INDIUM MARKET, BY PURITY GRADE, 2018-2033 (USD THOUSAND)
TABLE 1903 SWEDEN FLEXIBLE SOLAR PANELS IN INDIUM MARKET, BY PURITY GRADE, 2018-2033 (USD THOUSAND)
TABLE 1904 SWEDEN PORTABLE SOLAR SYSTEMS IN INDIUM MARKET, BY PURITY GRADE, 2018-2033 (USD THOUSAND)
TABLE 1905 SWEDEN CONCENTRATED PV IN INDIUM MARKET, BY PURITY GRADE, 2018-2033 (USD THOUSAND)
TABLE 1906 SWEDEN AUTOMOTIVE INDUSTRY IN INDIUM MARKET, BY TYPE, 2018-2033 (USD THOUSAND)
TABLE 1907 SWEDEN AUTOMOTIVE DISPLAY PANELS IN INDIUM MARKET, BY PURITY GRADE, 2018-2033 (USD THOUSAND)
TABLE 1908 SWEDENADAS SENSORS IN INDIUM MARKET, BY PURITY GRADE, 2018-2033 (USD THOUSAND)
TABLE 1909 SWEDEN VEHICLE CAMERA MODULES IN INDIUM MARKET, BY PURITY GRADE, 2018-2033 (USD THOUSAND)
TABLE 1910 SWEDEN AUTOMOTIVE OPTOELECTRONICS IN INDIUM MARKET, BY PURITY GRADE, 2018-2033 (USD THOUSAND)
TABLE 1911 SWEDEN POWER ELECTRONICS IN INDIUM MARKET, BY PURITY GRADE, 2018-2033 (USD THOUSAND)
TABLE 1912 SWEDEN TOUCHSCREEN INTERFACES IN INDIUM MARKET, BY PURITY GRADE, 2018-2033 (USD THOUSAND)
TABLE 1913 SWEDEN INFRARED SENSORS IN INDIUM MARKET, BY PURITY GRADE, 2018-2033 (USD THOUSAND)
TABLE 1914 SWEDEN SMART LIGHTING IN INDIUM MARKET, BY PURITY GRADE, 2018-2033 (USD THOUSAND)
TABLE 1915 SWEDEN TELECOMMUNICATION EQUIPMENT INDUSTRY IN INDIUM MARKET, BY TYPE, 2018-2033 (USD THOUSAND)
TABLE 1916 SWEDEN OPTICAL TRANSCEIVERS IN INDIUM MARKET, BY PURITY GRADE, 2018-2033 (USD THOUSAND)
TABLE 1917 SWEDEN RF POWER AMPLIFIERS IN INDIUM MARKET, BY PURITY GRADE, 2018-2033 (USD THOUSAND)
TABLE 1918 SWEDEN HIGH-FREQUENCY COMMUNICATION CHIPS IN INDIUM MARKET, BY PURITY GRADE, 2018-2033 (USD THOUSAND)
TABLE 1919 SWEDEN FIBER-OPTIC COMMUNICATION LASERS IN INDIUM MARKET, BY PURITY GRADE, 2018-2033 (USD THOUSAND)
TABLE 1920 SWEDEN PHOTODETECTORS FOR OPTICAL NETWORKS IN INDIUM MARKET, BY PURITY GRADE, 2018-2033 (USD THOUSAND)
TABLE 1921 SWEDEN 5G INFRASTRUCTURE COMPONENTS IN INDIUM MARKET, BY PURITY GRADE, 2018-2033 (USD THOUSAND)
TABLE 1922 SWEDEN OPTICAL NETWORK SWITCHING DEVICES IN INDIUM MARKET, BY PURITY GRADE, 2018-2033 (USD THOUSAND)
TABLE 1923 SWEDEN SATELLITE COMMUNICATION MODULES IN INDIUM MARKET, BY PURITY GRADE, 2018-2033 (USD THOUSAND)
TABLE 1924 SWEDEN OPTICAL & PHOTONICS INDUSTRY IN INDIUM MARKET, BY TYPE, 2018-2033 (USD THOUSAND)
TABLE 1925 SWEDEN OPTICAL COATINGS IN INDIUM MARKET, BY PURITY GRADE, 2018-2033 (USD THOUSAND)
TABLE 1926 SWEDEN FIBER OPTIC COMPONENTS IN INDIUM MARKET, BY PURITY GRADE, 2018-2033 (USD THOUSAND)
TABLE 1927 SWEDEN LASER COMPONENTS IN INDIUM MARKET, BY PURITY GRADE, 2018-2033 (USD THOUSAND)
TABLE 1928 SWEDEN OPTICAL SENSORS IN INDIUM MARKET, BY PURITY GRADE, 2018-2033 (USD THOUSAND)
TABLE 1929 SWEDEN INFRARED OPTICS IN INDIUM MARKET, BY PURITY GRADE, 2018-2033 (USD THOUSAND)
TABLE 1930 SWEDEN PICS IN INDIUM MARKET, BY PURITY GRADE, 2018-2033 (USD THOUSAND)
TABLE 1931 SWEDEN MIRRORS IN INDIUM MARKET, BY PURITY GRADE, 2018-2033 (USD THOUSAND)
TABLE 1932 SWEDEN SPECTROSCOPY IN INDIUM MARKET, BY PURITY GRADE, 2018-2033 (USD THOUSAND)
TABLE 1933 SWEDEN AEROSPACE & DEFENSE INDUSTRY IN INDIUM MARKET, BY TYPE, 2018-2033 (USD THOUSAND)
TABLE 1934 SWEDEN INFRARED IMAGING SYSTEMS IN INDIUM MARKET, BY PURITY GRADE, 2018-2033 (USD THOUSAND)
TABLE 1935 SWEDEN RADAR & RF COMPONENTS IN INDIUM MARKET, BY PURITY GRADE, 2018-2033 (USD THOUSAND)
TABLE 1936 SWEDEN SATELLITE COMMUNICATION IN INDIUM MARKET, BY PURITY GRADE, 2018-2033 (USD THOUSAND)
TABLE 1937 SWEDEN MILITARY OPTOELECTRONICS IN INDIUM MARKET, BY PURITY GRADE, 2018-2033 (USD THOUSAND)
TABLE 1938 SWEDEN AVIONICS DISPLAYS IN INDIUM MARKET, BY PURITY GRADE, 2018-2033 (USD THOUSAND)
TABLE 1939 SWEDEN SPACECRAFT SOLAR PANELS IN INDIUM MARKET, BY PURITY GRADE, 2018-2033 (USD THOUSAND)
TABLE 1940 SWEDEN THERMAL MATERIALS IN INDIUM MARKET, BY PURITY GRADE, 2018-2033 (USD THOUSAND)
TABLE 1941 SWEDEN CRYOGENIC MATERIALS IN INDIUM MARKET, BY PURITY GRADE, 2018-2033 (USD THOUSAND)
TABLE 1942 SWEDEN MEDICAL DEVICE INDUSTRY IN INDIUM MARKET, BY TYPE, 2018-2033 (USD THOUSAND)
TABLE 1943 SWEDEN MEDICAL IMAGING SENSORS IN INDIUM MARKET, BY PURITY GRADE, 2018-2033 (USD THOUSAND)
TABLE 1944 SWEDEN DIAGNOSTIC EQUIPMENT DISPLAYS IN INDIUM MARKET, BY PURITY GRADE, 2018-2033 (USD THOUSAND)
TABLE 1945 SWEDEN ADVANCED DIAGNOSTIC INSTRUMENTS IN INDIUM MARKET, BY PURITY GRADE, 2018-2033 (USD THOUSAND)
TABLE 1946 SWEDEN LASER SURGICAL EQUIPMENT IN INDIUM MARKET, BY PURITY GRADE, 2018-2033 (USD THOUSAND)
TABLE 1947 SWEDEN BIOMEDICAL OPTICAL DEVICES IN INDIUM MARKET, BY PURITY GRADE, 2018-2033 (USD THOUSAND)
TABLE 1948 SWEDEN RADIATION DETECTION EQUIPMENT IN INDIUM MARKET, BY PURITY GRADE, 2018-2033 (USD THOUSAND)
TABLE 1949 SWEDEN INFRARED MEDICAL SENSORS IN INDIUM MARKET, BY PURITY GRADE, 2018-2033 (USD THOUSAND)
TABLE 1950 SWEDEN PHOTOTHERAPY DEVICES IN INDIUM MARKET, BY PURITY GRADE, 2018-2033 (USD THOUSAND)
TABLE 1951 SWEDEN INDUSTRIAL EQUIPMENT MANUFACTURING IN INDIUM MARKET, BY TYPE, 2018-2033 (USD THOUSAND)
TABLE 1952 SWEDEN INDUSTRIAL SENSORS IN INDIUM MARKET, BY PURITY GRADE, 2018-2033 (USD THOUSAND)
TABLE 1953 SWEDEN VACUUM DEPOSITION COATINGS IN INDIUM MARKET, BY PURITY GRADE, 2018-2033 (USD THOUSAND)
TABLE 1954 SWEDEN PRECISION OPTICAL COMPONENTS IN INDIUM MARKET, BY PURITY GRADE, 2018-2033 (USD THOUSAND)
TABLE 1955 SWEDEN THERMAL INTERFACE MATERIALS IN INDIUM MARKET, BY PURITY GRADE, 2018-2033 (USD THOUSAND)
TABLE 1956 SWEDEN INDUSTRIAL LASER SYSTEMS IN INDIUM MARKET, BY PURITY GRADE, 2018-2033 (USD THOUSAND)
TABLE 1957 SWEDEN INDUSTRIAL INFRARED DETECTORS IN INDIUM MARKET, BY PURITY GRADE, 2018-2033 (USD THOUSAND)
TABLE 1958 SWEDEN PRECISION MEASUREMENT EQUIPMENT IN INDIUM MARKET, BY PURITY GRADE, 2018-2033 (USD THOUSAND)
TABLE 1959 SWEDEN SPECIALTY ELECTRONIC COMPONENTS IN INDIUM MARKET, BY PURITY GRADE, 2018-2033 (USD THOUSAND)
TABLE 1960 SWEDEN OTHERS IN INDIUM MARKET, BY TYPE, 2018-2033 (USD THOUSAND)
TABLE 1961 SWEDEN ADVANCED MATERIALS MANUFACTURING IN INDIUM MARKET, BY PURITY GRADE, 2018-2033 (USD THOUSAND)
TABLE 1962 SWEDEN SPECIALTY ALLOY PRODUCTION IN INDIUM MARKET, BY PURITY GRADE, 2018-2033 (USD THOUSAND)
TABLE 1963 SWEDEN THERMAL MANAGEMENT MATERIALS IN INDIUM MARKET, BY PURITY GRADE, 2018-2033 (USD THOUSAND)
TABLE 1964 SWEDEN PRECISION SCIENTIFIC INSTRUMENTS IN INDIUM MARKET, BY PURITY GRADE, 2018-2033 (USD THOUSAND)
TABLE 1965 SWEDEN RESEARCH INSTITUTES & UNIVERSITIES IN INDIUM MARKET, BY PURITY GRADE, 2018-2033 (USD THOUSAND)
TABLE 1966 SWEDEN NUCLEAR INDUSTRY APPLICATIONS IN INDIUM MARKET, BY PURITY GRADE, 2018-2033 (USD THOUSAND)
TABLE 1967 SWEDEN SPECIALTY CHEMICAL PRODUCTION IN INDIUM MARKET, BY PURITY GRADE, 2018-2033 (USD THOUSAND)
TABLE 1968 SWEDEN DEFENSE RESEARCH LABORATORIES IN INDIUM MARKET, BY PURITY GRADE, 2018-2033 (USD THOUSAND)
TABLE 1969 SWEDEN CRYOGENIC EQUIPMENT MANUFACTURING IN INDIUM MARKET, BY PURITY GRADE, 2018-2033 (USD THOUSAND)
TABLE 1970 FINLAND INDIUM MARKET, BY PRODUCT TYPE, 2018-2033 (USD THOUSAND)
TABLE 1971 FINLAND INGOTS IN INDIUM MARKET, BY TYPE, 2018-2033 (USD THOUSAND)
TABLE 1972 FINLAND INDIUM MARKET, BY MATERIAL COMPOSITION, 2018-2033 (USD THOUSAND)
TABLE 1973 FINLAND INDIUM ALLOYS IN INDIUM MARKET, BY TYPE, 2018-2033 (USD THOUSAND)
TABLE 1974 FINLAND INDIUM COMPOUNDS IN INDIUM MARKET, BY TYPE, 2018-2033 (USD THOUSAND)
TABLE 1975 FINLAND INDIUM MARKET, BY PURITY GRADE, 2018-2033 (USD THOUSAND)
TABLE 1976 FINLAND INDIUM MARKET, BY EXTRACTION SOURCE, 2018-2033 (USD THOUSAND)
TABLE 1977 FINLAND PRIMARY PRODUCTION IN INDIUM MARKET, BY TYPE, 2018-2033 (USD THOUSAND)
TABLE 1978 FINLAND SECONDARY PRODUCTION IN INDIUM MARKET, BY TYPE, 2018-2033 (USD THOUSAND)
TABLE 1979 FINLAND INDIUM MARKET, BY DISTRIBUTION CHANNEL, 2018-2033 (USD THOUSAND)
TABLE 1980 FINLAND INDIUM MARKET, BY TECHNOLOGY PLATFORM, 2018-2033 (USD THOUSAND)
TABLE 1981 FINLAND INDIUM MARKET, BY END-USER INDUSTRY, 2018-2033 (USD THOUSAND)
TABLE 1982 FINLAND CONSUMER ELECTRONICS INDUSTRY IN INDIUM MARKET, BY TYPE, 2018-2033 (USD THOUSAND)
TABLE 1983 FINLAND FLAT PANEL DISPLAYS (LCD/OLED/LED) IN INDIUM MARKET, BY PURITY GRADE, 2018-2033 (USD THOUSAND)
TABLE 1984 FINLAND TRANSPARENT CONDUCTIVE COATINGS (ITO) IN INDIUM MARKET, BY PURITY GRADE, 2018-2033 (USD THOUSAND)
TABLE 1985 FINLAND TOUCHSCREEN DISPLAYS IN INDIUM MARKET, BY PURITY GRADE, 2018-2033 (USD THOUSAND)
TABLE 1986 FINLAND FLEXIBLE DISPLAYS & ELECTRONICS IN INDIUM MARKET, BY PURITY GRADE, 2018-2033 (USD THOUSAND)
TABLE 1987 FINLAND WEARABLE ELECTRONICS DEVICES IN INDIUM MARKET, BY PURITY GRADE, 2018-2033 (USD THOUSAND)
TABLE 1988 FINLAND CAMERA & OPTICAL SENSORS IN INDIUM MARKET, BY PURITY GRADE, 2018-2033 (USD THOUSAND)
TABLE 1989 FINLAND MINI-LED BACKLIGHTING IN INDIUM MARKET, BY PURITY GRADE, 2018-2033 (USD THOUSAND)
TABLE 1990 FINLAND MICRO-LED DISPLAYS IN INDIUM MARKET, BY PURITY GRADE, 2018-2033 (USD THOUSAND)
TABLE 1991 FINLAND DISPLAY PANEL INDUSTRY IN INDIUM MARKET, BY TYPE, 2018-2033 (USD THOUSAND)
TABLE 1992 FINLAND LCD PANEL MANUFACTURING IN INDIUM MARKET, BY PURITY GRADE, 2018-2033 (USD THOUSAND)
TABLE 1993 FINLAND OLED PANEL MANUFACTURING IN INDIUM MARKET, BY PURITY GRADE, 2018-2033 (USD THOUSAND)
TABLE 1994 FINLAND DISPLAY PANEL MANUFACTURING IN INDIUM MARKET, BY PURITY GRADE, 2018-2033 (USD THOUSAND)
TABLE 1995 FINLAND TOUCH PANEL SENSORS IN INDIUM MARKET, BY PURITY GRADE, 2018-2033 (USD THOUSAND)
TABLE 1996 FINLAND TRANSPARENT CONDUCTIVE FILMS IN INDIUM MARKET, BY PURITY GRADE, 2018-2033 (USD THOUSAND)
TABLE 1997 FINLAND FLEXIBLE & FOLDABLE DISPLAYS IN INDIUM MARKET, BY PURITY GRADE, 2018-2033 (USD THOUSAND)
TABLE 1998 FINLAND AR/VR DISPLAYS IN INDIUM MARKET, BY PURITY GRADE, 2018-2033 (USD THOUSAND)
TABLE 1999 FINLAND MICRODISPLAY DEVICES IN INDIUM MARKET, BY PURITY GRADE, 2018-2033 (USD THOUSAND)
TABLE 2000 FINLAND BACKPLANE COATINGS IN INDIUM MARKET, BY PURITY GRADE, 2018-2033 (USD THOUSAND)
TABLE 2001 FINLAND SEMICONDUCTOR INDUSTRY IN INDIUM MARKET, BY TYPE, 2018-2033 (USD THOUSAND)
TABLE 2002 FINLAND III-V COMPOUND SEMICONDUCTORS IN INDIUM MARKET, BY PURITY GRADE, 2018-2033 (USD THOUSAND)
TABLE 2003 FINLAND HIGH-FREQUENCY RF COMPONENTS IN INDIUM MARKET, BY PURITY GRADE, 2018-2033 (USD THOUSAND)
TABLE 2004 FINLAND SEMICONDUCTOR SUBSTRATES & EPITAXY IN INDIUM MARKET, BY PURITY GRADE, 2018-2033 (USD THOUSAND)
TABLE 2005 FINLAND LASER DIODES IN INDIUM MARKET, BY PURITY GRADE, 2018-2033 (USD THOUSAND)
TABLE 2006 FINLAND PHOTODETECTORS IN INDIUM MARKET, BY PURITY GRADE, 2018-2033 (USD THOUSAND)
TABLE 2007 FINLAND HIGH-SPEED OPTOELECTRONICS IN INDIUM MARKET, BY PURITY GRADE, 2018-2033 (USD THOUSAND)
TABLE 2008 FINLAND INFRARED DETECTORS IN INDIUM MARKET, BY PURITY GRADE, 2018-2033 (USD THOUSAND)
TABLE 2009 FINLAND INTEGRATED PHOTONIC CIRCUITS IN INDIUM MARKET, BY PURITY GRADE, 2018-2033 (USD THOUSAND)
TABLE 2010 FINLAND SOLAR PHOTOVOLTAIC INDUSTRY IN INDIUM MARKET, BY TYPE, 2018-2033 (USD THOUSAND)
TABLE 2011 FINLAND CIGS THIN-FILM SOLAR CELLS IN INDIUM MARKET, BY PURITY GRADE, 2018-2033 (USD THOUSAND)
TABLE 2012 FINLANDHIGH-EFFICIENCY MODULES IN INDIUM MARKET, BY PURITY GRADE, 2018-2033 (USD THOUSAND)
TABLE 2013 FINLAND THIN-FILM COATINGS IN INDIUM MARKET, BY PURITY GRADE, 2018-2033 (USD THOUSAND)
TABLE 2014 FINLAND TRANSPARENT ELECTRODES IN INDIUM MARKET, BY PURITY GRADE, 2018-2033 (USD THOUSAND)
TABLE 2015 FINLAND BIPV IN INDIUM MARKET, BY PURITY GRADE, 2018-2033 (USD THOUSAND)
TABLE 2016 FINLAND FLEXIBLE SOLAR PANELS IN INDIUM MARKET, BY PURITY GRADE, 2018-2033 (USD THOUSAND)
TABLE 2017 FINLAND PORTABLE SOLAR SYSTEMS IN INDIUM MARKET, BY PURITY GRADE, 2018-2033 (USD THOUSAND)
TABLE 2018 FINLAND CONCENTRATED PV IN INDIUM MARKET, BY PURITY GRADE, 2018-2033 (USD THOUSAND)
TABLE 2019 FINLAND AUTOMOTIVE INDUSTRY IN INDIUM MARKET, BY TYPE, 2018-2033 (USD THOUSAND)
TABLE 2020 FINLAND AUTOMOTIVE DISPLAY PANELS IN INDIUM MARKET, BY PURITY GRADE, 2018-2033 (USD THOUSAND)
TABLE 2021 FINLANDADAS SENSORS IN INDIUM MARKET, BY PURITY GRADE, 2018-2033 (USD THOUSAND)
TABLE 2022 FINLAND VEHICLE CAMERA MODULES IN INDIUM MARKET, BY PURITY GRADE, 2018-2033 (USD THOUSAND)
TABLE 2023 FINLAND AUTOMOTIVE OPTOELECTRONICS IN INDIUM MARKET, BY PURITY GRADE, 2018-2033 (USD THOUSAND)
TABLE 2024 FINLAND POWER ELECTRONICS IN INDIUM MARKET, BY PURITY GRADE, 2018-2033 (USD THOUSAND)
TABLE 2025 FINLAND TOUCHSCREEN INTERFACES IN INDIUM MARKET, BY PURITY GRADE, 2018-2033 (USD THOUSAND)
TABLE 2026 FINLAND INFRARED SENSORS IN INDIUM MARKET, BY PURITY GRADE, 2018-2033 (USD THOUSAND)
TABLE 2027 FINLAND SMART LIGHTING IN INDIUM MARKET, BY PURITY GRADE, 2018-2033 (USD THOUSAND)
TABLE 2028 FINLAND TELECOMMUNICATION EQUIPMENT INDUSTRY IN INDIUM MARKET, BY TYPE, 2018-2033 (USD THOUSAND)
TABLE 2029 FINLAND OPTICAL TRANSCEIVERS IN INDIUM MARKET, BY PURITY GRADE, 2018-2033 (USD THOUSAND)
TABLE 2030 FINLAND RF POWER AMPLIFIERS IN INDIUM MARKET, BY PURITY GRADE, 2018-2033 (USD THOUSAND)
TABLE 2031 FINLAND HIGH-FREQUENCY COMMUNICATION CHIPS IN INDIUM MARKET, BY PURITY GRADE, 2018-2033 (USD THOUSAND)
TABLE 2032 FINLAND FIBER-OPTIC COMMUNICATION LASERS IN INDIUM MARKET, BY PURITY GRADE, 2018-2033 (USD THOUSAND)
TABLE 2033 FINLAND PHOTODETECTORS FOR OPTICAL NETWORKS IN INDIUM MARKET, BY PURITY GRADE, 2018-2033 (USD THOUSAND)
TABLE 2034 FINLAND 5G INFRASTRUCTURE COMPONENTS IN INDIUM MARKET, BY PURITY GRADE, 2018-2033 (USD THOUSAND)
TABLE 2035 FINLAND OPTICAL NETWORK SWITCHING DEVICES IN INDIUM MARKET, BY PURITY GRADE, 2018-2033 (USD THOUSAND)
TABLE 2036 FINLAND SATELLITE COMMUNICATION MODULES IN INDIUM MARKET, BY PURITY GRADE, 2018-2033 (USD THOUSAND)
TABLE 2037 FINLAND OPTICAL & PHOTONICS INDUSTRY IN INDIUM MARKET, BY TYPE, 2018-2033 (USD THOUSAND)
TABLE 2038 FINLAND OPTICAL COATINGS IN INDIUM MARKET, BY PURITY GRADE, 2018-2033 (USD THOUSAND)
TABLE 2039 FINLAND FIBER OPTIC COMPONENTS IN INDIUM MARKET, BY PURITY GRADE, 2018-2033 (USD THOUSAND)
TABLE 2040 FINLAND LASER COMPONENTS IN INDIUM MARKET, BY PURITY GRADE, 2018-2033 (USD THOUSAND)
TABLE 2041 FINLAND OPTICAL SENSORS IN INDIUM MARKET, BY PURITY GRADE, 2018-2033 (USD THOUSAND)
TABLE 2042 FINLAND INFRARED OPTICS IN INDIUM MARKET, BY PURITY GRADE, 2018-2033 (USD THOUSAND)
TABLE 2043 FINLAND PICS IN INDIUM MARKET, BY PURITY GRADE, 2018-2033 (USD THOUSAND)
TABLE 2044 FINLAND MIRRORS IN INDIUM MARKET, BY PURITY GRADE, 2018-2033 (USD THOUSAND)
TABLE 2045 FINLAND SPECTROSCOPY IN INDIUM MARKET, BY PURITY GRADE, 2018-2033 (USD THOUSAND)
TABLE 2046 FINLAND AEROSPACE & DEFENSE INDUSTRY IN INDIUM MARKET, BY TYPE, 2018-2033 (USD THOUSAND)
TABLE 2047 FINLAND INFRARED IMAGING SYSTEMS IN INDIUM MARKET, BY PURITY GRADE, 2018-2033 (USD THOUSAND)
TABLE 2048 FINLAND RADAR & RF COMPONENTS IN INDIUM MARKET, BY PURITY GRADE, 2018-2033 (USD THOUSAND)
TABLE 2049 FINLAND SATELLITE COMMUNICATION IN INDIUM MARKET, BY PURITY GRADE, 2018-2033 (USD THOUSAND)
TABLE 2050 FINLAND MILITARY OPTOELECTRONICS IN INDIUM MARKET, BY PURITY GRADE, 2018-2033 (USD THOUSAND)
TABLE 2051 FINLAND AVIONICS DISPLAYS IN INDIUM MARKET, BY PURITY GRADE, 2018-2033 (USD THOUSAND)
TABLE 2052 FINLAND SPACECRAFT SOLAR PANELS IN INDIUM MARKET, BY PURITY GRADE, 2018-2033 (USD THOUSAND)
TABLE 2053 FINLAND THERMAL MATERIALS IN INDIUM MARKET, BY PURITY GRADE, 2018-2033 (USD THOUSAND)
TABLE 2054 FINLAND CRYOGENIC MATERIALS IN INDIUM MARKET, BY PURITY GRADE, 2018-2033 (USD THOUSAND)
TABLE 2055 FINLAND MEDICAL DEVICE INDUSTRY IN INDIUM MARKET, BY TYPE, 2018-2033 (USD THOUSAND)
TABLE 2056 FINLAND MEDICAL IMAGING SENSORS IN INDIUM MARKET, BY PURITY GRADE, 2018-2033 (USD THOUSAND)
TABLE 2057 FINLAND DIAGNOSTIC EQUIPMENT DISPLAYS IN INDIUM MARKET, BY PURITY GRADE, 2018-2033 (USD THOUSAND)
TABLE 2058 FINLAND ADVANCED DIAGNOSTIC INSTRUMENTS IN INDIUM MARKET, BY PURITY GRADE, 2018-2033 (USD THOUSAND)
TABLE 2059 FINLAND LASER SURGICAL EQUIPMENT IN INDIUM MARKET, BY PURITY GRADE, 2018-2033 (USD THOUSAND)
TABLE 2060 FINLAND BIOMEDICAL OPTICAL DEVICES IN INDIUM MARKET, BY PURITY GRADE, 2018-2033 (USD THOUSAND)
TABLE 2061 FINLAND RADIATION DETECTION EQUIPMENT IN INDIUM MARKET, BY PURITY GRADE, 2018-2033 (USD THOUSAND)
TABLE 2062 FINLAND INFRARED MEDICAL SENSORS IN INDIUM MARKET, BY PURITY GRADE, 2018-2033 (USD THOUSAND)
TABLE 2063 FINLAND PHOTOTHERAPY DEVICES IN INDIUM MARKET, BY PURITY GRADE, 2018-2033 (USD THOUSAND)
TABLE 2064 FINLAND INDUSTRIAL EQUIPMENT MANUFACTURING IN INDIUM MARKET, BY TYPE, 2018-2033 (USD THOUSAND)
TABLE 2065 FINLAND INDUSTRIAL SENSORS IN INDIUM MARKET, BY PURITY GRADE, 2018-2033 (USD THOUSAND)
TABLE 2066 FINLAND VACUUM DEPOSITION COATINGS IN INDIUM MARKET, BY PURITY GRADE, 2018-2033 (USD THOUSAND)
TABLE 2067 FINLAND PRECISION OPTICAL COMPONENTS IN INDIUM MARKET, BY PURITY GRADE, 2018-2033 (USD THOUSAND)
TABLE 2068 FINLAND THERMAL INTERFACE MATERIALS IN INDIUM MARKET, BY PURITY GRADE, 2018-2033 (USD THOUSAND)
TABLE 2069 FINLAND INDUSTRIAL LASER SYSTEMS IN INDIUM MARKET, BY PURITY GRADE, 2018-2033 (USD THOUSAND)
TABLE 2070 FINLAND INDUSTRIAL INFRARED DETECTORS IN INDIUM MARKET, BY PURITY GRADE, 2018-2033 (USD THOUSAND)
TABLE 2071 FINLAND PRECISION MEASUREMENT EQUIPMENT IN INDIUM MARKET, BY PURITY GRADE, 2018-2033 (USD THOUSAND)
TABLE 2072 FINLAND SPECIALTY ELECTRONIC COMPONENTS IN INDIUM MARKET, BY PURITY GRADE, 2018-2033 (USD THOUSAND)
TABLE 2073 FINLAND OTHERS IN INDIUM MARKET, BY TYPE, 2018-2033 (USD THOUSAND)
TABLE 2074 FINLAND ADVANCED MATERIALS MANUFACTURING IN INDIUM MARKET, BY PURITY GRADE, 2018-2033 (USD THOUSAND)
TABLE 2075 FINLAND SPECIALTY ALLOY PRODUCTION IN INDIUM MARKET, BY PURITY GRADE, 2018-2033 (USD THOUSAND)
TABLE 2076 FINLAND THERMAL MANAGEMENT MATERIALS IN INDIUM MARKET, BY PURITY GRADE, 2018-2033 (USD THOUSAND)
TABLE 2077 FINLAND PRECISION SCIENTIFIC INSTRUMENTS IN INDIUM MARKET, BY PURITY GRADE, 2018-2033 (USD THOUSAND)
TABLE 2078 FINLAND RESEARCH INSTITUTES & UNIVERSITIES IN INDIUM MARKET, BY PURITY GRADE, 2018-2033 (USD THOUSAND)
TABLE 2079 FINLAND NUCLEAR INDUSTRY APPLICATIONS IN INDIUM MARKET, BY PURITY GRADE, 2018-2033 (USD THOUSAND)
TABLE 2080 FINLAND SPECIALTY CHEMICAL PRODUCTION IN INDIUM MARKET, BY PURITY GRADE, 2018-2033 (USD THOUSAND)
TABLE 2081 FINLAND DEFENSE RESEARCH LABORATORIES IN INDIUM MARKET, BY PURITY GRADE, 2018-2033 (USD THOUSAND)
TABLE 2082 FINLAND CRYOGENIC EQUIPMENT MANUFACTURING IN INDIUM MARKET, BY PURITY GRADE, 2018-2033 (USD THOUSAND)
TABLE 2083 DENMARK INDIUM MARKET, BY PRODUCT TYPE, 2018-2033 (USD THOUSAND)
TABLE 2084 DENMARK INGOTS IN INDIUM MARKET, BY TYPE, 2018-2033 (USD THOUSAND)
TABLE 2085 DENMARK INDIUM MARKET, BY MATERIAL COMPOSITION, 2018-2033 (USD THOUSAND)
TABLE 2086 DENMARK INDIUM ALLOYS IN INDIUM MARKET, BY TYPE, 2018-2033 (USD THOUSAND)
TABLE 2087 DENMARK INDIUM COMPOUNDS IN INDIUM MARKET, BY TYPE, 2018-2033 (USD THOUSAND)
TABLE 2088 DENMARK INDIUM MARKET, BY PURITY GRADE, 2018-2033 (USD THOUSAND)
TABLE 2089 DENMARK INDIUM MARKET, BY EXTRACTION SOURCE, 2018-2033 (USD THOUSAND)
TABLE 2090 DENMARK PRIMARY PRODUCTION IN INDIUM MARKET, BY TYPE, 2018-2033 (USD THOUSAND)
TABLE 2091 DENMARK SECONDARY PRODUCTION IN INDIUM MARKET, BY TYPE, 2018-2033 (USD THOUSAND)
TABLE 2092 DENMARK INDIUM MARKET, BY DISTRIBUTION CHANNEL, 2018-2033 (USD THOUSAND)
TABLE 2093 DENMARK INDIUM MARKET, BY TECHNOLOGY PLATFORM, 2018-2033 (USD THOUSAND)
TABLE 2094 DENMARK INDIUM MARKET, BY END-USER INDUSTRY, 2018-2033 (USD THOUSAND)
TABLE 2095 DENMARK CONSUMER ELECTRONICS INDUSTRY IN INDIUM MARKET, BY TYPE, 2018-2033 (USD THOUSAND)
TABLE 2096 DENMARK FLAT PANEL DISPLAYS (LCD/OLED/LED) IN INDIUM MARKET, BY PURITY GRADE, 2018-2033 (USD THOUSAND)
TABLE 2097 DENMARK TRANSPARENT CONDUCTIVE COATINGS (ITO) IN INDIUM MARKET, BY PURITY GRADE, 2018-2033 (USD THOUSAND)
TABLE 2098 DENMARK TOUCHSCREEN DISPLAYS IN INDIUM MARKET, BY PURITY GRADE, 2018-2033 (USD THOUSAND)
TABLE 2099 DENMARK FLEXIBLE DISPLAYS & ELECTRONICS IN INDIUM MARKET, BY PURITY GRADE, 2018-2033 (USD THOUSAND)
TABLE 2100 DENMARK WEARABLE ELECTRONICS DEVICES IN INDIUM MARKET, BY PURITY GRADE, 2018-2033 (USD THOUSAND)
TABLE 2101 DENMARK CAMERA & OPTICAL SENSORS IN INDIUM MARKET, BY PURITY GRADE, 2018-2033 (USD THOUSAND)
TABLE 2102 DENMARK MINI-LED BACKLIGHTING IN INDIUM MARKET, BY PURITY GRADE, 2018-2033 (USD THOUSAND)
TABLE 2103 DENMARK MICRO-LED DISPLAYS IN INDIUM MARKET, BY PURITY GRADE, 2018-2033 (USD THOUSAND)
TABLE 2104 DENMARK DISPLAY PANEL INDUSTRY IN INDIUM MARKET, BY TYPE, 2018-2033 (USD THOUSAND)
TABLE 2105 DENMARK LCD PANEL MANUFACTURING IN INDIUM MARKET, BY PURITY GRADE, 2018-2033 (USD THOUSAND)
TABLE 2106 DENMARK OLED PANEL MANUFACTURING IN INDIUM MARKET, BY PURITY GRADE, 2018-2033 (USD THOUSAND)
TABLE 2107 DENMARK DISPLAY PANEL MANUFACTURING IN INDIUM MARKET, BY PURITY GRADE, 2018-2033 (USD THOUSAND)
TABLE 2108 DENMARK TOUCH PANEL SENSORS IN INDIUM MARKET, BY PURITY GRADE, 2018-2033 (USD THOUSAND)
TABLE 2109 DENMARK TRANSPARENT CONDUCTIVE FILMS IN INDIUM MARKET, BY PURITY GRADE, 2018-2033 (USD THOUSAND)
TABLE 2110 DENMARK FLEXIBLE & FOLDABLE DISPLAYS IN INDIUM MARKET, BY PURITY GRADE, 2018-2033 (USD THOUSAND)
TABLE 2111 DENMARK AR/VR DISPLAYS IN INDIUM MARKET, BY PURITY GRADE, 2018-2033 (USD THOUSAND)
TABLE 2112 DENMARK MICRODISPLAY DEVICES IN INDIUM MARKET, BY PURITY GRADE, 2018-2033 (USD THOUSAND)
TABLE 2113 DENMARK BACKPLANE COATINGS IN INDIUM MARKET, BY PURITY GRADE, 2018-2033 (USD THOUSAND)
TABLE 2114 DENMARK SEMICONDUCTOR INDUSTRY IN INDIUM MARKET, BY TYPE, 2018-2033 (USD THOUSAND)
TABLE 2115 DENMARK III-V COMPOUND SEMICONDUCTORS IN INDIUM MARKET, BY PURITY GRADE, 2018-2033 (USD THOUSAND)
TABLE 2116 DENMARK HIGH-FREQUENCY RF COMPONENTS IN INDIUM MARKET, BY PURITY GRADE, 2018-2033 (USD THOUSAND)
TABLE 2117 DENMARK SEMICONDUCTOR SUBSTRATES & EPITAXY IN INDIUM MARKET, BY PURITY GRADE, 2018-2033 (USD THOUSAND)
TABLE 2118 DENMARK LASER DIODES IN INDIUM MARKET, BY PURITY GRADE, 2018-2033 (USD THOUSAND)
TABLE 2119 DENMARK PHOTODETECTORS IN INDIUM MARKET, BY PURITY GRADE, 2018-2033 (USD THOUSAND)
TABLE 2120 DENMARK HIGH-SPEED OPTOELECTRONICS IN INDIUM MARKET, BY PURITY GRADE, 2018-2033 (USD THOUSAND)
TABLE 2121 DENMARK INFRARED DETECTORS IN INDIUM MARKET, BY PURITY GRADE, 2018-2033 (USD THOUSAND)
TABLE 2122 DENMARK INTEGRATED PHOTONIC CIRCUITS IN INDIUM MARKET, BY PURITY GRADE, 2018-2033 (USD THOUSAND)
TABLE 2123 DENMARK SOLAR PHOTOVOLTAIC INDUSTRY IN INDIUM MARKET, BY TYPE, 2018-2033 (USD THOUSAND)
TABLE 2124 DENMARK CIGS THIN-FILM SOLAR CELLS IN INDIUM MARKET, BY PURITY GRADE, 2018-2033 (USD THOUSAND)
TABLE 2125 DENMARKHIGH-EFFICIENCY MODULES IN INDIUM MARKET, BY PURITY GRADE, 2018-2033 (USD THOUSAND)
TABLE 2126 DENMARK THIN-FILM COATINGS IN INDIUM MARKET, BY PURITY GRADE, 2018-2033 (USD THOUSAND)
TABLE 2127 DENMARK TRANSPARENT ELECTRODES IN INDIUM MARKET, BY PURITY GRADE, 2018-2033 (USD THOUSAND)
TABLE 2128 DENMARK BIPV IN INDIUM MARKET, BY PURITY GRADE, 2018-2033 (USD THOUSAND)
TABLE 2129 DENMARK FLEXIBLE SOLAR PANELS IN INDIUM MARKET, BY PURITY GRADE, 2018-2033 (USD THOUSAND)
TABLE 2130 DENMARK PORTABLE SOLAR SYSTEMS IN INDIUM MARKET, BY PURITY GRADE, 2018-2033 (USD THOUSAND)
TABLE 2131 DENMARK CONCENTRATED PV IN INDIUM MARKET, BY PURITY GRADE, 2018-2033 (USD THOUSAND)
TABLE 2132 DENMARK AUTOMOTIVE INDUSTRY IN INDIUM MARKET, BY TYPE, 2018-2033 (USD THOUSAND)
TABLE 2133 DENMARK AUTOMOTIVE DISPLAY PANELS IN INDIUM MARKET, BY PURITY GRADE, 2018-2033 (USD THOUSAND)
TABLE 2134 DENMARKADAS SENSORS IN INDIUM MARKET, BY PURITY GRADE, 2018-2033 (USD THOUSAND)
TABLE 2135 DENMARK VEHICLE CAMERA MODULES IN INDIUM MARKET, BY PURITY GRADE, 2018-2033 (USD THOUSAND)
TABLE 2136 DENMARK AUTOMOTIVE OPTOELECTRONICS IN INDIUM MARKET, BY PURITY GRADE, 2018-2033 (USD THOUSAND)
TABLE 2137 DENMARK POWER ELECTRONICS IN INDIUM MARKET, BY PURITY GRADE, 2018-2033 (USD THOUSAND)
TABLE 2138 DENMARK TOUCHSCREEN INTERFACES IN INDIUM MARKET, BY PURITY GRADE, 2018-2033 (USD THOUSAND)
TABLE 2139 DENMARK INFRARED SENSORS IN INDIUM MARKET, BY PURITY GRADE, 2018-2033 (USD THOUSAND)
TABLE 2140 DENMARK SMART LIGHTING IN INDIUM MARKET, BY PURITY GRADE, 2018-2033 (USD THOUSAND)
TABLE 2141 DENMARK TELECOMMUNICATION EQUIPMENT INDUSTRY IN INDIUM MARKET, BY TYPE, 2018-2033 (USD THOUSAND)
TABLE 2142 DENMARK OPTICAL TRANSCEIVERS IN INDIUM MARKET, BY PURITY GRADE, 2018-2033 (USD THOUSAND)
TABLE 2143 DENMARK RF POWER AMPLIFIERS IN INDIUM MARKET, BY PURITY GRADE, 2018-2033 (USD THOUSAND)
TABLE 2144 DENMARK HIGH-FREQUENCY COMMUNICATION CHIPS IN INDIUM MARKET, BY PURITY GRADE, 2018-2033 (USD THOUSAND)
TABLE 2145 DENMARK FIBER-OPTIC COMMUNICATION LASERS IN INDIUM MARKET, BY PURITY GRADE, 2018-2033 (USD THOUSAND)
TABLE 2146 DENMARK PHOTODETECTORS FOR OPTICAL NETWORKS IN INDIUM MARKET, BY PURITY GRADE, 2018-2033 (USD THOUSAND)
TABLE 2147 DENMARK 5G INFRASTRUCTURE COMPONENTS IN INDIUM MARKET, BY PURITY GRADE, 2018-2033 (USD THOUSAND)
TABLE 2148 DENMARK OPTICAL NETWORK SWITCHING DEVICES IN INDIUM MARKET, BY PURITY GRADE, 2018-2033 (USD THOUSAND)
TABLE 2149 DENMARK SATELLITE COMMUNICATION MODULES IN INDIUM MARKET, BY PURITY GRADE, 2018-2033 (USD THOUSAND)
TABLE 2150 DENMARK OPTICAL & PHOTONICS INDUSTRY IN INDIUM MARKET, BY TYPE, 2018-2033 (USD THOUSAND)
TABLE 2151 DENMARK OPTICAL COATINGS IN INDIUM MARKET, BY PURITY GRADE, 2018-2033 (USD THOUSAND)
TABLE 2152 DENMARK FIBER OPTIC COMPONENTS IN INDIUM MARKET, BY PURITY GRADE, 2018-2033 (USD THOUSAND)
TABLE 2153 DENMARK LASER COMPONENTS IN INDIUM MARKET, BY PURITY GRADE, 2018-2033 (USD THOUSAND)
TABLE 2154 DENMARK OPTICAL SENSORS IN INDIUM MARKET, BY PURITY GRADE, 2018-2033 (USD THOUSAND)
TABLE 2155 DENMARK INFRARED OPTICS IN INDIUM MARKET, BY PURITY GRADE, 2018-2033 (USD THOUSAND)
TABLE 2156 DENMARK PICS IN INDIUM MARKET, BY PURITY GRADE, 2018-2033 (USD THOUSAND)
TABLE 2157 DENMARK MIRRORS IN INDIUM MARKET, BY PURITY GRADE, 2018-2033 (USD THOUSAND)
TABLE 2158 DENMARK SPECTROSCOPY IN INDIUM MARKET, BY PURITY GRADE, 2018-2033 (USD THOUSAND)
TABLE 2159 DENMARK AEROSPACE & DEFENSE INDUSTRY IN INDIUM MARKET, BY TYPE, 2018-2033 (USD THOUSAND)
TABLE 2160 DENMARK INFRARED IMAGING SYSTEMS IN INDIUM MARKET, BY PURITY GRADE, 2018-2033 (USD THOUSAND)
TABLE 2161 DENMARK RADAR & RF COMPONENTS IN INDIUM MARKET, BY PURITY GRADE, 2018-2033 (USD THOUSAND)
TABLE 2162 DENMARK SATELLITE COMMUNICATION IN INDIUM MARKET, BY PURITY GRADE, 2018-2033 (USD THOUSAND)
TABLE 2163 DENMARK MILITARY OPTOELECTRONICS IN INDIUM MARKET, BY PURITY GRADE, 2018-2033 (USD THOUSAND)
TABLE 2164 DENMARK AVIONICS DISPLAYS IN INDIUM MARKET, BY PURITY GRADE, 2018-2033 (USD THOUSAND)
TABLE 2165 DENMARK SPACECRAFT SOLAR PANELS IN INDIUM MARKET, BY PURITY GRADE, 2018-2033 (USD THOUSAND)
TABLE 2166 DENMARK THERMAL MATERIALS IN INDIUM MARKET, BY PURITY GRADE, 2018-2033 (USD THOUSAND)
TABLE 2167 DENMARK CRYOGENIC MATERIALS IN INDIUM MARKET, BY PURITY GRADE, 2018-2033 (USD THOUSAND)
TABLE 2168 DENMARK MEDICAL DEVICE INDUSTRY IN INDIUM MARKET, BY TYPE, 2018-2033 (USD THOUSAND)
TABLE 2169 DENMARK MEDICAL IMAGING SENSORS IN INDIUM MARKET, BY PURITY GRADE, 2018-2033 (USD THOUSAND)
TABLE 2170 DENMARK DIAGNOSTIC EQUIPMENT DISPLAYS IN INDIUM MARKET, BY PURITY GRADE, 2018-2033 (USD THOUSAND)
TABLE 2171 DENMARK ADVANCED DIAGNOSTIC INSTRUMENTS IN INDIUM MARKET, BY PURITY GRADE, 2018-2033 (USD THOUSAND)
TABLE 2172 DENMARK LASER SURGICAL EQUIPMENT IN INDIUM MARKET, BY PURITY GRADE, 2018-2033 (USD THOUSAND)
TABLE 2173 DENMARK BIOMEDICAL OPTICAL DEVICES IN INDIUM MARKET, BY PURITY GRADE, 2018-2033 (USD THOUSAND)
TABLE 2174 DENMARK RADIATION DETECTION EQUIPMENT IN INDIUM MARKET, BY PURITY GRADE, 2018-2033 (USD THOUSAND)
TABLE 2175 DENMARK INFRARED MEDICAL SENSORS IN INDIUM MARKET, BY PURITY GRADE, 2018-2033 (USD THOUSAND)
TABLE 2176 DENMARK PHOTOTHERAPY DEVICES IN INDIUM MARKET, BY PURITY GRADE, 2018-2033 (USD THOUSAND)
TABLE 2177 DENMARK INDUSTRIAL EQUIPMENT MANUFACTURING IN INDIUM MARKET, BY TYPE, 2018-2033 (USD THOUSAND)
TABLE 2178 DENMARK INDUSTRIAL SENSORS IN INDIUM MARKET, BY PURITY GRADE, 2018-2033 (USD THOUSAND)
TABLE 2179 DENMARK VACUUM DEPOSITION COATINGS IN INDIUM MARKET, BY PURITY GRADE, 2018-2033 (USD THOUSAND)
TABLE 2180 DENMARK PRECISION OPTICAL COMPONENTS IN INDIUM MARKET, BY PURITY GRADE, 2018-2033 (USD THOUSAND)
TABLE 2181 DENMARK THERMAL INTERFACE MATERIALS IN INDIUM MARKET, BY PURITY GRADE, 2018-2033 (USD THOUSAND)
TABLE 2182 DENMARK INDUSTRIAL LASER SYSTEMS IN INDIUM MARKET, BY PURITY GRADE, 2018-2033 (USD THOUSAND)
TABLE 2183 DENMARK INDUSTRIAL INFRARED DETECTORS IN INDIUM MARKET, BY PURITY GRADE, 2018-2033 (USD THOUSAND)
TABLE 2184 DENMARK PRECISION MEASUREMENT EQUIPMENT IN INDIUM MARKET, BY PURITY GRADE, 2018-2033 (USD THOUSAND)
TABLE 2185 DENMARK SPECIALTY ELECTRONIC COMPONENTS IN INDIUM MARKET, BY PURITY GRADE, 2018-2033 (USD THOUSAND)
TABLE 2186 DENMARK OTHERS IN INDIUM MARKET, BY TYPE, 2018-2033 (USD THOUSAND)
TABLE 2187 DENMARK ADVANCED MATERIALS MANUFACTURING IN INDIUM MARKET, BY PURITY GRADE, 2018-2033 (USD THOUSAND)
TABLE 2188 DENMARK SPECIALTY ALLOY PRODUCTION IN INDIUM MARKET, BY PURITY GRADE, 2018-2033 (USD THOUSAND)
TABLE 2189 DENMARK THERMAL MANAGEMENT MATERIALS IN INDIUM MARKET, BY PURITY GRADE, 2018-2033 (USD THOUSAND)
TABLE 2190 DENMARK PRECISION SCIENTIFIC INSTRUMENTS IN INDIUM MARKET, BY PURITY GRADE, 2018-2033 (USD THOUSAND)
TABLE 2191 DENMARK RESEARCH INSTITUTES & UNIVERSITIES IN INDIUM MARKET, BY PURITY GRADE, 2018-2033 (USD THOUSAND)
TABLE 2192 DENMARK NUCLEAR INDUSTRY APPLICATIONS IN INDIUM MARKET, BY PURITY GRADE, 2018-2033 (USD THOUSAND)
TABLE 2193 DENMARK SPECIALTY CHEMICAL PRODUCTION IN INDIUM MARKET, BY PURITY GRADE, 2018-2033 (USD THOUSAND)
TABLE 2194 DENMARK DEFENSE RESEARCH LABORATORIES IN INDIUM MARKET, BY PURITY GRADE, 2018-2033 (USD THOUSAND)
TABLE 2195 DENMARK CRYOGENIC EQUIPMENT MANUFACTURING IN INDIUM MARKET, BY PURITY GRADE, 2018-2033 (USD THOUSAND)
TABLE 2196 NORWAY INDIUM MARKET, BY PRODUCT TYPE, 2018-2033 (USD THOUSAND)
TABLE 2197 NORWAY INGOTS IN INDIUM MARKET, BY TYPE, 2018-2033 (USD THOUSAND)
TABLE 2198 NORWAY INDIUM MARKET, BY MATERIAL COMPOSITION, 2018-2033 (USD THOUSAND)
TABLE 2199 NORWAY INDIUM ALLOYS IN INDIUM MARKET, BY TYPE, 2018-2033 (USD THOUSAND)
TABLE 2200 NORWAY INDIUM COMPOUNDS IN INDIUM MARKET, BY TYPE, 2018-2033 (USD THOUSAND)
TABLE 2201 NORWAY INDIUM MARKET, BY PURITY GRADE, 2018-2033 (USD THOUSAND)
TABLE 2202 NORWAY INDIUM MARKET, BY EXTRACTION SOURCE, 2018-2033 (USD THOUSAND)
TABLE 2203 NORWAY PRIMARY PRODUCTION IN INDIUM MARKET, BY TYPE, 2018-2033 (USD THOUSAND)
TABLE 2204 NORWAY SECONDARY PRODUCTION IN INDIUM MARKET, BY TYPE, 2018-2033 (USD THOUSAND)
TABLE 2205 NORWAY INDIUM MARKET, BY DISTRIBUTION CHANNEL, 2018-2033 (USD THOUSAND)
TABLE 2206 NORWAY INDIUM MARKET, BY TECHNOLOGY PLATFORM, 2018-2033 (USD THOUSAND)
TABLE 2207 NORWAY INDIUM MARKET, BY END-USER INDUSTRY, 2018-2033 (USD THOUSAND)
TABLE 2208 NORWAY CONSUMER ELECTRONICS INDUSTRY IN INDIUM MARKET, BY TYPE, 2018-2033 (USD THOUSAND)
TABLE 2209 NORWAY FLAT PANEL DISPLAYS (LCD/OLED/LED) IN INDIUM MARKET, BY PURITY GRADE, 2018-2033 (USD THOUSAND)
TABLE 2210 NORWAY TRANSPARENT CONDUCTIVE COATINGS (ITO) IN INDIUM MARKET, BY PURITY GRADE, 2018-2033 (USD THOUSAND)
TABLE 2211 NORWAY TOUCHSCREEN DISPLAYS IN INDIUM MARKET, BY PURITY GRADE, 2018-2033 (USD THOUSAND)
TABLE 2212 NORWAY FLEXIBLE DISPLAYS & ELECTRONICS IN INDIUM MARKET, BY PURITY GRADE, 2018-2033 (USD THOUSAND)
TABLE 2213 NORWAY WEARABLE ELECTRONICS DEVICES IN INDIUM MARKET, BY PURITY GRADE, 2018-2033 (USD THOUSAND)
TABLE 2214 NORWAY CAMERA & OPTICAL SENSORS IN INDIUM MARKET, BY PURITY GRADE, 2018-2033 (USD THOUSAND)
TABLE 2215 NORWAY MINI-LED BACKLIGHTING IN INDIUM MARKET, BY PURITY GRADE, 2018-2033 (USD THOUSAND)
TABLE 2216 NORWAY MICRO-LED DISPLAYS IN INDIUM MARKET, BY PURITY GRADE, 2018-2033 (USD THOUSAND)
TABLE 2217 NORWAY DISPLAY PANEL INDUSTRY IN INDIUM MARKET, BY TYPE, 2018-2033 (USD THOUSAND)
TABLE 2218 NORWAY LCD PANEL MANUFACTURING IN INDIUM MARKET, BY PURITY GRADE, 2018-2033 (USD THOUSAND)
TABLE 2219 NORWAY OLED PANEL MANUFACTURING IN INDIUM MARKET, BY PURITY GRADE, 2018-2033 (USD THOUSAND)
TABLE 2220 NORWAY DISPLAY PANEL MANUFACTURING IN INDIUM MARKET, BY PURITY GRADE, 2018-2033 (USD THOUSAND)
TABLE 2221 NORWAY TOUCH PANEL SENSORS IN INDIUM MARKET, BY PURITY GRADE, 2018-2033 (USD THOUSAND)
TABLE 2222 NORWAY TRANSPARENT CONDUCTIVE FILMS IN INDIUM MARKET, BY PURITY GRADE, 2018-2033 (USD THOUSAND)
TABLE 2223 NORWAY FLEXIBLE & FOLDABLE DISPLAYS IN INDIUM MARKET, BY PURITY GRADE, 2018-2033 (USD THOUSAND)
TABLE 2224 NORWAY AR/VR DISPLAYS IN INDIUM MARKET, BY PURITY GRADE, 2018-2033 (USD THOUSAND)
TABLE 2225 NORWAY MICRODISPLAY DEVICES IN INDIUM MARKET, BY PURITY GRADE, 2018-2033 (USD THOUSAND)
TABLE 2226 NORWAY BACKPLANE COATINGS IN INDIUM MARKET, BY PURITY GRADE, 2018-2033 (USD THOUSAND)
TABLE 2227 NORWAY SEMICONDUCTOR INDUSTRY IN INDIUM MARKET, BY TYPE, 2018-2033 (USD THOUSAND)
TABLE 2228 NORWAY III-V COMPOUND SEMICONDUCTORS IN INDIUM MARKET, BY PURITY GRADE, 2018-2033 (USD THOUSAND)
TABLE 2229 NORWAY HIGH-FREQUENCY RF COMPONENTS IN INDIUM MARKET, BY PURITY GRADE, 2018-2033 (USD THOUSAND)
TABLE 2230 NORWAY SEMICONDUCTOR SUBSTRATES & EPITAXY IN INDIUM MARKET, BY PURITY GRADE, 2018-2033 (USD THOUSAND)
TABLE 2231 NORWAY LASER DIODES IN INDIUM MARKET, BY PURITY GRADE, 2018-2033 (USD THOUSAND)
TABLE 2232 NORWAY PHOTODETECTORS IN INDIUM MARKET, BY PURITY GRADE, 2018-2033 (USD THOUSAND)
TABLE 2233 NORWAY HIGH-SPEED OPTOELECTRONICS IN INDIUM MARKET, BY PURITY GRADE, 2018-2033 (USD THOUSAND)
TABLE 2234 NORWAY INFRARED DETECTORS IN INDIUM MARKET, BY PURITY GRADE, 2018-2033 (USD THOUSAND)
TABLE 2235 NORWAY INTEGRATED PHOTONIC CIRCUITS IN INDIUM MARKET, BY PURITY GRADE, 2018-2033 (USD THOUSAND)
TABLE 2236 NORWAY SOLAR PHOTOVOLTAIC INDUSTRY IN INDIUM MARKET, BY TYPE, 2018-2033 (USD THOUSAND)
TABLE 2237 NORWAY CIGS THIN-FILM SOLAR CELLS IN INDIUM MARKET, BY PURITY GRADE, 2018-2033 (USD THOUSAND)
TABLE 2238 NORWAYHIGH-EFFICIENCY MODULES IN INDIUM MARKET, BY PURITY GRADE, 2018-2033 (USD THOUSAND)
TABLE 2239 NORWAY THIN-FILM COATINGS IN INDIUM MARKET, BY PURITY GRADE, 2018-2033 (USD THOUSAND)
TABLE 2240 NORWAY TRANSPARENT ELECTRODES IN INDIUM MARKET, BY PURITY GRADE, 2018-2033 (USD THOUSAND)
TABLE 2241 NORWAY BIPV IN INDIUM MARKET, BY PURITY GRADE, 2018-2033 (USD THOUSAND)
TABLE 2242 NORWAY FLEXIBLE SOLAR PANELS IN INDIUM MARKET, BY PURITY GRADE, 2018-2033 (USD THOUSAND)
TABLE 2243 NORWAY PORTABLE SOLAR SYSTEMS IN INDIUM MARKET, BY PURITY GRADE, 2018-2033 (USD THOUSAND)
TABLE 2244 NORWAY CONCENTRATED PV IN INDIUM MARKET, BY PURITY GRADE, 2018-2033 (USD THOUSAND)
TABLE 2245 NORWAY AUTOMOTIVE INDUSTRY IN INDIUM MARKET, BY TYPE, 2018-2033 (USD THOUSAND)
TABLE 2246 NORWAY AUTOMOTIVE DISPLAY PANELS IN INDIUM MARKET, BY PURITY GRADE, 2018-2033 (USD THOUSAND)
TABLE 2247 NORWAYADAS SENSORS IN INDIUM MARKET, BY PURITY GRADE, 2018-2033 (USD THOUSAND)
TABLE 2248 NORWAY VEHICLE CAMERA MODULES IN INDIUM MARKET, BY PURITY GRADE, 2018-2033 (USD THOUSAND)
TABLE 2249 NORWAY AUTOMOTIVE OPTOELECTRONICS IN INDIUM MARKET, BY PURITY GRADE, 2018-2033 (USD THOUSAND)
TABLE 2250 NORWAY POWER ELECTRONICS IN INDIUM MARKET, BY PURITY GRADE, 2018-2033 (USD THOUSAND)
TABLE 2251 NORWAY TOUCHSCREEN INTERFACES IN INDIUM MARKET, BY PURITY GRADE, 2018-2033 (USD THOUSAND)
TABLE 2252 NORWAY INFRARED SENSORS IN INDIUM MARKET, BY PURITY GRADE, 2018-2033 (USD THOUSAND)
TABLE 2253 NORWAY SMART LIGHTING IN INDIUM MARKET, BY PURITY GRADE, 2018-2033 (USD THOUSAND)
TABLE 2254 NORWAY TELECOMMUNICATION EQUIPMENT INDUSTRY IN INDIUM MARKET, BY TYPE, 2018-2033 (USD THOUSAND)
TABLE 2255 NORWAY OPTICAL TRANSCEIVERS IN INDIUM MARKET, BY PURITY GRADE, 2018-2033 (USD THOUSAND)
TABLE 2256 NORWAY RF POWER AMPLIFIERS IN INDIUM MARKET, BY PURITY GRADE, 2018-2033 (USD THOUSAND)
TABLE 2257 NORWAY HIGH-FREQUENCY COMMUNICATION CHIPS IN INDIUM MARKET, BY PURITY GRADE, 2018-2033 (USD THOUSAND)
TABLE 2258 NORWAY FIBER-OPTIC COMMUNICATION LASERS IN INDIUM MARKET, BY PURITY GRADE, 2018-2033 (USD THOUSAND)
TABLE 2259 NORWAY PHOTODETECTORS FOR OPTICAL NETWORKS IN INDIUM MARKET, BY PURITY GRADE, 2018-2033 (USD THOUSAND)
TABLE 2260 NORWAY 5G INFRASTRUCTURE COMPONENTS IN INDIUM MARKET, BY PURITY GRADE, 2018-2033 (USD THOUSAND)
TABLE 2261 NORWAY OPTICAL NETWORK SWITCHING DEVICES IN INDIUM MARKET, BY PURITY GRADE, 2018-2033 (USD THOUSAND)
TABLE 2262 NORWAY SATELLITE COMMUNICATION MODULES IN INDIUM MARKET, BY PURITY GRADE, 2018-2033 (USD THOUSAND)
TABLE 2263 NORWAY OPTICAL & PHOTONICS INDUSTRY IN INDIUM MARKET, BY TYPE, 2018-2033 (USD THOUSAND)
TABLE 2264 NORWAY OPTICAL COATINGS IN INDIUM MARKET, BY PURITY GRADE, 2018-2033 (USD THOUSAND)
TABLE 2265 NORWAY FIBER OPTIC COMPONENTS IN INDIUM MARKET, BY PURITY GRADE, 2018-2033 (USD THOUSAND)
TABLE 2266 NORWAY LASER COMPONENTS IN INDIUM MARKET, BY PURITY GRADE, 2018-2033 (USD THOUSAND)
TABLE 2267 NORWAY OPTICAL SENSORS IN INDIUM MARKET, BY PURITY GRADE, 2018-2033 (USD THOUSAND)
TABLE 2268 NORWAY INFRARED OPTICS IN INDIUM MARKET, BY PURITY GRADE, 2018-2033 (USD THOUSAND)
TABLE 2269 NORWAY PICS IN INDIUM MARKET, BY PURITY GRADE, 2018-2033 (USD THOUSAND)
TABLE 2270 NORWAY MIRRORS IN INDIUM MARKET, BY PURITY GRADE, 2018-2033 (USD THOUSAND)
TABLE 2271 NORWAY SPECTROSCOPY IN INDIUM MARKET, BY PURITY GRADE, 2018-2033 (USD THOUSAND)
TABLE 2272 NORWAY AEROSPACE & DEFENSE INDUSTRY IN INDIUM MARKET, BY TYPE, 2018-2033 (USD THOUSAND)
TABLE 2273 NORWAY INFRARED IMAGING SYSTEMS IN INDIUM MARKET, BY PURITY GRADE, 2018-2033 (USD THOUSAND)
TABLE 2274 NORWAY RADAR & RF COMPONENTS IN INDIUM MARKET, BY PURITY GRADE, 2018-2033 (USD THOUSAND)
TABLE 2275 NORWAY SATELLITE COMMUNICATION IN INDIUM MARKET, BY PURITY GRADE, 2018-2033 (USD THOUSAND)
TABLE 2276 NORWAY MILITARY OPTOELECTRONICS IN INDIUM MARKET, BY PURITY GRADE, 2018-2033 (USD THOUSAND)
TABLE 2277 NORWAY AVIONICS DISPLAYS IN INDIUM MARKET, BY PURITY GRADE, 2018-2033 (USD THOUSAND)
TABLE 2278 NORWAY SPACECRAFT SOLAR PANELS IN INDIUM MARKET, BY PURITY GRADE, 2018-2033 (USD THOUSAND)
TABLE 2279 NORWAY THERMAL MATERIALS IN INDIUM MARKET, BY PURITY GRADE, 2018-2033 (USD THOUSAND)
TABLE 2280 NORWAY CRYOGENIC MATERIALS IN INDIUM MARKET, BY PURITY GRADE, 2018-2033 (USD THOUSAND)
TABLE 2281 NORWAY MEDICAL DEVICE INDUSTRY IN INDIUM MARKET, BY TYPE, 2018-2033 (USD THOUSAND)
TABLE 2282 NORWAY MEDICAL IMAGING SENSORS IN INDIUM MARKET, BY PURITY GRADE, 2018-2033 (USD THOUSAND)
TABLE 2283 NORWAY DIAGNOSTIC EQUIPMENT DISPLAYS IN INDIUM MARKET, BY PURITY GRADE, 2018-2033 (USD THOUSAND)
TABLE 2284 NORWAY ADVANCED DIAGNOSTIC INSTRUMENTS IN INDIUM MARKET, BY PURITY GRADE, 2018-2033 (USD THOUSAND)
TABLE 2285 NORWAY LASER SURGICAL EQUIPMENT IN INDIUM MARKET, BY PURITY GRADE, 2018-2033 (USD THOUSAND)
TABLE 2286 NORWAY BIOMEDICAL OPTICAL DEVICES IN INDIUM MARKET, BY PURITY GRADE, 2018-2033 (USD THOUSAND)
TABLE 2287 NORWAY RADIATION DETECTION EQUIPMENT IN INDIUM MARKET, BY PURITY GRADE, 2018-2033 (USD THOUSAND)
TABLE 2288 NORWAY INFRARED MEDICAL SENSORS IN INDIUM MARKET, BY PURITY GRADE, 2018-2033 (USD THOUSAND)
TABLE 2289 NORWAY PHOTOTHERAPY DEVICES IN INDIUM MARKET, BY PURITY GRADE, 2018-2033 (USD THOUSAND)
TABLE 2290 NORWAY INDUSTRIAL EQUIPMENT MANUFACTURING IN INDIUM MARKET, BY TYPE, 2018-2033 (USD THOUSAND)
TABLE 2291 NORWAY INDUSTRIAL SENSORS IN INDIUM MARKET, BY PURITY GRADE, 2018-2033 (USD THOUSAND)
TABLE 2292 NORWAY VACUUM DEPOSITION COATINGS IN INDIUM MARKET, BY PURITY GRADE, 2018-2033 (USD THOUSAND)
TABLE 2293 NORWAY PRECISION OPTICAL COMPONENTS IN INDIUM MARKET, BY PURITY GRADE, 2018-2033 (USD THOUSAND)
TABLE 2294 NORWAY THERMAL INTERFACE MATERIALS IN INDIUM MARKET, BY PURITY GRADE, 2018-2033 (USD THOUSAND)
TABLE 2295 NORWAY INDUSTRIAL LASER SYSTEMS IN INDIUM MARKET, BY PURITY GRADE, 2018-2033 (USD THOUSAND)
TABLE 2296 NORWAY INDUSTRIAL INFRARED DETECTORS IN INDIUM MARKET, BY PURITY GRADE, 2018-2033 (USD THOUSAND)
TABLE 2297 NORWAY PRECISION MEASUREMENT EQUIPMENT IN INDIUM MARKET, BY PURITY GRADE, 2018-2033 (USD THOUSAND)
TABLE 2298 NORWAY SPECIALTY ELECTRONIC COMPONENTS IN INDIUM MARKET, BY PURITY GRADE, 2018-2033 (USD THOUSAND)
TABLE 2299 NORWAY OTHERS IN INDIUM MARKET, BY TYPE, 2018-2033 (USD THOUSAND)
TABLE 2300 NORWAY ADVANCED MATERIALS MANUFACTURING IN INDIUM MARKET, BY PURITY GRADE, 2018-2033 (USD THOUSAND)
TABLE 2301 NORWAY SPECIALTY ALLOY PRODUCTION IN INDIUM MARKET, BY PURITY GRADE, 2018-2033 (USD THOUSAND)
TABLE 2302 NORWAY THERMAL MANAGEMENT MATERIALS IN INDIUM MARKET, BY PURITY GRADE, 2018-2033 (USD THOUSAND)
TABLE 2303 NORWAY PRECISION SCIENTIFIC INSTRUMENTS IN INDIUM MARKET, BY PURITY GRADE, 2018-2033 (USD THOUSAND)
TABLE 2304 NORWAY RESEARCH INSTITUTES & UNIVERSITIES IN INDIUM MARKET, BY PURITY GRADE, 2018-2033 (USD THOUSAND)
TABLE 2305 NORWAY NUCLEAR INDUSTRY APPLICATIONS IN INDIUM MARKET, BY PURITY GRADE, 2018-2033 (USD THOUSAND)
TABLE 2306 NORWAY SPECIALTY CHEMICAL PRODUCTION IN INDIUM MARKET, BY PURITY GRADE, 2018-2033 (USD THOUSAND)
TABLE 2307 NORWAY DEFENSE RESEARCH LABORATORIES IN INDIUM MARKET, BY PURITY GRADE, 2018-2033 (USD THOUSAND)
TABLE 2308 NORWAY CRYOGENIC EQUIPMENT MANUFACTURING IN INDIUM MARKET, BY PURITY GRADE, 2018-2033 (USD THOUSAND)
TABLE 2309 REST OF EUROPE INDIUM MARKET, BY PRODUCT TYPE, 2018-2033 (USD THOUSAND)
TABLE 2310 REST OF EUROPE INGOTS IN INDIUM MARKET, BY TYPE, 2018-2033 (USD THOUSAND)
TABLE 2311 REST OF EUROPE INDIUM MARKET, BY MATERIAL COMPOSITION, 2018-2033 (USD THOUSAND)
TABLE 2312 REST OF EUROPE INDIUM ALLOYS IN INDIUM MARKET, BY TYPE, 2018-2033 (USD THOUSAND)
TABLE 2313 REST OF EUROPE INDIUM COMPOUNDS IN INDIUM MARKET, BY TYPE, 2018-2033 (USD THOUSAND)
TABLE 2314 REST OF EUROPE INDIUM MARKET, BY PURITY GRADE, 2018-2033 (USD THOUSAND)
TABLE 2315 REST OF EUROPE INDIUM MARKET, BY EXTRACTION SOURCE, 2018-2033 (USD THOUSAND)
TABLE 2316 REST OF EUROPE PRIMARY PRODUCTION IN INDIUM MARKET, BY TYPE, 2018-2033 (USD THOUSAND)
TABLE 2317 REST OF EUROPE SECONDARY PRODUCTION IN INDIUM MARKET, BY TYPE, 2018-2033 (USD THOUSAND)
TABLE 2318 REST OF EUROPE INDIUM MARKET, BY DISTRIBUTION CHANNEL, 2018-2033 (USD THOUSAND)
TABLE 2319 REST OF EUROPE INDIUM MARKET, BY TECHNOLOGY PLATFORM, 2018-2033 (USD THOUSAND)
TABLE 2320 REST OF EUROPE INDIUM MARKET, BY END-USER INDUSTRY, 2018-2033 (USD THOUSAND)
TABLE 2321 REST OF EUROPE CONSUMER ELECTRONICS INDUSTRY IN INDIUM MARKET, BY TYPE, 2018-2033 (USD THOUSAND)
TABLE 2322 REST OF EUROPE FLAT PANEL DISPLAYS (LCD/OLED/LED) IN INDIUM MARKET, BY PURITY GRADE, 2018-2033 (USD THOUSAND)
TABLE 2323 REST OF EUROPE TRANSPARENT CONDUCTIVE COATINGS (ITO) IN INDIUM MARKET, BY PURITY GRADE, 2018-2033 (USD THOUSAND)
TABLE 2324 REST OF EUROPE TOUCHSCREEN DISPLAYS IN INDIUM MARKET, BY PURITY GRADE, 2018-2033 (USD THOUSAND)
TABLE 2325 REST OF EUROPE FLEXIBLE DISPLAYS & ELECTRONICS IN INDIUM MARKET, BY PURITY GRADE, 2018-2033 (USD THOUSAND)
TABLE 2326 REST OF EUROPE WEARABLE ELECTRONICS DEVICES IN INDIUM MARKET, BY PURITY GRADE, 2018-2033 (USD THOUSAND)
TABLE 2327 REST OF EUROPE CAMERA & OPTICAL SENSORS IN INDIUM MARKET, BY PURITY GRADE, 2018-2033 (USD THOUSAND)
TABLE 2328 REST OF EUROPE MINI-LED BACKLIGHTING IN INDIUM MARKET, BY PURITY GRADE, 2018-2033 (USD THOUSAND)
TABLE 2329 REST OF EUROPE MICRO-LED DISPLAYS IN INDIUM MARKET, BY PURITY GRADE, 2018-2033 (USD THOUSAND)
TABLE 2330 REST OF EUROPE DISPLAY PANEL INDUSTRY IN INDIUM MARKET, BY TYPE, 2018-2033 (USD THOUSAND)
TABLE 2331 REST OF EUROPE LCD PANEL MANUFACTURING IN INDIUM MARKET, BY PURITY GRADE, 2018-2033 (USD THOUSAND)
TABLE 2332 REST OF EUROPE OLED PANEL MANUFACTURING IN INDIUM MARKET, BY PURITY GRADE, 2018-2033 (USD THOUSAND)
TABLE 2333 REST OF EUROPE DISPLAY PANEL MANUFACTURING IN INDIUM MARKET, BY PURITY GRADE, 2018-2033 (USD THOUSAND)
TABLE 2334 REST OF EUROPE TOUCH PANEL SENSORS IN INDIUM MARKET, BY PURITY GRADE, 2018-2033 (USD THOUSAND)
TABLE 2335 REST OF EUROPE TRANSPARENT CONDUCTIVE FILMS IN INDIUM MARKET, BY PURITY GRADE, 2018-2033 (USD THOUSAND)
TABLE 2336 REST OF EUROPE FLEXIBLE & FOLDABLE DISPLAYS IN INDIUM MARKET, BY PURITY GRADE, 2018-2033 (USD THOUSAND)
TABLE 2337 REST OF EUROPE AR/VR DISPLAYS IN INDIUM MARKET, BY PURITY GRADE, 2018-2033 (USD THOUSAND)
TABLE 2338 REST OF EUROPE MICRODISPLAY DEVICES IN INDIUM MARKET, BY PURITY GRADE, 2018-2033 (USD THOUSAND)
TABLE 2339 REST OF EUROPE BACKPLANE COATINGS IN INDIUM MARKET, BY PURITY GRADE, 2018-2033 (USD THOUSAND)
TABLE 2340 REST OF EUROPE SEMICONDUCTOR INDUSTRY IN INDIUM MARKET, BY TYPE, 2018-2033 (USD THOUSAND)
TABLE 2341 REST OF EUROPE III-V COMPOUND SEMICONDUCTORS IN INDIUM MARKET, BY PURITY GRADE, 2018-2033 (USD THOUSAND)
TABLE 2342 REST OF EUROPE HIGH-FREQUENCY RF COMPONENTS IN INDIUM MARKET, BY PURITY GRADE, 2018-2033 (USD THOUSAND)
TABLE 2343 REST OF EUROPE SEMICONDUCTOR SUBSTRATES & EPITAXY IN INDIUM MARKET, BY PURITY GRADE, 2018-2033 (USD THOUSAND)
TABLE 2344 REST OF EUROPE LASER DIODES IN INDIUM MARKET, BY PURITY GRADE, 2018-2033 (USD THOUSAND)
TABLE 2345 REST OF EUROPE PHOTODETECTORS IN INDIUM MARKET, BY PURITY GRADE, 2018-2033 (USD THOUSAND)
TABLE 2346 REST OF EUROPE HIGH-SPEED OPTOELECTRONICS IN INDIUM MARKET, BY PURITY GRADE, 2018-2033 (USD THOUSAND)
TABLE 2347 REST OF EUROPE INFRARED DETECTORS IN INDIUM MARKET, BY PURITY GRADE, 2018-2033 (USD THOUSAND)
TABLE 2348 REST OF EUROPE INTEGRATED PHOTONIC CIRCUITS IN INDIUM MARKET, BY PURITY GRADE, 2018-2033 (USD THOUSAND)
TABLE 2349 REST OF EUROPE SOLAR PHOTOVOLTAIC INDUSTRY IN INDIUM MARKET, BY TYPE, 2018-2033 (USD THOUSAND)
TABLE 2350 REST OF EUROPE CIGS THIN-FILM SOLAR CELLS IN INDIUM MARKET, BY PURITY GRADE, 2018-2033 (USD THOUSAND)
TABLE 2351 REST OF EUROPEHIGH-EFFICIENCY MODULES IN INDIUM MARKET, BY PURITY GRADE, 2018-2033 (USD THOUSAND)
TABLE 2352 REST OF EUROPE THIN-FILM COATINGS IN INDIUM MARKET, BY PURITY GRADE, 2018-2033 (USD THOUSAND)
TABLE 2353 REST OF EUROPE TRANSPARENT ELECTRODES IN INDIUM MARKET, BY PURITY GRADE, 2018-2033 (USD THOUSAND)
TABLE 2354 REST OF EUROPE BIPV IN INDIUM MARKET, BY PURITY GRADE, 2018-2033 (USD THOUSAND)
TABLE 2355 REST OF EUROPE FLEXIBLE SOLAR PANELS IN INDIUM MARKET, BY PURITY GRADE, 2018-2033 (USD THOUSAND)
TABLE 2356 REST OF EUROPE PORTABLE SOLAR SYSTEMS IN INDIUM MARKET, BY PURITY GRADE, 2018-2033 (USD THOUSAND)
TABLE 2357 REST OF EUROPE CONCENTRATED PV IN INDIUM MARKET, BY PURITY GRADE, 2018-2033 (USD THOUSAND)
TABLE 2358 REST OF EUROPE AUTOMOTIVE INDUSTRY IN INDIUM MARKET, BY TYPE, 2018-2033 (USD THOUSAND)
TABLE 2359 REST OF EUROPE AUTOMOTIVE DISPLAY PANELS IN INDIUM MARKET, BY PURITY GRADE, 2018-2033 (USD THOUSAND)
TABLE 2360 REST OF EUROPEADAS SENSORS IN INDIUM MARKET, BY PURITY GRADE, 2018-2033 (USD THOUSAND)
TABLE 2361 REST OF EUROPE VEHICLE CAMERA MODULES IN INDIUM MARKET, BY PURITY GRADE, 2018-2033 (USD THOUSAND)
TABLE 2362 REST OF EUROPE AUTOMOTIVE OPTOELECTRONICS IN INDIUM MARKET, BY PURITY GRADE, 2018-2033 (USD THOUSAND)
TABLE 2363 REST OF EUROPE POWER ELECTRONICS IN INDIUM MARKET, BY PURITY GRADE, 2018-2033 (USD THOUSAND)
TABLE 2364 REST OF EUROPE TOUCHSCREEN INTERFACES IN INDIUM MARKET, BY PURITY GRADE, 2018-2033 (USD THOUSAND)
TABLE 2365 REST OF EUROPE INFRARED SENSORS IN INDIUM MARKET, BY PURITY GRADE, 2018-2033 (USD THOUSAND)
TABLE 2366 REST OF EUROPE SMART LIGHTING IN INDIUM MARKET, BY PURITY GRADE, 2018-2033 (USD THOUSAND)
TABLE 2367 REST OF EUROPE TELECOMMUNICATION EQUIPMENT INDUSTRY IN INDIUM MARKET, BY TYPE, 2018-2033 (USD THOUSAND)
TABLE 2368 REST OF EUROPE OPTICAL TRANSCEIVERS IN INDIUM MARKET, BY PURITY GRADE, 2018-2033 (USD THOUSAND)
TABLE 2369 REST OF EUROPE RF POWER AMPLIFIERS IN INDIUM MARKET, BY PURITY GRADE, 2018-2033 (USD THOUSAND)
TABLE 2370 REST OF EUROPE HIGH-FREQUENCY COMMUNICATION CHIPS IN INDIUM MARKET, BY PURITY GRADE, 2018-2033 (USD THOUSAND)
TABLE 2371 REST OF EUROPE FIBER-OPTIC COMMUNICATION LASERS IN INDIUM MARKET, BY PURITY GRADE, 2018-2033 (USD THOUSAND)
TABLE 2372 REST OF EUROPE PHOTODETECTORS FOR OPTICAL NETWORKS IN INDIUM MARKET, BY PURITY GRADE, 2018-2033 (USD THOUSAND)
TABLE 2373 REST OF EUROPE 5G INFRASTRUCTURE COMPONENTS IN INDIUM MARKET, BY PURITY GRADE, 2018-2033 (USD THOUSAND)
TABLE 2374 REST OF EUROPE OPTICAL NETWORK SWITCHING DEVICES IN INDIUM MARKET, BY PURITY GRADE, 2018-2033 (USD THOUSAND)
TABLE 2375 REST OF EUROPE SATELLITE COMMUNICATION MODULES IN INDIUM MARKET, BY PURITY GRADE, 2018-2033 (USD THOUSAND)
TABLE 2376 REST OF EUROPE OPTICAL & PHOTONICS INDUSTRY IN INDIUM MARKET, BY TYPE, 2018-2033 (USD THOUSAND)
TABLE 2377 REST OF EUROPE OPTICAL COATINGS IN INDIUM MARKET, BY PURITY GRADE, 2018-2033 (USD THOUSAND)
TABLE 2378 REST OF EUROPE FIBER OPTIC COMPONENTS IN INDIUM MARKET, BY PURITY GRADE, 2018-2033 (USD THOUSAND)
TABLE 2379 REST OF EUROPE LASER COMPONENTS IN INDIUM MARKET, BY PURITY GRADE, 2018-2033 (USD THOUSAND)
TABLE 2380 REST OF EUROPE OPTICAL SENSORS IN INDIUM MARKET, BY PURITY GRADE, 2018-2033 (USD THOUSAND)
TABLE 2381 REST OF EUROPE INFRARED OPTICS IN INDIUM MARKET, BY PURITY GRADE, 2018-2033 (USD THOUSAND)
TABLE 2382 REST OF EUROPE PICS IN INDIUM MARKET, BY PURITY GRADE, 2018-2033 (USD THOUSAND)
TABLE 2383 REST OF EUROPE MIRRORS IN INDIUM MARKET, BY PURITY GRADE, 2018-2033 (USD THOUSAND)
TABLE 2384 REST OF EUROPE SPECTROSCOPY IN INDIUM MARKET, BY PURITY GRADE, 2018-2033 (USD THOUSAND)
TABLE 2385 REST OF EUROPE AEROSPACE & DEFENSE INDUSTRY IN INDIUM MARKET, BY TYPE, 2018-2033 (USD THOUSAND)
TABLE 2386 REST OF EUROPE INFRARED IMAGING SYSTEMS IN INDIUM MARKET, BY PURITY GRADE, 2018-2033 (USD THOUSAND)
TABLE 2387 REST OF EUROPE RADAR & RF COMPONENTS IN INDIUM MARKET, BY PURITY GRADE, 2018-2033 (USD THOUSAND)
TABLE 2388 REST OF EUROPE SATELLITE COMMUNICATION IN INDIUM MARKET, BY PURITY GRADE, 2018-2033 (USD THOUSAND)
TABLE 2389 REST OF EUROPE MILITARY OPTOELECTRONICS IN INDIUM MARKET, BY PURITY GRADE, 2018-2033 (USD THOUSAND)
TABLE 2390 REST OF EUROPE AVIONICS DISPLAYS IN INDIUM MARKET, BY PURITY GRADE, 2018-2033 (USD THOUSAND)
TABLE 2391 REST OF EUROPE SPACECRAFT SOLAR PANELS IN INDIUM MARKET, BY PURITY GRADE, 2018-2033 (USD THOUSAND)
TABLE 2392 REST OF EUROPE THERMAL MATERIALS IN INDIUM MARKET, BY PURITY GRADE, 2018-2033 (USD THOUSAND)
TABLE 2393 REST OF EUROPE CRYOGENIC MATERIALS IN INDIUM MARKET, BY PURITY GRADE, 2018-2033 (USD THOUSAND)
TABLE 2394 REST OF EUROPE MEDICAL DEVICE INDUSTRY IN INDIUM MARKET, BY TYPE, 2018-2033 (USD THOUSAND)
TABLE 2395 REST OF EUROPE MEDICAL IMAGING SENSORS IN INDIUM MARKET, BY PURITY GRADE, 2018-2033 (USD THOUSAND)
TABLE 2396 REST OF EUROPE DIAGNOSTIC EQUIPMENT DISPLAYS IN INDIUM MARKET, BY PURITY GRADE, 2018-2033 (USD THOUSAND)
TABLE 2397 REST OF EUROPE ADVANCED DIAGNOSTIC INSTRUMENTS IN INDIUM MARKET, BY PURITY GRADE, 2018-2033 (USD THOUSAND)
TABLE 2398 REST OF EUROPE LASER SURGICAL EQUIPMENT IN INDIUM MARKET, BY PURITY GRADE, 2018-2033 (USD THOUSAND)
TABLE 2399 REST OF EUROPE BIOMEDICAL OPTICAL DEVICES IN INDIUM MARKET, BY PURITY GRADE, 2018-2033 (USD THOUSAND)
TABLE 2400 REST OF EUROPE RADIATION DETECTION EQUIPMENT IN INDIUM MARKET, BY PURITY GRADE, 2018-2033 (USD THOUSAND)
TABLE 2401 REST OF EUROPE INFRARED MEDICAL SENSORS IN INDIUM MARKET, BY PURITY GRADE, 2018-2033 (USD THOUSAND)
TABLE 2402 REST OF EUROPE PHOTOTHERAPY DEVICES IN INDIUM MARKET, BY PURITY GRADE, 2018-2033 (USD THOUSAND)
TABLE 2403 REST OF EUROPE INDUSTRIAL EQUIPMENT MANUFACTURING IN INDIUM MARKET, BY TYPE, 2018-2033 (USD THOUSAND)
TABLE 2404 REST OF EUROPE INDUSTRIAL SENSORS IN INDIUM MARKET, BY PURITY GRADE, 2018-2033 (USD THOUSAND)
TABLE 2405 REST OF EUROPE VACUUM DEPOSITION COATINGS IN INDIUM MARKET, BY PURITY GRADE, 2018-2033 (USD THOUSAND)
TABLE 2406 REST OF EUROPE PRECISION OPTICAL COMPONENTS IN INDIUM MARKET, BY PURITY GRADE, 2018-2033 (USD THOUSAND)
TABLE 2407 REST OF EUROPE THERMAL INTERFACE MATERIALS IN INDIUM MARKET, BY PURITY GRADE, 2018-2033 (USD THOUSAND)
TABLE 2408 REST OF EUROPE INDUSTRIAL LASER SYSTEMS IN INDIUM MARKET, BY PURITY GRADE, 2018-2033 (USD THOUSAND)
TABLE 2409 REST OF EUROPE INDUSTRIAL INFRARED DETECTORS IN INDIUM MARKET, BY PURITY GRADE, 2018-2033 (USD THOUSAND)
TABLE 2410 REST OF EUROPE PRECISION MEASUREMENT EQUIPMENT IN INDIUM MARKET, BY PURITY GRADE, 2018-2033 (USD THOUSAND)
TABLE 2411 REST OF EUROPE SPECIALTY ELECTRONIC COMPONENTS IN INDIUM MARKET, BY PURITY GRADE, 2018-2033 (USD THOUSAND)
TABLE 2412 REST OF EUROPE OTHERS IN INDIUM MARKET, BY TYPE, 2018-2033 (USD THOUSAND)
TABLE 2413 REST OF EUROPE ADVANCED MATERIALS MANUFACTURING IN INDIUM MARKET, BY PURITY GRADE, 2018-2033 (USD THOUSAND)
TABLE 2414 REST OF EUROPE SPECIALTY ALLOY PRODUCTION IN INDIUM MARKET, BY PURITY GRADE, 2018-2033 (USD THOUSAND)
TABLE 2415 REST OF EUROPE THERMAL MANAGEMENT MATERIALS IN INDIUM MARKET, BY PURITY GRADE, 2018-2033 (USD THOUSAND)
TABLE 2416 REST OF EUROPE PRECISION SCIENTIFIC INSTRUMENTS IN INDIUM MARKET, BY PURITY GRADE, 2018-2033 (USD THOUSAND)
TABLE 2417 REST OF EUROPE RESEARCH INSTITUTES & UNIVERSITIES IN INDIUM MARKET, BY PURITY GRADE, 2018-2033 (USD THOUSAND)
TABLE 2418 REST OF EUROPE NUCLEAR INDUSTRY APPLICATIONS IN INDIUM MARKET, BY PURITY GRADE, 2018-2033 (USD THOUSAND)
TABLE 2419 REST OF EUROPE SPECIALTY CHEMICAL PRODUCTION IN INDIUM MARKET, BY PURITY GRADE, 2018-2033 (USD THOUSAND)
TABLE 2420 REST OF EUROPE DEFENSE RESEARCH LABORATORIES IN INDIUM MARKET, BY PURITY GRADE, 2018-2033 (USD THOUSAND)
TABLE 2421 REST OF EUROPE CRYOGENIC EQUIPMENT MANUFACTURING IN INDIUM MARKET, BY PURITY GRADE, 2018-2033 (USD THOUSAND)
TABLE 2422 ASIA-PACIFIC INDIUM MARKET, BY COUNTRY, 2018-2033 (USD THOUSAND)
TABLE 2423 ASIA-PACIFIC INDIUM MARKET, BY PRODUCT TYPE, 2018-2033 (USD THOUSAND)
TABLE 2424 ASIA-PACIFIC INGOTS IN INDIUM MARKET, BY TYPE, 2018-2033 (USD THOUSAND)
TABLE 2425 ASIA-PACIFIC INDIUM MARKET, BY MATERIAL COMPOSITION, 2018-2033 (USD THOUSAND)
TABLE 2426 ASIA-PACIFIC INDIUM ALLOYS IN INDIUM MARKET, BY TYPE, 2018-2033 (USD THOUSAND)
TABLE 2427 ASIA-PACIFIC INDIUM COMPOUNDS IN INDIUM MARKET, BY TYPE, 2018-2033 (USD THOUSAND)
TABLE 2428 ASIA-PACIFIC INDIUM MARKET, BY PURITY GRADE, 2018-2033 (USD THOUSAND)
TABLE 2429 ASIA-PACIFIC INDIUM MARKET, BY EXTRACTION SOURCE, 2018-2033 (USD THOUSAND)
TABLE 2430 ASIA-PACIFIC PRIMARY PRODUCTION IN INDIUM MARKET, BY TYPE, 2018-2033 (USD THOUSAND)
TABLE 2431 ASIA-PACIFIC SECONDARY PRODUCTION IN INDIUM MARKET, BY TYPE, 2018-2033 (USD THOUSAND)
TABLE 2432 ASIA-PACIFIC INDIUM MARKET, BY DISTRIBUTION CHANNEL, 2018-2033 (USD THOUSAND)
TABLE 2433 ASIA-PACIFIC INDIUM MARKET, BY TECHNOLOGY PLATFORM, 2018-2033 (USD THOUSAND)
TABLE 2434 ASIA-PACIFIC INDIUM MARKET, BY END-USER INDUSTRY, 2018-2033 (USD THOUSAND)
TABLE 2435 ASIA-PACIFIC CONSUMER ELECTRONICS INDUSTRY IN INDIUM MARKET, BY TYPE, 2018-2033 (USD THOUSAND)
TABLE 2436 ASIA-PACIFIC FLAT PANEL DISPLAYS (LCD/OLED/LED) IN INDIUM MARKET, BY PURITY GRADE, 2018-2033 (USD THOUSAND)
TABLE 2437 ASIA-PACIFIC TRANSPARENT CONDUCTIVE COATINGS (ITO) IN INDIUM MARKET, BY PURITY GRADE, 2018-2033 (USD THOUSAND)
TABLE 2438 ASIA-PACIFIC TOUCHSCREEN DISPLAYS IN INDIUM MARKET, BY PURITY GRADE, 2018-2033 (USD THOUSAND)
TABLE 2439 ASIA-PACIFIC FLEXIBLE DISPLAYS & ELECTRONICS IN INDIUM MARKET, BY PURITY GRADE, 2018-2033 (USD THOUSAND)
TABLE 2440 ASIA-PACIFIC WEARABLE ELECTRONICS DEVICES IN INDIUM MARKET, BY PURITY GRADE, 2018-2033 (USD THOUSAND)
TABLE 2441 ASIA-PACIFIC CAMERA & OPTICAL SENSORS IN INDIUM MARKET, BY PURITY GRADE, 2018-2033 (USD THOUSAND)
TABLE 2442 ASIA-PACIFIC MINI-LED BACKLIGHTING IN INDIUM MARKET, BY PURITY GRADE, 2018-2033 (USD THOUSAND)
TABLE 2443 ASIA-PACIFIC MICRO-LED DISPLAYS IN INDIUM MARKET, BY PURITY GRADE, 2018-2033 (USD THOUSAND)
TABLE 2444 ASIA-PACIFIC DISPLAY PANEL INDUSTRY IN INDIUM MARKET, BY TYPE, 2018-2033 (USD THOUSAND)
TABLE 2445 ASIA-PACIFIC LCD PANEL MANUFACTURING IN INDIUM MARKET, BY PURITY GRADE, 2018-2033 (USD THOUSAND)
TABLE 2446 ASIA-PACIFIC OLED PANEL MANUFACTURING IN INDIUM MARKET, BY PURITY GRADE, 2018-2033 (USD THOUSAND)
TABLE 2447 ASIA-PACIFIC DISPLAY PANEL MANUFACTURING IN INDIUM MARKET, BY PURITY GRADE, 2018-2033 (USD THOUSAND)
TABLE 2448 ASIA-PACIFIC TOUCH PANEL SENSORS IN INDIUM MARKET, BY PURITY GRADE, 2018-2033 (USD THOUSAND)
TABLE 2449 ASIA-PACIFIC TRANSPARENT CONDUCTIVE FILMS IN INDIUM MARKET, BY PURITY GRADE, 2018-2033 (USD THOUSAND)
TABLE 2450 ASIA-PACIFIC FLEXIBLE & FOLDABLE DISPLAYS IN INDIUM MARKET, BY PURITY GRADE, 2018-2033 (USD THOUSAND)
TABLE 2451 ASIA-PACIFIC AR/VR DISPLAYS IN INDIUM MARKET, BY PURITY GRADE, 2018-2033 (USD THOUSAND)
TABLE 2452 ASIA-PACIFIC MICRODISPLAY DEVICES IN INDIUM MARKET, BY PURITY GRADE, 2018-2033 (USD THOUSAND)
TABLE 2453 ASIA-PACIFIC BACKPLANE COATINGS IN INDIUM MARKET, BY PURITY GRADE, 2018-2033 (USD THOUSAND)
TABLE 2454 ASIA-PACIFIC SEMICONDUCTOR INDUSTRY IN INDIUM MARKET, BY TYPE, 2018-2033 (USD THOUSAND)
TABLE 2455 ASIA-PACIFIC III-V COMPOUND SEMICONDUCTORS IN INDIUM MARKET, BY PURITY GRADE, 2018-2033 (USD THOUSAND)
TABLE 2456 ASIA-PACIFIC HIGH-FREQUENCY RF COMPONENTS IN INDIUM MARKET, BY PURITY GRADE, 2018-2033 (USD THOUSAND)
TABLE 2457 ASIA-PACIFIC SEMICONDUCTOR SUBSTRATES & EPITAXY IN INDIUM MARKET, BY PURITY GRADE, 2018-2033 (USD THOUSAND)
TABLE 2458 ASIA-PACIFIC LASER DIODES IN INDIUM MARKET, BY PURITY GRADE, 2018-2033 (USD THOUSAND)
TABLE 2459 ASIA-PACIFIC PHOTODETECTORS IN INDIUM MARKET, BY PURITY GRADE, 2018-2033 (USD THOUSAND)
TABLE 2460 ASIA-PACIFIC HIGH-SPEED OPTOELECTRONICS IN INDIUM MARKET, BY PURITY GRADE, 2018-2033 (USD THOUSAND)
TABLE 2461 ASIA-PACIFIC INFRARED DETECTORS IN INDIUM MARKET, BY PURITY GRADE, 2018-2033 (USD THOUSAND)
TABLE 2462 ASIA-PACIFIC INTEGRATED PHOTONIC CIRCUITS IN INDIUM MARKET, BY PURITY GRADE, 2018-2033 (USD THOUSAND)
TABLE 2463 ASIA-PACIFIC SOLAR PHOTOVOLTAIC INDUSTRY IN INDIUM MARKET, BY TYPE, 2018-2033 (USD THOUSAND)
TABLE 2464 ASIA-PACIFIC CIGS THIN-FILM SOLAR CELLS IN INDIUM MARKET, BY PURITY GRADE, 2018-2033 (USD THOUSAND)
TABLE 2465 ASIA-PACIFICHIGH-EFFICIENCY MODULES IN INDIUM MARKET, BY PURITY GRADE, 2018-2033 (USD THOUSAND)
TABLE 2466 ASIA-PACIFIC THIN-FILM COATINGS IN INDIUM MARKET, BY PURITY GRADE, 2018-2033 (USD THOUSAND)
TABLE 2467 ASIA-PACIFIC TRANSPARENT ELECTRODES IN INDIUM MARKET, BY PURITY GRADE, 2018-2033 (USD THOUSAND)
TABLE 2468 ASIA-PACIFIC BIPV IN INDIUM MARKET, BY PURITY GRADE, 2018-2033 (USD THOUSAND)
TABLE 2469 ASIA-PACIFIC FLEXIBLE SOLAR PANELS IN INDIUM MARKET, BY PURITY GRADE, 2018-2033 (USD THOUSAND)
TABLE 2470 ASIA-PACIFIC PORTABLE SOLAR SYSTEMS IN INDIUM MARKET, BY PURITY GRADE, 2018-2033 (USD THOUSAND)
TABLE 2471 ASIA-PACIFIC CONCENTRATED PV IN INDIUM MARKET, BY PURITY GRADE, 2018-2033 (USD THOUSAND)
TABLE 2472 ASIA-PACIFIC AUTOMOTIVE INDUSTRY IN INDIUM MARKET, BY TYPE, 2018-2033 (USD THOUSAND)
TABLE 2473 ASIA-PACIFIC AUTOMOTIVE DISPLAY PANELS IN INDIUM MARKET, BY PURITY GRADE, 2018-2033 (USD THOUSAND)
TABLE 2474 ASIA-PACIFICADAS SENSORS IN INDIUM MARKET, BY PURITY GRADE, 2018-2033 (USD THOUSAND)
TABLE 2475 ASIA-PACIFIC VEHICLE CAMERA MODULES IN INDIUM MARKET, BY PURITY GRADE, 2018-2033 (USD THOUSAND)
TABLE 2476 ASIA-PACIFIC AUTOMOTIVE OPTOELECTRONICS IN INDIUM MARKET, BY PURITY GRADE, 2018-2033 (USD THOUSAND)
TABLE 2477 ASIA-PACIFIC POWER ELECTRONICS IN INDIUM MARKET, BY PURITY GRADE, 2018-2033 (USD THOUSAND)
TABLE 2478 ASIA-PACIFIC TOUCHSCREEN INTERFACES IN INDIUM MARKET, BY PURITY GRADE, 2018-2033 (USD THOUSAND)
TABLE 2479 ASIA-PACIFIC INFRARED SENSORS IN INDIUM MARKET, BY PURITY GRADE, 2018-2033 (USD THOUSAND)
TABLE 2480 ASIA-PACIFIC SMART LIGHTING IN INDIUM MARKET, BY PURITY GRADE, 2018-2033 (USD THOUSAND)
TABLE 2481 ASIA-PACIFIC TELECOMMUNICATION EQUIPMENT INDUSTRY IN INDIUM MARKET, BY TYPE, 2018-2033 (USD THOUSAND)
TABLE 2482 ASIA-PACIFIC OPTICAL TRANSCEIVERS IN INDIUM MARKET, BY PURITY GRADE, 2018-2033 (USD THOUSAND)
TABLE 2483 ASIA-PACIFIC RF POWER AMPLIFIERS IN INDIUM MARKET, BY PURITY GRADE, 2018-2033 (USD THOUSAND)
TABLE 2484 ASIA-PACIFIC HIGH-FREQUENCY COMMUNICATION CHIPS IN INDIUM MARKET, BY PURITY GRADE, 2018-2033 (USD THOUSAND)
TABLE 2485 ASIA-PACIFIC FIBER-OPTIC COMMUNICATION LASERS IN INDIUM MARKET, BY PURITY GRADE, 2018-2033 (USD THOUSAND)
TABLE 2486 ASIA-PACIFIC PHOTODETECTORS FOR OPTICAL NETWORKS IN INDIUM MARKET, BY PURITY GRADE, 2018-2033 (USD THOUSAND)
TABLE 2487 ASIA-PACIFIC 5G INFRASTRUCTURE COMPONENTS IN INDIUM MARKET, BY PURITY GRADE, 2018-2033 (USD THOUSAND)
TABLE 2488 ASIA-PACIFIC OPTICAL NETWORK SWITCHING DEVICES IN INDIUM MARKET, BY PURITY GRADE, 2018-2033 (USD THOUSAND)
TABLE 2489 ASIA-PACIFIC SATELLITE COMMUNICATION MODULES IN INDIUM MARKET, BY PURITY GRADE, 2018-2033 (USD THOUSAND)
TABLE 2490 ASIA-PACIFIC OPTICAL & PHOTONICS INDUSTRY IN INDIUM MARKET, BY TYPE, 2018-2033 (USD THOUSAND)
TABLE 2491 ASIA-PACIFIC OPTICAL COATINGS IN INDIUM MARKET, BY PURITY GRADE, 2018-2033 (USD THOUSAND)
TABLE 2492 ASIA-PACIFIC FIBER OPTIC COMPONENTS IN INDIUM MARKET, BY PURITY GRADE, 2018-2033 (USD THOUSAND)
TABLE 2493 ASIA-PACIFIC LASER COMPONENTS IN INDIUM MARKET, BY PURITY GRADE, 2018-2033 (USD THOUSAND)
TABLE 2494 ASIA-PACIFIC OPTICAL SENSORS IN INDIUM MARKET, BY PURITY GRADE, 2018-2033 (USD THOUSAND)
TABLE 2495 ASIA-PACIFIC INFRARED OPTICS IN INDIUM MARKET, BY PURITY GRADE, 2018-2033 (USD THOUSAND)
TABLE 2496 ASIA-PACIFIC PICS IN INDIUM MARKET, BY PURITY GRADE, 2018-2033 (USD THOUSAND)
TABLE 2497 ASIA-PACIFIC MIRRORS IN INDIUM MARKET, BY PURITY GRADE, 2018-2033 (USD THOUSAND)
TABLE 2498 ASIA-PACIFIC SPECTROSCOPY IN INDIUM MARKET, BY PURITY GRADE, 2018-2033 (USD THOUSAND)
TABLE 2499 ASIA-PACIFIC AEROSPACE & DEFENSE INDUSTRY IN INDIUM MARKET, BY TYPE, 2018-2033 (USD THOUSAND)
TABLE 2500 ASIA-PACIFIC INFRARED IMAGING SYSTEMS IN INDIUM MARKET, BY PURITY GRADE, 2018-2033 (USD THOUSAND)
TABLE 2501 ASIA-PACIFIC RADAR & RF COMPONENTS IN INDIUM MARKET, BY PURITY GRADE, 2018-2033 (USD THOUSAND)
TABLE 2502 ASIA-PACIFIC SATELLITE COMMUNICATION IN INDIUM MARKET, BY PURITY GRADE, 2018-2033 (USD THOUSAND)
TABLE 2503 ASIA-PACIFIC MILITARY OPTOELECTRONICS IN INDIUM MARKET, BY PURITY GRADE, 2018-2033 (USD THOUSAND)
TABLE 2504 ASIA-PACIFIC AVIONICS DISPLAYS IN INDIUM MARKET, BY PURITY GRADE, 2018-2033 (USD THOUSAND)
TABLE 2505 ASIA-PACIFIC SPACECRAFT SOLAR PANELS IN INDIUM MARKET, BY PURITY GRADE, 2018-2033 (USD THOUSAND)
TABLE 2506 ASIA-PACIFIC THERMAL MATERIALS IN INDIUM MARKET, BY PURITY GRADE, 2018-2033 (USD THOUSAND)
TABLE 2507 ASIA-PACIFIC CRYOGENIC MATERIALS IN INDIUM MARKET, BY PURITY GRADE, 2018-2033 (USD THOUSAND)
TABLE 2508 ASIA-PACIFIC MEDICAL DEVICE INDUSTRY IN INDIUM MARKET, BY TYPE, 2018-2033 (USD THOUSAND)
TABLE 2509 ASIA-PACIFIC MEDICAL IMAGING SENSORS IN INDIUM MARKET, BY PURITY GRADE, 2018-2033 (USD THOUSAND)
TABLE 2510 ASIA-PACIFIC DIAGNOSTIC EQUIPMENT DISPLAYS IN INDIUM MARKET, BY PURITY GRADE, 2018-2033 (USD THOUSAND)
TABLE 2511 ASIA-PACIFIC ADVANCED DIAGNOSTIC INSTRUMENTS IN INDIUM MARKET, BY PURITY GRADE, 2018-2033 (USD THOUSAND)
TABLE 2512 ASIA-PACIFIC LASER SURGICAL EQUIPMENT IN INDIUM MARKET, BY PURITY GRADE, 2018-2033 (USD THOUSAND)
TABLE 2513 ASIA-PACIFIC BIOMEDICAL OPTICAL DEVICES IN INDIUM MARKET, BY PURITY GRADE, 2018-2033 (USD THOUSAND)
TABLE 2514 ASIA-PACIFIC RADIATION DETECTION EQUIPMENT IN INDIUM MARKET, BY PURITY GRADE, 2018-2033 (USD THOUSAND)
TABLE 2515 ASIA-PACIFIC INFRARED MEDICAL SENSORS IN INDIUM MARKET, BY PURITY GRADE, 2018-2033 (USD THOUSAND)
TABLE 2516 ASIA-PACIFIC PHOTOTHERAPY DEVICES IN INDIUM MARKET, BY PURITY GRADE, 2018-2033 (USD THOUSAND)
TABLE 2517 ASIA-PACIFIC INDUSTRIAL EQUIPMENT MANUFACTURING IN INDIUM MARKET, BY TYPE, 2018-2033 (USD THOUSAND)
TABLE 2518 ASIA-PACIFIC INDUSTRIAL SENSORS IN INDIUM MARKET, BY PURITY GRADE, 2018-2033 (USD THOUSAND)
TABLE 2519 ASIA-PACIFIC VACUUM DEPOSITION COATINGS IN INDIUM MARKET, BY PURITY GRADE, 2018-2033 (USD THOUSAND)
TABLE 2520 ASIA-PACIFIC PRECISION OPTICAL COMPONENTS IN INDIUM MARKET, BY PURITY GRADE, 2018-2033 (USD THOUSAND)
TABLE 2521 ASIA-PACIFIC THERMAL INTERFACE MATERIALS IN INDIUM MARKET, BY PURITY GRADE, 2018-2033 (USD THOUSAND)
TABLE 2522 ASIA-PACIFIC INDUSTRIAL LASER SYSTEMS IN INDIUM MARKET, BY PURITY GRADE, 2018-2033 (USD THOUSAND)
TABLE 2523 ASIA-PACIFIC INDUSTRIAL INFRARED DETECTORS IN INDIUM MARKET, BY PURITY GRADE, 2018-2033 (USD THOUSAND)
TABLE 2524 ASIA-PACIFIC PRECISION MEASUREMENT EQUIPMENT IN INDIUM MARKET, BY PURITY GRADE, 2018-2033 (USD THOUSAND)
TABLE 2525 ASIA-PACIFIC SPECIALTY ELECTRONIC COMPONENTS IN INDIUM MARKET, BY PURITY GRADE, 2018-2033 (USD THOUSAND)
TABLE 2526 ASIA-PACIFIC OTHERS IN INDIUM MARKET, BY TYPE, 2018-2033 (USD THOUSAND)
TABLE 2527 ASIA-PACIFIC ADVANCED MATERIALS MANUFACTURING IN INDIUM MARKET, BY PURITY GRADE, 2018-2033 (USD THOUSAND)
TABLE 2528 ASIA-PACIFIC SPECIALTY ALLOY PRODUCTION IN INDIUM MARKET, BY PURITY GRADE, 2018-2033 (USD THOUSAND)
TABLE 2529 ASIA-PACIFIC THERMAL MANAGEMENT MATERIALS IN INDIUM MARKET, BY PURITY GRADE, 2018-2033 (USD THOUSAND)
TABLE 2530 ASIA-PACIFIC PRECISION SCIENTIFIC INSTRUMENTS IN INDIUM MARKET, BY PURITY GRADE, 2018-2033 (USD THOUSAND)
TABLE 2531 ASIA-PACIFIC RESEARCH INSTITUTES & UNIVERSITIES IN INDIUM MARKET, BY PURITY GRADE, 2018-2033 (USD THOUSAND)
TABLE 2532 ASIA-PACIFIC NUCLEAR INDUSTRY APPLICATIONS IN INDIUM MARKET, BY PURITY GRADE, 2018-2033 (USD THOUSAND)
TABLE 2533 ASIA-PACIFIC SPECIALTY CHEMICAL PRODUCTION IN INDIUM MARKET, BY PURITY GRADE, 2018-2033 (USD THOUSAND)
TABLE 2534 ASIA-PACIFIC DEFENSE RESEARCH LABORATORIES IN INDIUM MARKET, BY PURITY GRADE, 2018-2033 (USD THOUSAND)
TABLE 2535 ASIA-PACIFIC CRYOGENIC EQUIPMENT MANUFACTURING IN INDIUM MARKET, BY PURITY GRADE, 2018-2033 (USD THOUSAND)
TABLE 2536 CHINA INDIUM MARKET, BY PRODUCT TYPE, 2018-2033 (USD THOUSAND)
TABLE 2537 CHINA INGOTS IN INDIUM MARKET, BY TYPE, 2018-2033 (USD THOUSAND)
TABLE 2538 CHINA INDIUM MARKET, BY MATERIAL COMPOSITION, 2018-2033 (USD THOUSAND)
TABLE 2539 CHINA INDIUM ALLOYS IN INDIUM MARKET, BY TYPE, 2018-2033 (USD THOUSAND)
TABLE 2540 CHINA INDIUM COMPOUNDS IN INDIUM MARKET, BY TYPE, 2018-2033 (USD THOUSAND)
TABLE 2541 CHINA INDIUM MARKET, BY PURITY GRADE, 2018-2033 (USD THOUSAND)
TABLE 2542 CHINA INDIUM MARKET, BY EXTRACTION SOURCE, 2018-2033 (USD THOUSAND)
TABLE 2543 CHINA PRIMARY PRODUCTION IN INDIUM MARKET, BY TYPE, 2018-2033 (USD THOUSAND)
TABLE 2544 CHINA SECONDARY PRODUCTION IN INDIUM MARKET, BY TYPE, 2018-2033 (USD THOUSAND)
TABLE 2545 CHINA INDIUM MARKET, BY DISTRIBUTION CHANNEL, 2018-2033 (USD THOUSAND)
TABLE 2546 CHINA INDIUM MARKET, BY TECHNOLOGY PLATFORM, 2018-2033 (USD THOUSAND)
TABLE 2547 CHINA INDIUM MARKET, BY END-USER INDUSTRY, 2018-2033 (USD THOUSAND)
TABLE 2548 CHINA CONSUMER ELECTRONICS INDUSTRY IN INDIUM MARKET, BY TYPE, 2018-2033 (USD THOUSAND)
TABLE 2549 CHINA FLAT PANEL DISPLAYS (LCD/OLED/LED) IN INDIUM MARKET, BY PURITY GRADE, 2018-2033 (USD THOUSAND)
TABLE 2550 CHINA TRANSPARENT CONDUCTIVE COATINGS (ITO) IN INDIUM MARKET, BY PURITY GRADE, 2018-2033 (USD THOUSAND)
TABLE 2551 CHINA TOUCHSCREEN DISPLAYS IN INDIUM MARKET, BY PURITY GRADE, 2018-2033 (USD THOUSAND)
TABLE 2552 CHINA FLEXIBLE DISPLAYS & ELECTRONICS IN INDIUM MARKET, BY PURITY GRADE, 2018-2033 (USD THOUSAND)
TABLE 2553 CHINA WEARABLE ELECTRONICS DEVICES IN INDIUM MARKET, BY PURITY GRADE, 2018-2033 (USD THOUSAND)
TABLE 2554 CHINA CAMERA & OPTICAL SENSORS IN INDIUM MARKET, BY PURITY GRADE, 2018-2033 (USD THOUSAND)
TABLE 2555 CHINA MINI-LED BACKLIGHTING IN INDIUM MARKET, BY PURITY GRADE, 2018-2033 (USD THOUSAND)
TABLE 2556 CHINA MICRO-LED DISPLAYS IN INDIUM MARKET, BY PURITY GRADE, 2018-2033 (USD THOUSAND)
TABLE 2557 CHINA DISPLAY PANEL INDUSTRY IN INDIUM MARKET, BY TYPE, 2018-2033 (USD THOUSAND)
TABLE 2558 CHINA LCD PANEL MANUFACTURING IN INDIUM MARKET, BY PURITY GRADE, 2018-2033 (USD THOUSAND)
TABLE 2559 CHINA OLED PANEL MANUFACTURING IN INDIUM MARKET, BY PURITY GRADE, 2018-2033 (USD THOUSAND)
TABLE 2560 CHINA DISPLAY PANEL MANUFACTURING IN INDIUM MARKET, BY PURITY GRADE, 2018-2033 (USD THOUSAND)
TABLE 2561 CHINA TOUCH PANEL SENSORS IN INDIUM MARKET, BY PURITY GRADE, 2018-2033 (USD THOUSAND)
TABLE 2562 CHINA TRANSPARENT CONDUCTIVE FILMS IN INDIUM MARKET, BY PURITY GRADE, 2018-2033 (USD THOUSAND)
TABLE 2563 CHINA FLEXIBLE & FOLDABLE DISPLAYS IN INDIUM MARKET, BY PURITY GRADE, 2018-2033 (USD THOUSAND)
TABLE 2564 CHINA AR/VR DISPLAYS IN INDIUM MARKET, BY PURITY GRADE, 2018-2033 (USD THOUSAND)
TABLE 2565 CHINA MICRODISPLAY DEVICES IN INDIUM MARKET, BY PURITY GRADE, 2018-2033 (USD THOUSAND)
TABLE 2566 CHINA BACKPLANE COATINGS IN INDIUM MARKET, BY PURITY GRADE, 2018-2033 (USD THOUSAND)
TABLE 2567 CHINA SEMICONDUCTOR INDUSTRY IN INDIUM MARKET, BY TYPE, 2018-2033 (USD THOUSAND)
TABLE 2568 CHINA III-V COMPOUND SEMICONDUCTORS IN INDIUM MARKET, BY PURITY GRADE, 2018-2033 (USD THOUSAND)
TABLE 2569 CHINA HIGH-FREQUENCY RF COMPONENTS IN INDIUM MARKET, BY PURITY GRADE, 2018-2033 (USD THOUSAND)
TABLE 2570 CHINA SEMICONDUCTOR SUBSTRATES & EPITAXY IN INDIUM MARKET, BY PURITY GRADE, 2018-2033 (USD THOUSAND)
TABLE 2571 CHINA LASER DIODES IN INDIUM MARKET, BY PURITY GRADE, 2018-2033 (USD THOUSAND)
TABLE 2572 CHINA PHOTODETECTORS IN INDIUM MARKET, BY PURITY GRADE, 2018-2033 (USD THOUSAND)
TABLE 2573 CHINA HIGH-SPEED OPTOELECTRONICS IN INDIUM MARKET, BY PURITY GRADE, 2018-2033 (USD THOUSAND)
TABLE 2574 CHINA INFRARED DETECTORS IN INDIUM MARKET, BY PURITY GRADE, 2018-2033 (USD THOUSAND)
TABLE 2575 CHINA INTEGRATED PHOTONIC CIRCUITS IN INDIUM MARKET, BY PURITY GRADE, 2018-2033 (USD THOUSAND)
TABLE 2576 CHINA SOLAR PHOTOVOLTAIC INDUSTRY IN INDIUM MARKET, BY TYPE, 2018-2033 (USD THOUSAND)
TABLE 2577 CHINA CIGS THIN-FILM SOLAR CELLS IN INDIUM MARKET, BY PURITY GRADE, 2018-2033 (USD THOUSAND)
TABLE 2578 CHINAHIGH-EFFICIENCY MODULES IN INDIUM MARKET, BY PURITY GRADE, 2018-2033 (USD THOUSAND)
TABLE 2579 CHINA THIN-FILM COATINGS IN INDIUM MARKET, BY PURITY GRADE, 2018-2033 (USD THOUSAND)
TABLE 2580 CHINA TRANSPARENT ELECTRODES IN INDIUM MARKET, BY PURITY GRADE, 2018-2033 (USD THOUSAND)
TABLE 2581 CHINA BIPV IN INDIUM MARKET, BY PURITY GRADE, 2018-2033 (USD THOUSAND)
TABLE 2582 CHINA FLEXIBLE SOLAR PANELS IN INDIUM MARKET, BY PURITY GRADE, 2018-2033 (USD THOUSAND)
TABLE 2583 CHINA PORTABLE SOLAR SYSTEMS IN INDIUM MARKET, BY PURITY GRADE, 2018-2033 (USD THOUSAND)
TABLE 2584 CHINA CONCENTRATED PV IN INDIUM MARKET, BY PURITY GRADE, 2018-2033 (USD THOUSAND)
TABLE 2585 CHINA AUTOMOTIVE INDUSTRY IN INDIUM MARKET, BY TYPE, 2018-2033 (USD THOUSAND)
TABLE 2586 CHINA AUTOMOTIVE DISPLAY PANELS IN INDIUM MARKET, BY PURITY GRADE, 2018-2033 (USD THOUSAND)
TABLE 2587 CHINAADAS SENSORS IN INDIUM MARKET, BY PURITY GRADE, 2018-2033 (USD THOUSAND)
TABLE 2588 CHINA VEHICLE CAMERA MODULES IN INDIUM MARKET, BY PURITY GRADE, 2018-2033 (USD THOUSAND)
TABLE 2589 CHINA AUTOMOTIVE OPTOELECTRONICS IN INDIUM MARKET, BY PURITY GRADE, 2018-2033 (USD THOUSAND)
TABLE 2590 CHINA POWER ELECTRONICS IN INDIUM MARKET, BY PURITY GRADE, 2018-2033 (USD THOUSAND)
TABLE 2591 CHINA TOUCHSCREEN INTERFACES IN INDIUM MARKET, BY PURITY GRADE, 2018-2033 (USD THOUSAND)
TABLE 2592 CHINA INFRARED SENSORS IN INDIUM MARKET, BY PURITY GRADE, 2018-2033 (USD THOUSAND)
TABLE 2593 CHINA SMART LIGHTING IN INDIUM MARKET, BY PURITY GRADE, 2018-2033 (USD THOUSAND)
TABLE 2594 CHINA TELECOMMUNICATION EQUIPMENT INDUSTRY IN INDIUM MARKET, BY TYPE, 2018-2033 (USD THOUSAND)
TABLE 2595 CHINA OPTICAL TRANSCEIVERS IN INDIUM MARKET, BY PURITY GRADE, 2018-2033 (USD THOUSAND)
TABLE 2596 CHINA RF POWER AMPLIFIERS IN INDIUM MARKET, BY PURITY GRADE, 2018-2033 (USD THOUSAND)
TABLE 2597 CHINA HIGH-FREQUENCY COMMUNICATION CHIPS IN INDIUM MARKET, BY PURITY GRADE, 2018-2033 (USD THOUSAND)
TABLE 2598 CHINA FIBER-OPTIC COMMUNICATION LASERS IN INDIUM MARKET, BY PURITY GRADE, 2018-2033 (USD THOUSAND)
TABLE 2599 CHINA PHOTODETECTORS FOR OPTICAL NETWORKS IN INDIUM MARKET, BY PURITY GRADE, 2018-2033 (USD THOUSAND)
TABLE 2600 CHINA 5G INFRASTRUCTURE COMPONENTS IN INDIUM MARKET, BY PURITY GRADE, 2018-2033 (USD THOUSAND)
TABLE 2601 CHINA OPTICAL NETWORK SWITCHING DEVICES IN INDIUM MARKET, BY PURITY GRADE, 2018-2033 (USD THOUSAND)
TABLE 2602 CHINA SATELLITE COMMUNICATION MODULES IN INDIUM MARKET, BY PURITY GRADE, 2018-2033 (USD THOUSAND)
TABLE 2603 CHINA OPTICAL & PHOTONICS INDUSTRY IN INDIUM MARKET, BY TYPE, 2018-2033 (USD THOUSAND)
TABLE 2604 CHINA OPTICAL COATINGS IN INDIUM MARKET, BY PURITY GRADE, 2018-2033 (USD THOUSAND)
TABLE 2605 CHINA FIBER OPTIC COMPONENTS IN INDIUM MARKET, BY PURITY GRADE, 2018-2033 (USD THOUSAND)
TABLE 2606 CHINA LASER COMPONENTS IN INDIUM MARKET, BY PURITY GRADE, 2018-2033 (USD THOUSAND)
TABLE 2607 CHINA OPTICAL SENSORS IN INDIUM MARKET, BY PURITY GRADE, 2018-2033 (USD THOUSAND)
TABLE 2608 CHINA INFRARED OPTICS IN INDIUM MARKET, BY PURITY GRADE, 2018-2033 (USD THOUSAND)
TABLE 2609 CHINA PICS IN INDIUM MARKET, BY PURITY GRADE, 2018-2033 (USD THOUSAND)
TABLE 2610 CHINA MIRRORS IN INDIUM MARKET, BY PURITY GRADE, 2018-2033 (USD THOUSAND)
TABLE 2611 CHINA SPECTROSCOPY IN INDIUM MARKET, BY PURITY GRADE, 2018-2033 (USD THOUSAND)
TABLE 2612 CHINA AEROSPACE & DEFENSE INDUSTRY IN INDIUM MARKET, BY TYPE, 2018-2033 (USD THOUSAND)
TABLE 2613 CHINA INFRARED IMAGING SYSTEMS IN INDIUM MARKET, BY PURITY GRADE, 2018-2033 (USD THOUSAND)
TABLE 2614 CHINA RADAR & RF COMPONENTS IN INDIUM MARKET, BY PURITY GRADE, 2018-2033 (USD THOUSAND)
TABLE 2615 CHINA SATELLITE COMMUNICATION IN INDIUM MARKET, BY PURITY GRADE, 2018-2033 (USD THOUSAND)
TABLE 2616 CHINA MILITARY OPTOELECTRONICS IN INDIUM MARKET, BY PURITY GRADE, 2018-2033 (USD THOUSAND)
TABLE 2617 CHINA AVIONICS DISPLAYS IN INDIUM MARKET, BY PURITY GRADE, 2018-2033 (USD THOUSAND)
TABLE 2618 CHINA SPACECRAFT SOLAR PANELS IN INDIUM MARKET, BY PURITY GRADE, 2018-2033 (USD THOUSAND)
TABLE 2619 CHINA THERMAL MATERIALS IN INDIUM MARKET, BY PURITY GRADE, 2018-2033 (USD THOUSAND)
TABLE 2620 CHINA CRYOGENIC MATERIALS IN INDIUM MARKET, BY PURITY GRADE, 2018-2033 (USD THOUSAND)
TABLE 2621 CHINA MEDICAL DEVICE INDUSTRY IN INDIUM MARKET, BY TYPE, 2018-2033 (USD THOUSAND)
TABLE 2622 CHINA MEDICAL IMAGING SENSORS IN INDIUM MARKET, BY PURITY GRADE, 2018-2033 (USD THOUSAND)
TABLE 2623 CHINA DIAGNOSTIC EQUIPMENT DISPLAYS IN INDIUM MARKET, BY PURITY GRADE, 2018-2033 (USD THOUSAND)
TABLE 2624 CHINA ADVANCED DIAGNOSTIC INSTRUMENTS IN INDIUM MARKET, BY PURITY GRADE, 2018-2033 (USD THOUSAND)
TABLE 2625 CHINA LASER SURGICAL EQUIPMENT IN INDIUM MARKET, BY PURITY GRADE, 2018-2033 (USD THOUSAND)
TABLE 2626 CHINA BIOMEDICAL OPTICAL DEVICES IN INDIUM MARKET, BY PURITY GRADE, 2018-2033 (USD THOUSAND)
TABLE 2627 CHINA RADIATION DETECTION EQUIPMENT IN INDIUM MARKET, BY PURITY GRADE, 2018-2033 (USD THOUSAND)
TABLE 2628 CHINA INFRARED MEDICAL SENSORS IN INDIUM MARKET, BY PURITY GRADE, 2018-2033 (USD THOUSAND)
TABLE 2629 CHINA PHOTOTHERAPY DEVICES IN INDIUM MARKET, BY PURITY GRADE, 2018-2033 (USD THOUSAND)
TABLE 2630 CHINA INDUSTRIAL EQUIPMENT MANUFACTURING IN INDIUM MARKET, BY TYPE, 2018-2033 (USD THOUSAND)
TABLE 2631 CHINA INDUSTRIAL SENSORS IN INDIUM MARKET, BY PURITY GRADE, 2018-2033 (USD THOUSAND)
TABLE 2632 CHINA VACUUM DEPOSITION COATINGS IN INDIUM MARKET, BY PURITY GRADE, 2018-2033 (USD THOUSAND)
TABLE 2633 CHINA PRECISION OPTICAL COMPONENTS IN INDIUM MARKET, BY PURITY GRADE, 2018-2033 (USD THOUSAND)
TABLE 2634 CHINA THERMAL INTERFACE MATERIALS IN INDIUM MARKET, BY PURITY GRADE, 2018-2033 (USD THOUSAND)
TABLE 2635 CHINA INDUSTRIAL LASER SYSTEMS IN INDIUM MARKET, BY PURITY GRADE, 2018-2033 (USD THOUSAND)
TABLE 2636 CHINA INDUSTRIAL INFRARED DETECTORS IN INDIUM MARKET, BY PURITY GRADE, 2018-2033 (USD THOUSAND)
TABLE 2637 CHINA PRECISION MEASUREMENT EQUIPMENT IN INDIUM MARKET, BY PURITY GRADE, 2018-2033 (USD THOUSAND)
TABLE 2638 CHINA SPECIALTY ELECTRONIC COMPONENTS IN INDIUM MARKET, BY PURITY GRADE, 2018-2033 (USD THOUSAND)
TABLE 2639 CHINA OTHERS IN INDIUM MARKET, BY TYPE, 2018-2033 (USD THOUSAND)
TABLE 2640 CHINA ADVANCED MATERIALS MANUFACTURING IN INDIUM MARKET, BY PURITY GRADE, 2018-2033 (USD THOUSAND)
TABLE 2641 CHINA SPECIALTY ALLOY PRODUCTION IN INDIUM MARKET, BY PURITY GRADE, 2018-2033 (USD THOUSAND)
TABLE 2642 CHINA THERMAL MANAGEMENT MATERIALS IN INDIUM MARKET, BY PURITY GRADE, 2018-2033 (USD THOUSAND)
TABLE 2643 CHINA PRECISION SCIENTIFIC INSTRUMENTS IN INDIUM MARKET, BY PURITY GRADE, 2018-2033 (USD THOUSAND)
TABLE 2644 CHINA RESEARCH INSTITUTES & UNIVERSITIES IN INDIUM MARKET, BY PURITY GRADE, 2018-2033 (USD THOUSAND)
TABLE 2645 CHINA NUCLEAR INDUSTRY APPLICATIONS IN INDIUM MARKET, BY PURITY GRADE, 2018-2033 (USD THOUSAND)
TABLE 2646 CHINA SPECIALTY CHEMICAL PRODUCTION IN INDIUM MARKET, BY PURITY GRADE, 2018-2033 (USD THOUSAND)
TABLE 2647 CHINA DEFENSE RESEARCH LABORATORIES IN INDIUM MARKET, BY PURITY GRADE, 2018-2033 (USD THOUSAND)
TABLE 2648 CHINA CRYOGENIC EQUIPMENT MANUFACTURING IN INDIUM MARKET, BY PURITY GRADE, 2018-2033 (USD THOUSAND)
TABLE 2649 JAPAN INDIUM MARKET, BY PRODUCT TYPE, 2018-2033 (USD THOUSAND)
TABLE 2650 JAPAN INGOTS IN INDIUM MARKET, BY TYPE, 2018-2033 (USD THOUSAND)
TABLE 2651 JAPAN INDIUM MARKET, BY MATERIAL COMPOSITION, 2018-2033 (USD THOUSAND)
TABLE 2652 JAPAN INDIUM ALLOYS IN INDIUM MARKET, BY TYPE, 2018-2033 (USD THOUSAND)
TABLE 2653 JAPAN INDIUM COMPOUNDS IN INDIUM MARKET, BY TYPE, 2018-2033 (USD THOUSAND)
TABLE 2654 JAPAN INDIUM MARKET, BY PURITY GRADE, 2018-2033 (USD THOUSAND)
TABLE 2655 JAPAN INDIUM MARKET, BY EXTRACTION SOURCE, 2018-2033 (USD THOUSAND)
TABLE 2656 JAPAN PRIMARY PRODUCTION IN INDIUM MARKET, BY TYPE, 2018-2033 (USD THOUSAND)
TABLE 2657 JAPAN SECONDARY PRODUCTION IN INDIUM MARKET, BY TYPE, 2018-2033 (USD THOUSAND)
TABLE 2658 JAPAN INDIUM MARKET, BY DISTRIBUTION CHANNEL, 2018-2033 (USD THOUSAND)
TABLE 2659 JAPAN INDIUM MARKET, BY TECHNOLOGY PLATFORM, 2018-2033 (USD THOUSAND)
TABLE 2660 JAPAN INDIUM MARKET, BY END-USER INDUSTRY, 2018-2033 (USD THOUSAND)
TABLE 2661 JAPAN CONSUMER ELECTRONICS INDUSTRY IN INDIUM MARKET, BY TYPE, 2018-2033 (USD THOUSAND)
TABLE 2662 JAPAN FLAT PANEL DISPLAYS (LCD/OLED/LED) IN INDIUM MARKET, BY PURITY GRADE, 2018-2033 (USD THOUSAND)
TABLE 2663 JAPAN TRANSPARENT CONDUCTIVE COATINGS (ITO) IN INDIUM MARKET, BY PURITY GRADE, 2018-2033 (USD THOUSAND)
TABLE 2664 JAPAN TOUCHSCREEN DISPLAYS IN INDIUM MARKET, BY PURITY GRADE, 2018-2033 (USD THOUSAND)
TABLE 2665 JAPAN FLEXIBLE DISPLAYS & ELECTRONICS IN INDIUM MARKET, BY PURITY GRADE, 2018-2033 (USD THOUSAND)
TABLE 2666 JAPAN WEARABLE ELECTRONICS DEVICES IN INDIUM MARKET, BY PURITY GRADE, 2018-2033 (USD THOUSAND)
TABLE 2667 JAPAN CAMERA & OPTICAL SENSORS IN INDIUM MARKET, BY PURITY GRADE, 2018-2033 (USD THOUSAND)
TABLE 2668 JAPAN MINI-LED BACKLIGHTING IN INDIUM MARKET, BY PURITY GRADE, 2018-2033 (USD THOUSAND)
TABLE 2669 JAPAN MICRO-LED DISPLAYS IN INDIUM MARKET, BY PURITY GRADE, 2018-2033 (USD THOUSAND)
TABLE 2670 JAPAN DISPLAY PANEL INDUSTRY IN INDIUM MARKET, BY TYPE, 2018-2033 (USD THOUSAND)
TABLE 2671 JAPAN LCD PANEL MANUFACTURING IN INDIUM MARKET, BY PURITY GRADE, 2018-2033 (USD THOUSAND)
TABLE 2672 JAPAN OLED PANEL MANUFACTURING IN INDIUM MARKET, BY PURITY GRADE, 2018-2033 (USD THOUSAND)
TABLE 2673 JAPAN DISPLAY PANEL MANUFACTURING IN INDIUM MARKET, BY PURITY GRADE, 2018-2033 (USD THOUSAND)
TABLE 2674 JAPAN TOUCH PANEL SENSORS IN INDIUM MARKET, BY PURITY GRADE, 2018-2033 (USD THOUSAND)
TABLE 2675 JAPAN TRANSPARENT CONDUCTIVE FILMS IN INDIUM MARKET, BY PURITY GRADE, 2018-2033 (USD THOUSAND)
TABLE 2676 JAPAN FLEXIBLE & FOLDABLE DISPLAYS IN INDIUM MARKET, BY PURITY GRADE, 2018-2033 (USD THOUSAND)
TABLE 2677 JAPAN AR/VR DISPLAYS IN INDIUM MARKET, BY PURITY GRADE, 2018-2033 (USD THOUSAND)
TABLE 2678 JAPAN MICRODISPLAY DEVICES IN INDIUM MARKET, BY PURITY GRADE, 2018-2033 (USD THOUSAND)
TABLE 2679 JAPAN BACKPLANE COATINGS IN INDIUM MARKET, BY PURITY GRADE, 2018-2033 (USD THOUSAND)
TABLE 2680 JAPAN SEMICONDUCTOR INDUSTRY IN INDIUM MARKET, BY TYPE, 2018-2033 (USD THOUSAND)
TABLE 2681 JAPAN III-V COMPOUND SEMICONDUCTORS IN INDIUM MARKET, BY PURITY GRADE, 2018-2033 (USD THOUSAND)
TABLE 2682 JAPAN HIGH-FREQUENCY RF COMPONENTS IN INDIUM MARKET, BY PURITY GRADE, 2018-2033 (USD THOUSAND)
TABLE 2683 JAPAN SEMICONDUCTOR SUBSTRATES & EPITAXY IN INDIUM MARKET, BY PURITY GRADE, 2018-2033 (USD THOUSAND)
TABLE 2684 JAPAN LASER DIODES IN INDIUM MARKET, BY PURITY GRADE, 2018-2033 (USD THOUSAND)
TABLE 2685 JAPAN PHOTODETECTORS IN INDIUM MARKET, BY PURITY GRADE, 2018-2033 (USD THOUSAND)
TABLE 2686 JAPAN HIGH-SPEED OPTOELECTRONICS IN INDIUM MARKET, BY PURITY GRADE, 2018-2033 (USD THOUSAND)
TABLE 2687 JAPAN INFRARED DETECTORS IN INDIUM MARKET, BY PURITY GRADE, 2018-2033 (USD THOUSAND)
TABLE 2688 JAPAN INTEGRATED PHOTONIC CIRCUITS IN INDIUM MARKET, BY PURITY GRADE, 2018-2033 (USD THOUSAND)
TABLE 2689 JAPAN SOLAR PHOTOVOLTAIC INDUSTRY IN INDIUM MARKET, BY TYPE, 2018-2033 (USD THOUSAND)
TABLE 2690 JAPAN CIGS THIN-FILM SOLAR CELLS IN INDIUM MARKET, BY PURITY GRADE, 2018-2033 (USD THOUSAND)
TABLE 2691 JAPANHIGH-EFFICIENCY MODULES IN INDIUM MARKET, BY PURITY GRADE, 2018-2033 (USD THOUSAND)
TABLE 2692 JAPAN THIN-FILM COATINGS IN INDIUM MARKET, BY PURITY GRADE, 2018-2033 (USD THOUSAND)
TABLE 2693 JAPAN TRANSPARENT ELECTRODES IN INDIUM MARKET, BY PURITY GRADE, 2018-2033 (USD THOUSAND)
TABLE 2694 JAPAN BIPV IN INDIUM MARKET, BY PURITY GRADE, 2018-2033 (USD THOUSAND)
TABLE 2695 JAPAN FLEXIBLE SOLAR PANELS IN INDIUM MARKET, BY PURITY GRADE, 2018-2033 (USD THOUSAND)
TABLE 2696 JAPAN PORTABLE SOLAR SYSTEMS IN INDIUM MARKET, BY PURITY GRADE, 2018-2033 (USD THOUSAND)
TABLE 2697 JAPAN CONCENTRATED PV IN INDIUM MARKET, BY PURITY GRADE, 2018-2033 (USD THOUSAND)
TABLE 2698 JAPAN AUTOMOTIVE INDUSTRY IN INDIUM MARKET, BY TYPE, 2018-2033 (USD THOUSAND)
TABLE 2699 JAPAN AUTOMOTIVE DISPLAY PANELS IN INDIUM MARKET, BY PURITY GRADE, 2018-2033 (USD THOUSAND)
TABLE 2700 JAPANADAS SENSORS IN INDIUM MARKET, BY PURITY GRADE, 2018-2033 (USD THOUSAND)
TABLE 2701 JAPAN VEHICLE CAMERA MODULES IN INDIUM MARKET, BY PURITY GRADE, 2018-2033 (USD THOUSAND)
TABLE 2702 JAPAN AUTOMOTIVE OPTOELECTRONICS IN INDIUM MARKET, BY PURITY GRADE, 2018-2033 (USD THOUSAND)
TABLE 2703 JAPAN POWER ELECTRONICS IN INDIUM MARKET, BY PURITY GRADE, 2018-2033 (USD THOUSAND)
TABLE 2704 JAPAN TOUCHSCREEN INTERFACES IN INDIUM MARKET, BY PURITY GRADE, 2018-2033 (USD THOUSAND)
TABLE 2705 JAPAN INFRARED SENSORS IN INDIUM MARKET, BY PURITY GRADE, 2018-2033 (USD THOUSAND)
TABLE 2706 JAPAN SMART LIGHTING IN INDIUM MARKET, BY PURITY GRADE, 2018-2033 (USD THOUSAND)
TABLE 2707 JAPAN TELECOMMUNICATION EQUIPMENT INDUSTRY IN INDIUM MARKET, BY TYPE, 2018-2033 (USD THOUSAND)
TABLE 2708 JAPAN OPTICAL TRANSCEIVERS IN INDIUM MARKET, BY PURITY GRADE, 2018-2033 (USD THOUSAND)
TABLE 2709 JAPAN RF POWER AMPLIFIERS IN INDIUM MARKET, BY PURITY GRADE, 2018-2033 (USD THOUSAND)
TABLE 2710 JAPAN HIGH-FREQUENCY COMMUNICATION CHIPS IN INDIUM MARKET, BY PURITY GRADE, 2018-2033 (USD THOUSAND)
TABLE 2711 JAPAN FIBER-OPTIC COMMUNICATION LASERS IN INDIUM MARKET, BY PURITY GRADE, 2018-2033 (USD THOUSAND)
TABLE 2712 JAPAN PHOTODETECTORS FOR OPTICAL NETWORKS IN INDIUM MARKET, BY PURITY GRADE, 2018-2033 (USD THOUSAND)
TABLE 2713 JAPAN 5G INFRASTRUCTURE COMPONENTS IN INDIUM MARKET, BY PURITY GRADE, 2018-2033 (USD THOUSAND)
TABLE 2714 JAPAN OPTICAL NETWORK SWITCHING DEVICES IN INDIUM MARKET, BY PURITY GRADE, 2018-2033 (USD THOUSAND)
TABLE 2715 JAPAN SATELLITE COMMUNICATION MODULES IN INDIUM MARKET, BY PURITY GRADE, 2018-2033 (USD THOUSAND)
TABLE 2716 JAPAN OPTICAL & PHOTONICS INDUSTRY IN INDIUM MARKET, BY TYPE, 2018-2033 (USD THOUSAND)
TABLE 2717 JAPAN OPTICAL COATINGS IN INDIUM MARKET, BY PURITY GRADE, 2018-2033 (USD THOUSAND)
TABLE 2718 JAPAN FIBER OPTIC COMPONENTS IN INDIUM MARKET, BY PURITY GRADE, 2018-2033 (USD THOUSAND)
TABLE 2719 JAPAN LASER COMPONENTS IN INDIUM MARKET, BY PURITY GRADE, 2018-2033 (USD THOUSAND)
TABLE 2720 JAPAN OPTICAL SENSORS IN INDIUM MARKET, BY PURITY GRADE, 2018-2033 (USD THOUSAND)
TABLE 2721 JAPAN INFRARED OPTICS IN INDIUM MARKET, BY PURITY GRADE, 2018-2033 (USD THOUSAND)
TABLE 2722 JAPAN PICS IN INDIUM MARKET, BY PURITY GRADE, 2018-2033 (USD THOUSAND)
TABLE 2723 JAPAN MIRRORS IN INDIUM MARKET, BY PURITY GRADE, 2018-2033 (USD THOUSAND)
TABLE 2724 JAPAN SPECTROSCOPY IN INDIUM MARKET, BY PURITY GRADE, 2018-2033 (USD THOUSAND)
TABLE 2725 JAPAN AEROSPACE & DEFENSE INDUSTRY IN INDIUM MARKET, BY TYPE, 2018-2033 (USD THOUSAND)
TABLE 2726 JAPAN INFRARED IMAGING SYSTEMS IN INDIUM MARKET, BY PURITY GRADE, 2018-2033 (USD THOUSAND)
TABLE 2727 JAPAN RADAR & RF COMPONENTS IN INDIUM MARKET, BY PURITY GRADE, 2018-2033 (USD THOUSAND)
TABLE 2728 JAPAN SATELLITE COMMUNICATION IN INDIUM MARKET, BY PURITY GRADE, 2018-2033 (USD THOUSAND)
TABLE 2729 JAPAN MILITARY OPTOELECTRONICS IN INDIUM MARKET, BY PURITY GRADE, 2018-2033 (USD THOUSAND)
TABLE 2730 JAPAN AVIONICS DISPLAYS IN INDIUM MARKET, BY PURITY GRADE, 2018-2033 (USD THOUSAND)
TABLE 2731 JAPAN SPACECRAFT SOLAR PANELS IN INDIUM MARKET, BY PURITY GRADE, 2018-2033 (USD THOUSAND)
TABLE 2732 JAPAN THERMAL MATERIALS IN INDIUM MARKET, BY PURITY GRADE, 2018-2033 (USD THOUSAND)
TABLE 2733 JAPAN CRYOGENIC MATERIALS IN INDIUM MARKET, BY PURITY GRADE, 2018-2033 (USD THOUSAND)
TABLE 2734 JAPAN MEDICAL DEVICE INDUSTRY IN INDIUM MARKET, BY TYPE, 2018-2033 (USD THOUSAND)
TABLE 2735 JAPAN MEDICAL IMAGING SENSORS IN INDIUM MARKET, BY PURITY GRADE, 2018-2033 (USD THOUSAND)
TABLE 2736 JAPAN DIAGNOSTIC EQUIPMENT DISPLAYS IN INDIUM MARKET, BY PURITY GRADE, 2018-2033 (USD THOUSAND)
TABLE 2737 JAPAN ADVANCED DIAGNOSTIC INSTRUMENTS IN INDIUM MARKET, BY PURITY GRADE, 2018-2033 (USD THOUSAND)
TABLE 2738 JAPAN LASER SURGICAL EQUIPMENT IN INDIUM MARKET, BY PURITY GRADE, 2018-2033 (USD THOUSAND)
TABLE 2739 JAPAN BIOMEDICAL OPTICAL DEVICES IN INDIUM MARKET, BY PURITY GRADE, 2018-2033 (USD THOUSAND)
TABLE 2740 JAPAN RADIATION DETECTION EQUIPMENT IN INDIUM MARKET, BY PURITY GRADE, 2018-2033 (USD THOUSAND)
TABLE 2741 JAPAN INFRARED MEDICAL SENSORS IN INDIUM MARKET, BY PURITY GRADE, 2018-2033 (USD THOUSAND)
TABLE 2742 JAPAN PHOTOTHERAPY DEVICES IN INDIUM MARKET, BY PURITY GRADE, 2018-2033 (USD THOUSAND)
TABLE 2743 JAPAN INDUSTRIAL EQUIPMENT MANUFACTURING IN INDIUM MARKET, BY TYPE, 2018-2033 (USD THOUSAND)
TABLE 2744 JAPAN INDUSTRIAL SENSORS IN INDIUM MARKET, BY PURITY GRADE, 2018-2033 (USD THOUSAND)
TABLE 2745 JAPAN VACUUM DEPOSITION COATINGS IN INDIUM MARKET, BY PURITY GRADE, 2018-2033 (USD THOUSAND)
TABLE 2746 JAPAN PRECISION OPTICAL COMPONENTS IN INDIUM MARKET, BY PURITY GRADE, 2018-2033 (USD THOUSAND)
TABLE 2747 JAPAN THERMAL INTERFACE MATERIALS IN INDIUM MARKET, BY PURITY GRADE, 2018-2033 (USD THOUSAND)
TABLE 2748 JAPAN INDUSTRIAL LASER SYSTEMS IN INDIUM MARKET, BY PURITY GRADE, 2018-2033 (USD THOUSAND)
TABLE 2749 JAPAN INDUSTRIAL INFRARED DETECTORS IN INDIUM MARKET, BY PURITY GRADE, 2018-2033 (USD THOUSAND)
TABLE 2750 JAPAN PRECISION MEASUREMENT EQUIPMENT IN INDIUM MARKET, BY PURITY GRADE, 2018-2033 (USD THOUSAND)
TABLE 2751 JAPAN SPECIALTY ELECTRONIC COMPONENTS IN INDIUM MARKET, BY PURITY GRADE, 2018-2033 (USD THOUSAND)
TABLE 2752 JAPAN OTHERS IN INDIUM MARKET, BY TYPE, 2018-2033 (USD THOUSAND)
TABLE 2753 JAPAN ADVANCED MATERIALS MANUFACTURING IN INDIUM MARKET, BY PURITY GRADE, 2018-2033 (USD THOUSAND)
TABLE 2754 JAPAN SPECIALTY ALLOY PRODUCTION IN INDIUM MARKET, BY PURITY GRADE, 2018-2033 (USD THOUSAND)
TABLE 2755 JAPAN THERMAL MANAGEMENT MATERIALS IN INDIUM MARKET, BY PURITY GRADE, 2018-2033 (USD THOUSAND)
TABLE 2756 JAPAN PRECISION SCIENTIFIC INSTRUMENTS IN INDIUM MARKET, BY PURITY GRADE, 2018-2033 (USD THOUSAND)
TABLE 2757 JAPAN RESEARCH INSTITUTES & UNIVERSITIES IN INDIUM MARKET, BY PURITY GRADE, 2018-2033 (USD THOUSAND)
TABLE 2758 JAPAN NUCLEAR INDUSTRY APPLICATIONS IN INDIUM MARKET, BY PURITY GRADE, 2018-2033 (USD THOUSAND)
TABLE 2759 JAPAN SPECIALTY CHEMICAL PRODUCTION IN INDIUM MARKET, BY PURITY GRADE, 2018-2033 (USD THOUSAND)
TABLE 2760 JAPAN DEFENSE RESEARCH LABORATORIES IN INDIUM MARKET, BY PURITY GRADE, 2018-2033 (USD THOUSAND)
TABLE 2761 JAPAN CRYOGENIC EQUIPMENT MANUFACTURING IN INDIUM MARKET, BY PURITY GRADE, 2018-2033 (USD THOUSAND)
TABLE 2762 SOUTH KOREA INDIUM MARKET, BY PRODUCT TYPE, 2018-2033 (USD THOUSAND)
TABLE 2763 SOUTH KOREA INGOTS IN INDIUM MARKET, BY TYPE, 2018-2033 (USD THOUSAND)
TABLE 2764 SOUTH KOREA INDIUM MARKET, BY MATERIAL COMPOSITION, 2018-2033 (USD THOUSAND)
TABLE 2765 SOUTH KOREA INDIUM ALLOYS IN INDIUM MARKET, BY TYPE, 2018-2033 (USD THOUSAND)
TABLE 2766 SOUTH KOREA INDIUM COMPOUNDS IN INDIUM MARKET, BY TYPE, 2018-2033 (USD THOUSAND)
TABLE 2767 SOUTH KOREA INDIUM MARKET, BY PURITY GRADE, 2018-2033 (USD THOUSAND)
TABLE 2768 SOUTH KOREA INDIUM MARKET, BY EXTRACTION SOURCE, 2018-2033 (USD THOUSAND)
TABLE 2769 SOUTH KOREA PRIMARY PRODUCTION IN INDIUM MARKET, BY TYPE, 2018-2033 (USD THOUSAND)
TABLE 2770 SOUTH KOREA SECONDARY PRODUCTION IN INDIUM MARKET, BY TYPE, 2018-2033 (USD THOUSAND)
TABLE 2771 SOUTH KOREA INDIUM MARKET, BY DISTRIBUTION CHANNEL, 2018-2033 (USD THOUSAND)
TABLE 2772 SOUTH KOREA INDIUM MARKET, BY TECHNOLOGY PLATFORM, 2018-2033 (USD THOUSAND)
TABLE 2773 SOUTH KOREA INDIUM MARKET, BY END-USER INDUSTRY, 2018-2033 (USD THOUSAND)
TABLE 2774 SOUTH KOREA CONSUMER ELECTRONICS INDUSTRY IN INDIUM MARKET, BY TYPE, 2018-2033 (USD THOUSAND)
TABLE 2775 SOUTH KOREA FLAT PANEL DISPLAYS (LCD/OLED/LED) IN INDIUM MARKET, BY PURITY GRADE, 2018-2033 (USD THOUSAND)
TABLE 2776 SOUTH KOREA TRANSPARENT CONDUCTIVE COATINGS (ITO) IN INDIUM MARKET, BY PURITY GRADE, 2018-2033 (USD THOUSAND)
TABLE 2777 SOUTH KOREA TOUCHSCREEN DISPLAYS IN INDIUM MARKET, BY PURITY GRADE, 2018-2033 (USD THOUSAND)
TABLE 2778 SOUTH KOREA FLEXIBLE DISPLAYS & ELECTRONICS IN INDIUM MARKET, BY PURITY GRADE, 2018-2033 (USD THOUSAND)
TABLE 2779 SOUTH KOREA WEARABLE ELECTRONICS DEVICES IN INDIUM MARKET, BY PURITY GRADE, 2018-2033 (USD THOUSAND)
TABLE 2780 SOUTH KOREA CAMERA & OPTICAL SENSORS IN INDIUM MARKET, BY PURITY GRADE, 2018-2033 (USD THOUSAND)
TABLE 2781 SOUTH KOREA MINI-LED BACKLIGHTING IN INDIUM MARKET, BY PURITY GRADE, 2018-2033 (USD THOUSAND)
TABLE 2782 SOUTH KOREA MICRO-LED DISPLAYS IN INDIUM MARKET, BY PURITY GRADE, 2018-2033 (USD THOUSAND)
TABLE 2783 SOUTH KOREA DISPLAY PANEL INDUSTRY IN INDIUM MARKET, BY TYPE, 2018-2033 (USD THOUSAND)
TABLE 2784 SOUTH KOREA LCD PANEL MANUFACTURING IN INDIUM MARKET, BY PURITY GRADE, 2018-2033 (USD THOUSAND)
TABLE 2785 SOUTH KOREA OLED PANEL MANUFACTURING IN INDIUM MARKET, BY PURITY GRADE, 2018-2033 (USD THOUSAND)
TABLE 2786 SOUTH KOREA DISPLAY PANEL MANUFACTURING IN INDIUM MARKET, BY PURITY GRADE, 2018-2033 (USD THOUSAND)
TABLE 2787 SOUTH KOREA TOUCH PANEL SENSORS IN INDIUM MARKET, BY PURITY GRADE, 2018-2033 (USD THOUSAND)
TABLE 2788 SOUTH KOREA TRANSPARENT CONDUCTIVE FILMS IN INDIUM MARKET, BY PURITY GRADE, 2018-2033 (USD THOUSAND)
TABLE 2789 SOUTH KOREA FLEXIBLE & FOLDABLE DISPLAYS IN INDIUM MARKET, BY PURITY GRADE, 2018-2033 (USD THOUSAND)
TABLE 2790 SOUTH KOREA AR/VR DISPLAYS IN INDIUM MARKET, BY PURITY GRADE, 2018-2033 (USD THOUSAND)
TABLE 2791 SOUTH KOREA MICRODISPLAY DEVICES IN INDIUM MARKET, BY PURITY GRADE, 2018-2033 (USD THOUSAND)
TABLE 2792 SOUTH KOREA BACKPLANE COATINGS IN INDIUM MARKET, BY PURITY GRADE, 2018-2033 (USD THOUSAND)
TABLE 2793 SOUTH KOREA SEMICONDUCTOR INDUSTRY IN INDIUM MARKET, BY TYPE, 2018-2033 (USD THOUSAND)
TABLE 2794 SOUTH KOREA III-V COMPOUND SEMICONDUCTORS IN INDIUM MARKET, BY PURITY GRADE, 2018-2033 (USD THOUSAND)
TABLE 2795 SOUTH KOREA HIGH-FREQUENCY RF COMPONENTS IN INDIUM MARKET, BY PURITY GRADE, 2018-2033 (USD THOUSAND)
TABLE 2796 SOUTH KOREA SEMICONDUCTOR SUBSTRATES & EPITAXY IN INDIUM MARKET, BY PURITY GRADE, 2018-2033 (USD THOUSAND)
TABLE 2797 SOUTH KOREA LASER DIODES IN INDIUM MARKET, BY PURITY GRADE, 2018-2033 (USD THOUSAND)
TABLE 2798 SOUTH KOREA PHOTODETECTORS IN INDIUM MARKET, BY PURITY GRADE, 2018-2033 (USD THOUSAND)
TABLE 2799 SOUTH KOREA HIGH-SPEED OPTOELECTRONICS IN INDIUM MARKET, BY PURITY GRADE, 2018-2033 (USD THOUSAND)
TABLE 2800 SOUTH KOREA INFRARED DETECTORS IN INDIUM MARKET, BY PURITY GRADE, 2018-2033 (USD THOUSAND)
TABLE 2801 SOUTH KOREA INTEGRATED PHOTONIC CIRCUITS IN INDIUM MARKET, BY PURITY GRADE, 2018-2033 (USD THOUSAND)
TABLE 2802 SOUTH KOREA SOLAR PHOTOVOLTAIC INDUSTRY IN INDIUM MARKET, BY TYPE, 2018-2033 (USD THOUSAND)
TABLE 2803 SOUTH KOREA CIGS THIN-FILM SOLAR CELLS IN INDIUM MARKET, BY PURITY GRADE, 2018-2033 (USD THOUSAND)
TABLE 2804 SOUTH KOREAHIGH-EFFICIENCY MODULES IN INDIUM MARKET, BY PURITY GRADE, 2018-2033 (USD THOUSAND)
TABLE 2805 SOUTH KOREA THIN-FILM COATINGS IN INDIUM MARKET, BY PURITY GRADE, 2018-2033 (USD THOUSAND)
TABLE 2806 SOUTH KOREA TRANSPARENT ELECTRODES IN INDIUM MARKET, BY PURITY GRADE, 2018-2033 (USD THOUSAND)
TABLE 2807 SOUTH KOREA BIPV IN INDIUM MARKET, BY PURITY GRADE, 2018-2033 (USD THOUSAND)
TABLE 2808 SOUTH KOREA FLEXIBLE SOLAR PANELS IN INDIUM MARKET, BY PURITY GRADE, 2018-2033 (USD THOUSAND)
TABLE 2809 SOUTH KOREA PORTABLE SOLAR SYSTEMS IN INDIUM MARKET, BY PURITY GRADE, 2018-2033 (USD THOUSAND)
TABLE 2810 SOUTH KOREA CONCENTRATED PV IN INDIUM MARKET, BY PURITY GRADE, 2018-2033 (USD THOUSAND)
TABLE 2811 SOUTH KOREA AUTOMOTIVE INDUSTRY IN INDIUM MARKET, BY TYPE, 2018-2033 (USD THOUSAND)
TABLE 2812 SOUTH KOREA AUTOMOTIVE DISPLAY PANELS IN INDIUM MARKET, BY PURITY GRADE, 2018-2033 (USD THOUSAND)
TABLE 2813 SOUTH KOREAADAS SENSORS IN INDIUM MARKET, BY PURITY GRADE, 2018-2033 (USD THOUSAND)
TABLE 2814 SOUTH KOREA VEHICLE CAMERA MODULES IN INDIUM MARKET, BY PURITY GRADE, 2018-2033 (USD THOUSAND)
TABLE 2815 SOUTH KOREA AUTOMOTIVE OPTOELECTRONICS IN INDIUM MARKET, BY PURITY GRADE, 2018-2033 (USD THOUSAND)
TABLE 2816 SOUTH KOREA POWER ELECTRONICS IN INDIUM MARKET, BY PURITY GRADE, 2018-2033 (USD THOUSAND)
TABLE 2817 SOUTH KOREA TOUCHSCREEN INTERFACES IN INDIUM MARKET, BY PURITY GRADE, 2018-2033 (USD THOUSAND)
TABLE 2818 SOUTH KOREA INFRARED SENSORS IN INDIUM MARKET, BY PURITY GRADE, 2018-2033 (USD THOUSAND)
TABLE 2819 SOUTH KOREA SMART LIGHTING IN INDIUM MARKET, BY PURITY GRADE, 2018-2033 (USD THOUSAND)
TABLE 2820 SOUTH KOREA TELECOMMUNICATION EQUIPMENT INDUSTRY IN INDIUM MARKET, BY TYPE, 2018-2033 (USD THOUSAND)
TABLE 2821 SOUTH KOREA OPTICAL TRANSCEIVERS IN INDIUM MARKET, BY PURITY GRADE, 2018-2033 (USD THOUSAND)
TABLE 2822 SOUTH KOREA RF POWER AMPLIFIERS IN INDIUM MARKET, BY PURITY GRADE, 2018-2033 (USD THOUSAND)
TABLE 2823 SOUTH KOREA HIGH-FREQUENCY COMMUNICATION CHIPS IN INDIUM MARKET, BY PURITY GRADE, 2018-2033 (USD THOUSAND)
TABLE 2824 SOUTH KOREA FIBER-OPTIC COMMUNICATION LASERS IN INDIUM MARKET, BY PURITY GRADE, 2018-2033 (USD THOUSAND)
TABLE 2825 SOUTH KOREA PHOTODETECTORS FOR OPTICAL NETWORKS IN INDIUM MARKET, BY PURITY GRADE, 2018-2033 (USD THOUSAND)
TABLE 2826 SOUTH KOREA 5G INFRASTRUCTURE COMPONENTS IN INDIUM MARKET, BY PURITY GRADE, 2018-2033 (USD THOUSAND)
TABLE 2827 SOUTH KOREA OPTICAL NETWORK SWITCHING DEVICES IN INDIUM MARKET, BY PURITY GRADE, 2018-2033 (USD THOUSAND)
TABLE 2828 SOUTH KOREA SATELLITE COMMUNICATION MODULES IN INDIUM MARKET, BY PURITY GRADE, 2018-2033 (USD THOUSAND)
TABLE 2829 SOUTH KOREA OPTICAL & PHOTONICS INDUSTRY IN INDIUM MARKET, BY TYPE, 2018-2033 (USD THOUSAND)
TABLE 2830 SOUTH KOREA OPTICAL COATINGS IN INDIUM MARKET, BY PURITY GRADE, 2018-2033 (USD THOUSAND)
TABLE 2831 SOUTH KOREA FIBER OPTIC COMPONENTS IN INDIUM MARKET, BY PURITY GRADE, 2018-2033 (USD THOUSAND)
TABLE 2832 SOUTH KOREA LASER COMPONENTS IN INDIUM MARKET, BY PURITY GRADE, 2018-2033 (USD THOUSAND)
TABLE 2833 SOUTH KOREA OPTICAL SENSORS IN INDIUM MARKET, BY PURITY GRADE, 2018-2033 (USD THOUSAND)
TABLE 2834 SOUTH KOREA INFRARED OPTICS IN INDIUM MARKET, BY PURITY GRADE, 2018-2033 (USD THOUSAND)
TABLE 2835 SOUTH KOREA PICS IN INDIUM MARKET, BY PURITY GRADE, 2018-2033 (USD THOUSAND)
TABLE 2836 SOUTH KOREA MIRRORS IN INDIUM MARKET, BY PURITY GRADE, 2018-2033 (USD THOUSAND)
TABLE 2837 SOUTH KOREA SPECTROSCOPY IN INDIUM MARKET, BY PURITY GRADE, 2018-2033 (USD THOUSAND)
TABLE 2838 SOUTH KOREA AEROSPACE & DEFENSE INDUSTRY IN INDIUM MARKET, BY TYPE, 2018-2033 (USD THOUSAND)
TABLE 2839 SOUTH KOREA INFRARED IMAGING SYSTEMS IN INDIUM MARKET, BY PURITY GRADE, 2018-2033 (USD THOUSAND)
TABLE 2840 SOUTH KOREA RADAR & RF COMPONENTS IN INDIUM MARKET, BY PURITY GRADE, 2018-2033 (USD THOUSAND)
TABLE 2841 SOUTH KOREA SATELLITE COMMUNICATION IN INDIUM MARKET, BY PURITY GRADE, 2018-2033 (USD THOUSAND)
TABLE 2842 SOUTH KOREA MILITARY OPTOELECTRONICS IN INDIUM MARKET, BY PURITY GRADE, 2018-2033 (USD THOUSAND)
TABLE 2843 SOUTH KOREA AVIONICS DISPLAYS IN INDIUM MARKET, BY PURITY GRADE, 2018-2033 (USD THOUSAND)
TABLE 2844 SOUTH KOREA SPACECRAFT SOLAR PANELS IN INDIUM MARKET, BY PURITY GRADE, 2018-2033 (USD THOUSAND)
TABLE 2845 SOUTH KOREA THERMAL MATERIALS IN INDIUM MARKET, BY PURITY GRADE, 2018-2033 (USD THOUSAND)
TABLE 2846 SOUTH KOREA CRYOGENIC MATERIALS IN INDIUM MARKET, BY PURITY GRADE, 2018-2033 (USD THOUSAND)
TABLE 2847 SOUTH KOREA MEDICAL DEVICE INDUSTRY IN INDIUM MARKET, BY TYPE, 2018-2033 (USD THOUSAND)
TABLE 2848 SOUTH KOREA MEDICAL IMAGING SENSORS IN INDIUM MARKET, BY PURITY GRADE, 2018-2033 (USD THOUSAND)
TABLE 2849 SOUTH KOREA DIAGNOSTIC EQUIPMENT DISPLAYS IN INDIUM MARKET, BY PURITY GRADE, 2018-2033 (USD THOUSAND)
TABLE 2850 SOUTH KOREA ADVANCED DIAGNOSTIC INSTRUMENTS IN INDIUM MARKET, BY PURITY GRADE, 2018-2033 (USD THOUSAND)
TABLE 2851 SOUTH KOREA LASER SURGICAL EQUIPMENT IN INDIUM MARKET, BY PURITY GRADE, 2018-2033 (USD THOUSAND)
TABLE 2852 SOUTH KOREA BIOMEDICAL OPTICAL DEVICES IN INDIUM MARKET, BY PURITY GRADE, 2018-2033 (USD THOUSAND)
TABLE 2853 SOUTH KOREA RADIATION DETECTION EQUIPMENT IN INDIUM MARKET, BY PURITY GRADE, 2018-2033 (USD THOUSAND)
TABLE 2854 SOUTH KOREA INFRARED MEDICAL SENSORS IN INDIUM MARKET, BY PURITY GRADE, 2018-2033 (USD THOUSAND)
TABLE 2855 SOUTH KOREA PHOTOTHERAPY DEVICES IN INDIUM MARKET, BY PURITY GRADE, 2018-2033 (USD THOUSAND)
TABLE 2856 SOUTH KOREA INDUSTRIAL EQUIPMENT MANUFACTURING IN INDIUM MARKET, BY TYPE, 2018-2033 (USD THOUSAND)
TABLE 2857 SOUTH KOREA INDUSTRIAL SENSORS IN INDIUM MARKET, BY PURITY GRADE, 2018-2033 (USD THOUSAND)
TABLE 2858 SOUTH KOREA VACUUM DEPOSITION COATINGS IN INDIUM MARKET, BY PURITY GRADE, 2018-2033 (USD THOUSAND)
TABLE 2859 SOUTH KOREA PRECISION OPTICAL COMPONENTS IN INDIUM MARKET, BY PURITY GRADE, 2018-2033 (USD THOUSAND)
TABLE 2860 SOUTH KOREA THERMAL INTERFACE MATERIALS IN INDIUM MARKET, BY PURITY GRADE, 2018-2033 (USD THOUSAND)
TABLE 2861 SOUTH KOREA INDUSTRIAL LASER SYSTEMS IN INDIUM MARKET, BY PURITY GRADE, 2018-2033 (USD THOUSAND)
TABLE 2862 SOUTH KOREA INDUSTRIAL INFRARED DETECTORS IN INDIUM MARKET, BY PURITY GRADE, 2018-2033 (USD THOUSAND)
TABLE 2863 SOUTH KOREA PRECISION MEASUREMENT EQUIPMENT IN INDIUM MARKET, BY PURITY GRADE, 2018-2033 (USD THOUSAND)
TABLE 2864 SOUTH KOREA SPECIALTY ELECTRONIC COMPONENTS IN INDIUM MARKET, BY PURITY GRADE, 2018-2033 (USD THOUSAND)
TABLE 2865 SOUTH KOREA OTHERS IN INDIUM MARKET, BY TYPE, 2018-2033 (USD THOUSAND)
TABLE 2866 SOUTH KOREA ADVANCED MATERIALS MANUFACTURING IN INDIUM MARKET, BY PURITY GRADE, 2018-2033 (USD THOUSAND)
TABLE 2867 SOUTH KOREA SPECIALTY ALLOY PRODUCTION IN INDIUM MARKET, BY PURITY GRADE, 2018-2033 (USD THOUSAND)
TABLE 2868 SOUTH KOREA THERMAL MANAGEMENT MATERIALS IN INDIUM MARKET, BY PURITY GRADE, 2018-2033 (USD THOUSAND)
TABLE 2869 SOUTH KOREA PRECISION SCIENTIFIC INSTRUMENTS IN INDIUM MARKET, BY PURITY GRADE, 2018-2033 (USD THOUSAND)
TABLE 2870 SOUTH KOREA RESEARCH INSTITUTES & UNIVERSITIES IN INDIUM MARKET, BY PURITY GRADE, 2018-2033 (USD THOUSAND)
TABLE 2871 SOUTH KOREA NUCLEAR INDUSTRY APPLICATIONS IN INDIUM MARKET, BY PURITY GRADE, 2018-2033 (USD THOUSAND)
TABLE 2872 SOUTH KOREA SPECIALTY CHEMICAL PRODUCTION IN INDIUM MARKET, BY PURITY GRADE, 2018-2033 (USD THOUSAND)
TABLE 2873 SOUTH KOREA DEFENSE RESEARCH LABORATORIES IN INDIUM MARKET, BY PURITY GRADE, 2018-2033 (USD THOUSAND)
TABLE 2874 SOUTH KOREA CRYOGENIC EQUIPMENT MANUFACTURING IN INDIUM MARKET, BY PURITY GRADE, 2018-2033 (USD THOUSAND)
TABLE 2875 TAIWAN INDIUM MARKET, BY PRODUCT TYPE, 2018-2033 (USD THOUSAND)
TABLE 2876 TAIWAN INGOTS IN INDIUM MARKET, BY TYPE, 2018-2033 (USD THOUSAND)
TABLE 2877 TAIWAN INDIUM MARKET, BY MATERIAL COMPOSITION, 2018-2033 (USD THOUSAND)
TABLE 2878 TAIWAN INDIUM ALLOYS IN INDIUM MARKET, BY TYPE, 2018-2033 (USD THOUSAND)
TABLE 2879 TAIWAN INDIUM COMPOUNDS IN INDIUM MARKET, BY TYPE, 2018-2033 (USD THOUSAND)
TABLE 2880 TAIWAN INDIUM MARKET, BY PURITY GRADE, 2018-2033 (USD THOUSAND)
TABLE 2881 TAIWAN INDIUM MARKET, BY EXTRACTION SOURCE, 2018-2033 (USD THOUSAND)
TABLE 2882 TAIWAN PRIMARY PRODUCTION IN INDIUM MARKET, BY TYPE, 2018-2033 (USD THOUSAND)
TABLE 2883 TAIWAN SECONDARY PRODUCTION IN INDIUM MARKET, BY TYPE, 2018-2033 (USD THOUSAND)
TABLE 2884 TAIWAN INDIUM MARKET, BY DISTRIBUTION CHANNEL, 2018-2033 (USD THOUSAND)
TABLE 2885 TAIWAN INDIUM MARKET, BY TECHNOLOGY PLATFORM, 2018-2033 (USD THOUSAND)
TABLE 2886 TAIWAN INDIUM MARKET, BY END-USER INDUSTRY, 2018-2033 (USD THOUSAND)
TABLE 2887 TAIWAN CONSUMER ELECTRONICS INDUSTRY IN INDIUM MARKET, BY TYPE, 2018-2033 (USD THOUSAND)
TABLE 2888 TAIWAN FLAT PANEL DISPLAYS (LCD/OLED/LED) IN INDIUM MARKET, BY PURITY GRADE, 2018-2033 (USD THOUSAND)
TABLE 2889 TAIWAN TRANSPARENT CONDUCTIVE COATINGS (ITO) IN INDIUM MARKET, BY PURITY GRADE, 2018-2033 (USD THOUSAND)
TABLE 2890 TAIWAN TOUCHSCREEN DISPLAYS IN INDIUM MARKET, BY PURITY GRADE, 2018-2033 (USD THOUSAND)
TABLE 2891 TAIWAN FLEXIBLE DISPLAYS & ELECTRONICS IN INDIUM MARKET, BY PURITY GRADE, 2018-2033 (USD THOUSAND)
TABLE 2892 TAIWAN WEARABLE ELECTRONICS DEVICES IN INDIUM MARKET, BY PURITY GRADE, 2018-2033 (USD THOUSAND)
TABLE 2893 TAIWAN CAMERA & OPTICAL SENSORS IN INDIUM MARKET, BY PURITY GRADE, 2018-2033 (USD THOUSAND)
TABLE 2894 TAIWAN MINI-LED BACKLIGHTING IN INDIUM MARKET, BY PURITY GRADE, 2018-2033 (USD THOUSAND)
TABLE 2895 TAIWAN MICRO-LED DISPLAYS IN INDIUM MARKET, BY PURITY GRADE, 2018-2033 (USD THOUSAND)
TABLE 2896 TAIWAN DISPLAY PANEL INDUSTRY IN INDIUM MARKET, BY TYPE, 2018-2033 (USD THOUSAND)
TABLE 2897 TAIWAN LCD PANEL MANUFACTURING IN INDIUM MARKET, BY PURITY GRADE, 2018-2033 (USD THOUSAND)
TABLE 2898 TAIWAN OLED PANEL MANUFACTURING IN INDIUM MARKET, BY PURITY GRADE, 2018-2033 (USD THOUSAND)
TABLE 2899 TAIWAN DISPLAY PANEL MANUFACTURING IN INDIUM MARKET, BY PURITY GRADE, 2018-2033 (USD THOUSAND)
TABLE 2900 TAIWAN TOUCH PANEL SENSORS IN INDIUM MARKET, BY PURITY GRADE, 2018-2033 (USD THOUSAND)
TABLE 2901 TAIWAN TRANSPARENT CONDUCTIVE FILMS IN INDIUM MARKET, BY PURITY GRADE, 2018-2033 (USD THOUSAND)
TABLE 2902 TAIWAN FLEXIBLE & FOLDABLE DISPLAYS IN INDIUM MARKET, BY PURITY GRADE, 2018-2033 (USD THOUSAND)
TABLE 2903 TAIWAN AR/VR DISPLAYS IN INDIUM MARKET, BY PURITY GRADE, 2018-2033 (USD THOUSAND)
TABLE 2904 TAIWAN MICRODISPLAY DEVICES IN INDIUM MARKET, BY PURITY GRADE, 2018-2033 (USD THOUSAND)
TABLE 2905 TAIWAN BACKPLANE COATINGS IN INDIUM MARKET, BY PURITY GRADE, 2018-2033 (USD THOUSAND)
TABLE 2906 TAIWAN SEMICONDUCTOR INDUSTRY IN INDIUM MARKET, BY TYPE, 2018-2033 (USD THOUSAND)
TABLE 2907 TAIWAN III-V COMPOUND SEMICONDUCTORS IN INDIUM MARKET, BY PURITY GRADE, 2018-2033 (USD THOUSAND)
TABLE 2908 TAIWAN HIGH-FREQUENCY RF COMPONENTS IN INDIUM MARKET, BY PURITY GRADE, 2018-2033 (USD THOUSAND)
TABLE 2909 TAIWAN SEMICONDUCTOR SUBSTRATES & EPITAXY IN INDIUM MARKET, BY PURITY GRADE, 2018-2033 (USD THOUSAND)
TABLE 2910 TAIWAN LASER DIODES IN INDIUM MARKET, BY PURITY GRADE, 2018-2033 (USD THOUSAND)
TABLE 2911 TAIWAN PHOTODETECTORS IN INDIUM MARKET, BY PURITY GRADE, 2018-2033 (USD THOUSAND)
TABLE 2912 TAIWAN HIGH-SPEED OPTOELECTRONICS IN INDIUM MARKET, BY PURITY GRADE, 2018-2033 (USD THOUSAND)
TABLE 2913 TAIWAN INFRARED DETECTORS IN INDIUM MARKET, BY PURITY GRADE, 2018-2033 (USD THOUSAND)
TABLE 2914 TAIWAN INTEGRATED PHOTONIC CIRCUITS IN INDIUM MARKET, BY PURITY GRADE, 2018-2033 (USD THOUSAND)
TABLE 2915 TAIWAN SOLAR PHOTOVOLTAIC INDUSTRY IN INDIUM MARKET, BY TYPE, 2018-2033 (USD THOUSAND)
TABLE 2916 TAIWAN CIGS THIN-FILM SOLAR CELLS IN INDIUM MARKET, BY PURITY GRADE, 2018-2033 (USD THOUSAND)
TABLE 2917 TAIWANHIGH-EFFICIENCY MODULES IN INDIUM MARKET, BY PURITY GRADE, 2018-2033 (USD THOUSAND)
TABLE 2918 TAIWAN THIN-FILM COATINGS IN INDIUM MARKET, BY PURITY GRADE, 2018-2033 (USD THOUSAND)
TABLE 2919 TAIWAN TRANSPARENT ELECTRODES IN INDIUM MARKET, BY PURITY GRADE, 2018-2033 (USD THOUSAND)
TABLE 2920 TAIWAN BIPV IN INDIUM MARKET, BY PURITY GRADE, 2018-2033 (USD THOUSAND)
TABLE 2921 TAIWAN FLEXIBLE SOLAR PANELS IN INDIUM MARKET, BY PURITY GRADE, 2018-2033 (USD THOUSAND)
TABLE 2922 TAIWAN PORTABLE SOLAR SYSTEMS IN INDIUM MARKET, BY PURITY GRADE, 2018-2033 (USD THOUSAND)
TABLE 2923 TAIWAN CONCENTRATED PV IN INDIUM MARKET, BY PURITY GRADE, 2018-2033 (USD THOUSAND)
TABLE 2924 TAIWAN AUTOMOTIVE INDUSTRY IN INDIUM MARKET, BY TYPE, 2018-2033 (USD THOUSAND)
TABLE 2925 TAIWAN AUTOMOTIVE DISPLAY PANELS IN INDIUM MARKET, BY PURITY GRADE, 2018-2033 (USD THOUSAND)
TABLE 2926 TAIWANADAS SENSORS IN INDIUM MARKET, BY PURITY GRADE, 2018-2033 (USD THOUSAND)
TABLE 2927 TAIWAN VEHICLE CAMERA MODULES IN INDIUM MARKET, BY PURITY GRADE, 2018-2033 (USD THOUSAND)
TABLE 2928 TAIWAN AUTOMOTIVE OPTOELECTRONICS IN INDIUM MARKET, BY PURITY GRADE, 2018-2033 (USD THOUSAND)
TABLE 2929 TAIWAN POWER ELECTRONICS IN INDIUM MARKET, BY PURITY GRADE, 2018-2033 (USD THOUSAND)
TABLE 2930 TAIWAN TOUCHSCREEN INTERFACES IN INDIUM MARKET, BY PURITY GRADE, 2018-2033 (USD THOUSAND)
TABLE 2931 TAIWAN INFRARED SENSORS IN INDIUM MARKET, BY PURITY GRADE, 2018-2033 (USD THOUSAND)
TABLE 2932 TAIWAN SMART LIGHTING IN INDIUM MARKET, BY PURITY GRADE, 2018-2033 (USD THOUSAND)
TABLE 2933 TAIWAN TELECOMMUNICATION EQUIPMENT INDUSTRY IN INDIUM MARKET, BY TYPE, 2018-2033 (USD THOUSAND)
TABLE 2934 TAIWAN OPTICAL TRANSCEIVERS IN INDIUM MARKET, BY PURITY GRADE, 2018-2033 (USD THOUSAND)
TABLE 2935 TAIWAN RF POWER AMPLIFIERS IN INDIUM MARKET, BY PURITY GRADE, 2018-2033 (USD THOUSAND)
TABLE 2936 TAIWAN HIGH-FREQUENCY COMMUNICATION CHIPS IN INDIUM MARKET, BY PURITY GRADE, 2018-2033 (USD THOUSAND)
TABLE 2937 TAIWAN FIBER-OPTIC COMMUNICATION LASERS IN INDIUM MARKET, BY PURITY GRADE, 2018-2033 (USD THOUSAND)
TABLE 2938 TAIWAN PHOTODETECTORS FOR OPTICAL NETWORKS IN INDIUM MARKET, BY PURITY GRADE, 2018-2033 (USD THOUSAND)
TABLE 2939 TAIWAN 5G INFRASTRUCTURE COMPONENTS IN INDIUM MARKET, BY PURITY GRADE, 2018-2033 (USD THOUSAND)
TABLE 2940 TAIWAN OPTICAL NETWORK SWITCHING DEVICES IN INDIUM MARKET, BY PURITY GRADE, 2018-2033 (USD THOUSAND)
TABLE 2941 TAIWAN SATELLITE COMMUNICATION MODULES IN INDIUM MARKET, BY PURITY GRADE, 2018-2033 (USD THOUSAND)
TABLE 2942 TAIWAN OPTICAL & PHOTONICS INDUSTRY IN INDIUM MARKET, BY TYPE, 2018-2033 (USD THOUSAND)
TABLE 2943 TAIWAN OPTICAL COATINGS IN INDIUM MARKET, BY PURITY GRADE, 2018-2033 (USD THOUSAND)
TABLE 2944 TAIWAN FIBER OPTIC COMPONENTS IN INDIUM MARKET, BY PURITY GRADE, 2018-2033 (USD THOUSAND)
TABLE 2945 TAIWAN LASER COMPONENTS IN INDIUM MARKET, BY PURITY GRADE, 2018-2033 (USD THOUSAND)
TABLE 2946 TAIWAN OPTICAL SENSORS IN INDIUM MARKET, BY PURITY GRADE, 2018-2033 (USD THOUSAND)
TABLE 2947 TAIWAN INFRARED OPTICS IN INDIUM MARKET, BY PURITY GRADE, 2018-2033 (USD THOUSAND)
TABLE 2948 TAIWAN PICS IN INDIUM MARKET, BY PURITY GRADE, 2018-2033 (USD THOUSAND)
TABLE 2949 TAIWAN MIRRORS IN INDIUM MARKET, BY PURITY GRADE, 2018-2033 (USD THOUSAND)
TABLE 2950 TAIWAN SPECTROSCOPY IN INDIUM MARKET, BY PURITY GRADE, 2018-2033 (USD THOUSAND)
TABLE 2951 TAIWAN AEROSPACE & DEFENSE INDUSTRY IN INDIUM MARKET, BY TYPE, 2018-2033 (USD THOUSAND)
TABLE 2952 TAIWAN INFRARED IMAGING SYSTEMS IN INDIUM MARKET, BY PURITY GRADE, 2018-2033 (USD THOUSAND)
TABLE 2953 TAIWAN RADAR & RF COMPONENTS IN INDIUM MARKET, BY PURITY GRADE, 2018-2033 (USD THOUSAND)
TABLE 2954 TAIWAN SATELLITE COMMUNICATION IN INDIUM MARKET, BY PURITY GRADE, 2018-2033 (USD THOUSAND)
TABLE 2955 TAIWAN MILITARY OPTOELECTRONICS IN INDIUM MARKET, BY PURITY GRADE, 2018-2033 (USD THOUSAND)
TABLE 2956 TAIWAN AVIONICS DISPLAYS IN INDIUM MARKET, BY PURITY GRADE, 2018-2033 (USD THOUSAND)
TABLE 2957 TAIWAN SPACECRAFT SOLAR PANELS IN INDIUM MARKET, BY PURITY GRADE, 2018-2033 (USD THOUSAND)
TABLE 2958 TAIWAN THERMAL MATERIALS IN INDIUM MARKET, BY PURITY GRADE, 2018-2033 (USD THOUSAND)
TABLE 2959 TAIWAN CRYOGENIC MATERIALS IN INDIUM MARKET, BY PURITY GRADE, 2018-2033 (USD THOUSAND)
TABLE 2960 TAIWAN MEDICAL DEVICE INDUSTRY IN INDIUM MARKET, BY TYPE, 2018-2033 (USD THOUSAND)
TABLE 2961 TAIWAN MEDICAL IMAGING SENSORS IN INDIUM MARKET, BY PURITY GRADE, 2018-2033 (USD THOUSAND)
TABLE 2962 TAIWAN DIAGNOSTIC EQUIPMENT DISPLAYS IN INDIUM MARKET, BY PURITY GRADE, 2018-2033 (USD THOUSAND)
TABLE 2963 TAIWAN ADVANCED DIAGNOSTIC INSTRUMENTS IN INDIUM MARKET, BY PURITY GRADE, 2018-2033 (USD THOUSAND)
TABLE 2964 TAIWAN LASER SURGICAL EQUIPMENT IN INDIUM MARKET, BY PURITY GRADE, 2018-2033 (USD THOUSAND)
TABLE 2965 TAIWAN BIOMEDICAL OPTICAL DEVICES IN INDIUM MARKET, BY PURITY GRADE, 2018-2033 (USD THOUSAND)
TABLE 2966 TAIWAN RADIATION DETECTION EQUIPMENT IN INDIUM MARKET, BY PURITY GRADE, 2018-2033 (USD THOUSAND)
TABLE 2967 TAIWAN INFRARED MEDICAL SENSORS IN INDIUM MARKET, BY PURITY GRADE, 2018-2033 (USD THOUSAND)
TABLE 2968 TAIWAN PHOTOTHERAPY DEVICES IN INDIUM MARKET, BY PURITY GRADE, 2018-2033 (USD THOUSAND)
TABLE 2969 TAIWAN INDUSTRIAL EQUIPMENT MANUFACTURING IN INDIUM MARKET, BY TYPE, 2018-2033 (USD THOUSAND)
TABLE 2970 TAIWAN INDUSTRIAL SENSORS IN INDIUM MARKET, BY PURITY GRADE, 2018-2033 (USD THOUSAND)
TABLE 2971 TAIWAN VACUUM DEPOSITION COATINGS IN INDIUM MARKET, BY PURITY GRADE, 2018-2033 (USD THOUSAND)
TABLE 2972 TAIWAN PRECISION OPTICAL COMPONENTS IN INDIUM MARKET, BY PURITY GRADE, 2018-2033 (USD THOUSAND)
TABLE 2973 TAIWAN THERMAL INTERFACE MATERIALS IN INDIUM MARKET, BY PURITY GRADE, 2018-2033 (USD THOUSAND)
TABLE 2974 TAIWAN INDUSTRIAL LASER SYSTEMS IN INDIUM MARKET, BY PURITY GRADE, 2018-2033 (USD THOUSAND)
TABLE 2975 TAIWAN INDUSTRIAL INFRARED DETECTORS IN INDIUM MARKET, BY PURITY GRADE, 2018-2033 (USD THOUSAND)
TABLE 2976 TAIWAN PRECISION MEASUREMENT EQUIPMENT IN INDIUM MARKET, BY PURITY GRADE, 2018-2033 (USD THOUSAND)
TABLE 2977 TAIWAN SPECIALTY ELECTRONIC COMPONENTS IN INDIUM MARKET, BY PURITY GRADE, 2018-2033 (USD THOUSAND)
TABLE 2978 TAIWAN OTHERS IN INDIUM MARKET, BY TYPE, 2018-2033 (USD THOUSAND)
TABLE 2979 TAIWAN ADVANCED MATERIALS MANUFACTURING IN INDIUM MARKET, BY PURITY GRADE, 2018-2033 (USD THOUSAND)
TABLE 2980 TAIWAN SPECIALTY ALLOY PRODUCTION IN INDIUM MARKET, BY PURITY GRADE, 2018-2033 (USD THOUSAND)
TABLE 2981 TAIWAN THERMAL MANAGEMENT MATERIALS IN INDIUM MARKET, BY PURITY GRADE, 2018-2033 (USD THOUSAND)
TABLE 2982 TAIWAN PRECISION SCIENTIFIC INSTRUMENTS IN INDIUM MARKET, BY PURITY GRADE, 2018-2033 (USD THOUSAND)
TABLE 2983 TAIWAN RESEARCH INSTITUTES & UNIVERSITIES IN INDIUM MARKET, BY PURITY GRADE, 2018-2033 (USD THOUSAND)
TABLE 2984 TAIWAN NUCLEAR INDUSTRY APPLICATIONS IN INDIUM MARKET, BY PURITY GRADE, 2018-2033 (USD THOUSAND)
TABLE 2985 TAIWAN SPECIALTY CHEMICAL PRODUCTION IN INDIUM MARKET, BY PURITY GRADE, 2018-2033 (USD THOUSAND)
TABLE 2986 TAIWAN DEFENSE RESEARCH LABORATORIES IN INDIUM MARKET, BY PURITY GRADE, 2018-2033 (USD THOUSAND)
TABLE 2987 TAIWAN CRYOGENIC EQUIPMENT MANUFACTURING IN INDIUM MARKET, BY PURITY GRADE, 2018-2033 (USD THOUSAND)
TABLE 2988 INDIA INDIUM MARKET, BY PRODUCT TYPE, 2018-2033 (USD THOUSAND)
TABLE 2989 INDIA INGOTS IN INDIUM MARKET, BY TYPE, 2018-2033 (USD THOUSAND)
TABLE 2990 INDIA INDIUM MARKET, BY MATERIAL COMPOSITION, 2018-2033 (USD THOUSAND)
TABLE 2991 INDIA INDIUM ALLOYS IN INDIUM MARKET, BY TYPE, 2018-2033 (USD THOUSAND)
TABLE 2992 INDIA INDIUM COMPOUNDS IN INDIUM MARKET, BY TYPE, 2018-2033 (USD THOUSAND)
TABLE 2993 INDIA INDIUM MARKET, BY PURITY GRADE, 2018-2033 (USD THOUSAND)
TABLE 2994 INDIA INDIUM MARKET, BY EXTRACTION SOURCE, 2018-2033 (USD THOUSAND)
TABLE 2995 INDIA PRIMARY PRODUCTION IN INDIUM MARKET, BY TYPE, 2018-2033 (USD THOUSAND)
TABLE 2996 INDIA SECONDARY PRODUCTION IN INDIUM MARKET, BY TYPE, 2018-2033 (USD THOUSAND)
TABLE 2997 INDIA INDIUM MARKET, BY DISTRIBUTION CHANNEL, 2018-2033 (USD THOUSAND)
TABLE 2998 INDIA INDIUM MARKET, BY TECHNOLOGY PLATFORM, 2018-2033 (USD THOUSAND)
TABLE 2999 INDIA INDIUM MARKET, BY END-USER INDUSTRY, 2018-2033 (USD THOUSAND)
TABLE 3000 INDIA CONSUMER ELECTRONICS INDUSTRY IN INDIUM MARKET, BY TYPE, 2018-2033 (USD THOUSAND)
TABLE 3001 INDIA FLAT PANEL DISPLAYS (LCD/OLED/LED) IN INDIUM MARKET, BY PURITY GRADE, 2018-2033 (USD THOUSAND)
TABLE 3002 INDIA TRANSPARENT CONDUCTIVE COATINGS (ITO) IN INDIUM MARKET, BY PURITY GRADE, 2018-2033 (USD THOUSAND)
TABLE 3003 INDIA TOUCHSCREEN DISPLAYS IN INDIUM MARKET, BY PURITY GRADE, 2018-2033 (USD THOUSAND)
TABLE 3004 INDIA FLEXIBLE DISPLAYS & ELECTRONICS IN INDIUM MARKET, BY PURITY GRADE, 2018-2033 (USD THOUSAND)
TABLE 3005 INDIA WEARABLE ELECTRONICS DEVICES IN INDIUM MARKET, BY PURITY GRADE, 2018-2033 (USD THOUSAND)
TABLE 3006 INDIA CAMERA & OPTICAL SENSORS IN INDIUM MARKET, BY PURITY GRADE, 2018-2033 (USD THOUSAND)
TABLE 3007 INDIA MINI-LED BACKLIGHTING IN INDIUM MARKET, BY PURITY GRADE, 2018-2033 (USD THOUSAND)
TABLE 3008 INDIA MICRO-LED DISPLAYS IN INDIUM MARKET, BY PURITY GRADE, 2018-2033 (USD THOUSAND)
TABLE 3009 INDIA DISPLAY PANEL INDUSTRY IN INDIUM MARKET, BY TYPE, 2018-2033 (USD THOUSAND)
TABLE 3010 INDIA LCD PANEL MANUFACTURING IN INDIUM MARKET, BY PURITY GRADE, 2018-2033 (USD THOUSAND)
TABLE 3011 INDIA OLED PANEL MANUFACTURING IN INDIUM MARKET, BY PURITY GRADE, 2018-2033 (USD THOUSAND)
TABLE 3012 INDIA DISPLAY PANEL MANUFACTURING IN INDIUM MARKET, BY PURITY GRADE, 2018-2033 (USD THOUSAND)
TABLE 3013 INDIA TOUCH PANEL SENSORS IN INDIUM MARKET, BY PURITY GRADE, 2018-2033 (USD THOUSAND)
TABLE 3014 INDIA TRANSPARENT CONDUCTIVE FILMS IN INDIUM MARKET, BY PURITY GRADE, 2018-2033 (USD THOUSAND)
TABLE 3015 INDIA FLEXIBLE & FOLDABLE DISPLAYS IN INDIUM MARKET, BY PURITY GRADE, 2018-2033 (USD THOUSAND)
TABLE 3016 INDIA AR/VR DISPLAYS IN INDIUM MARKET, BY PURITY GRADE, 2018-2033 (USD THOUSAND)
TABLE 3017 INDIA MICRODISPLAY DEVICES IN INDIUM MARKET, BY PURITY GRADE, 2018-2033 (USD THOUSAND)
TABLE 3018 INDIA BACKPLANE COATINGS IN INDIUM MARKET, BY PURITY GRADE, 2018-2033 (USD THOUSAND)
TABLE 3019 INDIA SEMICONDUCTOR INDUSTRY IN INDIUM MARKET, BY TYPE, 2018-2033 (USD THOUSAND)
TABLE 3020 INDIA III-V COMPOUND SEMICONDUCTORS IN INDIUM MARKET, BY PURITY GRADE, 2018-2033 (USD THOUSAND)
TABLE 3021 INDIA HIGH-FREQUENCY RF COMPONENTS IN INDIUM MARKET, BY PURITY GRADE, 2018-2033 (USD THOUSAND)
TABLE 3022 INDIA SEMICONDUCTOR SUBSTRATES & EPITAXY IN INDIUM MARKET, BY PURITY GRADE, 2018-2033 (USD THOUSAND)
TABLE 3023 INDIA LASER DIODES IN INDIUM MARKET, BY PURITY GRADE, 2018-2033 (USD THOUSAND)
TABLE 3024 INDIA PHOTODETECTORS IN INDIUM MARKET, BY PURITY GRADE, 2018-2033 (USD THOUSAND)
TABLE 3025 INDIA HIGH-SPEED OPTOELECTRONICS IN INDIUM MARKET, BY PURITY GRADE, 2018-2033 (USD THOUSAND)
TABLE 3026 INDIA INFRARED DETECTORS IN INDIUM MARKET, BY PURITY GRADE, 2018-2033 (USD THOUSAND)
TABLE 3027 INDIA INTEGRATED PHOTONIC CIRCUITS IN INDIUM MARKET, BY PURITY GRADE, 2018-2033 (USD THOUSAND)
TABLE 3028 INDIA SOLAR PHOTOVOLTAIC INDUSTRY IN INDIUM MARKET, BY TYPE, 2018-2033 (USD THOUSAND)
TABLE 3029 INDIA CIGS THIN-FILM SOLAR CELLS IN INDIUM MARKET, BY PURITY GRADE, 2018-2033 (USD THOUSAND)
TABLE 3030 INDIAHIGH-EFFICIENCY MODULES IN INDIUM MARKET, BY PURITY GRADE, 2018-2033 (USD THOUSAND)
TABLE 3031 INDIA THIN-FILM COATINGS IN INDIUM MARKET, BY PURITY GRADE, 2018-2033 (USD THOUSAND)
TABLE 3032 INDIA TRANSPARENT ELECTRODES IN INDIUM MARKET, BY PURITY GRADE, 2018-2033 (USD THOUSAND)
TABLE 3033 INDIA BIPV IN INDIUM MARKET, BY PURITY GRADE, 2018-2033 (USD THOUSAND)
TABLE 3034 INDIA FLEXIBLE SOLAR PANELS IN INDIUM MARKET, BY PURITY GRADE, 2018-2033 (USD THOUSAND)
TABLE 3035 INDIA PORTABLE SOLAR SYSTEMS IN INDIUM MARKET, BY PURITY GRADE, 2018-2033 (USD THOUSAND)
TABLE 3036 INDIA CONCENTRATED PV IN INDIUM MARKET, BY PURITY GRADE, 2018-2033 (USD THOUSAND)
TABLE 3037 INDIA AUTOMOTIVE INDUSTRY IN INDIUM MARKET, BY TYPE, 2018-2033 (USD THOUSAND)
TABLE 3038 INDIA AUTOMOTIVE DISPLAY PANELS IN INDIUM MARKET, BY PURITY GRADE, 2018-2033 (USD THOUSAND)
TABLE 3039 INDIAADAS SENSORS IN INDIUM MARKET, BY PURITY GRADE, 2018-2033 (USD THOUSAND)
TABLE 3040 INDIA VEHICLE CAMERA MODULES IN INDIUM MARKET, BY PURITY GRADE, 2018-2033 (USD THOUSAND)
TABLE 3041 INDIA AUTOMOTIVE OPTOELECTRONICS IN INDIUM MARKET, BY PURITY GRADE, 2018-2033 (USD THOUSAND)
TABLE 3042 INDIA POWER ELECTRONICS IN INDIUM MARKET, BY PURITY GRADE, 2018-2033 (USD THOUSAND)
TABLE 3043 INDIA TOUCHSCREEN INTERFACES IN INDIUM MARKET, BY PURITY GRADE, 2018-2033 (USD THOUSAND)
TABLE 3044 INDIA INFRARED SENSORS IN INDIUM MARKET, BY PURITY GRADE, 2018-2033 (USD THOUSAND)
TABLE 3045 INDIA SMART LIGHTING IN INDIUM MARKET, BY PURITY GRADE, 2018-2033 (USD THOUSAND)
TABLE 3046 INDIA TELECOMMUNICATION EQUIPMENT INDUSTRY IN INDIUM MARKET, BY TYPE, 2018-2033 (USD THOUSAND)
TABLE 3047 INDIA OPTICAL TRANSCEIVERS IN INDIUM MARKET, BY PURITY GRADE, 2018-2033 (USD THOUSAND)
TABLE 3048 INDIA RF POWER AMPLIFIERS IN INDIUM MARKET, BY PURITY GRADE, 2018-2033 (USD THOUSAND)
TABLE 3049 INDIA HIGH-FREQUENCY COMMUNICATION CHIPS IN INDIUM MARKET, BY PURITY GRADE, 2018-2033 (USD THOUSAND)
TABLE 3050 INDIA FIBER-OPTIC COMMUNICATION LASERS IN INDIUM MARKET, BY PURITY GRADE, 2018-2033 (USD THOUSAND)
TABLE 3051 INDIA PHOTODETECTORS FOR OPTICAL NETWORKS IN INDIUM MARKET, BY PURITY GRADE, 2018-2033 (USD THOUSAND)
TABLE 3052 INDIA 5G INFRASTRUCTURE COMPONENTS IN INDIUM MARKET, BY PURITY GRADE, 2018-2033 (USD THOUSAND)
TABLE 3053 INDIA OPTICAL NETWORK SWITCHING DEVICES IN INDIUM MARKET, BY PURITY GRADE, 2018-2033 (USD THOUSAND)
TABLE 3054 INDIA SATELLITE COMMUNICATION MODULES IN INDIUM MARKET, BY PURITY GRADE, 2018-2033 (USD THOUSAND)
TABLE 3055 INDIA OPTICAL & PHOTONICS INDUSTRY IN INDIUM MARKET, BY TYPE, 2018-2033 (USD THOUSAND)
TABLE 3056 INDIA OPTICAL COATINGS IN INDIUM MARKET, BY PURITY GRADE, 2018-2033 (USD THOUSAND)
TABLE 3057 INDIA FIBER OPTIC COMPONENTS IN INDIUM MARKET, BY PURITY GRADE, 2018-2033 (USD THOUSAND)
TABLE 3058 INDIA LASER COMPONENTS IN INDIUM MARKET, BY PURITY GRADE, 2018-2033 (USD THOUSAND)
TABLE 3059 INDIA OPTICAL SENSORS IN INDIUM MARKET, BY PURITY GRADE, 2018-2033 (USD THOUSAND)
TABLE 3060 INDIA INFRARED OPTICS IN INDIUM MARKET, BY PURITY GRADE, 2018-2033 (USD THOUSAND)
TABLE 3061 INDIA PICS IN INDIUM MARKET, BY PURITY GRADE, 2018-2033 (USD THOUSAND)
TABLE 3062 INDIA MIRRORS IN INDIUM MARKET, BY PURITY GRADE, 2018-2033 (USD THOUSAND)
TABLE 3063 INDIA SPECTROSCOPY IN INDIUM MARKET, BY PURITY GRADE, 2018-2033 (USD THOUSAND)
TABLE 3064 INDIA AEROSPACE & DEFENSE INDUSTRY IN INDIUM MARKET, BY TYPE, 2018-2033 (USD THOUSAND)
TABLE 3065 INDIA INFRARED IMAGING SYSTEMS IN INDIUM MARKET, BY PURITY GRADE, 2018-2033 (USD THOUSAND)
TABLE 3066 INDIA RADAR & RF COMPONENTS IN INDIUM MARKET, BY PURITY GRADE, 2018-2033 (USD THOUSAND)
TABLE 3067 INDIA SATELLITE COMMUNICATION IN INDIUM MARKET, BY PURITY GRADE, 2018-2033 (USD THOUSAND)
TABLE 3068 INDIA MILITARY OPTOELECTRONICS IN INDIUM MARKET, BY PURITY GRADE, 2018-2033 (USD THOUSAND)
TABLE 3069 INDIA AVIONICS DISPLAYS IN INDIUM MARKET, BY PURITY GRADE, 2018-2033 (USD THOUSAND)
TABLE 3070 INDIA SPACECRAFT SOLAR PANELS IN INDIUM MARKET, BY PURITY GRADE, 2018-2033 (USD THOUSAND)
TABLE 3071 INDIA THERMAL MATERIALS IN INDIUM MARKET, BY PURITY GRADE, 2018-2033 (USD THOUSAND)
TABLE 3072 INDIA CRYOGENIC MATERIALS IN INDIUM MARKET, BY PURITY GRADE, 2018-2033 (USD THOUSAND)
TABLE 3073 INDIA MEDICAL DEVICE INDUSTRY IN INDIUM MARKET, BY TYPE, 2018-2033 (USD THOUSAND)
TABLE 3074 INDIA MEDICAL IMAGING SENSORS IN INDIUM MARKET, BY PURITY GRADE, 2018-2033 (USD THOUSAND)
TABLE 3075 INDIA DIAGNOSTIC EQUIPMENT DISPLAYS IN INDIUM MARKET, BY PURITY GRADE, 2018-2033 (USD THOUSAND)
TABLE 3076 INDIA ADVANCED DIAGNOSTIC INSTRUMENTS IN INDIUM MARKET, BY PURITY GRADE, 2018-2033 (USD THOUSAND)
TABLE 3077 INDIA LASER SURGICAL EQUIPMENT IN INDIUM MARKET, BY PURITY GRADE, 2018-2033 (USD THOUSAND)
TABLE 3078 INDIA BIOMEDICAL OPTICAL DEVICES IN INDIUM MARKET, BY PURITY GRADE, 2018-2033 (USD THOUSAND)
TABLE 3079 INDIA RADIATION DETECTION EQUIPMENT IN INDIUM MARKET, BY PURITY GRADE, 2018-2033 (USD THOUSAND)
TABLE 3080 INDIA INFRARED MEDICAL SENSORS IN INDIUM MARKET, BY PURITY GRADE, 2018-2033 (USD THOUSAND)
TABLE 3081 INDIA PHOTOTHERAPY DEVICES IN INDIUM MARKET, BY PURITY GRADE, 2018-2033 (USD THOUSAND)
TABLE 3082 INDIA INDUSTRIAL EQUIPMENT MANUFACTURING IN INDIUM MARKET, BY TYPE, 2018-2033 (USD THOUSAND)
TABLE 3083 INDIA INDUSTRIAL SENSORS IN INDIUM MARKET, BY PURITY GRADE, 2018-2033 (USD THOUSAND)
TABLE 3084 INDIA VACUUM DEPOSITION COATINGS IN INDIUM MARKET, BY PURITY GRADE, 2018-2033 (USD THOUSAND)
TABLE 3085 INDIA PRECISION OPTICAL COMPONENTS IN INDIUM MARKET, BY PURITY GRADE, 2018-2033 (USD THOUSAND)
TABLE 3086 INDIA THERMAL INTERFACE MATERIALS IN INDIUM MARKET, BY PURITY GRADE, 2018-2033 (USD THOUSAND)
TABLE 3087 INDIA INDUSTRIAL LASER SYSTEMS IN INDIUM MARKET, BY PURITY GRADE, 2018-2033 (USD THOUSAND)
TABLE 3088 INDIA INDUSTRIAL INFRARED DETECTORS IN INDIUM MARKET, BY PURITY GRADE, 2018-2033 (USD THOUSAND)
TABLE 3089 INDIA PRECISION MEASUREMENT EQUIPMENT IN INDIUM MARKET, BY PURITY GRADE, 2018-2033 (USD THOUSAND)
TABLE 3090 INDIA SPECIALTY ELECTRONIC COMPONENTS IN INDIUM MARKET, BY PURITY GRADE, 2018-2033 (USD THOUSAND)
TABLE 3091 INDIA OTHERS IN INDIUM MARKET, BY TYPE, 2018-2033 (USD THOUSAND)
TABLE 3092 INDIA ADVANCED MATERIALS MANUFACTURING IN INDIUM MARKET, BY PURITY GRADE, 2018-2033 (USD THOUSAND)
TABLE 3093 INDIA SPECIALTY ALLOY PRODUCTION IN INDIUM MARKET, BY PURITY GRADE, 2018-2033 (USD THOUSAND)
TABLE 3094 INDIA THERMAL MANAGEMENT MATERIALS IN INDIUM MARKET, BY PURITY GRADE, 2018-2033 (USD THOUSAND)
TABLE 3095 INDIA PRECISION SCIENTIFIC INSTRUMENTS IN INDIUM MARKET, BY PURITY GRADE, 2018-2033 (USD THOUSAND)
TABLE 3096 INDIA RESEARCH INSTITUTES & UNIVERSITIES IN INDIUM MARKET, BY PURITY GRADE, 2018-2033 (USD THOUSAND)
TABLE 3097 INDIA NUCLEAR INDUSTRY APPLICATIONS IN INDIUM MARKET, BY PURITY GRADE, 2018-2033 (USD THOUSAND)
TABLE 3098 INDIA SPECIALTY CHEMICAL PRODUCTION IN INDIUM MARKET, BY PURITY GRADE, 2018-2033 (USD THOUSAND)
TABLE 3099 INDIA DEFENSE RESEARCH LABORATORIES IN INDIUM MARKET, BY PURITY GRADE, 2018-2033 (USD THOUSAND)
TABLE 3100 INDIA CRYOGENIC EQUIPMENT MANUFACTURING IN INDIUM MARKET, BY PURITY GRADE, 2018-2033 (USD THOUSAND)
TABLE 3101 AUSTRALIA INDIUM MARKET, BY PRODUCT TYPE, 2018-2033 (USD THOUSAND)
TABLE 3102 AUSTRALIA INGOTS IN INDIUM MARKET, BY TYPE, 2018-2033 (USD THOUSAND)
TABLE 3103 AUSTRALIA INDIUM MARKET, BY MATERIAL COMPOSITION, 2018-2033 (USD THOUSAND)
TABLE 3104 AUSTRALIA INDIUM ALLOYS IN INDIUM MARKET, BY TYPE, 2018-2033 (USD THOUSAND)
TABLE 3105 AUSTRALIA INDIUM COMPOUNDS IN INDIUM MARKET, BY TYPE, 2018-2033 (USD THOUSAND)
TABLE 3106 AUSTRALIA INDIUM MARKET, BY PURITY GRADE, 2018-2033 (USD THOUSAND)
TABLE 3107 AUSTRALIA INDIUM MARKET, BY EXTRACTION SOURCE, 2018-2033 (USD THOUSAND)
TABLE 3108 AUSTRALIA PRIMARY PRODUCTION IN INDIUM MARKET, BY TYPE, 2018-2033 (USD THOUSAND)
TABLE 3109 AUSTRALIA SECONDARY PRODUCTION IN INDIUM MARKET, BY TYPE, 2018-2033 (USD THOUSAND)
TABLE 3110 AUSTRALIA INDIUM MARKET, BY DISTRIBUTION CHANNEL, 2018-2033 (USD THOUSAND)
TABLE 3111 AUSTRALIA INDIUM MARKET, BY TECHNOLOGY PLATFORM, 2018-2033 (USD THOUSAND)
TABLE 3112 AUSTRALIA INDIUM MARKET, BY END-USER INDUSTRY, 2018-2033 (USD THOUSAND)
TABLE 3113 AUSTRALIA CONSUMER ELECTRONICS INDUSTRY IN INDIUM MARKET, BY TYPE, 2018-2033 (USD THOUSAND)
TABLE 3114 AUSTRALIA FLAT PANEL DISPLAYS (LCD/OLED/LED) IN INDIUM MARKET, BY PURITY GRADE, 2018-2033 (USD THOUSAND)
TABLE 3115 AUSTRALIA TRANSPARENT CONDUCTIVE COATINGS (ITO) IN INDIUM MARKET, BY PURITY GRADE, 2018-2033 (USD THOUSAND)
TABLE 3116 AUSTRALIA TOUCHSCREEN DISPLAYS IN INDIUM MARKET, BY PURITY GRADE, 2018-2033 (USD THOUSAND)
TABLE 3117 AUSTRALIA FLEXIBLE DISPLAYS & ELECTRONICS IN INDIUM MARKET, BY PURITY GRADE, 2018-2033 (USD THOUSAND)
TABLE 3118 AUSTRALIA WEARABLE ELECTRONICS DEVICES IN INDIUM MARKET, BY PURITY GRADE, 2018-2033 (USD THOUSAND)
TABLE 3119 AUSTRALIA CAMERA & OPTICAL SENSORS IN INDIUM MARKET, BY PURITY GRADE, 2018-2033 (USD THOUSAND)
TABLE 3120 AUSTRALIA MINI-LED BACKLIGHTING IN INDIUM MARKET, BY PURITY GRADE, 2018-2033 (USD THOUSAND)
TABLE 3121 AUSTRALIA MICRO-LED DISPLAYS IN INDIUM MARKET, BY PURITY GRADE, 2018-2033 (USD THOUSAND)
TABLE 3122 AUSTRALIA DISPLAY PANEL INDUSTRY IN INDIUM MARKET, BY TYPE, 2018-2033 (USD THOUSAND)
TABLE 3123 AUSTRALIA LCD PANEL MANUFACTURING IN INDIUM MARKET, BY PURITY GRADE, 2018-2033 (USD THOUSAND)
TABLE 3124 AUSTRALIA OLED PANEL MANUFACTURING IN INDIUM MARKET, BY PURITY GRADE, 2018-2033 (USD THOUSAND)
TABLE 3125 AUSTRALIA DISPLAY PANEL MANUFACTURING IN INDIUM MARKET, BY PURITY GRADE, 2018-2033 (USD THOUSAND)
TABLE 3126 AUSTRALIA TOUCH PANEL SENSORS IN INDIUM MARKET, BY PURITY GRADE, 2018-2033 (USD THOUSAND)
TABLE 3127 AUSTRALIA TRANSPARENT CONDUCTIVE FILMS IN INDIUM MARKET, BY PURITY GRADE, 2018-2033 (USD THOUSAND)
TABLE 3128 AUSTRALIA FLEXIBLE & FOLDABLE DISPLAYS IN INDIUM MARKET, BY PURITY GRADE, 2018-2033 (USD THOUSAND)
TABLE 3129 AUSTRALIA AR/VR DISPLAYS IN INDIUM MARKET, BY PURITY GRADE, 2018-2033 (USD THOUSAND)
TABLE 3130 AUSTRALIA MICRODISPLAY DEVICES IN INDIUM MARKET, BY PURITY GRADE, 2018-2033 (USD THOUSAND)
TABLE 3131 AUSTRALIA BACKPLANE COATINGS IN INDIUM MARKET, BY PURITY GRADE, 2018-2033 (USD THOUSAND)
TABLE 3132 AUSTRALIA SEMICONDUCTOR INDUSTRY IN INDIUM MARKET, BY TYPE, 2018-2033 (USD THOUSAND)
TABLE 3133 AUSTRALIA III-V COMPOUND SEMICONDUCTORS IN INDIUM MARKET, BY PURITY GRADE, 2018-2033 (USD THOUSAND)
TABLE 3134 AUSTRALIA HIGH-FREQUENCY RF COMPONENTS IN INDIUM MARKET, BY PURITY GRADE, 2018-2033 (USD THOUSAND)
TABLE 3135 AUSTRALIA SEMICONDUCTOR SUBSTRATES & EPITAXY IN INDIUM MARKET, BY PURITY GRADE, 2018-2033 (USD THOUSAND)
TABLE 3136 AUSTRALIA LASER DIODES IN INDIUM MARKET, BY PURITY GRADE, 2018-2033 (USD THOUSAND)
TABLE 3137 AUSTRALIA PHOTODETECTORS IN INDIUM MARKET, BY PURITY GRADE, 2018-2033 (USD THOUSAND)
TABLE 3138 AUSTRALIA HIGH-SPEED OPTOELECTRONICS IN INDIUM MARKET, BY PURITY GRADE, 2018-2033 (USD THOUSAND)
TABLE 3139 AUSTRALIA INFRARED DETECTORS IN INDIUM MARKET, BY PURITY GRADE, 2018-2033 (USD THOUSAND)
TABLE 3140 AUSTRALIA INTEGRATED PHOTONIC CIRCUITS IN INDIUM MARKET, BY PURITY GRADE, 2018-2033 (USD THOUSAND)
TABLE 3141 AUSTRALIA SOLAR PHOTOVOLTAIC INDUSTRY IN INDIUM MARKET, BY TYPE, 2018-2033 (USD THOUSAND)
TABLE 3142 AUSTRALIA CIGS THIN-FILM SOLAR CELLS IN INDIUM MARKET, BY PURITY GRADE, 2018-2033 (USD THOUSAND)
TABLE 3143 AUSTRALIAHIGH-EFFICIENCY MODULES IN INDIUM MARKET, BY PURITY GRADE, 2018-2033 (USD THOUSAND)
TABLE 3144 AUSTRALIA THIN-FILM COATINGS IN INDIUM MARKET, BY PURITY GRADE, 2018-2033 (USD THOUSAND)
TABLE 3145 AUSTRALIA TRANSPARENT ELECTRODES IN INDIUM MARKET, BY PURITY GRADE, 2018-2033 (USD THOUSAND)
TABLE 3146 AUSTRALIA BIPV IN INDIUM MARKET, BY PURITY GRADE, 2018-2033 (USD THOUSAND)
TABLE 3147 AUSTRALIA FLEXIBLE SOLAR PANELS IN INDIUM MARKET, BY PURITY GRADE, 2018-2033 (USD THOUSAND)
TABLE 3148 AUSTRALIA PORTABLE SOLAR SYSTEMS IN INDIUM MARKET, BY PURITY GRADE, 2018-2033 (USD THOUSAND)
TABLE 3149 AUSTRALIA CONCENTRATED PV IN INDIUM MARKET, BY PURITY GRADE, 2018-2033 (USD THOUSAND)
TABLE 3150 AUSTRALIA AUTOMOTIVE INDUSTRY IN INDIUM MARKET, BY TYPE, 2018-2033 (USD THOUSAND)
TABLE 3151 AUSTRALIA AUTOMOTIVE DISPLAY PANELS IN INDIUM MARKET, BY PURITY GRADE, 2018-2033 (USD THOUSAND)
TABLE 3152 AUSTRALIAADAS SENSORS IN INDIUM MARKET, BY PURITY GRADE, 2018-2033 (USD THOUSAND)
TABLE 3153 AUSTRALIA VEHICLE CAMERA MODULES IN INDIUM MARKET, BY PURITY GRADE, 2018-2033 (USD THOUSAND)
TABLE 3154 AUSTRALIA AUTOMOTIVE OPTOELECTRONICS IN INDIUM MARKET, BY PURITY GRADE, 2018-2033 (USD THOUSAND)
TABLE 3155 AUSTRALIA POWER ELECTRONICS IN INDIUM MARKET, BY PURITY GRADE, 2018-2033 (USD THOUSAND)
TABLE 3156 AUSTRALIA TOUCHSCREEN INTERFACES IN INDIUM MARKET, BY PURITY GRADE, 2018-2033 (USD THOUSAND)
TABLE 3157 AUSTRALIA INFRARED SENSORS IN INDIUM MARKET, BY PURITY GRADE, 2018-2033 (USD THOUSAND)
TABLE 3158 AUSTRALIA SMART LIGHTING IN INDIUM MARKET, BY PURITY GRADE, 2018-2033 (USD THOUSAND)
TABLE 3159 AUSTRALIA TELECOMMUNICATION EQUIPMENT INDUSTRY IN INDIUM MARKET, BY TYPE, 2018-2033 (USD THOUSAND)
TABLE 3160 AUSTRALIA OPTICAL TRANSCEIVERS IN INDIUM MARKET, BY PURITY GRADE, 2018-2033 (USD THOUSAND)
TABLE 3161 AUSTRALIA RF POWER AMPLIFIERS IN INDIUM MARKET, BY PURITY GRADE, 2018-2033 (USD THOUSAND)
TABLE 3162 AUSTRALIA HIGH-FREQUENCY COMMUNICATION CHIPS IN INDIUM MARKET, BY PURITY GRADE, 2018-2033 (USD THOUSAND)
TABLE 3163 AUSTRALIA FIBER-OPTIC COMMUNICATION LASERS IN INDIUM MARKET, BY PURITY GRADE, 2018-2033 (USD THOUSAND)
TABLE 3164 AUSTRALIA PHOTODETECTORS FOR OPTICAL NETWORKS IN INDIUM MARKET, BY PURITY GRADE, 2018-2033 (USD THOUSAND)
TABLE 3165 AUSTRALIA 5G INFRASTRUCTURE COMPONENTS IN INDIUM MARKET, BY PURITY GRADE, 2018-2033 (USD THOUSAND)
TABLE 3166 AUSTRALIA OPTICAL NETWORK SWITCHING DEVICES IN INDIUM MARKET, BY PURITY GRADE, 2018-2033 (USD THOUSAND)
TABLE 3167 AUSTRALIA SATELLITE COMMUNICATION MODULES IN INDIUM MARKET, BY PURITY GRADE, 2018-2033 (USD THOUSAND)
TABLE 3168 AUSTRALIA OPTICAL & PHOTONICS INDUSTRY IN INDIUM MARKET, BY TYPE, 2018-2033 (USD THOUSAND)
TABLE 3169 AUSTRALIA OPTICAL COATINGS IN INDIUM MARKET, BY PURITY GRADE, 2018-2033 (USD THOUSAND)
TABLE 3170 AUSTRALIA FIBER OPTIC COMPONENTS IN INDIUM MARKET, BY PURITY GRADE, 2018-2033 (USD THOUSAND)
TABLE 3171 AUSTRALIA LASER COMPONENTS IN INDIUM MARKET, BY PURITY GRADE, 2018-2033 (USD THOUSAND)
TABLE 3172 AUSTRALIA OPTICAL SENSORS IN INDIUM MARKET, BY PURITY GRADE, 2018-2033 (USD THOUSAND)
TABLE 3173 AUSTRALIA INFRARED OPTICS IN INDIUM MARKET, BY PURITY GRADE, 2018-2033 (USD THOUSAND)
TABLE 3174 AUSTRALIA PICS IN INDIUM MARKET, BY PURITY GRADE, 2018-2033 (USD THOUSAND)
TABLE 3175 AUSTRALIA MIRRORS IN INDIUM MARKET, BY PURITY GRADE, 2018-2033 (USD THOUSAND)
TABLE 3176 AUSTRALIA SPECTROSCOPY IN INDIUM MARKET, BY PURITY GRADE, 2018-2033 (USD THOUSAND)
TABLE 3177 AUSTRALIA AEROSPACE & DEFENSE INDUSTRY IN INDIUM MARKET, BY TYPE, 2018-2033 (USD THOUSAND)
TABLE 3178 AUSTRALIA INFRARED IMAGING SYSTEMS IN INDIUM MARKET, BY PURITY GRADE, 2018-2033 (USD THOUSAND)
TABLE 3179 AUSTRALIA RADAR & RF COMPONENTS IN INDIUM MARKET, BY PURITY GRADE, 2018-2033 (USD THOUSAND)
TABLE 3180 AUSTRALIA SATELLITE COMMUNICATION IN INDIUM MARKET, BY PURITY GRADE, 2018-2033 (USD THOUSAND)
TABLE 3181 AUSTRALIA MILITARY OPTOELECTRONICS IN INDIUM MARKET, BY PURITY GRADE, 2018-2033 (USD THOUSAND)
TABLE 3182 AUSTRALIA AVIONICS DISPLAYS IN INDIUM MARKET, BY PURITY GRADE, 2018-2033 (USD THOUSAND)
TABLE 3183 AUSTRALIA SPACECRAFT SOLAR PANELS IN INDIUM MARKET, BY PURITY GRADE, 2018-2033 (USD THOUSAND)
TABLE 3184 AUSTRALIA THERMAL MATERIALS IN INDIUM MARKET, BY PURITY GRADE, 2018-2033 (USD THOUSAND)
TABLE 3185 AUSTRALIA CRYOGENIC MATERIALS IN INDIUM MARKET, BY PURITY GRADE, 2018-2033 (USD THOUSAND)
TABLE 3186 AUSTRALIA MEDICAL DEVICE INDUSTRY IN INDIUM MARKET, BY TYPE, 2018-2033 (USD THOUSAND)
TABLE 3187 AUSTRALIA MEDICAL IMAGING SENSORS IN INDIUM MARKET, BY PURITY GRADE, 2018-2033 (USD THOUSAND)
TABLE 3188 AUSTRALIA DIAGNOSTIC EQUIPMENT DISPLAYS IN INDIUM MARKET, BY PURITY GRADE, 2018-2033 (USD THOUSAND)
TABLE 3189 AUSTRALIA ADVANCED DIAGNOSTIC INSTRUMENTS IN INDIUM MARKET, BY PURITY GRADE, 2018-2033 (USD THOUSAND)
TABLE 3190 AUSTRALIA LASER SURGICAL EQUIPMENT IN INDIUM MARKET, BY PURITY GRADE, 2018-2033 (USD THOUSAND)
TABLE 3191 AUSTRALIA BIOMEDICAL OPTICAL DEVICES IN INDIUM MARKET, BY PURITY GRADE, 2018-2033 (USD THOUSAND)
TABLE 3192 AUSTRALIA RADIATION DETECTION EQUIPMENT IN INDIUM MARKET, BY PURITY GRADE, 2018-2033 (USD THOUSAND)
TABLE 3193 AUSTRALIA INFRARED MEDICAL SENSORS IN INDIUM MARKET, BY PURITY GRADE, 2018-2033 (USD THOUSAND)
TABLE 3194 AUSTRALIA PHOTOTHERAPY DEVICES IN INDIUM MARKET, BY PURITY GRADE, 2018-2033 (USD THOUSAND)
TABLE 3195 AUSTRALIA INDUSTRIAL EQUIPMENT MANUFACTURING IN INDIUM MARKET, BY TYPE, 2018-2033 (USD THOUSAND)
TABLE 3196 AUSTRALIA INDUSTRIAL SENSORS IN INDIUM MARKET, BY PURITY GRADE, 2018-2033 (USD THOUSAND)
TABLE 3197 AUSTRALIA VACUUM DEPOSITION COATINGS IN INDIUM MARKET, BY PURITY GRADE, 2018-2033 (USD THOUSAND)
TABLE 3198 AUSTRALIA PRECISION OPTICAL COMPONENTS IN INDIUM MARKET, BY PURITY GRADE, 2018-2033 (USD THOUSAND)
TABLE 3199 AUSTRALIA THERMAL INTERFACE MATERIALS IN INDIUM MARKET, BY PURITY GRADE, 2018-2033 (USD THOUSAND)
TABLE 3200 AUSTRALIA INDUSTRIAL LASER SYSTEMS IN INDIUM MARKET, BY PURITY GRADE, 2018-2033 (USD THOUSAND)
TABLE 3201 AUSTRALIA INDUSTRIAL INFRARED DETECTORS IN INDIUM MARKET, BY PURITY GRADE, 2018-2033 (USD THOUSAND)
TABLE 3202 AUSTRALIA PRECISION MEASUREMENT EQUIPMENT IN INDIUM MARKET, BY PURITY GRADE, 2018-2033 (USD THOUSAND)
TABLE 3203 AUSTRALIA SPECIALTY ELECTRONIC COMPONENTS IN INDIUM MARKET, BY PURITY GRADE, 2018-2033 (USD THOUSAND)
TABLE 3204 AUSTRALIA OTHERS IN INDIUM MARKET, BY TYPE, 2018-2033 (USD THOUSAND)
TABLE 3205 AUSTRALIA ADVANCED MATERIALS MANUFACTURING IN INDIUM MARKET, BY PURITY GRADE, 2018-2033 (USD THOUSAND)
TABLE 3206 AUSTRALIA SPECIALTY ALLOY PRODUCTION IN INDIUM MARKET, BY PURITY GRADE, 2018-2033 (USD THOUSAND)
TABLE 3207 AUSTRALIA THERMAL MANAGEMENT MATERIALS IN INDIUM MARKET, BY PURITY GRADE, 2018-2033 (USD THOUSAND)
TABLE 3208 AUSTRALIA PRECISION SCIENTIFIC INSTRUMENTS IN INDIUM MARKET, BY PURITY GRADE, 2018-2033 (USD THOUSAND)
TABLE 3209 AUSTRALIA RESEARCH INSTITUTES & UNIVERSITIES IN INDIUM MARKET, BY PURITY GRADE, 2018-2033 (USD THOUSAND)
TABLE 3210 AUSTRALIA NUCLEAR INDUSTRY APPLICATIONS IN INDIUM MARKET, BY PURITY GRADE, 2018-2033 (USD THOUSAND)
TABLE 3211 AUSTRALIA SPECIALTY CHEMICAL PRODUCTION IN INDIUM MARKET, BY PURITY GRADE, 2018-2033 (USD THOUSAND)
TABLE 3212 AUSTRALIA DEFENSE RESEARCH LABORATORIES IN INDIUM MARKET, BY PURITY GRADE, 2018-2033 (USD THOUSAND)
TABLE 3213 AUSTRALIA CRYOGENIC EQUIPMENT MANUFACTURING IN INDIUM MARKET, BY PURITY GRADE, 2018-2033 (USD THOUSAND)
TABLE 3214 SINGAPORE INDIUM MARKET, BY PRODUCT TYPE, 2018-2033 (USD THOUSAND)
TABLE 3215 SINGAPORE INGOTS IN INDIUM MARKET, BY TYPE, 2018-2033 (USD THOUSAND)
TABLE 3216 SINGAPORE INDIUM MARKET, BY MATERIAL COMPOSITION, 2018-2033 (USD THOUSAND)
TABLE 3217 SINGAPORE INDIUM ALLOYS IN INDIUM MARKET, BY TYPE, 2018-2033 (USD THOUSAND)
TABLE 3218 SINGAPORE INDIUM COMPOUNDS IN INDIUM MARKET, BY TYPE, 2018-2033 (USD THOUSAND)
TABLE 3219 SINGAPORE INDIUM MARKET, BY PURITY GRADE, 2018-2033 (USD THOUSAND)
TABLE 3220 SINGAPORE INDIUM MARKET, BY EXTRACTION SOURCE, 2018-2033 (USD THOUSAND)
TABLE 3221 SINGAPORE PRIMARY PRODUCTION IN INDIUM MARKET, BY TYPE, 2018-2033 (USD THOUSAND)
TABLE 3222 SINGAPORE SECONDARY PRODUCTION IN INDIUM MARKET, BY TYPE, 2018-2033 (USD THOUSAND)
TABLE 3223 SINGAPORE INDIUM MARKET, BY DISTRIBUTION CHANNEL, 2018-2033 (USD THOUSAND)
TABLE 3224 SINGAPORE INDIUM MARKET, BY TECHNOLOGY PLATFORM, 2018-2033 (USD THOUSAND)
TABLE 3225 SINGAPORE INDIUM MARKET, BY END-USER INDUSTRY, 2018-2033 (USD THOUSAND)
TABLE 3226 SINGAPORE CONSUMER ELECTRONICS INDUSTRY IN INDIUM MARKET, BY TYPE, 2018-2033 (USD THOUSAND)
TABLE 3227 SINGAPORE FLAT PANEL DISPLAYS (LCD/OLED/LED) IN INDIUM MARKET, BY PURITY GRADE, 2018-2033 (USD THOUSAND)
TABLE 3228 SINGAPORE TRANSPARENT CONDUCTIVE COATINGS (ITO) IN INDIUM MARKET, BY PURITY GRADE, 2018-2033 (USD THOUSAND)
TABLE 3229 SINGAPORE TOUCHSCREEN DISPLAYS IN INDIUM MARKET, BY PURITY GRADE, 2018-2033 (USD THOUSAND)
TABLE 3230 SINGAPORE FLEXIBLE DISPLAYS & ELECTRONICS IN INDIUM MARKET, BY PURITY GRADE, 2018-2033 (USD THOUSAND)
TABLE 3231 SINGAPORE WEARABLE ELECTRONICS DEVICES IN INDIUM MARKET, BY PURITY GRADE, 2018-2033 (USD THOUSAND)
TABLE 3232 SINGAPORE CAMERA & OPTICAL SENSORS IN INDIUM MARKET, BY PURITY GRADE, 2018-2033 (USD THOUSAND)
TABLE 3233 SINGAPORE MINI-LED BACKLIGHTING IN INDIUM MARKET, BY PURITY GRADE, 2018-2033 (USD THOUSAND)
TABLE 3234 SINGAPORE MICRO-LED DISPLAYS IN INDIUM MARKET, BY PURITY GRADE, 2018-2033 (USD THOUSAND)
TABLE 3235 SINGAPORE DISPLAY PANEL INDUSTRY IN INDIUM MARKET, BY TYPE, 2018-2033 (USD THOUSAND)
TABLE 3236 SINGAPORE LCD PANEL MANUFACTURING IN INDIUM MARKET, BY PURITY GRADE, 2018-2033 (USD THOUSAND)
TABLE 3237 SINGAPORE OLED PANEL MANUFACTURING IN INDIUM MARKET, BY PURITY GRADE, 2018-2033 (USD THOUSAND)
TABLE 3238 SINGAPORE DISPLAY PANEL MANUFACTURING IN INDIUM MARKET, BY PURITY GRADE, 2018-2033 (USD THOUSAND)
TABLE 3239 SINGAPORE TOUCH PANEL SENSORS IN INDIUM MARKET, BY PURITY GRADE, 2018-2033 (USD THOUSAND)
TABLE 3240 SINGAPORE TRANSPARENT CONDUCTIVE FILMS IN INDIUM MARKET, BY PURITY GRADE, 2018-2033 (USD THOUSAND)
TABLE 3241 SINGAPORE FLEXIBLE & FOLDABLE DISPLAYS IN INDIUM MARKET, BY PURITY GRADE, 2018-2033 (USD THOUSAND)
TABLE 3242 SINGAPORE AR/VR DISPLAYS IN INDIUM MARKET, BY PURITY GRADE, 2018-2033 (USD THOUSAND)
TABLE 3243 SINGAPORE MICRODISPLAY DEVICES IN INDIUM MARKET, BY PURITY GRADE, 2018-2033 (USD THOUSAND)
TABLE 3244 SINGAPORE BACKPLANE COATINGS IN INDIUM MARKET, BY PURITY GRADE, 2018-2033 (USD THOUSAND)
TABLE 3245 SINGAPORE SEMICONDUCTOR INDUSTRY IN INDIUM MARKET, BY TYPE, 2018-2033 (USD THOUSAND)
TABLE 3246 SINGAPORE III-V COMPOUND SEMICONDUCTORS IN INDIUM MARKET, BY PURITY GRADE, 2018-2033 (USD THOUSAND)
TABLE 3247 SINGAPORE HIGH-FREQUENCY RF COMPONENTS IN INDIUM MARKET, BY PURITY GRADE, 2018-2033 (USD THOUSAND)
TABLE 3248 SINGAPORE SEMICONDUCTOR SUBSTRATES & EPITAXY IN INDIUM MARKET, BY PURITY GRADE, 2018-2033 (USD THOUSAND)
TABLE 3249 SINGAPORE LASER DIODES IN INDIUM MARKET, BY PURITY GRADE, 2018-2033 (USD THOUSAND)
TABLE 3250 SINGAPORE PHOTODETECTORS IN INDIUM MARKET, BY PURITY GRADE, 2018-2033 (USD THOUSAND)
TABLE 3251 SINGAPORE HIGH-SPEED OPTOELECTRONICS IN INDIUM MARKET, BY PURITY GRADE, 2018-2033 (USD THOUSAND)
TABLE 3252 SINGAPORE INFRARED DETECTORS IN INDIUM MARKET, BY PURITY GRADE, 2018-2033 (USD THOUSAND)
TABLE 3253 SINGAPORE INTEGRATED PHOTONIC CIRCUITS IN INDIUM MARKET, BY PURITY GRADE, 2018-2033 (USD THOUSAND)
TABLE 3254 SINGAPORE SOLAR PHOTOVOLTAIC INDUSTRY IN INDIUM MARKET, BY TYPE, 2018-2033 (USD THOUSAND)
TABLE 3255 SINGAPORE CIGS THIN-FILM SOLAR CELLS IN INDIUM MARKET, BY PURITY GRADE, 2018-2033 (USD THOUSAND)
TABLE 3256 SINGAPOREHIGH-EFFICIENCY MODULES IN INDIUM MARKET, BY PURITY GRADE, 2018-2033 (USD THOUSAND)
TABLE 3257 SINGAPORE THIN-FILM COATINGS IN INDIUM MARKET, BY PURITY GRADE, 2018-2033 (USD THOUSAND)
TABLE 3258 SINGAPORE TRANSPARENT ELECTRODES IN INDIUM MARKET, BY PURITY GRADE, 2018-2033 (USD THOUSAND)
TABLE 3259 SINGAPORE BIPV IN INDIUM MARKET, BY PURITY GRADE, 2018-2033 (USD THOUSAND)
TABLE 3260 SINGAPORE FLEXIBLE SOLAR PANELS IN INDIUM MARKET, BY PURITY GRADE, 2018-2033 (USD THOUSAND)
TABLE 3261 SINGAPORE PORTABLE SOLAR SYSTEMS IN INDIUM MARKET, BY PURITY GRADE, 2018-2033 (USD THOUSAND)
TABLE 3262 SINGAPORE CONCENTRATED PV IN INDIUM MARKET, BY PURITY GRADE, 2018-2033 (USD THOUSAND)
TABLE 3263 SINGAPORE AUTOMOTIVE INDUSTRY IN INDIUM MARKET, BY TYPE, 2018-2033 (USD THOUSAND)
TABLE 3264 SINGAPORE AUTOMOTIVE DISPLAY PANELS IN INDIUM MARKET, BY PURITY GRADE, 2018-2033 (USD THOUSAND)
TABLE 3265 SINGAPOREADAS SENSORS IN INDIUM MARKET, BY PURITY GRADE, 2018-2033 (USD THOUSAND)
TABLE 3266 SINGAPORE VEHICLE CAMERA MODULES IN INDIUM MARKET, BY PURITY GRADE, 2018-2033 (USD THOUSAND)
TABLE 3267 SINGAPORE AUTOMOTIVE OPTOELECTRONICS IN INDIUM MARKET, BY PURITY GRADE, 2018-2033 (USD THOUSAND)
TABLE 3268 SINGAPORE POWER ELECTRONICS IN INDIUM MARKET, BY PURITY GRADE, 2018-2033 (USD THOUSAND)
TABLE 3269 SINGAPORE TOUCHSCREEN INTERFACES IN INDIUM MARKET, BY PURITY GRADE, 2018-2033 (USD THOUSAND)
TABLE 3270 SINGAPORE INFRARED SENSORS IN INDIUM MARKET, BY PURITY GRADE, 2018-2033 (USD THOUSAND)
TABLE 3271 SINGAPORE SMART LIGHTING IN INDIUM MARKET, BY PURITY GRADE, 2018-2033 (USD THOUSAND)
TABLE 3272 SINGAPORE TELECOMMUNICATION EQUIPMENT INDUSTRY IN INDIUM MARKET, BY TYPE, 2018-2033 (USD THOUSAND)
TABLE 3273 SINGAPORE OPTICAL TRANSCEIVERS IN INDIUM MARKET, BY PURITY GRADE, 2018-2033 (USD THOUSAND)
TABLE 3274 SINGAPORE RF POWER AMPLIFIERS IN INDIUM MARKET, BY PURITY GRADE, 2018-2033 (USD THOUSAND)
TABLE 3275 SINGAPORE HIGH-FREQUENCY COMMUNICATION CHIPS IN INDIUM MARKET, BY PURITY GRADE, 2018-2033 (USD THOUSAND)
TABLE 3276 SINGAPORE FIBER-OPTIC COMMUNICATION LASERS IN INDIUM MARKET, BY PURITY GRADE, 2018-2033 (USD THOUSAND)
TABLE 3277 SINGAPORE PHOTODETECTORS FOR OPTICAL NETWORKS IN INDIUM MARKET, BY PURITY GRADE, 2018-2033 (USD THOUSAND)
TABLE 3278 SINGAPORE 5G INFRASTRUCTURE COMPONENTS IN INDIUM MARKET, BY PURITY GRADE, 2018-2033 (USD THOUSAND)
TABLE 3279 SINGAPORE OPTICAL NETWORK SWITCHING DEVICES IN INDIUM MARKET, BY PURITY GRADE, 2018-2033 (USD THOUSAND)
TABLE 3280 SINGAPORE SATELLITE COMMUNICATION MODULES IN INDIUM MARKET, BY PURITY GRADE, 2018-2033 (USD THOUSAND)
TABLE 3281 SINGAPORE OPTICAL & PHOTONICS INDUSTRY IN INDIUM MARKET, BY TYPE, 2018-2033 (USD THOUSAND)
TABLE 3282 SINGAPORE OPTICAL COATINGS IN INDIUM MARKET, BY PURITY GRADE, 2018-2033 (USD THOUSAND)
TABLE 3283 SINGAPORE FIBER OPTIC COMPONENTS IN INDIUM MARKET, BY PURITY GRADE, 2018-2033 (USD THOUSAND)
TABLE 3284 SINGAPORE LASER COMPONENTS IN INDIUM MARKET, BY PURITY GRADE, 2018-2033 (USD THOUSAND)
TABLE 3285 SINGAPORE OPTICAL SENSORS IN INDIUM MARKET, BY PURITY GRADE, 2018-2033 (USD THOUSAND)
TABLE 3286 SINGAPORE INFRARED OPTICS IN INDIUM MARKET, BY PURITY GRADE, 2018-2033 (USD THOUSAND)
TABLE 3287 SINGAPORE PICS IN INDIUM MARKET, BY PURITY GRADE, 2018-2033 (USD THOUSAND)
TABLE 3288 SINGAPORE MIRRORS IN INDIUM MARKET, BY PURITY GRADE, 2018-2033 (USD THOUSAND)
TABLE 3289 SINGAPORE SPECTROSCOPY IN INDIUM MARKET, BY PURITY GRADE, 2018-2033 (USD THOUSAND)
TABLE 3290 SINGAPORE AEROSPACE & DEFENSE INDUSTRY IN INDIUM MARKET, BY TYPE, 2018-2033 (USD THOUSAND)
TABLE 3291 SINGAPORE INFRARED IMAGING SYSTEMS IN INDIUM MARKET, BY PURITY GRADE, 2018-2033 (USD THOUSAND)
TABLE 3292 SINGAPORE RADAR & RF COMPONENTS IN INDIUM MARKET, BY PURITY GRADE, 2018-2033 (USD THOUSAND)
TABLE 3293 SINGAPORE SATELLITE COMMUNICATION IN INDIUM MARKET, BY PURITY GRADE, 2018-2033 (USD THOUSAND)
TABLE 3294 SINGAPORE MILITARY OPTOELECTRONICS IN INDIUM MARKET, BY PURITY GRADE, 2018-2033 (USD THOUSAND)
TABLE 3295 SINGAPORE AVIONICS DISPLAYS IN INDIUM MARKET, BY PURITY GRADE, 2018-2033 (USD THOUSAND)
TABLE 3296 SINGAPORE SPACECRAFT SOLAR PANELS IN INDIUM MARKET, BY PURITY GRADE, 2018-2033 (USD THOUSAND)
TABLE 3297 SINGAPORE THERMAL MATERIALS IN INDIUM MARKET, BY PURITY GRADE, 2018-2033 (USD THOUSAND)
TABLE 3298 SINGAPORE CRYOGENIC MATERIALS IN INDIUM MARKET, BY PURITY GRADE, 2018-2033 (USD THOUSAND)
TABLE 3299 SINGAPORE MEDICAL DEVICE INDUSTRY IN INDIUM MARKET, BY TYPE, 2018-2033 (USD THOUSAND)
TABLE 3300 SINGAPORE MEDICAL IMAGING SENSORS IN INDIUM MARKET, BY PURITY GRADE, 2018-2033 (USD THOUSAND)
TABLE 3301 SINGAPORE DIAGNOSTIC EQUIPMENT DISPLAYS IN INDIUM MARKET, BY PURITY GRADE, 2018-2033 (USD THOUSAND)
TABLE 3302 SINGAPORE ADVANCED DIAGNOSTIC INSTRUMENTS IN INDIUM MARKET, BY PURITY GRADE, 2018-2033 (USD THOUSAND)
TABLE 3303 SINGAPORE LASER SURGICAL EQUIPMENT IN INDIUM MARKET, BY PURITY GRADE, 2018-2033 (USD THOUSAND)
TABLE 3304 SINGAPORE BIOMEDICAL OPTICAL DEVICES IN INDIUM MARKET, BY PURITY GRADE, 2018-2033 (USD THOUSAND)
TABLE 3305 SINGAPORE RADIATION DETECTION EQUIPMENT IN INDIUM MARKET, BY PURITY GRADE, 2018-2033 (USD THOUSAND)
TABLE 3306 SINGAPORE INFRARED MEDICAL SENSORS IN INDIUM MARKET, BY PURITY GRADE, 2018-2033 (USD THOUSAND)
TABLE 3307 SINGAPORE PHOTOTHERAPY DEVICES IN INDIUM MARKET, BY PURITY GRADE, 2018-2033 (USD THOUSAND)
TABLE 3308 SINGAPORE INDUSTRIAL EQUIPMENT MANUFACTURING IN INDIUM MARKET, BY TYPE, 2018-2033 (USD THOUSAND)
TABLE 3309 SINGAPORE INDUSTRIAL SENSORS IN INDIUM MARKET, BY PURITY GRADE, 2018-2033 (USD THOUSAND)
TABLE 3310 SINGAPORE VACUUM DEPOSITION COATINGS IN INDIUM MARKET, BY PURITY GRADE, 2018-2033 (USD THOUSAND)
TABLE 3311 SINGAPORE PRECISION OPTICAL COMPONENTS IN INDIUM MARKET, BY PURITY GRADE, 2018-2033 (USD THOUSAND)
TABLE 3312 SINGAPORE THERMAL INTERFACE MATERIALS IN INDIUM MARKET, BY PURITY GRADE, 2018-2033 (USD THOUSAND)
TABLE 3313 SINGAPORE INDUSTRIAL LASER SYSTEMS IN INDIUM MARKET, BY PURITY GRADE, 2018-2033 (USD THOUSAND)
TABLE 3314 SINGAPORE INDUSTRIAL INFRARED DETECTORS IN INDIUM MARKET, BY PURITY GRADE, 2018-2033 (USD THOUSAND)
TABLE 3315 SINGAPORE PRECISION MEASUREMENT EQUIPMENT IN INDIUM MARKET, BY PURITY GRADE, 2018-2033 (USD THOUSAND)
TABLE 3316 SINGAPORE SPECIALTY ELECTRONIC COMPONENTS IN INDIUM MARKET, BY PURITY GRADE, 2018-2033 (USD THOUSAND)
TABLE 3317 SINGAPORE OTHERS IN INDIUM MARKET, BY TYPE, 2018-2033 (USD THOUSAND)
TABLE 3318 SINGAPORE ADVANCED MATERIALS MANUFACTURING IN INDIUM MARKET, BY PURITY GRADE, 2018-2033 (USD THOUSAND)
TABLE 3319 SINGAPORE SPECIALTY ALLOY PRODUCTION IN INDIUM MARKET, BY PURITY GRADE, 2018-2033 (USD THOUSAND)
TABLE 3320 SINGAPORE THERMAL MANAGEMENT MATERIALS IN INDIUM MARKET, BY PURITY GRADE, 2018-2033 (USD THOUSAND)
TABLE 3321 SINGAPORE PRECISION SCIENTIFIC INSTRUMENTS IN INDIUM MARKET, BY PURITY GRADE, 2018-2033 (USD THOUSAND)
TABLE 3322 SINGAPORE RESEARCH INSTITUTES & UNIVERSITIES IN INDIUM MARKET, BY PURITY GRADE, 2018-2033 (USD THOUSAND)
TABLE 3323 SINGAPORE NUCLEAR INDUSTRY APPLICATIONS IN INDIUM MARKET, BY PURITY GRADE, 2018-2033 (USD THOUSAND)
TABLE 3324 SINGAPORE SPECIALTY CHEMICAL PRODUCTION IN INDIUM MARKET, BY PURITY GRADE, 2018-2033 (USD THOUSAND)
TABLE 3325 SINGAPORE DEFENSE RESEARCH LABORATORIES IN INDIUM MARKET, BY PURITY GRADE, 2018-2033 (USD THOUSAND)
TABLE 3326 SINGAPORE CRYOGENIC EQUIPMENT MANUFACTURING IN INDIUM MARKET, BY PURITY GRADE, 2018-2033 (USD THOUSAND)
TABLE 3327 MALAYSIA INDIUM MARKET, BY PRODUCT TYPE, 2018-2033 (USD THOUSAND)
TABLE 3328 MALAYSIA INGOTS IN INDIUM MARKET, BY TYPE, 2018-2033 (USD THOUSAND)
TABLE 3329 MALAYSIA INDIUM MARKET, BY MATERIAL COMPOSITION, 2018-2033 (USD THOUSAND)
TABLE 3330 MALAYSIA INDIUM ALLOYS IN INDIUM MARKET, BY TYPE, 2018-2033 (USD THOUSAND)
TABLE 3331 MALAYSIA INDIUM COMPOUNDS IN INDIUM MARKET, BY TYPE, 2018-2033 (USD THOUSAND)
TABLE 3332 MALAYSIA INDIUM MARKET, BY PURITY GRADE, 2018-2033 (USD THOUSAND)
TABLE 3333 MALAYSIA INDIUM MARKET, BY EXTRACTION SOURCE, 2018-2033 (USD THOUSAND)
TABLE 3334 MALAYSIA PRIMARY PRODUCTION IN INDIUM MARKET, BY TYPE, 2018-2033 (USD THOUSAND)
TABLE 3335 MALAYSIA SECONDARY PRODUCTION IN INDIUM MARKET, BY TYPE, 2018-2033 (USD THOUSAND)
TABLE 3336 MALAYSIA INDIUM MARKET, BY DISTRIBUTION CHANNEL, 2018-2033 (USD THOUSAND)
TABLE 3337 MALAYSIA INDIUM MARKET, BY TECHNOLOGY PLATFORM, 2018-2033 (USD THOUSAND)
TABLE 3338 MALAYSIA INDIUM MARKET, BY END-USER INDUSTRY, 2018-2033 (USD THOUSAND)
TABLE 3339 MALAYSIA CONSUMER ELECTRONICS INDUSTRY IN INDIUM MARKET, BY TYPE, 2018-2033 (USD THOUSAND)
TABLE 3340 MALAYSIA FLAT PANEL DISPLAYS (LCD/OLED/LED) IN INDIUM MARKET, BY PURITY GRADE, 2018-2033 (USD THOUSAND)
TABLE 3341 MALAYSIA TRANSPARENT CONDUCTIVE COATINGS (ITO) IN INDIUM MARKET, BY PURITY GRADE, 2018-2033 (USD THOUSAND)
TABLE 3342 MALAYSIA TOUCHSCREEN DISPLAYS IN INDIUM MARKET, BY PURITY GRADE, 2018-2033 (USD THOUSAND)
TABLE 3343 MALAYSIA FLEXIBLE DISPLAYS & ELECTRONICS IN INDIUM MARKET, BY PURITY GRADE, 2018-2033 (USD THOUSAND)
TABLE 3344 MALAYSIA WEARABLE ELECTRONICS DEVICES IN INDIUM MARKET, BY PURITY GRADE, 2018-2033 (USD THOUSAND)
TABLE 3345 MALAYSIA CAMERA & OPTICAL SENSORS IN INDIUM MARKET, BY PURITY GRADE, 2018-2033 (USD THOUSAND)
TABLE 3346 MALAYSIA MINI-LED BACKLIGHTING IN INDIUM MARKET, BY PURITY GRADE, 2018-2033 (USD THOUSAND)
TABLE 3347 MALAYSIA MICRO-LED DISPLAYS IN INDIUM MARKET, BY PURITY GRADE, 2018-2033 (USD THOUSAND)
TABLE 3348 MALAYSIA DISPLAY PANEL INDUSTRY IN INDIUM MARKET, BY TYPE, 2018-2033 (USD THOUSAND)
TABLE 3349 MALAYSIA LCD PANEL MANUFACTURING IN INDIUM MARKET, BY PURITY GRADE, 2018-2033 (USD THOUSAND)
TABLE 3350 MALAYSIA OLED PANEL MANUFACTURING IN INDIUM MARKET, BY PURITY GRADE, 2018-2033 (USD THOUSAND)
TABLE 3351 MALAYSIA DISPLAY PANEL MANUFACTURING IN INDIUM MARKET, BY PURITY GRADE, 2018-2033 (USD THOUSAND)
TABLE 3352 MALAYSIA TOUCH PANEL SENSORS IN INDIUM MARKET, BY PURITY GRADE, 2018-2033 (USD THOUSAND)
TABLE 3353 MALAYSIA TRANSPARENT CONDUCTIVE FILMS IN INDIUM MARKET, BY PURITY GRADE, 2018-2033 (USD THOUSAND)
TABLE 3354 MALAYSIA FLEXIBLE & FOLDABLE DISPLAYS IN INDIUM MARKET, BY PURITY GRADE, 2018-2033 (USD THOUSAND)
TABLE 3355 MALAYSIA AR/VR DISPLAYS IN INDIUM MARKET, BY PURITY GRADE, 2018-2033 (USD THOUSAND)
TABLE 3356 MALAYSIA MICRODISPLAY DEVICES IN INDIUM MARKET, BY PURITY GRADE, 2018-2033 (USD THOUSAND)
TABLE 3357 MALAYSIA BACKPLANE COATINGS IN INDIUM MARKET, BY PURITY GRADE, 2018-2033 (USD THOUSAND)
TABLE 3358 MALAYSIA SEMICONDUCTOR INDUSTRY IN INDIUM MARKET, BY TYPE, 2018-2033 (USD THOUSAND)
TABLE 3359 MALAYSIA III-V COMPOUND SEMICONDUCTORS IN INDIUM MARKET, BY PURITY GRADE, 2018-2033 (USD THOUSAND)
TABLE 3360 MALAYSIA HIGH-FREQUENCY RF COMPONENTS IN INDIUM MARKET, BY PURITY GRADE, 2018-2033 (USD THOUSAND)
TABLE 3361 MALAYSIA SEMICONDUCTOR SUBSTRATES & EPITAXY IN INDIUM MARKET, BY PURITY GRADE, 2018-2033 (USD THOUSAND)
TABLE 3362 MALAYSIA LASER DIODES IN INDIUM MARKET, BY PURITY GRADE, 2018-2033 (USD THOUSAND)
TABLE 3363 MALAYSIA PHOTODETECTORS IN INDIUM MARKET, BY PURITY GRADE, 2018-2033 (USD THOUSAND)
TABLE 3364 MALAYSIA HIGH-SPEED OPTOELECTRONICS IN INDIUM MARKET, BY PURITY GRADE, 2018-2033 (USD THOUSAND)
TABLE 3365 MALAYSIA INFRARED DETECTORS IN INDIUM MARKET, BY PURITY GRADE, 2018-2033 (USD THOUSAND)
TABLE 3366 MALAYSIA INTEGRATED PHOTONIC CIRCUITS IN INDIUM MARKET, BY PURITY GRADE, 2018-2033 (USD THOUSAND)
TABLE 3367 MALAYSIA SOLAR PHOTOVOLTAIC INDUSTRY IN INDIUM MARKET, BY TYPE, 2018-2033 (USD THOUSAND)
TABLE 3368 MALAYSIA CIGS THIN-FILM SOLAR CELLS IN INDIUM MARKET, BY PURITY GRADE, 2018-2033 (USD THOUSAND)
TABLE 3369 MALAYSIAHIGH-EFFICIENCY MODULES IN INDIUM MARKET, BY PURITY GRADE, 2018-2033 (USD THOUSAND)
TABLE 3370 MALAYSIA THIN-FILM COATINGS IN INDIUM MARKET, BY PURITY GRADE, 2018-2033 (USD THOUSAND)
TABLE 3371 MALAYSIA TRANSPARENT ELECTRODES IN INDIUM MARKET, BY PURITY GRADE, 2018-2033 (USD THOUSAND)
TABLE 3372 MALAYSIA BIPV IN INDIUM MARKET, BY PURITY GRADE, 2018-2033 (USD THOUSAND)
TABLE 3373 MALAYSIA FLEXIBLE SOLAR PANELS IN INDIUM MARKET, BY PURITY GRADE, 2018-2033 (USD THOUSAND)
TABLE 3374 MALAYSIA PORTABLE SOLAR SYSTEMS IN INDIUM MARKET, BY PURITY GRADE, 2018-2033 (USD THOUSAND)
TABLE 3375 MALAYSIA CONCENTRATED PV IN INDIUM MARKET, BY PURITY GRADE, 2018-2033 (USD THOUSAND)
TABLE 3376 MALAYSIA AUTOMOTIVE INDUSTRY IN INDIUM MARKET, BY TYPE, 2018-2033 (USD THOUSAND)
TABLE 3377 MALAYSIA AUTOMOTIVE DISPLAY PANELS IN INDIUM MARKET, BY PURITY GRADE, 2018-2033 (USD THOUSAND)
TABLE 3378 MALAYSIAADAS SENSORS IN INDIUM MARKET, BY PURITY GRADE, 2018-2033 (USD THOUSAND)
TABLE 3379 MALAYSIA VEHICLE CAMERA MODULES IN INDIUM MARKET, BY PURITY GRADE, 2018-2033 (USD THOUSAND)
TABLE 3380 MALAYSIA AUTOMOTIVE OPTOELECTRONICS IN INDIUM MARKET, BY PURITY GRADE, 2018-2033 (USD THOUSAND)
TABLE 3381 MALAYSIA POWER ELECTRONICS IN INDIUM MARKET, BY PURITY GRADE, 2018-2033 (USD THOUSAND)
TABLE 3382 MALAYSIA TOUCHSCREEN INTERFACES IN INDIUM MARKET, BY PURITY GRADE, 2018-2033 (USD THOUSAND)
TABLE 3383 MALAYSIA INFRARED SENSORS IN INDIUM MARKET, BY PURITY GRADE, 2018-2033 (USD THOUSAND)
TABLE 3384 MALAYSIA SMART LIGHTING IN INDIUM MARKET, BY PURITY GRADE, 2018-2033 (USD THOUSAND)
TABLE 3385 MALAYSIA TELECOMMUNICATION EQUIPMENT INDUSTRY IN INDIUM MARKET, BY TYPE, 2018-2033 (USD THOUSAND)
TABLE 3386 MALAYSIA OPTICAL TRANSCEIVERS IN INDIUM MARKET, BY PURITY GRADE, 2018-2033 (USD THOUSAND)
TABLE 3387 MALAYSIA RF POWER AMPLIFIERS IN INDIUM MARKET, BY PURITY GRADE, 2018-2033 (USD THOUSAND)
TABLE 3388 MALAYSIA HIGH-FREQUENCY COMMUNICATION CHIPS IN INDIUM MARKET, BY PURITY GRADE, 2018-2033 (USD THOUSAND)
TABLE 3389 MALAYSIA FIBER-OPTIC COMMUNICATION LASERS IN INDIUM MARKET, BY PURITY GRADE, 2018-2033 (USD THOUSAND)
TABLE 3390 MALAYSIA PHOTODETECTORS FOR OPTICAL NETWORKS IN INDIUM MARKET, BY PURITY GRADE, 2018-2033 (USD THOUSAND)
TABLE 3391 MALAYSIA 5G INFRASTRUCTURE COMPONENTS IN INDIUM MARKET, BY PURITY GRADE, 2018-2033 (USD THOUSAND)
TABLE 3392 MALAYSIA OPTICAL NETWORK SWITCHING DEVICES IN INDIUM MARKET, BY PURITY GRADE, 2018-2033 (USD THOUSAND)
TABLE 3393 MALAYSIA SATELLITE COMMUNICATION MODULES IN INDIUM MARKET, BY PURITY GRADE, 2018-2033 (USD THOUSAND)
TABLE 3394 MALAYSIA OPTICAL & PHOTONICS INDUSTRY IN INDIUM MARKET, BY TYPE, 2018-2033 (USD THOUSAND)
TABLE 3395 MALAYSIA OPTICAL COATINGS IN INDIUM MARKET, BY PURITY GRADE, 2018-2033 (USD THOUSAND)
TABLE 3396 MALAYSIA FIBER OPTIC COMPONENTS IN INDIUM MARKET, BY PURITY GRADE, 2018-2033 (USD THOUSAND)
TABLE 3397 MALAYSIA LASER COMPONENTS IN INDIUM MARKET, BY PURITY GRADE, 2018-2033 (USD THOUSAND)
TABLE 3398 MALAYSIA OPTICAL SENSORS IN INDIUM MARKET, BY PURITY GRADE, 2018-2033 (USD THOUSAND)
TABLE 3399 MALAYSIA INFRARED OPTICS IN INDIUM MARKET, BY PURITY GRADE, 2018-2033 (USD THOUSAND)
TABLE 3400 MALAYSIA PICS IN INDIUM MARKET, BY PURITY GRADE, 2018-2033 (USD THOUSAND)
TABLE 3401 MALAYSIA MIRRORS IN INDIUM MARKET, BY PURITY GRADE, 2018-2033 (USD THOUSAND)
TABLE 3402 MALAYSIA SPECTROSCOPY IN INDIUM MARKET, BY PURITY GRADE, 2018-2033 (USD THOUSAND)
TABLE 3403 MALAYSIA AEROSPACE & DEFENSE INDUSTRY IN INDIUM MARKET, BY TYPE, 2018-2033 (USD THOUSAND)
TABLE 3404 MALAYSIA INFRARED IMAGING SYSTEMS IN INDIUM MARKET, BY PURITY GRADE, 2018-2033 (USD THOUSAND)
TABLE 3405 MALAYSIA RADAR & RF COMPONENTS IN INDIUM MARKET, BY PURITY GRADE, 2018-2033 (USD THOUSAND)
TABLE 3406 MALAYSIA SATELLITE COMMUNICATION IN INDIUM MARKET, BY PURITY GRADE, 2018-2033 (USD THOUSAND)
TABLE 3407 MALAYSIA MILITARY OPTOELECTRONICS IN INDIUM MARKET, BY PURITY GRADE, 2018-2033 (USD THOUSAND)
TABLE 3408 MALAYSIA AVIONICS DISPLAYS IN INDIUM MARKET, BY PURITY GRADE, 2018-2033 (USD THOUSAND)
TABLE 3409 MALAYSIA SPACECRAFT SOLAR PANELS IN INDIUM MARKET, BY PURITY GRADE, 2018-2033 (USD THOUSAND)
TABLE 3410 MALAYSIA THERMAL MATERIALS IN INDIUM MARKET, BY PURITY GRADE, 2018-2033 (USD THOUSAND)
TABLE 3411 MALAYSIA CRYOGENIC MATERIALS IN INDIUM MARKET, BY PURITY GRADE, 2018-2033 (USD THOUSAND)
TABLE 3412 MALAYSIA MEDICAL DEVICE INDUSTRY IN INDIUM MARKET, BY TYPE, 2018-2033 (USD THOUSAND)
TABLE 3413 MALAYSIA MEDICAL IMAGING SENSORS IN INDIUM MARKET, BY PURITY GRADE, 2018-2033 (USD THOUSAND)
TABLE 3414 MALAYSIA DIAGNOSTIC EQUIPMENT DISPLAYS IN INDIUM MARKET, BY PURITY GRADE, 2018-2033 (USD THOUSAND)
TABLE 3415 MALAYSIA ADVANCED DIAGNOSTIC INSTRUMENTS IN INDIUM MARKET, BY PURITY GRADE, 2018-2033 (USD THOUSAND)
TABLE 3416 MALAYSIA LASER SURGICAL EQUIPMENT IN INDIUM MARKET, BY PURITY GRADE, 2018-2033 (USD THOUSAND)
TABLE 3417 MALAYSIA BIOMEDICAL OPTICAL DEVICES IN INDIUM MARKET, BY PURITY GRADE, 2018-2033 (USD THOUSAND)
TABLE 3418 MALAYSIA RADIATION DETECTION EQUIPMENT IN INDIUM MARKET, BY PURITY GRADE, 2018-2033 (USD THOUSAND)
TABLE 3419 MALAYSIA INFRARED MEDICAL SENSORS IN INDIUM MARKET, BY PURITY GRADE, 2018-2033 (USD THOUSAND)
TABLE 3420 MALAYSIA PHOTOTHERAPY DEVICES IN INDIUM MARKET, BY PURITY GRADE, 2018-2033 (USD THOUSAND)
TABLE 3421 MALAYSIA INDUSTRIAL EQUIPMENT MANUFACTURING IN INDIUM MARKET, BY TYPE, 2018-2033 (USD THOUSAND)
TABLE 3422 MALAYSIA INDUSTRIAL SENSORS IN INDIUM MARKET, BY PURITY GRADE, 2018-2033 (USD THOUSAND)
TABLE 3423 MALAYSIA VACUUM DEPOSITION COATINGS IN INDIUM MARKET, BY PURITY GRADE, 2018-2033 (USD THOUSAND)
TABLE 3424 MALAYSIA PRECISION OPTICAL COMPONENTS IN INDIUM MARKET, BY PURITY GRADE, 2018-2033 (USD THOUSAND)
TABLE 3425 MALAYSIA THERMAL INTERFACE MATERIALS IN INDIUM MARKET, BY PURITY GRADE, 2018-2033 (USD THOUSAND)
TABLE 3426 MALAYSIA INDUSTRIAL LASER SYSTEMS IN INDIUM MARKET, BY PURITY GRADE, 2018-2033 (USD THOUSAND)
TABLE 3427 MALAYSIA INDUSTRIAL INFRARED DETECTORS IN INDIUM MARKET, BY PURITY GRADE, 2018-2033 (USD THOUSAND)
TABLE 3428 MALAYSIA PRECISION MEASUREMENT EQUIPMENT IN INDIUM MARKET, BY PURITY GRADE, 2018-2033 (USD THOUSAND)
TABLE 3429 MALAYSIA SPECIALTY ELECTRONIC COMPONENTS IN INDIUM MARKET, BY PURITY GRADE, 2018-2033 (USD THOUSAND)
TABLE 3430 MALAYSIA OTHERS IN INDIUM MARKET, BY TYPE, 2018-2033 (USD THOUSAND)
TABLE 3431 MALAYSIA ADVANCED MATERIALS MANUFACTURING IN INDIUM MARKET, BY PURITY GRADE, 2018-2033 (USD THOUSAND)
TABLE 3432 MALAYSIA SPECIALTY ALLOY PRODUCTION IN INDIUM MARKET, BY PURITY GRADE, 2018-2033 (USD THOUSAND)
TABLE 3433 MALAYSIA THERMAL MANAGEMENT MATERIALS IN INDIUM MARKET, BY PURITY GRADE, 2018-2033 (USD THOUSAND)
TABLE 3434 MALAYSIA PRECISION SCIENTIFIC INSTRUMENTS IN INDIUM MARKET, BY PURITY GRADE, 2018-2033 (USD THOUSAND)
TABLE 3435 MALAYSIA RESEARCH INSTITUTES & UNIVERSITIES IN INDIUM MARKET, BY PURITY GRADE, 2018-2033 (USD THOUSAND)
TABLE 3436 MALAYSIA NUCLEAR INDUSTRY APPLICATIONS IN INDIUM MARKET, BY PURITY GRADE, 2018-2033 (USD THOUSAND)
TABLE 3437 MALAYSIA SPECIALTY CHEMICAL PRODUCTION IN INDIUM MARKET, BY PURITY GRADE, 2018-2033 (USD THOUSAND)
TABLE 3438 MALAYSIA DEFENSE RESEARCH LABORATORIES IN INDIUM MARKET, BY PURITY GRADE, 2018-2033 (USD THOUSAND)
TABLE 3439 MALAYSIA CRYOGENIC EQUIPMENT MANUFACTURING IN INDIUM MARKET, BY PURITY GRADE, 2018-2033 (USD THOUSAND)
TABLE 3440 THAILAND INDIUM MARKET, BY PRODUCT TYPE, 2018-2033 (USD THOUSAND)
TABLE 3441 THAILAND INGOTS IN INDIUM MARKET, BY TYPE, 2018-2033 (USD THOUSAND)
TABLE 3442 THAILAND INDIUM MARKET, BY MATERIAL COMPOSITION, 2018-2033 (USD THOUSAND)
TABLE 3443 THAILAND INDIUM ALLOYS IN INDIUM MARKET, BY TYPE, 2018-2033 (USD THOUSAND)
TABLE 3444 THAILAND INDIUM COMPOUNDS IN INDIUM MARKET, BY TYPE, 2018-2033 (USD THOUSAND)
TABLE 3445 THAILAND INDIUM MARKET, BY PURITY GRADE, 2018-2033 (USD THOUSAND)
TABLE 3446 THAILAND INDIUM MARKET, BY EXTRACTION SOURCE, 2018-2033 (USD THOUSAND)
TABLE 3447 THAILAND PRIMARY PRODUCTION IN INDIUM MARKET, BY TYPE, 2018-2033 (USD THOUSAND)
TABLE 3448 THAILAND SECONDARY PRODUCTION IN INDIUM MARKET, BY TYPE, 2018-2033 (USD THOUSAND)
TABLE 3449 THAILAND INDIUM MARKET, BY DISTRIBUTION CHANNEL, 2018-2033 (USD THOUSAND)
TABLE 3450 THAILAND INDIUM MARKET, BY TECHNOLOGY PLATFORM, 2018-2033 (USD THOUSAND)
TABLE 3451 THAILAND INDIUM MARKET, BY END-USER INDUSTRY, 2018-2033 (USD THOUSAND)
TABLE 3452 THAILAND CONSUMER ELECTRONICS INDUSTRY IN INDIUM MARKET, BY TYPE, 2018-2033 (USD THOUSAND)
TABLE 3453 THAILAND FLAT PANEL DISPLAYS (LCD/OLED/LED) IN INDIUM MARKET, BY PURITY GRADE, 2018-2033 (USD THOUSAND)
TABLE 3454 THAILAND TRANSPARENT CONDUCTIVE COATINGS (ITO) IN INDIUM MARKET, BY PURITY GRADE, 2018-2033 (USD THOUSAND)
TABLE 3455 THAILAND TOUCHSCREEN DISPLAYS IN INDIUM MARKET, BY PURITY GRADE, 2018-2033 (USD THOUSAND)
TABLE 3456 THAILAND FLEXIBLE DISPLAYS & ELECTRONICS IN INDIUM MARKET, BY PURITY GRADE, 2018-2033 (USD THOUSAND)
TABLE 3457 THAILAND WEARABLE ELECTRONICS DEVICES IN INDIUM MARKET, BY PURITY GRADE, 2018-2033 (USD THOUSAND)
TABLE 3458 THAILAND CAMERA & OPTICAL SENSORS IN INDIUM MARKET, BY PURITY GRADE, 2018-2033 (USD THOUSAND)
TABLE 3459 THAILAND MINI-LED BACKLIGHTING IN INDIUM MARKET, BY PURITY GRADE, 2018-2033 (USD THOUSAND)
TABLE 3460 THAILAND MICRO-LED DISPLAYS IN INDIUM MARKET, BY PURITY GRADE, 2018-2033 (USD THOUSAND)
TABLE 3461 THAILAND DISPLAY PANEL INDUSTRY IN INDIUM MARKET, BY TYPE, 2018-2033 (USD THOUSAND)
TABLE 3462 THAILAND LCD PANEL MANUFACTURING IN INDIUM MARKET, BY PURITY GRADE, 2018-2033 (USD THOUSAND)
TABLE 3463 THAILAND OLED PANEL MANUFACTURING IN INDIUM MARKET, BY PURITY GRADE, 2018-2033 (USD THOUSAND)
TABLE 3464 THAILAND DISPLAY PANEL MANUFACTURING IN INDIUM MARKET, BY PURITY GRADE, 2018-2033 (USD THOUSAND)
TABLE 3465 THAILAND TOUCH PANEL SENSORS IN INDIUM MARKET, BY PURITY GRADE, 2018-2033 (USD THOUSAND)
TABLE 3466 THAILAND TRANSPARENT CONDUCTIVE FILMS IN INDIUM MARKET, BY PURITY GRADE, 2018-2033 (USD THOUSAND)
TABLE 3467 THAILAND FLEXIBLE & FOLDABLE DISPLAYS IN INDIUM MARKET, BY PURITY GRADE, 2018-2033 (USD THOUSAND)
TABLE 3468 THAILAND AR/VR DISPLAYS IN INDIUM MARKET, BY PURITY GRADE, 2018-2033 (USD THOUSAND)
TABLE 3469 THAILAND MICRODISPLAY DEVICES IN INDIUM MARKET, BY PURITY GRADE, 2018-2033 (USD THOUSAND)
TABLE 3470 THAILAND BACKPLANE COATINGS IN INDIUM MARKET, BY PURITY GRADE, 2018-2033 (USD THOUSAND)
TABLE 3471 THAILAND SEMICONDUCTOR INDUSTRY IN INDIUM MARKET, BY TYPE, 2018-2033 (USD THOUSAND)
TABLE 3472 THAILAND III-V COMPOUND SEMICONDUCTORS IN INDIUM MARKET, BY PURITY GRADE, 2018-2033 (USD THOUSAND)
TABLE 3473 THAILAND HIGH-FREQUENCY RF COMPONENTS IN INDIUM MARKET, BY PURITY GRADE, 2018-2033 (USD THOUSAND)
TABLE 3474 THAILAND SEMICONDUCTOR SUBSTRATES & EPITAXY IN INDIUM MARKET, BY PURITY GRADE, 2018-2033 (USD THOUSAND)
TABLE 3475 THAILAND LASER DIODES IN INDIUM MARKET, BY PURITY GRADE, 2018-2033 (USD THOUSAND)
TABLE 3476 THAILAND PHOTODETECTORS IN INDIUM MARKET, BY PURITY GRADE, 2018-2033 (USD THOUSAND)
TABLE 3477 THAILAND HIGH-SPEED OPTOELECTRONICS IN INDIUM MARKET, BY PURITY GRADE, 2018-2033 (USD THOUSAND)
TABLE 3478 THAILAND INFRARED DETECTORS IN INDIUM MARKET, BY PURITY GRADE, 2018-2033 (USD THOUSAND)
TABLE 3479 THAILAND INTEGRATED PHOTONIC CIRCUITS IN INDIUM MARKET, BY PURITY GRADE, 2018-2033 (USD THOUSAND)
TABLE 3480 THAILAND SOLAR PHOTOVOLTAIC INDUSTRY IN INDIUM MARKET, BY TYPE, 2018-2033 (USD THOUSAND)
TABLE 3481 THAILAND CIGS THIN-FILM SOLAR CELLS IN INDIUM MARKET, BY PURITY GRADE, 2018-2033 (USD THOUSAND)
TABLE 3482 THAILANDHIGH-EFFICIENCY MODULES IN INDIUM MARKET, BY PURITY GRADE, 2018-2033 (USD THOUSAND)
TABLE 3483 THAILAND THIN-FILM COATINGS IN INDIUM MARKET, BY PURITY GRADE, 2018-2033 (USD THOUSAND)
TABLE 3484 THAILAND TRANSPARENT ELECTRODES IN INDIUM MARKET, BY PURITY GRADE, 2018-2033 (USD THOUSAND)
TABLE 3485 THAILAND BIPV IN INDIUM MARKET, BY PURITY GRADE, 2018-2033 (USD THOUSAND)
TABLE 3486 THAILAND FLEXIBLE SOLAR PANELS IN INDIUM MARKET, BY PURITY GRADE, 2018-2033 (USD THOUSAND)
TABLE 3487 THAILAND PORTABLE SOLAR SYSTEMS IN INDIUM MARKET, BY PURITY GRADE, 2018-2033 (USD THOUSAND)
TABLE 3488 THAILAND CONCENTRATED PV IN INDIUM MARKET, BY PURITY GRADE, 2018-2033 (USD THOUSAND)
TABLE 3489 THAILAND AUTOMOTIVE INDUSTRY IN INDIUM MARKET, BY TYPE, 2018-2033 (USD THOUSAND)
TABLE 3490 THAILAND AUTOMOTIVE DISPLAY PANELS IN INDIUM MARKET, BY PURITY GRADE, 2018-2033 (USD THOUSAND)
TABLE 3491 THAILANDADAS SENSORS IN INDIUM MARKET, BY PURITY GRADE, 2018-2033 (USD THOUSAND)
TABLE 3492 THAILAND VEHICLE CAMERA MODULES IN INDIUM MARKET, BY PURITY GRADE, 2018-2033 (USD THOUSAND)
TABLE 3493 THAILAND AUTOMOTIVE OPTOELECTRONICS IN INDIUM MARKET, BY PURITY GRADE, 2018-2033 (USD THOUSAND)
TABLE 3494 THAILAND POWER ELECTRONICS IN INDIUM MARKET, BY PURITY GRADE, 2018-2033 (USD THOUSAND)
TABLE 3495 THAILAND TOUCHSCREEN INTERFACES IN INDIUM MARKET, BY PURITY GRADE, 2018-2033 (USD THOUSAND)
TABLE 3496 THAILAND INFRARED SENSORS IN INDIUM MARKET, BY PURITY GRADE, 2018-2033 (USD THOUSAND)
TABLE 3497 THAILAND SMART LIGHTING IN INDIUM MARKET, BY PURITY GRADE, 2018-2033 (USD THOUSAND)
TABLE 3498 THAILAND TELECOMMUNICATION EQUIPMENT INDUSTRY IN INDIUM MARKET, BY TYPE, 2018-2033 (USD THOUSAND)
TABLE 3499 THAILAND OPTICAL TRANSCEIVERS IN INDIUM MARKET, BY PURITY GRADE, 2018-2033 (USD THOUSAND)
TABLE 3500 THAILAND RF POWER AMPLIFIERS IN INDIUM MARKET, BY PURITY GRADE, 2018-2033 (USD THOUSAND)
TABLE 3501 THAILAND HIGH-FREQUENCY COMMUNICATION CHIPS IN INDIUM MARKET, BY PURITY GRADE, 2018-2033 (USD THOUSAND)
TABLE 3502 THAILAND FIBER-OPTIC COMMUNICATION LASERS IN INDIUM MARKET, BY PURITY GRADE, 2018-2033 (USD THOUSAND)
TABLE 3503 THAILAND PHOTODETECTORS FOR OPTICAL NETWORKS IN INDIUM MARKET, BY PURITY GRADE, 2018-2033 (USD THOUSAND)
TABLE 3504 THAILAND 5G INFRASTRUCTURE COMPONENTS IN INDIUM MARKET, BY PURITY GRADE, 2018-2033 (USD THOUSAND)
TABLE 3505 THAILAND OPTICAL NETWORK SWITCHING DEVICES IN INDIUM MARKET, BY PURITY GRADE, 2018-2033 (USD THOUSAND)
TABLE 3506 THAILAND SATELLITE COMMUNICATION MODULES IN INDIUM MARKET, BY PURITY GRADE, 2018-2033 (USD THOUSAND)
TABLE 3507 THAILAND OPTICAL & PHOTONICS INDUSTRY IN INDIUM MARKET, BY TYPE, 2018-2033 (USD THOUSAND)
TABLE 3508 THAILAND OPTICAL COATINGS IN INDIUM MARKET, BY PURITY GRADE, 2018-2033 (USD THOUSAND)
TABLE 3509 THAILAND FIBER OPTIC COMPONENTS IN INDIUM MARKET, BY PURITY GRADE, 2018-2033 (USD THOUSAND)
TABLE 3510 THAILAND LASER COMPONENTS IN INDIUM MARKET, BY PURITY GRADE, 2018-2033 (USD THOUSAND)
TABLE 3511 THAILAND OPTICAL SENSORS IN INDIUM MARKET, BY PURITY GRADE, 2018-2033 (USD THOUSAND)
TABLE 3512 THAILAND INFRARED OPTICS IN INDIUM MARKET, BY PURITY GRADE, 2018-2033 (USD THOUSAND)
TABLE 3513 THAILAND PICS IN INDIUM MARKET, BY PURITY GRADE, 2018-2033 (USD THOUSAND)
TABLE 3514 THAILAND MIRRORS IN INDIUM MARKET, BY PURITY GRADE, 2018-2033 (USD THOUSAND)
TABLE 3515 THAILAND SPECTROSCOPY IN INDIUM MARKET, BY PURITY GRADE, 2018-2033 (USD THOUSAND)
TABLE 3516 THAILAND AEROSPACE & DEFENSE INDUSTRY IN INDIUM MARKET, BY TYPE, 2018-2033 (USD THOUSAND)
TABLE 3517 THAILAND INFRARED IMAGING SYSTEMS IN INDIUM MARKET, BY PURITY GRADE, 2018-2033 (USD THOUSAND)
TABLE 3518 THAILAND RADAR & RF COMPONENTS IN INDIUM MARKET, BY PURITY GRADE, 2018-2033 (USD THOUSAND)
TABLE 3519 THAILAND SATELLITE COMMUNICATION IN INDIUM MARKET, BY PURITY GRADE, 2018-2033 (USD THOUSAND)
TABLE 3520 THAILAND MILITARY OPTOELECTRONICS IN INDIUM MARKET, BY PURITY GRADE, 2018-2033 (USD THOUSAND)
TABLE 3521 THAILAND AVIONICS DISPLAYS IN INDIUM MARKET, BY PURITY GRADE, 2018-2033 (USD THOUSAND)
TABLE 3522 THAILAND SPACECRAFT SOLAR PANELS IN INDIUM MARKET, BY PURITY GRADE, 2018-2033 (USD THOUSAND)
TABLE 3523 THAILAND THERMAL MATERIALS IN INDIUM MARKET, BY PURITY GRADE, 2018-2033 (USD THOUSAND)
TABLE 3524 THAILAND CRYOGENIC MATERIALS IN INDIUM MARKET, BY PURITY GRADE, 2018-2033 (USD THOUSAND)
TABLE 3525 THAILAND MEDICAL DEVICE INDUSTRY IN INDIUM MARKET, BY TYPE, 2018-2033 (USD THOUSAND)
TABLE 3526 THAILAND MEDICAL IMAGING SENSORS IN INDIUM MARKET, BY PURITY GRADE, 2018-2033 (USD THOUSAND)
TABLE 3527 THAILAND DIAGNOSTIC EQUIPMENT DISPLAYS IN INDIUM MARKET, BY PURITY GRADE, 2018-2033 (USD THOUSAND)
TABLE 3528 THAILAND ADVANCED DIAGNOSTIC INSTRUMENTS IN INDIUM MARKET, BY PURITY GRADE, 2018-2033 (USD THOUSAND)
TABLE 3529 THAILAND LASER SURGICAL EQUIPMENT IN INDIUM MARKET, BY PURITY GRADE, 2018-2033 (USD THOUSAND)
TABLE 3530 THAILAND BIOMEDICAL OPTICAL DEVICES IN INDIUM MARKET, BY PURITY GRADE, 2018-2033 (USD THOUSAND)
TABLE 3531 THAILAND RADIATION DETECTION EQUIPMENT IN INDIUM MARKET, BY PURITY GRADE, 2018-2033 (USD THOUSAND)
TABLE 3532 THAILAND INFRARED MEDICAL SENSORS IN INDIUM MARKET, BY PURITY GRADE, 2018-2033 (USD THOUSAND)
TABLE 3533 THAILAND PHOTOTHERAPY DEVICES IN INDIUM MARKET, BY PURITY GRADE, 2018-2033 (USD THOUSAND)
TABLE 3534 THAILAND INDUSTRIAL EQUIPMENT MANUFACTURING IN INDIUM MARKET, BY TYPE, 2018-2033 (USD THOUSAND)
TABLE 3535 THAILAND INDUSTRIAL SENSORS IN INDIUM MARKET, BY PURITY GRADE, 2018-2033 (USD THOUSAND)
TABLE 3536 THAILAND VACUUM DEPOSITION COATINGS IN INDIUM MARKET, BY PURITY GRADE, 2018-2033 (USD THOUSAND)
TABLE 3537 THAILAND PRECISION OPTICAL COMPONENTS IN INDIUM MARKET, BY PURITY GRADE, 2018-2033 (USD THOUSAND)
TABLE 3538 THAILAND THERMAL INTERFACE MATERIALS IN INDIUM MARKET, BY PURITY GRADE, 2018-2033 (USD THOUSAND)
TABLE 3539 THAILAND INDUSTRIAL LASER SYSTEMS IN INDIUM MARKET, BY PURITY GRADE, 2018-2033 (USD THOUSAND)
TABLE 3540 THAILAND INDUSTRIAL INFRARED DETECTORS IN INDIUM MARKET, BY PURITY GRADE, 2018-2033 (USD THOUSAND)
TABLE 3541 THAILAND PRECISION MEASUREMENT EQUIPMENT IN INDIUM MARKET, BY PURITY GRADE, 2018-2033 (USD THOUSAND)
TABLE 3542 THAILAND SPECIALTY ELECTRONIC COMPONENTS IN INDIUM MARKET, BY PURITY GRADE, 2018-2033 (USD THOUSAND)
TABLE 3543 THAILAND OTHERS IN INDIUM MARKET, BY TYPE, 2018-2033 (USD THOUSAND)
TABLE 3544 THAILAND ADVANCED MATERIALS MANUFACTURING IN INDIUM MARKET, BY PURITY GRADE, 2018-2033 (USD THOUSAND)
TABLE 3545 THAILAND SPECIALTY ALLOY PRODUCTION IN INDIUM MARKET, BY PURITY GRADE, 2018-2033 (USD THOUSAND)
TABLE 3546 THAILAND THERMAL MANAGEMENT MATERIALS IN INDIUM MARKET, BY PURITY GRADE, 2018-2033 (USD THOUSAND)
TABLE 3547 THAILAND PRECISION SCIENTIFIC INSTRUMENTS IN INDIUM MARKET, BY PURITY GRADE, 2018-2033 (USD THOUSAND)
TABLE 3548 THAILAND RESEARCH INSTITUTES & UNIVERSITIES IN INDIUM MARKET, BY PURITY GRADE, 2018-2033 (USD THOUSAND)
TABLE 3549 THAILAND NUCLEAR INDUSTRY APPLICATIONS IN INDIUM MARKET, BY PURITY GRADE, 2018-2033 (USD THOUSAND)
TABLE 3550 THAILAND SPECIALTY CHEMICAL PRODUCTION IN INDIUM MARKET, BY PURITY GRADE, 2018-2033 (USD THOUSAND)
TABLE 3551 THAILAND DEFENSE RESEARCH LABORATORIES IN INDIUM MARKET, BY PURITY GRADE, 2018-2033 (USD THOUSAND)
TABLE 3552 THAILAND CRYOGENIC EQUIPMENT MANUFACTURING IN INDIUM MARKET, BY PURITY GRADE, 2018-2033 (USD THOUSAND)
TABLE 3553 INDONESIA INDIUM MARKET, BY PRODUCT TYPE, 2018-2033 (USD THOUSAND)
TABLE 3554 INDONESIA INGOTS IN INDIUM MARKET, BY TYPE, 2018-2033 (USD THOUSAND)
TABLE 3555 INDONESIA INDIUM MARKET, BY MATERIAL COMPOSITION, 2018-2033 (USD THOUSAND)
TABLE 3556 INDONESIA INDIUM ALLOYS IN INDIUM MARKET, BY TYPE, 2018-2033 (USD THOUSAND)
TABLE 3557 INDONESIA INDIUM COMPOUNDS IN INDIUM MARKET, BY TYPE, 2018-2033 (USD THOUSAND)
TABLE 3558 INDONESIA INDIUM MARKET, BY PURITY GRADE, 2018-2033 (USD THOUSAND)
TABLE 3559 INDONESIA INDIUM MARKET, BY EXTRACTION SOURCE, 2018-2033 (USD THOUSAND)
TABLE 3560 INDONESIA PRIMARY PRODUCTION IN INDIUM MARKET, BY TYPE, 2018-2033 (USD THOUSAND)
TABLE 3561 INDONESIA SECONDARY PRODUCTION IN INDIUM MARKET, BY TYPE, 2018-2033 (USD THOUSAND)
TABLE 3562 INDONESIA INDIUM MARKET, BY DISTRIBUTION CHANNEL, 2018-2033 (USD THOUSAND)
TABLE 3563 INDONESIA INDIUM MARKET, BY TECHNOLOGY PLATFORM, 2018-2033 (USD THOUSAND)
TABLE 3564 INDONESIA INDIUM MARKET, BY END-USER INDUSTRY, 2018-2033 (USD THOUSAND)
TABLE 3565 INDONESIA CONSUMER ELECTRONICS INDUSTRY IN INDIUM MARKET, BY TYPE, 2018-2033 (USD THOUSAND)
TABLE 3566 INDONESIA FLAT PANEL DISPLAYS (LCD/OLED/LED) IN INDIUM MARKET, BY PURITY GRADE, 2018-2033 (USD THOUSAND)
TABLE 3567 INDONESIA TRANSPARENT CONDUCTIVE COATINGS (ITO) IN INDIUM MARKET, BY PURITY GRADE, 2018-2033 (USD THOUSAND)
TABLE 3568 INDONESIA TOUCHSCREEN DISPLAYS IN INDIUM MARKET, BY PURITY GRADE, 2018-2033 (USD THOUSAND)
TABLE 3569 INDONESIA FLEXIBLE DISPLAYS & ELECTRONICS IN INDIUM MARKET, BY PURITY GRADE, 2018-2033 (USD THOUSAND)
TABLE 3570 INDONESIA WEARABLE ELECTRONICS DEVICES IN INDIUM MARKET, BY PURITY GRADE, 2018-2033 (USD THOUSAND)
TABLE 3571 INDONESIA CAMERA & OPTICAL SENSORS IN INDIUM MARKET, BY PURITY GRADE, 2018-2033 (USD THOUSAND)
TABLE 3572 INDONESIA MINI-LED BACKLIGHTING IN INDIUM MARKET, BY PURITY GRADE, 2018-2033 (USD THOUSAND)
TABLE 3573 INDONESIA MICRO-LED DISPLAYS IN INDIUM MARKET, BY PURITY GRADE, 2018-2033 (USD THOUSAND)
TABLE 3574 INDONESIA DISPLAY PANEL INDUSTRY IN INDIUM MARKET, BY TYPE, 2018-2033 (USD THOUSAND)
TABLE 3575 INDONESIA LCD PANEL MANUFACTURING IN INDIUM MARKET, BY PURITY GRADE, 2018-2033 (USD THOUSAND)
TABLE 3576 INDONESIA OLED PANEL MANUFACTURING IN INDIUM MARKET, BY PURITY GRADE, 2018-2033 (USD THOUSAND)
TABLE 3577 INDONESIA DISPLAY PANEL MANUFACTURING IN INDIUM MARKET, BY PURITY GRADE, 2018-2033 (USD THOUSAND)
TABLE 3578 INDONESIA TOUCH PANEL SENSORS IN INDIUM MARKET, BY PURITY GRADE, 2018-2033 (USD THOUSAND)
TABLE 3579 INDONESIA TRANSPARENT CONDUCTIVE FILMS IN INDIUM MARKET, BY PURITY GRADE, 2018-2033 (USD THOUSAND)
TABLE 3580 INDONESIA FLEXIBLE & FOLDABLE DISPLAYS IN INDIUM MARKET, BY PURITY GRADE, 2018-2033 (USD THOUSAND)
TABLE 3581 INDONESIA AR/VR DISPLAYS IN INDIUM MARKET, BY PURITY GRADE, 2018-2033 (USD THOUSAND)
TABLE 3582 INDONESIA MICRODISPLAY DEVICES IN INDIUM MARKET, BY PURITY GRADE, 2018-2033 (USD THOUSAND)
TABLE 3583 INDONESIA BACKPLANE COATINGS IN INDIUM MARKET, BY PURITY GRADE, 2018-2033 (USD THOUSAND)
TABLE 3584 INDONESIA SEMICONDUCTOR INDUSTRY IN INDIUM MARKET, BY TYPE, 2018-2033 (USD THOUSAND)
TABLE 3585 INDONESIA III-V COMPOUND SEMICONDUCTORS IN INDIUM MARKET, BY PURITY GRADE, 2018-2033 (USD THOUSAND)
TABLE 3586 INDONESIA HIGH-FREQUENCY RF COMPONENTS IN INDIUM MARKET, BY PURITY GRADE, 2018-2033 (USD THOUSAND)
TABLE 3587 INDONESIA SEMICONDUCTOR SUBSTRATES & EPITAXY IN INDIUM MARKET, BY PURITY GRADE, 2018-2033 (USD THOUSAND)
TABLE 3588 INDONESIA LASER DIODES IN INDIUM MARKET, BY PURITY GRADE, 2018-2033 (USD THOUSAND)
TABLE 3589 INDONESIA PHOTODETECTORS IN INDIUM MARKET, BY PURITY GRADE, 2018-2033 (USD THOUSAND)
TABLE 3590 INDONESIA HIGH-SPEED OPTOELECTRONICS IN INDIUM MARKET, BY PURITY GRADE, 2018-2033 (USD THOUSAND)
TABLE 3591 INDONESIA INFRARED DETECTORS IN INDIUM MARKET, BY PURITY GRADE, 2018-2033 (USD THOUSAND)
TABLE 3592 INDONESIA INTEGRATED PHOTONIC CIRCUITS IN INDIUM MARKET, BY PURITY GRADE, 2018-2033 (USD THOUSAND)
TABLE 3593 INDONESIA SOLAR PHOTOVOLTAIC INDUSTRY IN INDIUM MARKET, BY TYPE, 2018-2033 (USD THOUSAND)
TABLE 3594 INDONESIA CIGS THIN-FILM SOLAR CELLS IN INDIUM MARKET, BY PURITY GRADE, 2018-2033 (USD THOUSAND)
TABLE 3595 INDONESIAHIGH-EFFICIENCY MODULES IN INDIUM MARKET, BY PURITY GRADE, 2018-2033 (USD THOUSAND)
TABLE 3596 INDONESIA THIN-FILM COATINGS IN INDIUM MARKET, BY PURITY GRADE, 2018-2033 (USD THOUSAND)
TABLE 3597 INDONESIA TRANSPARENT ELECTRODES IN INDIUM MARKET, BY PURITY GRADE, 2018-2033 (USD THOUSAND)
TABLE 3598 INDONESIA BIPV IN INDIUM MARKET, BY PURITY GRADE, 2018-2033 (USD THOUSAND)
TABLE 3599 INDONESIA FLEXIBLE SOLAR PANELS IN INDIUM MARKET, BY PURITY GRADE, 2018-2033 (USD THOUSAND)
TABLE 3600 INDONESIA PORTABLE SOLAR SYSTEMS IN INDIUM MARKET, BY PURITY GRADE, 2018-2033 (USD THOUSAND)
TABLE 3601 INDONESIA CONCENTRATED PV IN INDIUM MARKET, BY PURITY GRADE, 2018-2033 (USD THOUSAND)
TABLE 3602 INDONESIA AUTOMOTIVE INDUSTRY IN INDIUM MARKET, BY TYPE, 2018-2033 (USD THOUSAND)
TABLE 3603 INDONESIA AUTOMOTIVE DISPLAY PANELS IN INDIUM MARKET, BY PURITY GRADE, 2018-2033 (USD THOUSAND)
TABLE 3604 INDONESIAADAS SENSORS IN INDIUM MARKET, BY PURITY GRADE, 2018-2033 (USD THOUSAND)
TABLE 3605 INDONESIA VEHICLE CAMERA MODULES IN INDIUM MARKET, BY PURITY GRADE, 2018-2033 (USD THOUSAND)
TABLE 3606 INDONESIA AUTOMOTIVE OPTOELECTRONICS IN INDIUM MARKET, BY PURITY GRADE, 2018-2033 (USD THOUSAND)
TABLE 3607 INDONESIA POWER ELECTRONICS IN INDIUM MARKET, BY PURITY GRADE, 2018-2033 (USD THOUSAND)
TABLE 3608 INDONESIA TOUCHSCREEN INTERFACES IN INDIUM MARKET, BY PURITY GRADE, 2018-2033 (USD THOUSAND)
TABLE 3609 INDONESIA INFRARED SENSORS IN INDIUM MARKET, BY PURITY GRADE, 2018-2033 (USD THOUSAND)
TABLE 3610 INDONESIA SMART LIGHTING IN INDIUM MARKET, BY PURITY GRADE, 2018-2033 (USD THOUSAND)
TABLE 3611 INDONESIA TELECOMMUNICATION EQUIPMENT INDUSTRY IN INDIUM MARKET, BY TYPE, 2018-2033 (USD THOUSAND)
TABLE 3612 INDONESIA OPTICAL TRANSCEIVERS IN INDIUM MARKET, BY PURITY GRADE, 2018-2033 (USD THOUSAND)
TABLE 3613 INDONESIA RF POWER AMPLIFIERS IN INDIUM MARKET, BY PURITY GRADE, 2018-2033 (USD THOUSAND)
TABLE 3614 INDONESIA HIGH-FREQUENCY COMMUNICATION CHIPS IN INDIUM MARKET, BY PURITY GRADE, 2018-2033 (USD THOUSAND)
TABLE 3615 INDONESIA FIBER-OPTIC COMMUNICATION LASERS IN INDIUM MARKET, BY PURITY GRADE, 2018-2033 (USD THOUSAND)
TABLE 3616 INDONESIA PHOTODETECTORS FOR OPTICAL NETWORKS IN INDIUM MARKET, BY PURITY GRADE, 2018-2033 (USD THOUSAND)
TABLE 3617 INDONESIA 5G INFRASTRUCTURE COMPONENTS IN INDIUM MARKET, BY PURITY GRADE, 2018-2033 (USD THOUSAND)
TABLE 3618 INDONESIA OPTICAL NETWORK SWITCHING DEVICES IN INDIUM MARKET, BY PURITY GRADE, 2018-2033 (USD THOUSAND)
TABLE 3619 INDONESIA SATELLITE COMMUNICATION MODULES IN INDIUM MARKET, BY PURITY GRADE, 2018-2033 (USD THOUSAND)
TABLE 3620 INDONESIA OPTICAL & PHOTONICS INDUSTRY IN INDIUM MARKET, BY TYPE, 2018-2033 (USD THOUSAND)
TABLE 3621 INDONESIA OPTICAL COATINGS IN INDIUM MARKET, BY PURITY GRADE, 2018-2033 (USD THOUSAND)
TABLE 3622 INDONESIA FIBER OPTIC COMPONENTS IN INDIUM MARKET, BY PURITY GRADE, 2018-2033 (USD THOUSAND)
TABLE 3623 INDONESIA LASER COMPONENTS IN INDIUM MARKET, BY PURITY GRADE, 2018-2033 (USD THOUSAND)
TABLE 3624 INDONESIA OPTICAL SENSORS IN INDIUM MARKET, BY PURITY GRADE, 2018-2033 (USD THOUSAND)
TABLE 3625 INDONESIA INFRARED OPTICS IN INDIUM MARKET, BY PURITY GRADE, 2018-2033 (USD THOUSAND)
TABLE 3626 INDONESIA PICS IN INDIUM MARKET, BY PURITY GRADE, 2018-2033 (USD THOUSAND)
TABLE 3627 INDONESIA MIRRORS IN INDIUM MARKET, BY PURITY GRADE, 2018-2033 (USD THOUSAND)
TABLE 3628 INDONESIA SPECTROSCOPY IN INDIUM MARKET, BY PURITY GRADE, 2018-2033 (USD THOUSAND)
TABLE 3629 INDONESIA AEROSPACE & DEFENSE INDUSTRY IN INDIUM MARKET, BY TYPE, 2018-2033 (USD THOUSAND)
TABLE 3630 INDONESIA INFRARED IMAGING SYSTEMS IN INDIUM MARKET, BY PURITY GRADE, 2018-2033 (USD THOUSAND)
TABLE 3631 INDONESIA RADAR & RF COMPONENTS IN INDIUM MARKET, BY PURITY GRADE, 2018-2033 (USD THOUSAND)
TABLE 3632 INDONESIA SATELLITE COMMUNICATION IN INDIUM MARKET, BY PURITY GRADE, 2018-2033 (USD THOUSAND)
TABLE 3633 INDONESIA MILITARY OPTOELECTRONICS IN INDIUM MARKET, BY PURITY GRADE, 2018-2033 (USD THOUSAND)
TABLE 3634 INDONESIA AVIONICS DISPLAYS IN INDIUM MARKET, BY PURITY GRADE, 2018-2033 (USD THOUSAND)
TABLE 3635 INDONESIA SPACECRAFT SOLAR PANELS IN INDIUM MARKET, BY PURITY GRADE, 2018-2033 (USD THOUSAND)
TABLE 3636 INDONESIA THERMAL MATERIALS IN INDIUM MARKET, BY PURITY GRADE, 2018-2033 (USD THOUSAND)
TABLE 3637 INDONESIA CRYOGENIC MATERIALS IN INDIUM MARKET, BY PURITY GRADE, 2018-2033 (USD THOUSAND)
TABLE 3638 INDONESIA MEDICAL DEVICE INDUSTRY IN INDIUM MARKET, BY TYPE, 2018-2033 (USD THOUSAND)
TABLE 3639 INDONESIA MEDICAL IMAGING SENSORS IN INDIUM MARKET, BY PURITY GRADE, 2018-2033 (USD THOUSAND)
TABLE 3640 INDONESIA DIAGNOSTIC EQUIPMENT DISPLAYS IN INDIUM MARKET, BY PURITY GRADE, 2018-2033 (USD THOUSAND)
TABLE 3641 INDONESIA ADVANCED DIAGNOSTIC INSTRUMENTS IN INDIUM MARKET, BY PURITY GRADE, 2018-2033 (USD THOUSAND)
TABLE 3642 INDONESIA LASER SURGICAL EQUIPMENT IN INDIUM MARKET, BY PURITY GRADE, 2018-2033 (USD THOUSAND)
TABLE 3643 INDONESIA BIOMEDICAL OPTICAL DEVICES IN INDIUM MARKET, BY PURITY GRADE, 2018-2033 (USD THOUSAND)
TABLE 3644 INDONESIA RADIATION DETECTION EQUIPMENT IN INDIUM MARKET, BY PURITY GRADE, 2018-2033 (USD THOUSAND)
TABLE 3645 INDONESIA INFRARED MEDICAL SENSORS IN INDIUM MARKET, BY PURITY GRADE, 2018-2033 (USD THOUSAND)
TABLE 3646 INDONESIA PHOTOTHERAPY DEVICES IN INDIUM MARKET, BY PURITY GRADE, 2018-2033 (USD THOUSAND)
TABLE 3647 INDONESIA INDUSTRIAL EQUIPMENT MANUFACTURING IN INDIUM MARKET, BY TYPE, 2018-2033 (USD THOUSAND)
TABLE 3648 INDONESIA INDUSTRIAL SENSORS IN INDIUM MARKET, BY PURITY GRADE, 2018-2033 (USD THOUSAND)
TABLE 3649 INDONESIA VACUUM DEPOSITION COATINGS IN INDIUM MARKET, BY PURITY GRADE, 2018-2033 (USD THOUSAND)
TABLE 3650 INDONESIA PRECISION OPTICAL COMPONENTS IN INDIUM MARKET, BY PURITY GRADE, 2018-2033 (USD THOUSAND)
TABLE 3651 INDONESIA THERMAL INTERFACE MATERIALS IN INDIUM MARKET, BY PURITY GRADE, 2018-2033 (USD THOUSAND)
TABLE 3652 INDONESIA INDUSTRIAL LASER SYSTEMS IN INDIUM MARKET, BY PURITY GRADE, 2018-2033 (USD THOUSAND)
TABLE 3653 INDONESIA INDUSTRIAL INFRARED DETECTORS IN INDIUM MARKET, BY PURITY GRADE, 2018-2033 (USD THOUSAND)
TABLE 3654 INDONESIA PRECISION MEASUREMENT EQUIPMENT IN INDIUM MARKET, BY PURITY GRADE, 2018-2033 (USD THOUSAND)
TABLE 3655 INDONESIA SPECIALTY ELECTRONIC COMPONENTS IN INDIUM MARKET, BY PURITY GRADE, 2018-2033 (USD THOUSAND)
TABLE 3656 INDONESIA OTHERS IN INDIUM MARKET, BY TYPE, 2018-2033 (USD THOUSAND)
TABLE 3657 INDONESIA ADVANCED MATERIALS MANUFACTURING IN INDIUM MARKET, BY PURITY GRADE, 2018-2033 (USD THOUSAND)
TABLE 3658 INDONESIA SPECIALTY ALLOY PRODUCTION IN INDIUM MARKET, BY PURITY GRADE, 2018-2033 (USD THOUSAND)
TABLE 3659 INDONESIA THERMAL MANAGEMENT MATERIALS IN INDIUM MARKET, BY PURITY GRADE, 2018-2033 (USD THOUSAND)
TABLE 3660 INDONESIA PRECISION SCIENTIFIC INSTRUMENTS IN INDIUM MARKET, BY PURITY GRADE, 2018-2033 (USD THOUSAND)
TABLE 3661 INDONESIA RESEARCH INSTITUTES & UNIVERSITIES IN INDIUM MARKET, BY PURITY GRADE, 2018-2033 (USD THOUSAND)
TABLE 3662 INDONESIA NUCLEAR INDUSTRY APPLICATIONS IN INDIUM MARKET, BY PURITY GRADE, 2018-2033 (USD THOUSAND)
TABLE 3663 INDONESIA SPECIALTY CHEMICAL PRODUCTION IN INDIUM MARKET, BY PURITY GRADE, 2018-2033 (USD THOUSAND)
TABLE 3664 INDONESIA DEFENSE RESEARCH LABORATORIES IN INDIUM MARKET, BY PURITY GRADE, 2018-2033 (USD THOUSAND)
TABLE 3665 INDONESIA CRYOGENIC EQUIPMENT MANUFACTURING IN INDIUM MARKET, BY PURITY GRADE, 2018-2033 (USD THOUSAND)
TABLE 3666 PHILIPPINES INDIUM MARKET, BY PRODUCT TYPE, 2018-2033 (USD THOUSAND)
TABLE 3667 PHILIPPINES INGOTS IN INDIUM MARKET, BY TYPE, 2018-2033 (USD THOUSAND)
TABLE 3668 PHILIPPINES INDIUM MARKET, BY MATERIAL COMPOSITION, 2018-2033 (USD THOUSAND)
TABLE 3669 PHILIPPINES INDIUM ALLOYS IN INDIUM MARKET, BY TYPE, 2018-2033 (USD THOUSAND)
TABLE 3670 PHILIPPINES INDIUM COMPOUNDS IN INDIUM MARKET, BY TYPE, 2018-2033 (USD THOUSAND)
TABLE 3671 PHILIPPINES INDIUM MARKET, BY PURITY GRADE, 2018-2033 (USD THOUSAND)
TABLE 3672 PHILIPPINES INDIUM MARKET, BY EXTRACTION SOURCE, 2018-2033 (USD THOUSAND)
TABLE 3673 PHILIPPINES PRIMARY PRODUCTION IN INDIUM MARKET, BY TYPE, 2018-2033 (USD THOUSAND)
TABLE 3674 PHILIPPINES SECONDARY PRODUCTION IN INDIUM MARKET, BY TYPE, 2018-2033 (USD THOUSAND)
TABLE 3675 PHILIPPINES INDIUM MARKET, BY DISTRIBUTION CHANNEL, 2018-2033 (USD THOUSAND)
TABLE 3676 PHILIPPINES INDIUM MARKET, BY TECHNOLOGY PLATFORM, 2018-2033 (USD THOUSAND)
TABLE 3677 PHILIPPINES INDIUM MARKET, BY END-USER INDUSTRY, 2018-2033 (USD THOUSAND)
TABLE 3678 PHILIPPINES CONSUMER ELECTRONICS INDUSTRY IN INDIUM MARKET, BY TYPE, 2018-2033 (USD THOUSAND)
TABLE 3679 PHILIPPINES FLAT PANEL DISPLAYS (LCD/OLED/LED) IN INDIUM MARKET, BY PURITY GRADE, 2018-2033 (USD THOUSAND)
TABLE 3680 PHILIPPINES TRANSPARENT CONDUCTIVE COATINGS (ITO) IN INDIUM MARKET, BY PURITY GRADE, 2018-2033 (USD THOUSAND)
TABLE 3681 PHILIPPINES TOUCHSCREEN DISPLAYS IN INDIUM MARKET, BY PURITY GRADE, 2018-2033 (USD THOUSAND)
TABLE 3682 PHILIPPINES FLEXIBLE DISPLAYS & ELECTRONICS IN INDIUM MARKET, BY PURITY GRADE, 2018-2033 (USD THOUSAND)
TABLE 3683 PHILIPPINES WEARABLE ELECTRONICS DEVICES IN INDIUM MARKET, BY PURITY GRADE, 2018-2033 (USD THOUSAND)
TABLE 3684 PHILIPPINES CAMERA & OPTICAL SENSORS IN INDIUM MARKET, BY PURITY GRADE, 2018-2033 (USD THOUSAND)
TABLE 3685 PHILIPPINES MINI-LED BACKLIGHTING IN INDIUM MARKET, BY PURITY GRADE, 2018-2033 (USD THOUSAND)
TABLE 3686 PHILIPPINES MICRO-LED DISPLAYS IN INDIUM MARKET, BY PURITY GRADE, 2018-2033 (USD THOUSAND)
TABLE 3687 PHILIPPINES DISPLAY PANEL INDUSTRY IN INDIUM MARKET, BY TYPE, 2018-2033 (USD THOUSAND)
TABLE 3688 PHILIPPINES LCD PANEL MANUFACTURING IN INDIUM MARKET, BY PURITY GRADE, 2018-2033 (USD THOUSAND)
TABLE 3689 PHILIPPINES OLED PANEL MANUFACTURING IN INDIUM MARKET, BY PURITY GRADE, 2018-2033 (USD THOUSAND)
TABLE 3690 PHILIPPINES DISPLAY PANEL MANUFACTURING IN INDIUM MARKET, BY PURITY GRADE, 2018-2033 (USD THOUSAND)
TABLE 3691 PHILIPPINES TOUCH PANEL SENSORS IN INDIUM MARKET, BY PURITY GRADE, 2018-2033 (USD THOUSAND)
TABLE 3692 PHILIPPINES TRANSPARENT CONDUCTIVE FILMS IN INDIUM MARKET, BY PURITY GRADE, 2018-2033 (USD THOUSAND)
TABLE 3693 PHILIPPINES FLEXIBLE & FOLDABLE DISPLAYS IN INDIUM MARKET, BY PURITY GRADE, 2018-2033 (USD THOUSAND)
TABLE 3694 PHILIPPINES AR/VR DISPLAYS IN INDIUM MARKET, BY PURITY GRADE, 2018-2033 (USD THOUSAND)
TABLE 3695 PHILIPPINES MICRODISPLAY DEVICES IN INDIUM MARKET, BY PURITY GRADE, 2018-2033 (USD THOUSAND)
TABLE 3696 PHILIPPINES BACKPLANE COATINGS IN INDIUM MARKET, BY PURITY GRADE, 2018-2033 (USD THOUSAND)
TABLE 3697 PHILIPPINES SEMICONDUCTOR INDUSTRY IN INDIUM MARKET, BY TYPE, 2018-2033 (USD THOUSAND)
TABLE 3698 PHILIPPINES III-V COMPOUND SEMICONDUCTORS IN INDIUM MARKET, BY PURITY GRADE, 2018-2033 (USD THOUSAND)
TABLE 3699 PHILIPPINES HIGH-FREQUENCY RF COMPONENTS IN INDIUM MARKET, BY PURITY GRADE, 2018-2033 (USD THOUSAND)
TABLE 3700 PHILIPPINES SEMICONDUCTOR SUBSTRATES & EPITAXY IN INDIUM MARKET, BY PURITY GRADE, 2018-2033 (USD THOUSAND)
TABLE 3701 PHILIPPINES LASER DIODES IN INDIUM MARKET, BY PURITY GRADE, 2018-2033 (USD THOUSAND)
TABLE 3702 PHILIPPINES PHOTODETECTORS IN INDIUM MARKET, BY PURITY GRADE, 2018-2033 (USD THOUSAND)
TABLE 3703 PHILIPPINES HIGH-SPEED OPTOELECTRONICS IN INDIUM MARKET, BY PURITY GRADE, 2018-2033 (USD THOUSAND)
TABLE 3704 PHILIPPINES INFRARED DETECTORS IN INDIUM MARKET, BY PURITY GRADE, 2018-2033 (USD THOUSAND)
TABLE 3705 PHILIPPINES INTEGRATED PHOTONIC CIRCUITS IN INDIUM MARKET, BY PURITY GRADE, 2018-2033 (USD THOUSAND)
TABLE 3706 PHILIPPINES SOLAR PHOTOVOLTAIC INDUSTRY IN INDIUM MARKET, BY TYPE, 2018-2033 (USD THOUSAND)
TABLE 3707 PHILIPPINES CIGS THIN-FILM SOLAR CELLS IN INDIUM MARKET, BY PURITY GRADE, 2018-2033 (USD THOUSAND)
TABLE 3708 PHILIPPINESHIGH-EFFICIENCY MODULES IN INDIUM MARKET, BY PURITY GRADE, 2018-2033 (USD THOUSAND)
TABLE 3709 PHILIPPINES THIN-FILM COATINGS IN INDIUM MARKET, BY PURITY GRADE, 2018-2033 (USD THOUSAND)
TABLE 3710 PHILIPPINES TRANSPARENT ELECTRODES IN INDIUM MARKET, BY PURITY GRADE, 2018-2033 (USD THOUSAND)
TABLE 3711 PHILIPPINES BIPV IN INDIUM MARKET, BY PURITY GRADE, 2018-2033 (USD THOUSAND)
TABLE 3712 PHILIPPINES FLEXIBLE SOLAR PANELS IN INDIUM MARKET, BY PURITY GRADE, 2018-2033 (USD THOUSAND)
TABLE 3713 PHILIPPINES PORTABLE SOLAR SYSTEMS IN INDIUM MARKET, BY PURITY GRADE, 2018-2033 (USD THOUSAND)
TABLE 3714 PHILIPPINES CONCENTRATED PV IN INDIUM MARKET, BY PURITY GRADE, 2018-2033 (USD THOUSAND)
TABLE 3715 PHILIPPINES AUTOMOTIVE INDUSTRY IN INDIUM MARKET, BY TYPE, 2018-2033 (USD THOUSAND)
TABLE 3716 PHILIPPINES AUTOMOTIVE DISPLAY PANELS IN INDIUM MARKET, BY PURITY GRADE, 2018-2033 (USD THOUSAND)
TABLE 3717 PHILIPPINESADAS SENSORS IN INDIUM MARKET, BY PURITY GRADE, 2018-2033 (USD THOUSAND)
TABLE 3718 PHILIPPINES VEHICLE CAMERA MODULES IN INDIUM MARKET, BY PURITY GRADE, 2018-2033 (USD THOUSAND)
TABLE 3719 PHILIPPINES AUTOMOTIVE OPTOELECTRONICS IN INDIUM MARKET, BY PURITY GRADE, 2018-2033 (USD THOUSAND)
TABLE 3720 PHILIPPINES POWER ELECTRONICS IN INDIUM MARKET, BY PURITY GRADE, 2018-2033 (USD THOUSAND)
TABLE 3721 PHILIPPINES TOUCHSCREEN INTERFACES IN INDIUM MARKET, BY PURITY GRADE, 2018-2033 (USD THOUSAND)
TABLE 3722 PHILIPPINES INFRARED SENSORS IN INDIUM MARKET, BY PURITY GRADE, 2018-2033 (USD THOUSAND)
TABLE 3723 PHILIPPINES SMART LIGHTING IN INDIUM MARKET, BY PURITY GRADE, 2018-2033 (USD THOUSAND)
TABLE 3724 PHILIPPINES TELECOMMUNICATION EQUIPMENT INDUSTRY IN INDIUM MARKET, BY TYPE, 2018-2033 (USD THOUSAND)
TABLE 3725 PHILIPPINES OPTICAL TRANSCEIVERS IN INDIUM MARKET, BY PURITY GRADE, 2018-2033 (USD THOUSAND)
TABLE 3726 PHILIPPINES RF POWER AMPLIFIERS IN INDIUM MARKET, BY PURITY GRADE, 2018-2033 (USD THOUSAND)
TABLE 3727 PHILIPPINES HIGH-FREQUENCY COMMUNICATION CHIPS IN INDIUM MARKET, BY PURITY GRADE, 2018-2033 (USD THOUSAND)
TABLE 3728 PHILIPPINES FIBER-OPTIC COMMUNICATION LASERS IN INDIUM MARKET, BY PURITY GRADE, 2018-2033 (USD THOUSAND)
TABLE 3729 PHILIPPINES PHOTODETECTORS FOR OPTICAL NETWORKS IN INDIUM MARKET, BY PURITY GRADE, 2018-2033 (USD THOUSAND)
TABLE 3730 PHILIPPINES 5G INFRASTRUCTURE COMPONENTS IN INDIUM MARKET, BY PURITY GRADE, 2018-2033 (USD THOUSAND)
TABLE 3731 PHILIPPINES OPTICAL NETWORK SWITCHING DEVICES IN INDIUM MARKET, BY PURITY GRADE, 2018-2033 (USD THOUSAND)
TABLE 3732 PHILIPPINES SATELLITE COMMUNICATION MODULES IN INDIUM MARKET, BY PURITY GRADE, 2018-2033 (USD THOUSAND)
TABLE 3733 PHILIPPINES OPTICAL & PHOTONICS INDUSTRY IN INDIUM MARKET, BY TYPE, 2018-2033 (USD THOUSAND)
TABLE 3734 PHILIPPINES OPTICAL COATINGS IN INDIUM MARKET, BY PURITY GRADE, 2018-2033 (USD THOUSAND)
TABLE 3735 PHILIPPINES FIBER OPTIC COMPONENTS IN INDIUM MARKET, BY PURITY GRADE, 2018-2033 (USD THOUSAND)
TABLE 3736 PHILIPPINES LASER COMPONENTS IN INDIUM MARKET, BY PURITY GRADE, 2018-2033 (USD THOUSAND)
TABLE 3737 PHILIPPINES OPTICAL SENSORS IN INDIUM MARKET, BY PURITY GRADE, 2018-2033 (USD THOUSAND)
TABLE 3738 PHILIPPINES INFRARED OPTICS IN INDIUM MARKET, BY PURITY GRADE, 2018-2033 (USD THOUSAND)
TABLE 3739 PHILIPPINES PICS IN INDIUM MARKET, BY PURITY GRADE, 2018-2033 (USD THOUSAND)
TABLE 3740 PHILIPPINES MIRRORS IN INDIUM MARKET, BY PURITY GRADE, 2018-2033 (USD THOUSAND)
TABLE 3741 PHILIPPINES SPECTROSCOPY IN INDIUM MARKET, BY PURITY GRADE, 2018-2033 (USD THOUSAND)
TABLE 3742 PHILIPPINES AEROSPACE & DEFENSE INDUSTRY IN INDIUM MARKET, BY TYPE, 2018-2033 (USD THOUSAND)
TABLE 3743 PHILIPPINES INFRARED IMAGING SYSTEMS IN INDIUM MARKET, BY PURITY GRADE, 2018-2033 (USD THOUSAND)
TABLE 3744 PHILIPPINES RADAR & RF COMPONENTS IN INDIUM MARKET, BY PURITY GRADE, 2018-2033 (USD THOUSAND)
TABLE 3745 PHILIPPINES SATELLITE COMMUNICATION IN INDIUM MARKET, BY PURITY GRADE, 2018-2033 (USD THOUSAND)
TABLE 3746 PHILIPPINES MILITARY OPTOELECTRONICS IN INDIUM MARKET, BY PURITY GRADE, 2018-2033 (USD THOUSAND)
TABLE 3747 PHILIPPINES AVIONICS DISPLAYS IN INDIUM MARKET, BY PURITY GRADE, 2018-2033 (USD THOUSAND)
TABLE 3748 PHILIPPINES SPACECRAFT SOLAR PANELS IN INDIUM MARKET, BY PURITY GRADE, 2018-2033 (USD THOUSAND)
TABLE 3749 PHILIPPINES THERMAL MATERIALS IN INDIUM MARKET, BY PURITY GRADE, 2018-2033 (USD THOUSAND)
TABLE 3750 PHILIPPINES CRYOGENIC MATERIALS IN INDIUM MARKET, BY PURITY GRADE, 2018-2033 (USD THOUSAND)
TABLE 3751 PHILIPPINES MEDICAL DEVICE INDUSTRY IN INDIUM MARKET, BY TYPE, 2018-2033 (USD THOUSAND)
TABLE 3752 PHILIPPINES MEDICAL IMAGING SENSORS IN INDIUM MARKET, BY PURITY GRADE, 2018-2033 (USD THOUSAND)
TABLE 3753 PHILIPPINES DIAGNOSTIC EQUIPMENT DISPLAYS IN INDIUM MARKET, BY PURITY GRADE, 2018-2033 (USD THOUSAND)
TABLE 3754 PHILIPPINES ADVANCED DIAGNOSTIC INSTRUMENTS IN INDIUM MARKET, BY PURITY GRADE, 2018-2033 (USD THOUSAND)
TABLE 3755 PHILIPPINES LASER SURGICAL EQUIPMENT IN INDIUM MARKET, BY PURITY GRADE, 2018-2033 (USD THOUSAND)
TABLE 3756 PHILIPPINES BIOMEDICAL OPTICAL DEVICES IN INDIUM MARKET, BY PURITY GRADE, 2018-2033 (USD THOUSAND)
TABLE 3757 PHILIPPINES RADIATION DETECTION EQUIPMENT IN INDIUM MARKET, BY PURITY GRADE, 2018-2033 (USD THOUSAND)
TABLE 3758 PHILIPPINES INFRARED MEDICAL SENSORS IN INDIUM MARKET, BY PURITY GRADE, 2018-2033 (USD THOUSAND)
TABLE 3759 PHILIPPINES PHOTOTHERAPY DEVICES IN INDIUM MARKET, BY PURITY GRADE, 2018-2033 (USD THOUSAND)
TABLE 3760 PHILIPPINES INDUSTRIAL EQUIPMENT MANUFACTURING IN INDIUM MARKET, BY TYPE, 2018-2033 (USD THOUSAND)
TABLE 3761 PHILIPPINES INDUSTRIAL SENSORS IN INDIUM MARKET, BY PURITY GRADE, 2018-2033 (USD THOUSAND)
TABLE 3762 PHILIPPINES VACUUM DEPOSITION COATINGS IN INDIUM MARKET, BY PURITY GRADE, 2018-2033 (USD THOUSAND)
TABLE 3763 PHILIPPINES PRECISION OPTICAL COMPONENTS IN INDIUM MARKET, BY PURITY GRADE, 2018-2033 (USD THOUSAND)
TABLE 3764 PHILIPPINES THERMAL INTERFACE MATERIALS IN INDIUM MARKET, BY PURITY GRADE, 2018-2033 (USD THOUSAND)
TABLE 3765 PHILIPPINES INDUSTRIAL LASER SYSTEMS IN INDIUM MARKET, BY PURITY GRADE, 2018-2033 (USD THOUSAND)
TABLE 3766 PHILIPPINES INDUSTRIAL INFRARED DETECTORS IN INDIUM MARKET, BY PURITY GRADE, 2018-2033 (USD THOUSAND)
TABLE 3767 PHILIPPINES PRECISION MEASUREMENT EQUIPMENT IN INDIUM MARKET, BY PURITY GRADE, 2018-2033 (USD THOUSAND)
TABLE 3768 PHILIPPINES SPECIALTY ELECTRONIC COMPONENTS IN INDIUM MARKET, BY PURITY GRADE, 2018-2033 (USD THOUSAND)
TABLE 3769 PHILIPPINES OTHERS IN INDIUM MARKET, BY TYPE, 2018-2033 (USD THOUSAND)
TABLE 3770 PHILIPPINES ADVANCED MATERIALS MANUFACTURING IN INDIUM MARKET, BY PURITY GRADE, 2018-2033 (USD THOUSAND)
TABLE 3771 PHILIPPINES SPECIALTY ALLOY PRODUCTION IN INDIUM MARKET, BY PURITY GRADE, 2018-2033 (USD THOUSAND)
TABLE 3772 PHILIPPINES THERMAL MANAGEMENT MATERIALS IN INDIUM MARKET, BY PURITY GRADE, 2018-2033 (USD THOUSAND)
TABLE 3773 PHILIPPINES PRECISION SCIENTIFIC INSTRUMENTS IN INDIUM MARKET, BY PURITY GRADE, 2018-2033 (USD THOUSAND)
TABLE 3774 PHILIPPINES RESEARCH INSTITUTES & UNIVERSITIES IN INDIUM MARKET, BY PURITY GRADE, 2018-2033 (USD THOUSAND)
TABLE 3775 PHILIPPINES NUCLEAR INDUSTRY APPLICATIONS IN INDIUM MARKET, BY PURITY GRADE, 2018-2033 (USD THOUSAND)
TABLE 3776 PHILIPPINES SPECIALTY CHEMICAL PRODUCTION IN INDIUM MARKET, BY PURITY GRADE, 2018-2033 (USD THOUSAND)
TABLE 3777 PHILIPPINES DEFENSE RESEARCH LABORATORIES IN INDIUM MARKET, BY PURITY GRADE, 2018-2033 (USD THOUSAND)
TABLE 3778 PHILIPPINES CRYOGENIC EQUIPMENT MANUFACTURING IN INDIUM MARKET, BY PURITY GRADE, 2018-2033 (USD THOUSAND)
TABLE 3779 HONG KONG INDIUM MARKET, BY PRODUCT TYPE, 2018-2033 (USD THOUSAND)
TABLE 3780 HONG KONG INGOTS IN INDIUM MARKET, BY TYPE, 2018-2033 (USD THOUSAND)
TABLE 3781 HONG KONG INDIUM MARKET, BY MATERIAL COMPOSITION, 2018-2033 (USD THOUSAND)
TABLE 3782 HONG KONG INDIUM ALLOYS IN INDIUM MARKET, BY TYPE, 2018-2033 (USD THOUSAND)
TABLE 3783 HONG KONG INDIUM COMPOUNDS IN INDIUM MARKET, BY TYPE, 2018-2033 (USD THOUSAND)
TABLE 3784 HONG KONG INDIUM MARKET, BY PURITY GRADE, 2018-2033 (USD THOUSAND)
TABLE 3785 HONG KONG INDIUM MARKET, BY EXTRACTION SOURCE, 2018-2033 (USD THOUSAND)
TABLE 3786 HONG KONG PRIMARY PRODUCTION IN INDIUM MARKET, BY TYPE, 2018-2033 (USD THOUSAND)
TABLE 3787 HONG KONG SECONDARY PRODUCTION IN INDIUM MARKET, BY TYPE, 2018-2033 (USD THOUSAND)
TABLE 3788 HONG KONG INDIUM MARKET, BY DISTRIBUTION CHANNEL, 2018-2033 (USD THOUSAND)
TABLE 3789 HONG KONG INDIUM MARKET, BY TECHNOLOGY PLATFORM, 2018-2033 (USD THOUSAND)
TABLE 3790 HONG KONG INDIUM MARKET, BY END-USER INDUSTRY, 2018-2033 (USD THOUSAND)
TABLE 3791 HONG KONG CONSUMER ELECTRONICS INDUSTRY IN INDIUM MARKET, BY TYPE, 2018-2033 (USD THOUSAND)
TABLE 3792 HONG KONG FLAT PANEL DISPLAYS (LCD/OLED/LED) IN INDIUM MARKET, BY PURITY GRADE, 2018-2033 (USD THOUSAND)
TABLE 3793 HONG KONG TRANSPARENT CONDUCTIVE COATINGS (ITO) IN INDIUM MARKET, BY PURITY GRADE, 2018-2033 (USD THOUSAND)
TABLE 3794 HONG KONG TOUCHSCREEN DISPLAYS IN INDIUM MARKET, BY PURITY GRADE, 2018-2033 (USD THOUSAND)
TABLE 3795 HONG KONG FLEXIBLE DISPLAYS & ELECTRONICS IN INDIUM MARKET, BY PURITY GRADE, 2018-2033 (USD THOUSAND)
TABLE 3796 HONG KONG WEARABLE ELECTRONICS DEVICES IN INDIUM MARKET, BY PURITY GRADE, 2018-2033 (USD THOUSAND)
TABLE 3797 HONG KONG CAMERA & OPTICAL SENSORS IN INDIUM MARKET, BY PURITY GRADE, 2018-2033 (USD THOUSAND)
TABLE 3798 HONG KONG MINI-LED BACKLIGHTING IN INDIUM MARKET, BY PURITY GRADE, 2018-2033 (USD THOUSAND)
TABLE 3799 HONG KONG MICRO-LED DISPLAYS IN INDIUM MARKET, BY PURITY GRADE, 2018-2033 (USD THOUSAND)
TABLE 3800 HONG KONG DISPLAY PANEL INDUSTRY IN INDIUM MARKET, BY TYPE, 2018-2033 (USD THOUSAND)
TABLE 3801 HONG KONG LCD PANEL MANUFACTURING IN INDIUM MARKET, BY PURITY GRADE, 2018-2033 (USD THOUSAND)
TABLE 3802 HONG KONG OLED PANEL MANUFACTURING IN INDIUM MARKET, BY PURITY GRADE, 2018-2033 (USD THOUSAND)
TABLE 3803 HONG KONG DISPLAY PANEL MANUFACTURING IN INDIUM MARKET, BY PURITY GRADE, 2018-2033 (USD THOUSAND)
TABLE 3804 HONG KONG TOUCH PANEL SENSORS IN INDIUM MARKET, BY PURITY GRADE, 2018-2033 (USD THOUSAND)
TABLE 3805 HONG KONG TRANSPARENT CONDUCTIVE FILMS IN INDIUM MARKET, BY PURITY GRADE, 2018-2033 (USD THOUSAND)
TABLE 3806 HONG KONG FLEXIBLE & FOLDABLE DISPLAYS IN INDIUM MARKET, BY PURITY GRADE, 2018-2033 (USD THOUSAND)
TABLE 3807 HONG KONG AR/VR DISPLAYS IN INDIUM MARKET, BY PURITY GRADE, 2018-2033 (USD THOUSAND)
TABLE 3808 HONG KONG MICRODISPLAY DEVICES IN INDIUM MARKET, BY PURITY GRADE, 2018-2033 (USD THOUSAND)
TABLE 3809 HONG KONG BACKPLANE COATINGS IN INDIUM MARKET, BY PURITY GRADE, 2018-2033 (USD THOUSAND)
TABLE 3810 HONG KONG SEMICONDUCTOR INDUSTRY IN INDIUM MARKET, BY TYPE, 2018-2033 (USD THOUSAND)
TABLE 3811 HONG KONG III-V COMPOUND SEMICONDUCTORS IN INDIUM MARKET, BY PURITY GRADE, 2018-2033 (USD THOUSAND)
TABLE 3812 HONG KONG HIGH-FREQUENCY RF COMPONENTS IN INDIUM MARKET, BY PURITY GRADE, 2018-2033 (USD THOUSAND)
TABLE 3813 HONG KONG SEMICONDUCTOR SUBSTRATES & EPITAXY IN INDIUM MARKET, BY PURITY GRADE, 2018-2033 (USD THOUSAND)
TABLE 3814 HONG KONG LASER DIODES IN INDIUM MARKET, BY PURITY GRADE, 2018-2033 (USD THOUSAND)
TABLE 3815 HONG KONG PHOTODETECTORS IN INDIUM MARKET, BY PURITY GRADE, 2018-2033 (USD THOUSAND)
TABLE 3816 HONG KONG HIGH-SPEED OPTOELECTRONICS IN INDIUM MARKET, BY PURITY GRADE, 2018-2033 (USD THOUSAND)
TABLE 3817 HONG KONG INFRARED DETECTORS IN INDIUM MARKET, BY PURITY GRADE, 2018-2033 (USD THOUSAND)
TABLE 3818 HONG KONG INTEGRATED PHOTONIC CIRCUITS IN INDIUM MARKET, BY PURITY GRADE, 2018-2033 (USD THOUSAND)
TABLE 3819 HONG KONG SOLAR PHOTOVOLTAIC INDUSTRY IN INDIUM MARKET, BY TYPE, 2018-2033 (USD THOUSAND)
TABLE 3820 HONG KONG CIGS THIN-FILM SOLAR CELLS IN INDIUM MARKET, BY PURITY GRADE, 2018-2033 (USD THOUSAND)
TABLE 3821 HONG KONGHIGH-EFFICIENCY MODULES IN INDIUM MARKET, BY PURITY GRADE, 2018-2033 (USD THOUSAND)
TABLE 3822 HONG KONG THIN-FILM COATINGS IN INDIUM MARKET, BY PURITY GRADE, 2018-2033 (USD THOUSAND)
TABLE 3823 HONG KONG TRANSPARENT ELECTRODES IN INDIUM MARKET, BY PURITY GRADE, 2018-2033 (USD THOUSAND)
TABLE 3824 HONG KONG BIPV IN INDIUM MARKET, BY PURITY GRADE, 2018-2033 (USD THOUSAND)
TABLE 3825 HONG KONG FLEXIBLE SOLAR PANELS IN INDIUM MARKET, BY PURITY GRADE, 2018-2033 (USD THOUSAND)
TABLE 3826 HONG KONG PORTABLE SOLAR SYSTEMS IN INDIUM MARKET, BY PURITY GRADE, 2018-2033 (USD THOUSAND)
TABLE 3827 HONG KONG CONCENTRATED PV IN INDIUM MARKET, BY PURITY GRADE, 2018-2033 (USD THOUSAND)
TABLE 3828 HONG KONG AUTOMOTIVE INDUSTRY IN INDIUM MARKET, BY TYPE, 2018-2033 (USD THOUSAND)
TABLE 3829 HONG KONG AUTOMOTIVE DISPLAY PANELS IN INDIUM MARKET, BY PURITY GRADE, 2018-2033 (USD THOUSAND)
TABLE 3830 HONG KONGADAS SENSORS IN INDIUM MARKET, BY PURITY GRADE, 2018-2033 (USD THOUSAND)
TABLE 3831 HONG KONG VEHICLE CAMERA MODULES IN INDIUM MARKET, BY PURITY GRADE, 2018-2033 (USD THOUSAND)
TABLE 3832 HONG KONG AUTOMOTIVE OPTOELECTRONICS IN INDIUM MARKET, BY PURITY GRADE, 2018-2033 (USD THOUSAND)
TABLE 3833 HONG KONG POWER ELECTRONICS IN INDIUM MARKET, BY PURITY GRADE, 2018-2033 (USD THOUSAND)
TABLE 3834 HONG KONG TOUCHSCREEN INTERFACES IN INDIUM MARKET, BY PURITY GRADE, 2018-2033 (USD THOUSAND)
TABLE 3835 HONG KONG INFRARED SENSORS IN INDIUM MARKET, BY PURITY GRADE, 2018-2033 (USD THOUSAND)
TABLE 3836 HONG KONG SMART LIGHTING IN INDIUM MARKET, BY PURITY GRADE, 2018-2033 (USD THOUSAND)
TABLE 3837 HONG KONG TELECOMMUNICATION EQUIPMENT INDUSTRY IN INDIUM MARKET, BY TYPE, 2018-2033 (USD THOUSAND)
TABLE 3838 HONG KONG OPTICAL TRANSCEIVERS IN INDIUM MARKET, BY PURITY GRADE, 2018-2033 (USD THOUSAND)
TABLE 3839 HONG KONG RF POWER AMPLIFIERS IN INDIUM MARKET, BY PURITY GRADE, 2018-2033 (USD THOUSAND)
TABLE 3840 HONG KONG HIGH-FREQUENCY COMMUNICATION CHIPS IN INDIUM MARKET, BY PURITY GRADE, 2018-2033 (USD THOUSAND)
TABLE 3841 HONG KONG FIBER-OPTIC COMMUNICATION LASERS IN INDIUM MARKET, BY PURITY GRADE, 2018-2033 (USD THOUSAND)
TABLE 3842 HONG KONG PHOTODETECTORS FOR OPTICAL NETWORKS IN INDIUM MARKET, BY PURITY GRADE, 2018-2033 (USD THOUSAND)
TABLE 3843 HONG KONG 5G INFRASTRUCTURE COMPONENTS IN INDIUM MARKET, BY PURITY GRADE, 2018-2033 (USD THOUSAND)
TABLE 3844 HONG KONG OPTICAL NETWORK SWITCHING DEVICES IN INDIUM MARKET, BY PURITY GRADE, 2018-2033 (USD THOUSAND)
TABLE 3845 HONG KONG SATELLITE COMMUNICATION MODULES IN INDIUM MARKET, BY PURITY GRADE, 2018-2033 (USD THOUSAND)
TABLE 3846 HONG KONG OPTICAL & PHOTONICS INDUSTRY IN INDIUM MARKET, BY TYPE, 2018-2033 (USD THOUSAND)
TABLE 3847 HONG KONG OPTICAL COATINGS IN INDIUM MARKET, BY PURITY GRADE, 2018-2033 (USD THOUSAND)
TABLE 3848 HONG KONG FIBER OPTIC COMPONENTS IN INDIUM MARKET, BY PURITY GRADE, 2018-2033 (USD THOUSAND)
TABLE 3849 HONG KONG LASER COMPONENTS IN INDIUM MARKET, BY PURITY GRADE, 2018-2033 (USD THOUSAND)
TABLE 3850 HONG KONG OPTICAL SENSORS IN INDIUM MARKET, BY PURITY GRADE, 2018-2033 (USD THOUSAND)
TABLE 3851 HONG KONG INFRARED OPTICS IN INDIUM MARKET, BY PURITY GRADE, 2018-2033 (USD THOUSAND)
TABLE 3852 HONG KONG PICS IN INDIUM MARKET, BY PURITY GRADE, 2018-2033 (USD THOUSAND)
TABLE 3853 HONG KONG MIRRORS IN INDIUM MARKET, BY PURITY GRADE, 2018-2033 (USD THOUSAND)
TABLE 3854 HONG KONG SPECTROSCOPY IN INDIUM MARKET, BY PURITY GRADE, 2018-2033 (USD THOUSAND)
TABLE 3855 HONG KONG AEROSPACE & DEFENSE INDUSTRY IN INDIUM MARKET, BY TYPE, 2018-2033 (USD THOUSAND)
TABLE 3856 HONG KONG INFRARED IMAGING SYSTEMS IN INDIUM MARKET, BY PURITY GRADE, 2018-2033 (USD THOUSAND)
TABLE 3857 HONG KONG RADAR & RF COMPONENTS IN INDIUM MARKET, BY PURITY GRADE, 2018-2033 (USD THOUSAND)
TABLE 3858 HONG KONG SATELLITE COMMUNICATION IN INDIUM MARKET, BY PURITY GRADE, 2018-2033 (USD THOUSAND)
TABLE 3859 HONG KONG MILITARY OPTOELECTRONICS IN INDIUM MARKET, BY PURITY GRADE, 2018-2033 (USD THOUSAND)
TABLE 3860 HONG KONG AVIONICS DISPLAYS IN INDIUM MARKET, BY PURITY GRADE, 2018-2033 (USD THOUSAND)
TABLE 3861 HONG KONG SPACECRAFT SOLAR PANELS IN INDIUM MARKET, BY PURITY GRADE, 2018-2033 (USD THOUSAND)
TABLE 3862 HONG KONG THERMAL MATERIALS IN INDIUM MARKET, BY PURITY GRADE, 2018-2033 (USD THOUSAND)
TABLE 3863 HONG KONG CRYOGENIC MATERIALS IN INDIUM MARKET, BY PURITY GRADE, 2018-2033 (USD THOUSAND)
TABLE 3864 HONG KONG MEDICAL DEVICE INDUSTRY IN INDIUM MARKET, BY TYPE, 2018-2033 (USD THOUSAND)
TABLE 3865 HONG KONG MEDICAL IMAGING SENSORS IN INDIUM MARKET, BY PURITY GRADE, 2018-2033 (USD THOUSAND)
TABLE 3866 HONG KONG DIAGNOSTIC EQUIPMENT DISPLAYS IN INDIUM MARKET, BY PURITY GRADE, 2018-2033 (USD THOUSAND)
TABLE 3867 HONG KONG ADVANCED DIAGNOSTIC INSTRUMENTS IN INDIUM MARKET, BY PURITY GRADE, 2018-2033 (USD THOUSAND)
TABLE 3868 HONG KONG LASER SURGICAL EQUIPMENT IN INDIUM MARKET, BY PURITY GRADE, 2018-2033 (USD THOUSAND)
TABLE 3869 HONG KONG BIOMEDICAL OPTICAL DEVICES IN INDIUM MARKET, BY PURITY GRADE, 2018-2033 (USD THOUSAND)
TABLE 3870 HONG KONG RADIATION DETECTION EQUIPMENT IN INDIUM MARKET, BY PURITY GRADE, 2018-2033 (USD THOUSAND)
TABLE 3871 HONG KONG INFRARED MEDICAL SENSORS IN INDIUM MARKET, BY PURITY GRADE, 2018-2033 (USD THOUSAND)
TABLE 3872 HONG KONG PHOTOTHERAPY DEVICES IN INDIUM MARKET, BY PURITY GRADE, 2018-2033 (USD THOUSAND)
TABLE 3873 HONG KONG INDUSTRIAL EQUIPMENT MANUFACTURING IN INDIUM MARKET, BY TYPE, 2018-2033 (USD THOUSAND)
TABLE 3874 HONG KONG INDUSTRIAL SENSORS IN INDIUM MARKET, BY PURITY GRADE, 2018-2033 (USD THOUSAND)
TABLE 3875 HONG KONG VACUUM DEPOSITION COATINGS IN INDIUM MARKET, BY PURITY GRADE, 2018-2033 (USD THOUSAND)
TABLE 3876 HONG KONG PRECISION OPTICAL COMPONENTS IN INDIUM MARKET, BY PURITY GRADE, 2018-2033 (USD THOUSAND)
TABLE 3877 HONG KONG THERMAL INTERFACE MATERIALS IN INDIUM MARKET, BY PURITY GRADE, 2018-2033 (USD THOUSAND)
TABLE 3878 HONG KONG INDUSTRIAL LASER SYSTEMS IN INDIUM MARKET, BY PURITY GRADE, 2018-2033 (USD THOUSAND)
TABLE 3879 HONG KONG INDUSTRIAL INFRARED DETECTORS IN INDIUM MARKET, BY PURITY GRADE, 2018-2033 (USD THOUSAND)
TABLE 3880 HONG KONG PRECISION MEASUREMENT EQUIPMENT IN INDIUM MARKET, BY PURITY GRADE, 2018-2033 (USD THOUSAND)
TABLE 3881 HONG KONG SPECIALTY ELECTRONIC COMPONENTS IN INDIUM MARKET, BY PURITY GRADE, 2018-2033 (USD THOUSAND)
TABLE 3882 HONG KONG OTHERS IN INDIUM MARKET, BY TYPE, 2018-2033 (USD THOUSAND)
TABLE 3883 HONG KONG ADVANCED MATERIALS MANUFACTURING IN INDIUM MARKET, BY PURITY GRADE, 2018-2033 (USD THOUSAND)
TABLE 3884 HONG KONG SPECIALTY ALLOY PRODUCTION IN INDIUM MARKET, BY PURITY GRADE, 2018-2033 (USD THOUSAND)
TABLE 3885 HONG KONG THERMAL MANAGEMENT MATERIALS IN INDIUM MARKET, BY PURITY GRADE, 2018-2033 (USD THOUSAND)
TABLE 3886 HONG KONG PRECISION SCIENTIFIC INSTRUMENTS IN INDIUM MARKET, BY PURITY GRADE, 2018-2033 (USD THOUSAND)
TABLE 3887 HONG KONG RESEARCH INSTITUTES & UNIVERSITIES IN INDIUM MARKET, BY PURITY GRADE, 2018-2033 (USD THOUSAND)
TABLE 3888 HONG KONG NUCLEAR INDUSTRY APPLICATIONS IN INDIUM MARKET, BY PURITY GRADE, 2018-2033 (USD THOUSAND)
TABLE 3889 HONG KONG SPECIALTY CHEMICAL PRODUCTION IN INDIUM MARKET, BY PURITY GRADE, 2018-2033 (USD THOUSAND)
TABLE 3890 HONG KONG DEFENSE RESEARCH LABORATORIES IN INDIUM MARKET, BY PURITY GRADE, 2018-2033 (USD THOUSAND)
TABLE 3891 HONG KONG CRYOGENIC EQUIPMENT MANUFACTURING IN INDIUM MARKET, BY PURITY GRADE, 2018-2033 (USD THOUSAND)
TABLE 3892 NEW ZEALAND INDIUM MARKET, BY PRODUCT TYPE, 2018-2033 (USD THOUSAND)
TABLE 3893 NEW ZEALAND INGOTS IN INDIUM MARKET, BY TYPE, 2018-2033 (USD THOUSAND)
TABLE 3894 NEW ZEALAND INDIUM MARKET, BY MATERIAL COMPOSITION, 2018-2033 (USD THOUSAND)
TABLE 3895 NEW ZEALAND INDIUM ALLOYS IN INDIUM MARKET, BY TYPE, 2018-2033 (USD THOUSAND)
TABLE 3896 NEW ZEALAND INDIUM COMPOUNDS IN INDIUM MARKET, BY TYPE, 2018-2033 (USD THOUSAND)
TABLE 3897 NEW ZEALAND INDIUM MARKET, BY PURITY GRADE, 2018-2033 (USD THOUSAND)
TABLE 3898 NEW ZEALAND INDIUM MARKET, BY EXTRACTION SOURCE, 2018-2033 (USD THOUSAND)
TABLE 3899 NEW ZEALAND PRIMARY PRODUCTION IN INDIUM MARKET, BY TYPE, 2018-2033 (USD THOUSAND)
TABLE 3900 NEW ZEALAND SECONDARY PRODUCTION IN INDIUM MARKET, BY TYPE, 2018-2033 (USD THOUSAND)
TABLE 3901 NEW ZEALAND INDIUM MARKET, BY DISTRIBUTION CHANNEL, 2018-2033 (USD THOUSAND)
TABLE 3902 NEW ZEALAND INDIUM MARKET, BY TECHNOLOGY PLATFORM, 2018-2033 (USD THOUSAND)
TABLE 3903 NEW ZEALAND INDIUM MARKET, BY END-USER INDUSTRY, 2018-2033 (USD THOUSAND)
TABLE 3904 NEW ZEALAND CONSUMER ELECTRONICS INDUSTRY IN INDIUM MARKET, BY TYPE, 2018-2033 (USD THOUSAND)
TABLE 3905 NEW ZEALAND FLAT PANEL DISPLAYS (LCD/OLED/LED) IN INDIUM MARKET, BY PURITY GRADE, 2018-2033 (USD THOUSAND)
TABLE 3906 NEW ZEALAND TRANSPARENT CONDUCTIVE COATINGS (ITO) IN INDIUM MARKET, BY PURITY GRADE, 2018-2033 (USD THOUSAND)
TABLE 3907 NEW ZEALAND TOUCHSCREEN DISPLAYS IN INDIUM MARKET, BY PURITY GRADE, 2018-2033 (USD THOUSAND)
TABLE 3908 NEW ZEALAND FLEXIBLE DISPLAYS & ELECTRONICS IN INDIUM MARKET, BY PURITY GRADE, 2018-2033 (USD THOUSAND)
TABLE 3909 NEW ZEALAND WEARABLE ELECTRONICS DEVICES IN INDIUM MARKET, BY PURITY GRADE, 2018-2033 (USD THOUSAND)
TABLE 3910 NEW ZEALAND CAMERA & OPTICAL SENSORS IN INDIUM MARKET, BY PURITY GRADE, 2018-2033 (USD THOUSAND)
TABLE 3911 NEW ZEALAND MINI-LED BACKLIGHTING IN INDIUM MARKET, BY PURITY GRADE, 2018-2033 (USD THOUSAND)
TABLE 3912 NEW ZEALAND MICRO-LED DISPLAYS IN INDIUM MARKET, BY PURITY GRADE, 2018-2033 (USD THOUSAND)
TABLE 3913 NEW ZEALAND DISPLAY PANEL INDUSTRY IN INDIUM MARKET, BY TYPE, 2018-2033 (USD THOUSAND)
TABLE 3914 NEW ZEALAND LCD PANEL MANUFACTURING IN INDIUM MARKET, BY PURITY GRADE, 2018-2033 (USD THOUSAND)
TABLE 3915 NEW ZEALAND OLED PANEL MANUFACTURING IN INDIUM MARKET, BY PURITY GRADE, 2018-2033 (USD THOUSAND)
TABLE 3916 NEW ZEALAND DISPLAY PANEL MANUFACTURING IN INDIUM MARKET, BY PURITY GRADE, 2018-2033 (USD THOUSAND)
TABLE 3917 NEW ZEALAND TOUCH PANEL SENSORS IN INDIUM MARKET, BY PURITY GRADE, 2018-2033 (USD THOUSAND)
TABLE 3918 NEW ZEALAND TRANSPARENT CONDUCTIVE FILMS IN INDIUM MARKET, BY PURITY GRADE, 2018-2033 (USD THOUSAND)
TABLE 3919 NEW ZEALAND FLEXIBLE & FOLDABLE DISPLAYS IN INDIUM MARKET, BY PURITY GRADE, 2018-2033 (USD THOUSAND)
TABLE 3920 NEW ZEALAND AR/VR DISPLAYS IN INDIUM MARKET, BY PURITY GRADE, 2018-2033 (USD THOUSAND)
TABLE 3921 NEW ZEALAND MICRODISPLAY DEVICES IN INDIUM MARKET, BY PURITY GRADE, 2018-2033 (USD THOUSAND)
TABLE 3922 NEW ZEALAND BACKPLANE COATINGS IN INDIUM MARKET, BY PURITY GRADE, 2018-2033 (USD THOUSAND)
TABLE 3923 NEW ZEALAND SEMICONDUCTOR INDUSTRY IN INDIUM MARKET, BY TYPE, 2018-2033 (USD THOUSAND)
TABLE 3924 NEW ZEALAND III-V COMPOUND SEMICONDUCTORS IN INDIUM MARKET, BY PURITY GRADE, 2018-2033 (USD THOUSAND)
TABLE 3925 NEW ZEALAND HIGH-FREQUENCY RF COMPONENTS IN INDIUM MARKET, BY PURITY GRADE, 2018-2033 (USD THOUSAND)
TABLE 3926 NEW ZEALAND SEMICONDUCTOR SUBSTRATES & EPITAXY IN INDIUM MARKET, BY PURITY GRADE, 2018-2033 (USD THOUSAND)
TABLE 3927 NEW ZEALAND LASER DIODES IN INDIUM MARKET, BY PURITY GRADE, 2018-2033 (USD THOUSAND)
TABLE 3928 NEW ZEALAND PHOTODETECTORS IN INDIUM MARKET, BY PURITY GRADE, 2018-2033 (USD THOUSAND)
TABLE 3929 NEW ZEALAND HIGH-SPEED OPTOELECTRONICS IN INDIUM MARKET, BY PURITY GRADE, 2018-2033 (USD THOUSAND)
TABLE 3930 NEW ZEALAND INFRARED DETECTORS IN INDIUM MARKET, BY PURITY GRADE, 2018-2033 (USD THOUSAND)
TABLE 3931 NEW ZEALAND INTEGRATED PHOTONIC CIRCUITS IN INDIUM MARKET, BY PURITY GRADE, 2018-2033 (USD THOUSAND)
TABLE 3932 NEW ZEALAND SOLAR PHOTOVOLTAIC INDUSTRY IN INDIUM MARKET, BY TYPE, 2018-2033 (USD THOUSAND)
TABLE 3933 NEW ZEALAND CIGS THIN-FILM SOLAR CELLS IN INDIUM MARKET, BY PURITY GRADE, 2018-2033 (USD THOUSAND)
TABLE 3934 NEW ZEALANDHIGH-EFFICIENCY MODULES IN INDIUM MARKET, BY PURITY GRADE, 2018-2033 (USD THOUSAND)
TABLE 3935 NEW ZEALAND THIN-FILM COATINGS IN INDIUM MARKET, BY PURITY GRADE, 2018-2033 (USD THOUSAND)
TABLE 3936 NEW ZEALAND TRANSPARENT ELECTRODES IN INDIUM MARKET, BY PURITY GRADE, 2018-2033 (USD THOUSAND)
TABLE 3937 NEW ZEALAND BIPV IN INDIUM MARKET, BY PURITY GRADE, 2018-2033 (USD THOUSAND)
TABLE 3938 NEW ZEALAND FLEXIBLE SOLAR PANELS IN INDIUM MARKET, BY PURITY GRADE, 2018-2033 (USD THOUSAND)
TABLE 3939 NEW ZEALAND PORTABLE SOLAR SYSTEMS IN INDIUM MARKET, BY PURITY GRADE, 2018-2033 (USD THOUSAND)
TABLE 3940 NEW ZEALAND CONCENTRATED PV IN INDIUM MARKET, BY PURITY GRADE, 2018-2033 (USD THOUSAND)
TABLE 3941 NEW ZEALAND AUTOMOTIVE INDUSTRY IN INDIUM MARKET, BY TYPE, 2018-2033 (USD THOUSAND)
TABLE 3942 NEW ZEALAND AUTOMOTIVE DISPLAY PANELS IN INDIUM MARKET, BY PURITY GRADE, 2018-2033 (USD THOUSAND)
TABLE 3943 NEW ZEALANDADAS SENSORS IN INDIUM MARKET, BY PURITY GRADE, 2018-2033 (USD THOUSAND)
TABLE 3944 NEW ZEALAND VEHICLE CAMERA MODULES IN INDIUM MARKET, BY PURITY GRADE, 2018-2033 (USD THOUSAND)
TABLE 3945 NEW ZEALAND AUTOMOTIVE OPTOELECTRONICS IN INDIUM MARKET, BY PURITY GRADE, 2018-2033 (USD THOUSAND)
TABLE 3946 NEW ZEALAND POWER ELECTRONICS IN INDIUM MARKET, BY PURITY GRADE, 2018-2033 (USD THOUSAND)
TABLE 3947 NEW ZEALAND TOUCHSCREEN INTERFACES IN INDIUM MARKET, BY PURITY GRADE, 2018-2033 (USD THOUSAND)
TABLE 3948 NEW ZEALAND INFRARED SENSORS IN INDIUM MARKET, BY PURITY GRADE, 2018-2033 (USD THOUSAND)
TABLE 3949 NEW ZEALAND SMART LIGHTING IN INDIUM MARKET, BY PURITY GRADE, 2018-2033 (USD THOUSAND)
TABLE 3950 NEW ZEALAND TELECOMMUNICATION EQUIPMENT INDUSTRY IN INDIUM MARKET, BY TYPE, 2018-2033 (USD THOUSAND)
TABLE 3951 NEW ZEALAND OPTICAL TRANSCEIVERS IN INDIUM MARKET, BY PURITY GRADE, 2018-2033 (USD THOUSAND)
TABLE 3952 NEW ZEALAND RF POWER AMPLIFIERS IN INDIUM MARKET, BY PURITY GRADE, 2018-2033 (USD THOUSAND)
TABLE 3953 NEW ZEALAND HIGH-FREQUENCY COMMUNICATION CHIPS IN INDIUM MARKET, BY PURITY GRADE, 2018-2033 (USD THOUSAND)
TABLE 3954 NEW ZEALAND FIBER-OPTIC COMMUNICATION LASERS IN INDIUM MARKET, BY PURITY GRADE, 2018-2033 (USD THOUSAND)
TABLE 3955 NEW ZEALAND PHOTODETECTORS FOR OPTICAL NETWORKS IN INDIUM MARKET, BY PURITY GRADE, 2018-2033 (USD THOUSAND)
TABLE 3956 NEW ZEALAND 5G INFRASTRUCTURE COMPONENTS IN INDIUM MARKET, BY PURITY GRADE, 2018-2033 (USD THOUSAND)
TABLE 3957 NEW ZEALAND OPTICAL NETWORK SWITCHING DEVICES IN INDIUM MARKET, BY PURITY GRADE, 2018-2033 (USD THOUSAND)
TABLE 3958 NEW ZEALAND SATELLITE COMMUNICATION MODULES IN INDIUM MARKET, BY PURITY GRADE, 2018-2033 (USD THOUSAND)
TABLE 3959 NEW ZEALAND OPTICAL & PHOTONICS INDUSTRY IN INDIUM MARKET, BY TYPE, 2018-2033 (USD THOUSAND)
TABLE 3960 NEW ZEALAND OPTICAL COATINGS IN INDIUM MARKET, BY PURITY GRADE, 2018-2033 (USD THOUSAND)
TABLE 3961 NEW ZEALAND FIBER OPTIC COMPONENTS IN INDIUM MARKET, BY PURITY GRADE, 2018-2033 (USD THOUSAND)
TABLE 3962 NEW ZEALAND LASER COMPONENTS IN INDIUM MARKET, BY PURITY GRADE, 2018-2033 (USD THOUSAND)
TABLE 3963 NEW ZEALAND OPTICAL SENSORS IN INDIUM MARKET, BY PURITY GRADE, 2018-2033 (USD THOUSAND)
TABLE 3964 NEW ZEALAND INFRARED OPTICS IN INDIUM MARKET, BY PURITY GRADE, 2018-2033 (USD THOUSAND)
TABLE 3965 NEW ZEALAND PICS IN INDIUM MARKET, BY PURITY GRADE, 2018-2033 (USD THOUSAND)
TABLE 3966 NEW ZEALAND MIRRORS IN INDIUM MARKET, BY PURITY GRADE, 2018-2033 (USD THOUSAND)
TABLE 3967 NEW ZEALAND SPECTROSCOPY IN INDIUM MARKET, BY PURITY GRADE, 2018-2033 (USD THOUSAND)
TABLE 3968 NEW ZEALAND AEROSPACE & DEFENSE INDUSTRY IN INDIUM MARKET, BY TYPE, 2018-2033 (USD THOUSAND)
TABLE 3969 NEW ZEALAND INFRARED IMAGING SYSTEMS IN INDIUM MARKET, BY PURITY GRADE, 2018-2033 (USD THOUSAND)
TABLE 3970 NEW ZEALAND RADAR & RF COMPONENTS IN INDIUM MARKET, BY PURITY GRADE, 2018-2033 (USD THOUSAND)
TABLE 3971 NEW ZEALAND SATELLITE COMMUNICATION IN INDIUM MARKET, BY PURITY GRADE, 2018-2033 (USD THOUSAND)
TABLE 3972 NEW ZEALAND MILITARY OPTOELECTRONICS IN INDIUM MARKET, BY PURITY GRADE, 2018-2033 (USD THOUSAND)
TABLE 3973 NEW ZEALAND AVIONICS DISPLAYS IN INDIUM MARKET, BY PURITY GRADE, 2018-2033 (USD THOUSAND)
TABLE 3974 NEW ZEALAND SPACECRAFT SOLAR PANELS IN INDIUM MARKET, BY PURITY GRADE, 2018-2033 (USD THOUSAND)
TABLE 3975 NEW ZEALAND THERMAL MATERIALS IN INDIUM MARKET, BY PURITY GRADE, 2018-2033 (USD THOUSAND)
TABLE 3976 NEW ZEALAND CRYOGENIC MATERIALS IN INDIUM MARKET, BY PURITY GRADE, 2018-2033 (USD THOUSAND)
TABLE 3977 NEW ZEALAND MEDICAL DEVICE INDUSTRY IN INDIUM MARKET, BY TYPE, 2018-2033 (USD THOUSAND)
TABLE 3978 NEW ZEALAND MEDICAL IMAGING SENSORS IN INDIUM MARKET, BY PURITY GRADE, 2018-2033 (USD THOUSAND)
TABLE 3979 NEW ZEALAND DIAGNOSTIC EQUIPMENT DISPLAYS IN INDIUM MARKET, BY PURITY GRADE, 2018-2033 (USD THOUSAND)
TABLE 3980 NEW ZEALAND ADVANCED DIAGNOSTIC INSTRUMENTS IN INDIUM MARKET, BY PURITY GRADE, 2018-2033 (USD THOUSAND)
TABLE 3981 NEW ZEALAND LASER SURGICAL EQUIPMENT IN INDIUM MARKET, BY PURITY GRADE, 2018-2033 (USD THOUSAND)
TABLE 3982 NEW ZEALAND BIOMEDICAL OPTICAL DEVICES IN INDIUM MARKET, BY PURITY GRADE, 2018-2033 (USD THOUSAND)
TABLE 3983 NEW ZEALAND RADIATION DETECTION EQUIPMENT IN INDIUM MARKET, BY PURITY GRADE, 2018-2033 (USD THOUSAND)
TABLE 3984 NEW ZEALAND INFRARED MEDICAL SENSORS IN INDIUM MARKET, BY PURITY GRADE, 2018-2033 (USD THOUSAND)
TABLE 3985 NEW ZEALAND PHOTOTHERAPY DEVICES IN INDIUM MARKET, BY PURITY GRADE, 2018-2033 (USD THOUSAND)
TABLE 3986 NEW ZEALAND INDUSTRIAL EQUIPMENT MANUFACTURING IN INDIUM MARKET, BY TYPE, 2018-2033 (USD THOUSAND)
TABLE 3987 NEW ZEALAND INDUSTRIAL SENSORS IN INDIUM MARKET, BY PURITY GRADE, 2018-2033 (USD THOUSAND)
TABLE 3988 NEW ZEALAND VACUUM DEPOSITION COATINGS IN INDIUM MARKET, BY PURITY GRADE, 2018-2033 (USD THOUSAND)
TABLE 3989 NEW ZEALAND PRECISION OPTICAL COMPONENTS IN INDIUM MARKET, BY PURITY GRADE, 2018-2033 (USD THOUSAND)
TABLE 3990 NEW ZEALAND THERMAL INTERFACE MATERIALS IN INDIUM MARKET, BY PURITY GRADE, 2018-2033 (USD THOUSAND)
TABLE 3991 NEW ZEALAND INDUSTRIAL LASER SYSTEMS IN INDIUM MARKET, BY PURITY GRADE, 2018-2033 (USD THOUSAND)
TABLE 3992 NEW ZEALAND INDUSTRIAL INFRARED DETECTORS IN INDIUM MARKET, BY PURITY GRADE, 2018-2033 (USD THOUSAND)
TABLE 3993 NEW ZEALAND PRECISION MEASUREMENT EQUIPMENT IN INDIUM MARKET, BY PURITY GRADE, 2018-2033 (USD THOUSAND)
TABLE 3994 NEW ZEALAND SPECIALTY ELECTRONIC COMPONENTS IN INDIUM MARKET, BY PURITY GRADE, 2018-2033 (USD THOUSAND)
TABLE 3995 NEW ZEALAND OTHERS IN INDIUM MARKET, BY TYPE, 2018-2033 (USD THOUSAND)
TABLE 3996 NEW ZEALAND ADVANCED MATERIALS MANUFACTURING IN INDIUM MARKET, BY PURITY GRADE, 2018-2033 (USD THOUSAND)
TABLE 3997 NEW ZEALAND SPECIALTY ALLOY PRODUCTION IN INDIUM MARKET, BY PURITY GRADE, 2018-2033 (USD THOUSAND)
TABLE 3998 NEW ZEALAND THERMAL MANAGEMENT MATERIALS IN INDIUM MARKET, BY PURITY GRADE, 2018-2033 (USD THOUSAND)
TABLE 3999 NEW ZEALAND PRECISION SCIENTIFIC INSTRUMENTS IN INDIUM MARKET, BY PURITY GRADE, 2018-2033 (USD THOUSAND)
TABLE 4000 NEW ZEALAND RESEARCH INSTITUTES & UNIVERSITIES IN INDIUM MARKET, BY PURITY GRADE, 2018-2033 (USD THOUSAND)
TABLE 4001 NEW ZEALAND NUCLEAR INDUSTRY APPLICATIONS IN INDIUM MARKET, BY PURITY GRADE, 2018-2033 (USD THOUSAND)
TABLE 4002 NEW ZEALAND SPECIALTY CHEMICAL PRODUCTION IN INDIUM MARKET, BY PURITY GRADE, 2018-2033 (USD THOUSAND)
TABLE 4003 NEW ZEALAND DEFENSE RESEARCH LABORATORIES IN INDIUM MARKET, BY PURITY GRADE, 2018-2033 (USD THOUSAND)
TABLE 4004 NEW ZEALAND CRYOGENIC EQUIPMENT MANUFACTURING IN INDIUM MARKET, BY PURITY GRADE, 2018-2033 (USD THOUSAND)
TABLE 4005 REST OF ASIA-PACIFIC INDIUM MARKET, BY PRODUCT TYPE, 2018-2033 (USD THOUSAND)
TABLE 4006 REST OF ASIA-PACIFIC INGOTS IN INDIUM MARKET, BY TYPE, 2018-2033 (USD THOUSAND)
TABLE 4007 REST OF ASIA-PACIFIC INDIUM MARKET, BY MATERIAL COMPOSITION, 2018-2033 (USD THOUSAND)
TABLE 4008 REST OF ASIA-PACIFIC INDIUM ALLOYS IN INDIUM MARKET, BY TYPE, 2018-2033 (USD THOUSAND)
TABLE 4009 REST OF ASIA-PACIFIC INDIUM COMPOUNDS IN INDIUM MARKET, BY TYPE, 2018-2033 (USD THOUSAND)
TABLE 4010 REST OF ASIA-PACIFIC INDIUM MARKET, BY PURITY GRADE, 2018-2033 (USD THOUSAND)
TABLE 4011 REST OF ASIA-PACIFIC INDIUM MARKET, BY EXTRACTION SOURCE, 2018-2033 (USD THOUSAND)
TABLE 4012 REST OF ASIA-PACIFIC PRIMARY PRODUCTION IN INDIUM MARKET, BY TYPE, 2018-2033 (USD THOUSAND)
TABLE 4013 REST OF ASIA-PACIFIC SECONDARY PRODUCTION IN INDIUM MARKET, BY TYPE, 2018-2033 (USD THOUSAND)
TABLE 4014 REST OF ASIA-PACIFIC INDIUM MARKET, BY DISTRIBUTION CHANNEL, 2018-2033 (USD THOUSAND)
TABLE 4015 REST OF ASIA-PACIFIC INDIUM MARKET, BY TECHNOLOGY PLATFORM, 2018-2033 (USD THOUSAND)
TABLE 4016 REST OF ASIA-PACIFIC INDIUM MARKET, BY END-USER INDUSTRY, 2018-2033 (USD THOUSAND)
TABLE 4017 REST OF ASIA-PACIFIC CONSUMER ELECTRONICS INDUSTRY IN INDIUM MARKET, BY TYPE, 2018-2033 (USD THOUSAND)
TABLE 4018 REST OF ASIA-PACIFIC FLAT PANEL DISPLAYS (LCD/OLED/LED) IN INDIUM MARKET, BY PURITY GRADE, 2018-2033 (USD THOUSAND)
TABLE 4019 REST OF ASIA-PACIFIC TRANSPARENT CONDUCTIVE COATINGS (ITO) IN INDIUM MARKET, BY PURITY GRADE, 2018-2033 (USD THOUSAND)
TABLE 4020 REST OF ASIA-PACIFIC TOUCHSCREEN DISPLAYS IN INDIUM MARKET, BY PURITY GRADE, 2018-2033 (USD THOUSAND)
TABLE 4021 REST OF ASIA-PACIFIC FLEXIBLE DISPLAYS & ELECTRONICS IN INDIUM MARKET, BY PURITY GRADE, 2018-2033 (USD THOUSAND)
TABLE 4022 REST OF ASIA-PACIFIC WEARABLE ELECTRONICS DEVICES IN INDIUM MARKET, BY PURITY GRADE, 2018-2033 (USD THOUSAND)
TABLE 4023 REST OF ASIA-PACIFIC CAMERA & OPTICAL SENSORS IN INDIUM MARKET, BY PURITY GRADE, 2018-2033 (USD THOUSAND)
TABLE 4024 REST OF ASIA-PACIFIC MINI-LED BACKLIGHTING IN INDIUM MARKET, BY PURITY GRADE, 2018-2033 (USD THOUSAND)
TABLE 4025 REST OF ASIA-PACIFIC MICRO-LED DISPLAYS IN INDIUM MARKET, BY PURITY GRADE, 2018-2033 (USD THOUSAND)
TABLE 4026 REST OF ASIA-PACIFIC DISPLAY PANEL INDUSTRY IN INDIUM MARKET, BY TYPE, 2018-2033 (USD THOUSAND)
TABLE 4027 REST OF ASIA-PACIFIC LCD PANEL MANUFACTURING IN INDIUM MARKET, BY PURITY GRADE, 2018-2033 (USD THOUSAND)
TABLE 4028 REST OF ASIA-PACIFIC OLED PANEL MANUFACTURING IN INDIUM MARKET, BY PURITY GRADE, 2018-2033 (USD THOUSAND)
TABLE 4029 REST OF ASIA-PACIFIC DISPLAY PANEL MANUFACTURING IN INDIUM MARKET, BY PURITY GRADE, 2018-2033 (USD THOUSAND)
TABLE 4030 REST OF ASIA-PACIFIC TOUCH PANEL SENSORS IN INDIUM MARKET, BY PURITY GRADE, 2018-2033 (USD THOUSAND)
TABLE 4031 REST OF ASIA-PACIFIC TRANSPARENT CONDUCTIVE FILMS IN INDIUM MARKET, BY PURITY GRADE, 2018-2033 (USD THOUSAND)
TABLE 4032 REST OF ASIA-PACIFIC FLEXIBLE & FOLDABLE DISPLAYS IN INDIUM MARKET, BY PURITY GRADE, 2018-2033 (USD THOUSAND)
TABLE 4033 REST OF ASIA-PACIFIC AR/VR DISPLAYS IN INDIUM MARKET, BY PURITY GRADE, 2018-2033 (USD THOUSAND)
TABLE 4034 REST OF ASIA-PACIFIC MICRODISPLAY DEVICES IN INDIUM MARKET, BY PURITY GRADE, 2018-2033 (USD THOUSAND)
TABLE 4035 REST OF ASIA-PACIFIC BACKPLANE COATINGS IN INDIUM MARKET, BY PURITY GRADE, 2018-2033 (USD THOUSAND)
TABLE 4036 REST OF ASIA-PACIFIC SEMICONDUCTOR INDUSTRY IN INDIUM MARKET, BY TYPE, 2018-2033 (USD THOUSAND)
TABLE 4037 REST OF ASIA-PACIFIC III-V COMPOUND SEMICONDUCTORS IN INDIUM MARKET, BY PURITY GRADE, 2018-2033 (USD THOUSAND)
TABLE 4038 REST OF ASIA-PACIFIC HIGH-FREQUENCY RF COMPONENTS IN INDIUM MARKET, BY PURITY GRADE, 2018-2033 (USD THOUSAND)
TABLE 4039 REST OF ASIA-PACIFIC SEMICONDUCTOR SUBSTRATES & EPITAXY IN INDIUM MARKET, BY PURITY GRADE, 2018-2033 (USD THOUSAND)
TABLE 4040 REST OF ASIA-PACIFIC LASER DIODES IN INDIUM MARKET, BY PURITY GRADE, 2018-2033 (USD THOUSAND)
TABLE 4041 REST OF ASIA-PACIFIC PHOTODETECTORS IN INDIUM MARKET, BY PURITY GRADE, 2018-2033 (USD THOUSAND)
TABLE 4042 REST OF ASIA-PACIFIC HIGH-SPEED OPTOELECTRONICS IN INDIUM MARKET, BY PURITY GRADE, 2018-2033 (USD THOUSAND)
TABLE 4043 REST OF ASIA-PACIFIC INFRARED DETECTORS IN INDIUM MARKET, BY PURITY GRADE, 2018-2033 (USD THOUSAND)
TABLE 4044 REST OF ASIA-PACIFIC INTEGRATED PHOTONIC CIRCUITS IN INDIUM MARKET, BY PURITY GRADE, 2018-2033 (USD THOUSAND)
TABLE 4045 REST OF ASIA-PACIFIC SOLAR PHOTOVOLTAIC INDUSTRY IN INDIUM MARKET, BY TYPE, 2018-2033 (USD THOUSAND)
TABLE 4046 REST OF ASIA-PACIFIC CIGS THIN-FILM SOLAR CELLS IN INDIUM MARKET, BY PURITY GRADE, 2018-2033 (USD THOUSAND)
TABLE 4047 REST OF ASIA-PACIFICHIGH-EFFICIENCY MODULES IN INDIUM MARKET, BY PURITY GRADE, 2018-2033 (USD THOUSAND)
TABLE 4048 REST OF ASIA-PACIFIC THIN-FILM COATINGS IN INDIUM MARKET, BY PURITY GRADE, 2018-2033 (USD THOUSAND)
TABLE 4049 REST OF ASIA-PACIFIC TRANSPARENT ELECTRODES IN INDIUM MARKET, BY PURITY GRADE, 2018-2033 (USD THOUSAND)
TABLE 4050 REST OF ASIA-PACIFIC BIPV IN INDIUM MARKET, BY PURITY GRADE, 2018-2033 (USD THOUSAND)
TABLE 4051 REST OF ASIA-PACIFIC FLEXIBLE SOLAR PANELS IN INDIUM MARKET, BY PURITY GRADE, 2018-2033 (USD THOUSAND)
TABLE 4052 REST OF ASIA-PACIFIC PORTABLE SOLAR SYSTEMS IN INDIUM MARKET, BY PURITY GRADE, 2018-2033 (USD THOUSAND)
TABLE 4053 REST OF ASIA-PACIFIC CONCENTRATED PV IN INDIUM MARKET, BY PURITY GRADE, 2018-2033 (USD THOUSAND)
TABLE 4054 REST OF ASIA-PACIFIC AUTOMOTIVE INDUSTRY IN INDIUM MARKET, BY TYPE, 2018-2033 (USD THOUSAND)
TABLE 4055 REST OF ASIA-PACIFIC AUTOMOTIVE DISPLAY PANELS IN INDIUM MARKET, BY PURITY GRADE, 2018-2033 (USD THOUSAND)
TABLE 4056 REST OF ASIA-PACIFICADAS SENSORS IN INDIUM MARKET, BY PURITY GRADE, 2018-2033 (USD THOUSAND)
TABLE 4057 REST OF ASIA-PACIFIC VEHICLE CAMERA MODULES IN INDIUM MARKET, BY PURITY GRADE, 2018-2033 (USD THOUSAND)
TABLE 4058 REST OF ASIA-PACIFIC AUTOMOTIVE OPTOELECTRONICS IN INDIUM MARKET, BY PURITY GRADE, 2018-2033 (USD THOUSAND)
TABLE 4059 REST OF ASIA-PACIFIC POWER ELECTRONICS IN INDIUM MARKET, BY PURITY GRADE, 2018-2033 (USD THOUSAND)
TABLE 4060 REST OF ASIA-PACIFIC TOUCHSCREEN INTERFACES IN INDIUM MARKET, BY PURITY GRADE, 2018-2033 (USD THOUSAND)
TABLE 4061 REST OF ASIA-PACIFIC INFRARED SENSORS IN INDIUM MARKET, BY PURITY GRADE, 2018-2033 (USD THOUSAND)
TABLE 4062 REST OF ASIA-PACIFIC SMART LIGHTING IN INDIUM MARKET, BY PURITY GRADE, 2018-2033 (USD THOUSAND)
TABLE 4063 REST OF ASIA-PACIFIC TELECOMMUNICATION EQUIPMENT INDUSTRY IN INDIUM MARKET, BY TYPE, 2018-2033 (USD THOUSAND)
TABLE 4064 REST OF ASIA-PACIFIC OPTICAL TRANSCEIVERS IN INDIUM MARKET, BY PURITY GRADE, 2018-2033 (USD THOUSAND)
TABLE 4065 REST OF ASIA-PACIFIC RF POWER AMPLIFIERS IN INDIUM MARKET, BY PURITY GRADE, 2018-2033 (USD THOUSAND)
TABLE 4066 REST OF ASIA-PACIFIC HIGH-FREQUENCY COMMUNICATION CHIPS IN INDIUM MARKET, BY PURITY GRADE, 2018-2033 (USD THOUSAND)
TABLE 4067 REST OF ASIA-PACIFIC FIBER-OPTIC COMMUNICATION LASERS IN INDIUM MARKET, BY PURITY GRADE, 2018-2033 (USD THOUSAND)
TABLE 4068 REST OF ASIA-PACIFIC PHOTODETECTORS FOR OPTICAL NETWORKS IN INDIUM MARKET, BY PURITY GRADE, 2018-2033 (USD THOUSAND)
TABLE 4069 REST OF ASIA-PACIFIC 5G INFRASTRUCTURE COMPONENTS IN INDIUM MARKET, BY PURITY GRADE, 2018-2033 (USD THOUSAND)
TABLE 4070 REST OF ASIA-PACIFIC OPTICAL NETWORK SWITCHING DEVICES IN INDIUM MARKET, BY PURITY GRADE, 2018-2033 (USD THOUSAND)
TABLE 4071 REST OF ASIA-PACIFIC SATELLITE COMMUNICATION MODULES IN INDIUM MARKET, BY PURITY GRADE, 2018-2033 (USD THOUSAND)
TABLE 4072 REST OF ASIA-PACIFIC OPTICAL & PHOTONICS INDUSTRY IN INDIUM MARKET, BY TYPE, 2018-2033 (USD THOUSAND)
TABLE 4073 REST OF ASIA-PACIFIC OPTICAL COATINGS IN INDIUM MARKET, BY PURITY GRADE, 2018-2033 (USD THOUSAND)
TABLE 4074 REST OF ASIA-PACIFIC FIBER OPTIC COMPONENTS IN INDIUM MARKET, BY PURITY GRADE, 2018-2033 (USD THOUSAND)
TABLE 4075 REST OF ASIA-PACIFIC LASER COMPONENTS IN INDIUM MARKET, BY PURITY GRADE, 2018-2033 (USD THOUSAND)
TABLE 4076 REST OF ASIA-PACIFIC OPTICAL SENSORS IN INDIUM MARKET, BY PURITY GRADE, 2018-2033 (USD THOUSAND)
TABLE 4077 REST OF ASIA-PACIFIC INFRARED OPTICS IN INDIUM MARKET, BY PURITY GRADE, 2018-2033 (USD THOUSAND)
TABLE 4078 REST OF ASIA-PACIFIC PICS IN INDIUM MARKET, BY PURITY GRADE, 2018-2033 (USD THOUSAND)
TABLE 4079 REST OF ASIA-PACIFIC MIRRORS IN INDIUM MARKET, BY PURITY GRADE, 2018-2033 (USD THOUSAND)
TABLE 4080 REST OF ASIA-PACIFIC SPECTROSCOPY IN INDIUM MARKET, BY PURITY GRADE, 2018-2033 (USD THOUSAND)
TABLE 4081 REST OF ASIA-PACIFIC AEROSPACE & DEFENSE INDUSTRY IN INDIUM MARKET, BY TYPE, 2018-2033 (USD THOUSAND)
TABLE 4082 REST OF ASIA-PACIFIC INFRARED IMAGING SYSTEMS IN INDIUM MARKET, BY PURITY GRADE, 2018-2033 (USD THOUSAND)
TABLE 4083 REST OF ASIA-PACIFIC RADAR & RF COMPONENTS IN INDIUM MARKET, BY PURITY GRADE, 2018-2033 (USD THOUSAND)
TABLE 4084 REST OF ASIA-PACIFIC SATELLITE COMMUNICATION IN INDIUM MARKET, BY PURITY GRADE, 2018-2033 (USD THOUSAND)
TABLE 4085 REST OF ASIA-PACIFIC MILITARY OPTOELECTRONICS IN INDIUM MARKET, BY PURITY GRADE, 2018-2033 (USD THOUSAND)
TABLE 4086 REST OF ASIA-PACIFIC AVIONICS DISPLAYS IN INDIUM MARKET, BY PURITY GRADE, 2018-2033 (USD THOUSAND)
TABLE 4087 REST OF ASIA-PACIFIC SPACECRAFT SOLAR PANELS IN INDIUM MARKET, BY PURITY GRADE, 2018-2033 (USD THOUSAND)
TABLE 4088 REST OF ASIA-PACIFIC THERMAL MATERIALS IN INDIUM MARKET, BY PURITY GRADE, 2018-2033 (USD THOUSAND)
TABLE 4089 REST OF ASIA-PACIFIC CRYOGENIC MATERIALS IN INDIUM MARKET, BY PURITY GRADE, 2018-2033 (USD THOUSAND)
TABLE 4090 REST OF ASIA-PACIFIC MEDICAL DEVICE INDUSTRY IN INDIUM MARKET, BY TYPE, 2018-2033 (USD THOUSAND)
TABLE 4091 REST OF ASIA-PACIFIC MEDICAL IMAGING SENSORS IN INDIUM MARKET, BY PURITY GRADE, 2018-2033 (USD THOUSAND)
TABLE 4092 REST OF ASIA-PACIFIC DIAGNOSTIC EQUIPMENT DISPLAYS IN INDIUM MARKET, BY PURITY GRADE, 2018-2033 (USD THOUSAND)
TABLE 4093 REST OF ASIA-PACIFIC ADVANCED DIAGNOSTIC INSTRUMENTS IN INDIUM MARKET, BY PURITY GRADE, 2018-2033 (USD THOUSAND)
TABLE 4094 REST OF ASIA-PACIFIC LASER SURGICAL EQUIPMENT IN INDIUM MARKET, BY PURITY GRADE, 2018-2033 (USD THOUSAND)
TABLE 4095 REST OF ASIA-PACIFIC BIOMEDICAL OPTICAL DEVICES IN INDIUM MARKET, BY PURITY GRADE, 2018-2033 (USD THOUSAND)
TABLE 4096 REST OF ASIA-PACIFIC RADIATION DETECTION EQUIPMENT IN INDIUM MARKET, BY PURITY GRADE, 2018-2033 (USD THOUSAND)
TABLE 4097 REST OF ASIA-PACIFIC INFRARED MEDICAL SENSORS IN INDIUM MARKET, BY PURITY GRADE, 2018-2033 (USD THOUSAND)
TABLE 4098 REST OF ASIA-PACIFIC PHOTOTHERAPY DEVICES IN INDIUM MARKET, BY PURITY GRADE, 2018-2033 (USD THOUSAND)
TABLE 4099 REST OF ASIA-PACIFIC INDUSTRIAL EQUIPMENT MANUFACTURING IN INDIUM MARKET, BY TYPE, 2018-2033 (USD THOUSAND)
TABLE 4100 REST OF ASIA-PACIFIC INDUSTRIAL SENSORS IN INDIUM MARKET, BY PURITY GRADE, 2018-2033 (USD THOUSAND)
TABLE 4101 REST OF ASIA-PACIFIC VACUUM DEPOSITION COATINGS IN INDIUM MARKET, BY PURITY GRADE, 2018-2033 (USD THOUSAND)
TABLE 4102 REST OF ASIA-PACIFIC PRECISION OPTICAL COMPONENTS IN INDIUM MARKET, BY PURITY GRADE, 2018-2033 (USD THOUSAND)
TABLE 4103 REST OF ASIA-PACIFIC THERMAL INTERFACE MATERIALS IN INDIUM MARKET, BY PURITY GRADE, 2018-2033 (USD THOUSAND)
TABLE 4104 REST OF ASIA-PACIFIC INDUSTRIAL LASER SYSTEMS IN INDIUM MARKET, BY PURITY GRADE, 2018-2033 (USD THOUSAND)
TABLE 4105 REST OF ASIA-PACIFIC INDUSTRIAL INFRARED DETECTORS IN INDIUM MARKET, BY PURITY GRADE, 2018-2033 (USD THOUSAND)
TABLE 4106 REST OF ASIA-PACIFIC PRECISION MEASUREMENT EQUIPMENT IN INDIUM MARKET, BY PURITY GRADE, 2018-2033 (USD THOUSAND)
TABLE 4107 REST OF ASIA-PACIFIC SPECIALTY ELECTRONIC COMPONENTS IN INDIUM MARKET, BY PURITY GRADE, 2018-2033 (USD THOUSAND)
TABLE 4108 REST OF ASIA-PACIFIC OTHERS IN INDIUM MARKET, BY TYPE, 2018-2033 (USD THOUSAND)
TABLE 4109 REST OF ASIA-PACIFIC ADVANCED MATERIALS MANUFACTURING IN INDIUM MARKET, BY PURITY GRADE, 2018-2033 (USD THOUSAND)
TABLE 4110 REST OF ASIA-PACIFIC SPECIALTY ALLOY PRODUCTION IN INDIUM MARKET, BY PURITY GRADE, 2018-2033 (USD THOUSAND)
TABLE 4111 REST OF ASIA-PACIFIC THERMAL MANAGEMENT MATERIALS IN INDIUM MARKET, BY PURITY GRADE, 2018-2033 (USD THOUSAND)
TABLE 4112 REST OF ASIA-PACIFIC PRECISION SCIENTIFIC INSTRUMENTS IN INDIUM MARKET, BY PURITY GRADE, 2018-2033 (USD THOUSAND)
TABLE 4113 REST OF ASIA-PACIFIC RESEARCH INSTITUTES & UNIVERSITIES IN INDIUM MARKET, BY PURITY GRADE, 2018-2033 (USD THOUSAND)
TABLE 4114 REST OF ASIA-PACIFIC NUCLEAR INDUSTRY APPLICATIONS IN INDIUM MARKET, BY PURITY GRADE, 2018-2033 (USD THOUSAND)
TABLE 4115 REST OF ASIA-PACIFIC SPECIALTY CHEMICAL PRODUCTION IN INDIUM MARKET, BY PURITY GRADE, 2018-2033 (USD THOUSAND)
TABLE 4116 REST OF ASIA-PACIFIC DEFENSE RESEARCH LABORATORIES IN INDIUM MARKET, BY PURITY GRADE, 2018-2033 (USD THOUSAND)
TABLE 4117 REST OF ASIA-PACIFIC CRYOGENIC EQUIPMENT MANUFACTURING IN INDIUM MARKET, BY PURITY GRADE, 2018-2033 (USD THOUSAND)
TABLE 4118 MIDDLE EAST AND AFRICA INDIUM MARKET, BY COUNTRY, 2018-2033 (USD THOUSAND)
TABLE 4119 MIDDLE EAST AND AFRICA INDIUM MARKET, BY PRODUCT TYPE, 2018-2033 (USD THOUSAND)
TABLE 4120 MIDDLE EAST AND AFRICA INGOTS IN INDIUM MARKET, BY TYPE, 2018-2033 (USD THOUSAND)
TABLE 4121 MIDDLE EAST AND AFRICA INDIUM MARKET, BY MATERIAL COMPOSITION, 2018-2033 (USD THOUSAND)
TABLE 4122 MIDDLE EAST AND AFRICA INDIUM ALLOYS IN INDIUM MARKET, BY TYPE, 2018-2033 (USD THOUSAND)
TABLE 4123 MIDDLE EAST AND AFRICA INDIUM COMPOUNDS IN INDIUM MARKET, BY TYPE, 2018-2033 (USD THOUSAND)
TABLE 4124 MIDDLE EAST AND AFRICA INDIUM MARKET, BY PURITY GRADE, 2018-2033 (USD THOUSAND)
TABLE 4125 MIDDLE EAST AND AFRICA INDIUM MARKET, BY EXTRACTION SOURCE, 2018-2033 (USD THOUSAND)
TABLE 4126 MIDDLE EAST AND AFRICA PRIMARY PRODUCTION IN INDIUM MARKET, BY TYPE, 2018-2033 (USD THOUSAND)
TABLE 4127 MIDDLE EAST AND AFRICA SECONDARY PRODUCTION IN INDIUM MARKET, BY TYPE, 2018-2033 (USD THOUSAND)
TABLE 4128 MIDDLE EAST AND AFRICA INDIUM MARKET, BY DISTRIBUTION CHANNEL, 2018-2033 (USD THOUSAND)
TABLE 4129 MIDDLE EAST AND AFRICA INDIUM MARKET, BY TECHNOLOGY PLATFORM, 2018-2033 (USD THOUSAND)
TABLE 4130 MIDDLE EAST AND AFRICA INDIUM MARKET, BY END-USER INDUSTRY, 2018-2033 (USD THOUSAND)
TABLE 4131 MIDDLE EAST AND AFRICA CONSUMER ELECTRONICS INDUSTRY IN INDIUM MARKET, BY TYPE, 2018-2033 (USD THOUSAND)
TABLE 4132 MIDDLE EAST AND AFRICA FLAT PANEL DISPLAYS (LCD/OLED/LED) IN INDIUM MARKET, BY PURITY GRADE, 2018-2033 (USD THOUSAND)
TABLE 4133 MIDDLE EAST AND AFRICA TRANSPARENT CONDUCTIVE COATINGS (ITO) IN INDIUM MARKET, BY PURITY GRADE, 2018-2033 (USD THOUSAND)
TABLE 4134 MIDDLE EAST AND AFRICA TOUCHSCREEN DISPLAYS IN INDIUM MARKET, BY PURITY GRADE, 2018-2033 (USD THOUSAND)
TABLE 4135 MIDDLE EAST AND AFRICA FLEXIBLE DISPLAYS & ELECTRONICS IN INDIUM MARKET, BY PURITY GRADE, 2018-2033 (USD THOUSAND)
TABLE 4136 MIDDLE EAST AND AFRICA WEARABLE ELECTRONICS DEVICES IN INDIUM MARKET, BY PURITY GRADE, 2018-2033 (USD THOUSAND)
TABLE 4137 MIDDLE EAST AND AFRICA CAMERA & OPTICAL SENSORS IN INDIUM MARKET, BY PURITY GRADE, 2018-2033 (USD THOUSAND)
TABLE 4138 MIDDLE EAST AND AFRICA MINI-LED BACKLIGHTING IN INDIUM MARKET, BY PURITY GRADE, 2018-2033 (USD THOUSAND)
TABLE 4139 MIDDLE EAST AND AFRICA MICRO-LED DISPLAYS IN INDIUM MARKET, BY PURITY GRADE, 2018-2033 (USD THOUSAND)
TABLE 4140 MIDDLE EAST AND AFRICA DISPLAY PANEL INDUSTRY IN INDIUM MARKET, BY TYPE, 2018-2033 (USD THOUSAND)
TABLE 4141 MIDDLE EAST AND AFRICA LCD PANEL MANUFACTURING IN INDIUM MARKET, BY PURITY GRADE, 2018-2033 (USD THOUSAND)
TABLE 4142 MIDDLE EAST AND AFRICA OLED PANEL MANUFACTURING IN INDIUM MARKET, BY PURITY GRADE, 2018-2033 (USD THOUSAND)
TABLE 4143 MIDDLE EAST AND AFRICA DISPLAY PANEL MANUFACTURING IN INDIUM MARKET, BY PURITY GRADE, 2018-2033 (USD THOUSAND)
TABLE 4144 MIDDLE EAST AND AFRICA TOUCH PANEL SENSORS IN INDIUM MARKET, BY PURITY GRADE, 2018-2033 (USD THOUSAND)
TABLE 4145 MIDDLE EAST AND AFRICA TRANSPARENT CONDUCTIVE FILMS IN INDIUM MARKET, BY PURITY GRADE, 2018-2033 (USD THOUSAND)
TABLE 4146 MIDDLE EAST AND AFRICA FLEXIBLE & FOLDABLE DISPLAYS IN INDIUM MARKET, BY PURITY GRADE, 2018-2033 (USD THOUSAND)
TABLE 4147 MIDDLE EAST AND AFRICA AR/VR DISPLAYS IN INDIUM MARKET, BY PURITY GRADE, 2018-2033 (USD THOUSAND)
TABLE 4148 MIDDLE EAST AND AFRICA MICRODISPLAY DEVICES IN INDIUM MARKET, BY PURITY GRADE, 2018-2033 (USD THOUSAND)
TABLE 4149 MIDDLE EAST AND AFRICA BACKPLANE COATINGS IN INDIUM MARKET, BY PURITY GRADE, 2018-2033 (USD THOUSAND)
TABLE 4150 MIDDLE EAST AND AFRICA SEMICONDUCTOR INDUSTRY IN INDIUM MARKET, BY TYPE, 2018-2033 (USD THOUSAND)
TABLE 4151 MIDDLE EAST AND AFRICA III-V COMPOUND SEMICONDUCTORS IN INDIUM MARKET, BY PURITY GRADE, 2018-2033 (USD THOUSAND)
TABLE 4152 MIDDLE EAST AND AFRICA HIGH-FREQUENCY RF COMPONENTS IN INDIUM MARKET, BY PURITY GRADE, 2018-2033 (USD THOUSAND)
TABLE 4153 MIDDLE EAST AND AFRICA SEMICONDUCTOR SUBSTRATES & EPITAXY IN INDIUM MARKET, BY PURITY GRADE, 2018-2033 (USD THOUSAND)
TABLE 4154 MIDDLE EAST AND AFRICA LASER DIODES IN INDIUM MARKET, BY PURITY GRADE, 2018-2033 (USD THOUSAND)
TABLE 4155 MIDDLE EAST AND AFRICA PHOTODETECTORS IN INDIUM MARKET, BY PURITY GRADE, 2018-2033 (USD THOUSAND)
TABLE 4156 MIDDLE EAST AND AFRICA HIGH-SPEED OPTOELECTRONICS IN INDIUM MARKET, BY PURITY GRADE, 2018-2033 (USD THOUSAND)
TABLE 4157 MIDDLE EAST AND AFRICA INFRARED DETECTORS IN INDIUM MARKET, BY PURITY GRADE, 2018-2033 (USD THOUSAND)
TABLE 4158 MIDDLE EAST AND AFRICA INTEGRATED PHOTONIC CIRCUITS IN INDIUM MARKET, BY PURITY GRADE, 2018-2033 (USD THOUSAND)
TABLE 4159 MIDDLE EAST AND AFRICA SOLAR PHOTOVOLTAIC INDUSTRY IN INDIUM MARKET, BY TYPE, 2018-2033 (USD THOUSAND)
TABLE 4160 MIDDLE EAST AND AFRICA CIGS THIN-FILM SOLAR CELLS IN INDIUM MARKET, BY PURITY GRADE, 2018-2033 (USD THOUSAND)
TABLE 4161 MIDDLE EAST AND AFRICAHIGH-EFFICIENCY MODULES IN INDIUM MARKET, BY PURITY GRADE, 2018-2033 (USD THOUSAND)
TABLE 4162 MIDDLE EAST AND AFRICA THIN-FILM COATINGS IN INDIUM MARKET, BY PURITY GRADE, 2018-2033 (USD THOUSAND)
TABLE 4163 MIDDLE EAST AND AFRICA TRANSPARENT ELECTRODES IN INDIUM MARKET, BY PURITY GRADE, 2018-2033 (USD THOUSAND)
TABLE 4164 MIDDLE EAST AND AFRICA BIPV IN INDIUM MARKET, BY PURITY GRADE, 2018-2033 (USD THOUSAND)
TABLE 4165 MIDDLE EAST AND AFRICA FLEXIBLE SOLAR PANELS IN INDIUM MARKET, BY PURITY GRADE, 2018-2033 (USD THOUSAND)
TABLE 4166 MIDDLE EAST AND AFRICA PORTABLE SOLAR SYSTEMS IN INDIUM MARKET, BY PURITY GRADE, 2018-2033 (USD THOUSAND)
TABLE 4167 MIDDLE EAST AND AFRICA CONCENTRATED PV IN INDIUM MARKET, BY PURITY GRADE, 2018-2033 (USD THOUSAND)
TABLE 4168 MIDDLE EAST AND AFRICA AUTOMOTIVE INDUSTRY IN INDIUM MARKET, BY TYPE, 2018-2033 (USD THOUSAND)
TABLE 4169 MIDDLE EAST AND AFRICA AUTOMOTIVE DISPLAY PANELS IN INDIUM MARKET, BY PURITY GRADE, 2018-2033 (USD THOUSAND)
TABLE 4170 MIDDLE EAST AND AFRICAADAS SENSORS IN INDIUM MARKET, BY PURITY GRADE, 2018-2033 (USD THOUSAND)
TABLE 4171 MIDDLE EAST AND AFRICA VEHICLE CAMERA MODULES IN INDIUM MARKET, BY PURITY GRADE, 2018-2033 (USD THOUSAND)
TABLE 4172 MIDDLE EAST AND AFRICA AUTOMOTIVE OPTOELECTRONICS IN INDIUM MARKET, BY PURITY GRADE, 2018-2033 (USD THOUSAND)
TABLE 4173 MIDDLE EAST AND AFRICA POWER ELECTRONICS IN INDIUM MARKET, BY PURITY GRADE, 2018-2033 (USD THOUSAND)
TABLE 4174 MIDDLE EAST AND AFRICA TOUCHSCREEN INTERFACES IN INDIUM MARKET, BY PURITY GRADE, 2018-2033 (USD THOUSAND)
TABLE 4175 MIDDLE EAST AND AFRICA INFRARED SENSORS IN INDIUM MARKET, BY PURITY GRADE, 2018-2033 (USD THOUSAND)
TABLE 4176 MIDDLE EAST AND AFRICA SMART LIGHTING IN INDIUM MARKET, BY PURITY GRADE, 2018-2033 (USD THOUSAND)
TABLE 4177 MIDDLE EAST AND AFRICA TELECOMMUNICATION EQUIPMENT INDUSTRY IN INDIUM MARKET, BY TYPE, 2018-2033 (USD THOUSAND)
TABLE 4178 MIDDLE EAST AND AFRICA OPTICAL TRANSCEIVERS IN INDIUM MARKET, BY PURITY GRADE, 2018-2033 (USD THOUSAND)
TABLE 4179 MIDDLE EAST AND AFRICA RF POWER AMPLIFIERS IN INDIUM MARKET, BY PURITY GRADE, 2018-2033 (USD THOUSAND)
TABLE 4180 MIDDLE EAST AND AFRICA HIGH-FREQUENCY COMMUNICATION CHIPS IN INDIUM MARKET, BY PURITY GRADE, 2018-2033 (USD THOUSAND)
TABLE 4181 MIDDLE EAST AND AFRICA FIBER-OPTIC COMMUNICATION LASERS IN INDIUM MARKET, BY PURITY GRADE, 2018-2033 (USD THOUSAND)
TABLE 4182 MIDDLE EAST AND AFRICA PHOTODETECTORS FOR OPTICAL NETWORKS IN INDIUM MARKET, BY PURITY GRADE, 2018-2033 (USD THOUSAND)
TABLE 4183 MIDDLE EAST AND AFRICA 5G INFRASTRUCTURE COMPONENTS IN INDIUM MARKET, BY PURITY GRADE, 2018-2033 (USD THOUSAND)
TABLE 4184 MIDDLE EAST AND AFRICA OPTICAL NETWORK SWITCHING DEVICES IN INDIUM MARKET, BY PURITY GRADE, 2018-2033 (USD THOUSAND)
TABLE 4185 MIDDLE EAST AND AFRICA SATELLITE COMMUNICATION MODULES IN INDIUM MARKET, BY PURITY GRADE, 2018-2033 (USD THOUSAND)
TABLE 4186 MIDDLE EAST AND AFRICA OPTICAL & PHOTONICS INDUSTRY IN INDIUM MARKET, BY TYPE, 2018-2033 (USD THOUSAND)
TABLE 4187 MIDDLE EAST AND AFRICA OPTICAL COATINGS IN INDIUM MARKET, BY PURITY GRADE, 2018-2033 (USD THOUSAND)
TABLE 4188 MIDDLE EAST AND AFRICA FIBER OPTIC COMPONENTS IN INDIUM MARKET, BY PURITY GRADE, 2018-2033 (USD THOUSAND)
TABLE 4189 MIDDLE EAST AND AFRICA LASER COMPONENTS IN INDIUM MARKET, BY PURITY GRADE, 2018-2033 (USD THOUSAND)
TABLE 4190 MIDDLE EAST AND AFRICA OPTICAL SENSORS IN INDIUM MARKET, BY PURITY GRADE, 2018-2033 (USD THOUSAND)
TABLE 4191 MIDDLE EAST AND AFRICA INFRARED OPTICS IN INDIUM MARKET, BY PURITY GRADE, 2018-2033 (USD THOUSAND)
TABLE 4192 MIDDLE EAST AND AFRICA PICS IN INDIUM MARKET, BY PURITY GRADE, 2018-2033 (USD THOUSAND)
TABLE 4193 MIDDLE EAST AND AFRICA MIRRORS IN INDIUM MARKET, BY PURITY GRADE, 2018-2033 (USD THOUSAND)
TABLE 4194 MIDDLE EAST AND AFRICA SPECTROSCOPY IN INDIUM MARKET, BY PURITY GRADE, 2018-2033 (USD THOUSAND)
TABLE 4195 MIDDLE EAST AND AFRICA AEROSPACE & DEFENSE INDUSTRY IN INDIUM MARKET, BY TYPE, 2018-2033 (USD THOUSAND)
TABLE 4196 MIDDLE EAST AND AFRICA INFRARED IMAGING SYSTEMS IN INDIUM MARKET, BY PURITY GRADE, 2018-2033 (USD THOUSAND)
TABLE 4197 MIDDLE EAST AND AFRICA RADAR & RF COMPONENTS IN INDIUM MARKET, BY PURITY GRADE, 2018-2033 (USD THOUSAND)
TABLE 4198 MIDDLE EAST AND AFRICA SATELLITE COMMUNICATION IN INDIUM MARKET, BY PURITY GRADE, 2018-2033 (USD THOUSAND)
TABLE 4199 MIDDLE EAST AND AFRICA MILITARY OPTOELECTRONICS IN INDIUM MARKET, BY PURITY GRADE, 2018-2033 (USD THOUSAND)
TABLE 4200 MIDDLE EAST AND AFRICA AVIONICS DISPLAYS IN INDIUM MARKET, BY PURITY GRADE, 2018-2033 (USD THOUSAND)
TABLE 4201 MIDDLE EAST AND AFRICA SPACECRAFT SOLAR PANELS IN INDIUM MARKET, BY PURITY GRADE, 2018-2033 (USD THOUSAND)
TABLE 4202 MIDDLE EAST AND AFRICA THERMAL MATERIALS IN INDIUM MARKET, BY PURITY GRADE, 2018-2033 (USD THOUSAND)
TABLE 4203 MIDDLE EAST AND AFRICA CRYOGENIC MATERIALS IN INDIUM MARKET, BY PURITY GRADE, 2018-2033 (USD THOUSAND)
TABLE 4204 MIDDLE EAST AND AFRICA MEDICAL DEVICE INDUSTRY IN INDIUM MARKET, BY TYPE, 2018-2033 (USD THOUSAND)
TABLE 4205 MIDDLE EAST AND AFRICA MEDICAL IMAGING SENSORS IN INDIUM MARKET, BY PURITY GRADE, 2018-2033 (USD THOUSAND)
TABLE 4206 MIDDLE EAST AND AFRICA DIAGNOSTIC EQUIPMENT DISPLAYS IN INDIUM MARKET, BY PURITY GRADE, 2018-2033 (USD THOUSAND)
TABLE 4207 MIDDLE EAST AND AFRICA ADVANCED DIAGNOSTIC INSTRUMENTS IN INDIUM MARKET, BY PURITY GRADE, 2018-2033 (USD THOUSAND)
TABLE 4208 MIDDLE EAST AND AFRICA LASER SURGICAL EQUIPMENT IN INDIUM MARKET, BY PURITY GRADE, 2018-2033 (USD THOUSAND)
TABLE 4209 MIDDLE EAST AND AFRICA BIOMEDICAL OPTICAL DEVICES IN INDIUM MARKET, BY PURITY GRADE, 2018-2033 (USD THOUSAND)
TABLE 4210 MIDDLE EAST AND AFRICA RADIATION DETECTION EQUIPMENT IN INDIUM MARKET, BY PURITY GRADE, 2018-2033 (USD THOUSAND)
TABLE 4211 MIDDLE EAST AND AFRICA INFRARED MEDICAL SENSORS IN INDIUM MARKET, BY PURITY GRADE, 2018-2033 (USD THOUSAND)
TABLE 4212 MIDDLE EAST AND AFRICA PHOTOTHERAPY DEVICES IN INDIUM MARKET, BY PURITY GRADE, 2018-2033 (USD THOUSAND)
TABLE 4213 MIDDLE EAST AND AFRICA INDUSTRIAL EQUIPMENT MANUFACTURING IN INDIUM MARKET, BY TYPE, 2018-2033 (USD THOUSAND)
TABLE 4214 MIDDLE EAST AND AFRICA INDUSTRIAL SENSORS IN INDIUM MARKET, BY PURITY GRADE, 2018-2033 (USD THOUSAND)
TABLE 4215 MIDDLE EAST AND AFRICA VACUUM DEPOSITION COATINGS IN INDIUM MARKET, BY PURITY GRADE, 2018-2033 (USD THOUSAND)
TABLE 4216 MIDDLE EAST AND AFRICA PRECISION OPTICAL COMPONENTS IN INDIUM MARKET, BY PURITY GRADE, 2018-2033 (USD THOUSAND)
TABLE 4217 MIDDLE EAST AND AFRICA THERMAL INTERFACE MATERIALS IN INDIUM MARKET, BY PURITY GRADE, 2018-2033 (USD THOUSAND)
TABLE 4218 MIDDLE EAST AND AFRICA INDUSTRIAL LASER SYSTEMS IN INDIUM MARKET, BY PURITY GRADE, 2018-2033 (USD THOUSAND)
TABLE 4219 MIDDLE EAST AND AFRICA INDUSTRIAL INFRARED DETECTORS IN INDIUM MARKET, BY PURITY GRADE, 2018-2033 (USD THOUSAND)
TABLE 4220 MIDDLE EAST AND AFRICA PRECISION MEASUREMENT EQUIPMENT IN INDIUM MARKET, BY PURITY GRADE, 2018-2033 (USD THOUSAND)
TABLE 4221 MIDDLE EAST AND AFRICA SPECIALTY ELECTRONIC COMPONENTS IN INDIUM MARKET, BY PURITY GRADE, 2018-2033 (USD THOUSAND)
TABLE 4222 MIDDLE EAST AND AFRICA OTHERS IN INDIUM MARKET, BY TYPE, 2018-2033 (USD THOUSAND)
TABLE 4223 MIDDLE EAST AND AFRICA ADVANCED MATERIALS MANUFACTURING IN INDIUM MARKET, BY PURITY GRADE, 2018-2033 (USD THOUSAND)
TABLE 4224 MIDDLE EAST AND AFRICA SPECIALTY ALLOY PRODUCTION IN INDIUM MARKET, BY PURITY GRADE, 2018-2033 (USD THOUSAND)
TABLE 4225 MIDDLE EAST AND AFRICA THERMAL MANAGEMENT MATERIALS IN INDIUM MARKET, BY PURITY GRADE, 2018-2033 (USD THOUSAND)
TABLE 4226 MIDDLE EAST AND AFRICA PRECISION SCIENTIFIC INSTRUMENTS IN INDIUM MARKET, BY PURITY GRADE, 2018-2033 (USD THOUSAND)
TABLE 4227 MIDDLE EAST AND AFRICA RESEARCH INSTITUTES & UNIVERSITIES IN INDIUM MARKET, BY PURITY GRADE, 2018-2033 (USD THOUSAND)
TABLE 4228 MIDDLE EAST AND AFRICA NUCLEAR INDUSTRY APPLICATIONS IN INDIUM MARKET, BY PURITY GRADE, 2018-2033 (USD THOUSAND)
TABLE 4229 MIDDLE EAST AND AFRICA SPECIALTY CHEMICAL PRODUCTION IN INDIUM MARKET, BY PURITY GRADE, 2018-2033 (USD THOUSAND)
TABLE 4230 MIDDLE EAST AND AFRICA DEFENSE RESEARCH LABORATORIES IN INDIUM MARKET, BY PURITY GRADE, 2018-2033 (USD THOUSAND)
TABLE 4231 MIDDLE EAST AND AFRICA CRYOGENIC EQUIPMENT MANUFACTURING IN INDIUM MARKET, BY PURITY GRADE, 2018-2033 (USD THOUSAND)
TABLE 4232 SOUTH AFRICA INDIUM MARKET, BY PRODUCT TYPE, 2018-2033 (USD THOUSAND)
TABLE 4233 SOUTH AFRICA INGOTS IN INDIUM MARKET, BY TYPE, 2018-2033 (USD THOUSAND)
TABLE 4234 SOUTH AFRICA INDIUM MARKET, BY MATERIAL COMPOSITION, 2018-2033 (USD THOUSAND)
TABLE 4235 SOUTH AFRICA INDIUM ALLOYS IN INDIUM MARKET, BY TYPE, 2018-2033 (USD THOUSAND)
TABLE 4236 SOUTH AFRICA INDIUM COMPOUNDS IN INDIUM MARKET, BY TYPE, 2018-2033 (USD THOUSAND)
TABLE 4237 SOUTH AFRICA INDIUM MARKET, BY PURITY GRADE, 2018-2033 (USD THOUSAND)
TABLE 4238 SOUTH AFRICA INDIUM MARKET, BY EXTRACTION SOURCE, 2018-2033 (USD THOUSAND)
TABLE 4239 SOUTH AFRICA PRIMARY PRODUCTION IN INDIUM MARKET, BY TYPE, 2018-2033 (USD THOUSAND)
TABLE 4240 SOUTH AFRICA SECONDARY PRODUCTION IN INDIUM MARKET, BY TYPE, 2018-2033 (USD THOUSAND)
TABLE 4241 SOUTH AFRICA INDIUM MARKET, BY DISTRIBUTION CHANNEL, 2018-2033 (USD THOUSAND)
TABLE 4242 SOUTH AFRICA INDIUM MARKET, BY TECHNOLOGY PLATFORM, 2018-2033 (USD THOUSAND)
TABLE 4243 SOUTH AFRICA INDIUM MARKET, BY END-USER INDUSTRY, 2018-2033 (USD THOUSAND)
TABLE 4244 SOUTH AFRICA CONSUMER ELECTRONICS INDUSTRY IN INDIUM MARKET, BY TYPE, 2018-2033 (USD THOUSAND)
TABLE 4245 SOUTH AFRICA FLAT PANEL DISPLAYS (LCD/OLED/LED) IN INDIUM MARKET, BY PURITY GRADE, 2018-2033 (USD THOUSAND)
TABLE 4246 SOUTH AFRICA TRANSPARENT CONDUCTIVE COATINGS (ITO) IN INDIUM MARKET, BY PURITY GRADE, 2018-2033 (USD THOUSAND)
TABLE 4247 SOUTH AFRICA TOUCHSCREEN DISPLAYS IN INDIUM MARKET, BY PURITY GRADE, 2018-2033 (USD THOUSAND)
TABLE 4248 SOUTH AFRICA FLEXIBLE DISPLAYS & ELECTRONICS IN INDIUM MARKET, BY PURITY GRADE, 2018-2033 (USD THOUSAND)
TABLE 4249 SOUTH AFRICA WEARABLE ELECTRONICS DEVICES IN INDIUM MARKET, BY PURITY GRADE, 2018-2033 (USD THOUSAND)
TABLE 4250 SOUTH AFRICA CAMERA & OPTICAL SENSORS IN INDIUM MARKET, BY PURITY GRADE, 2018-2033 (USD THOUSAND)
TABLE 4251 SOUTH AFRICA MINI-LED BACKLIGHTING IN INDIUM MARKET, BY PURITY GRADE, 2018-2033 (USD THOUSAND)
TABLE 4252 SOUTH AFRICA MICRO-LED DISPLAYS IN INDIUM MARKET, BY PURITY GRADE, 2018-2033 (USD THOUSAND)
TABLE 4253 SOUTH AFRICA DISPLAY PANEL INDUSTRY IN INDIUM MARKET, BY TYPE, 2018-2033 (USD THOUSAND)
TABLE 4254 SOUTH AFRICA LCD PANEL MANUFACTURING IN INDIUM MARKET, BY PURITY GRADE, 2018-2033 (USD THOUSAND)
TABLE 4255 SOUTH AFRICA OLED PANEL MANUFACTURING IN INDIUM MARKET, BY PURITY GRADE, 2018-2033 (USD THOUSAND)
TABLE 4256 SOUTH AFRICA DISPLAY PANEL MANUFACTURING IN INDIUM MARKET, BY PURITY GRADE, 2018-2033 (USD THOUSAND)
TABLE 4257 SOUTH AFRICA TOUCH PANEL SENSORS IN INDIUM MARKET, BY PURITY GRADE, 2018-2033 (USD THOUSAND)
TABLE 4258 SOUTH AFRICA TRANSPARENT CONDUCTIVE FILMS IN INDIUM MARKET, BY PURITY GRADE, 2018-2033 (USD THOUSAND)
TABLE 4259 SOUTH AFRICA FLEXIBLE & FOLDABLE DISPLAYS IN INDIUM MARKET, BY PURITY GRADE, 2018-2033 (USD THOUSAND)
TABLE 4260 SOUTH AFRICA AR/VR DISPLAYS IN INDIUM MARKET, BY PURITY GRADE, 2018-2033 (USD THOUSAND)
TABLE 4261 SOUTH AFRICA MICRODISPLAY DEVICES IN INDIUM MARKET, BY PURITY GRADE, 2018-2033 (USD THOUSAND)
TABLE 4262 SOUTH AFRICA BACKPLANE COATINGS IN INDIUM MARKET, BY PURITY GRADE, 2018-2033 (USD THOUSAND)
TABLE 4263 SOUTH AFRICA SEMICONDUCTOR INDUSTRY IN INDIUM MARKET, BY TYPE, 2018-2033 (USD THOUSAND)
TABLE 4264 SOUTH AFRICA III-V COMPOUND SEMICONDUCTORS IN INDIUM MARKET, BY PURITY GRADE, 2018-2033 (USD THOUSAND)
TABLE 4265 SOUTH AFRICA HIGH-FREQUENCY RF COMPONENTS IN INDIUM MARKET, BY PURITY GRADE, 2018-2033 (USD THOUSAND)
TABLE 4266 SOUTH AFRICA SEMICONDUCTOR SUBSTRATES & EPITAXY IN INDIUM MARKET, BY PURITY GRADE, 2018-2033 (USD THOUSAND)
TABLE 4267 SOUTH AFRICA LASER DIODES IN INDIUM MARKET, BY PURITY GRADE, 2018-2033 (USD THOUSAND)
TABLE 4268 SOUTH AFRICA PHOTODETECTORS IN INDIUM MARKET, BY PURITY GRADE, 2018-2033 (USD THOUSAND)
TABLE 4269 SOUTH AFRICA HIGH-SPEED OPTOELECTRONICS IN INDIUM MARKET, BY PURITY GRADE, 2018-2033 (USD THOUSAND)
TABLE 4270 SOUTH AFRICA INFRARED DETECTORS IN INDIUM MARKET, BY PURITY GRADE, 2018-2033 (USD THOUSAND)
TABLE 4271 SOUTH AFRICA INTEGRATED PHOTONIC CIRCUITS IN INDIUM MARKET, BY PURITY GRADE, 2018-2033 (USD THOUSAND)
TABLE 4272 SOUTH AFRICA SOLAR PHOTOVOLTAIC INDUSTRY IN INDIUM MARKET, BY TYPE, 2018-2033 (USD THOUSAND)
TABLE 4273 SOUTH AFRICA CIGS THIN-FILM SOLAR CELLS IN INDIUM MARKET, BY PURITY GRADE, 2018-2033 (USD THOUSAND)
TABLE 4274 SOUTH AFRICAHIGH-EFFICIENCY MODULES IN INDIUM MARKET, BY PURITY GRADE, 2018-2033 (USD THOUSAND)
TABLE 4275 SOUTH AFRICA THIN-FILM COATINGS IN INDIUM MARKET, BY PURITY GRADE, 2018-2033 (USD THOUSAND)
TABLE 4276 SOUTH AFRICA TRANSPARENT ELECTRODES IN INDIUM MARKET, BY PURITY GRADE, 2018-2033 (USD THOUSAND)
TABLE 4277 SOUTH AFRICA BIPV IN INDIUM MARKET, BY PURITY GRADE, 2018-2033 (USD THOUSAND)
TABLE 4278 SOUTH AFRICA FLEXIBLE SOLAR PANELS IN INDIUM MARKET, BY PURITY GRADE, 2018-2033 (USD THOUSAND)
TABLE 4279 SOUTH AFRICA PORTABLE SOLAR SYSTEMS IN INDIUM MARKET, BY PURITY GRADE, 2018-2033 (USD THOUSAND)
TABLE 4280 SOUTH AFRICA CONCENTRATED PV IN INDIUM MARKET, BY PURITY GRADE, 2018-2033 (USD THOUSAND)
TABLE 4281 SOUTH AFRICA AUTOMOTIVE INDUSTRY IN INDIUM MARKET, BY TYPE, 2018-2033 (USD THOUSAND)
TABLE 4282 SOUTH AFRICA AUTOMOTIVE DISPLAY PANELS IN INDIUM MARKET, BY PURITY GRADE, 2018-2033 (USD THOUSAND)
TABLE 4283 SOUTH AFRICAADAS SENSORS IN INDIUM MARKET, BY PURITY GRADE, 2018-2033 (USD THOUSAND)
TABLE 4284 SOUTH AFRICA VEHICLE CAMERA MODULES IN INDIUM MARKET, BY PURITY GRADE, 2018-2033 (USD THOUSAND)
TABLE 4285 SOUTH AFRICA AUTOMOTIVE OPTOELECTRONICS IN INDIUM MARKET, BY PURITY GRADE, 2018-2033 (USD THOUSAND)
TABLE 4286 SOUTH AFRICA POWER ELECTRONICS IN INDIUM MARKET, BY PURITY GRADE, 2018-2033 (USD THOUSAND)
TABLE 4287 SOUTH AFRICA TOUCHSCREEN INTERFACES IN INDIUM MARKET, BY PURITY GRADE, 2018-2033 (USD THOUSAND)
TABLE 4288 SOUTH AFRICA INFRARED SENSORS IN INDIUM MARKET, BY PURITY GRADE, 2018-2033 (USD THOUSAND)
TABLE 4289 SOUTH AFRICA SMART LIGHTING IN INDIUM MARKET, BY PURITY GRADE, 2018-2033 (USD THOUSAND)
TABLE 4290 SOUTH AFRICA TELECOMMUNICATION EQUIPMENT INDUSTRY IN INDIUM MARKET, BY TYPE, 2018-2033 (USD THOUSAND)
TABLE 4291 SOUTH AFRICA OPTICAL TRANSCEIVERS IN INDIUM MARKET, BY PURITY GRADE, 2018-2033 (USD THOUSAND)
TABLE 4292 SOUTH AFRICA RF POWER AMPLIFIERS IN INDIUM MARKET, BY PURITY GRADE, 2018-2033 (USD THOUSAND)
TABLE 4293 SOUTH AFRICA HIGH-FREQUENCY COMMUNICATION CHIPS IN INDIUM MARKET, BY PURITY GRADE, 2018-2033 (USD THOUSAND)
TABLE 4294 SOUTH AFRICA FIBER-OPTIC COMMUNICATION LASERS IN INDIUM MARKET, BY PURITY GRADE, 2018-2033 (USD THOUSAND)
TABLE 4295 SOUTH AFRICA PHOTODETECTORS FOR OPTICAL NETWORKS IN INDIUM MARKET, BY PURITY GRADE, 2018-2033 (USD THOUSAND)
TABLE 4296 SOUTH AFRICA 5G INFRASTRUCTURE COMPONENTS IN INDIUM MARKET, BY PURITY GRADE, 2018-2033 (USD THOUSAND)
TABLE 4297 SOUTH AFRICA OPTICAL NETWORK SWITCHING DEVICES IN INDIUM MARKET, BY PURITY GRADE, 2018-2033 (USD THOUSAND)
TABLE 4298 SOUTH AFRICA SATELLITE COMMUNICATION MODULES IN INDIUM MARKET, BY PURITY GRADE, 2018-2033 (USD THOUSAND)
TABLE 4299 SOUTH AFRICA OPTICAL & PHOTONICS INDUSTRY IN INDIUM MARKET, BY TYPE, 2018-2033 (USD THOUSAND)
TABLE 4300 SOUTH AFRICA OPTICAL COATINGS IN INDIUM MARKET, BY PURITY GRADE, 2018-2033 (USD THOUSAND)
TABLE 4301 SOUTH AFRICA FIBER OPTIC COMPONENTS IN INDIUM MARKET, BY PURITY GRADE, 2018-2033 (USD THOUSAND)
TABLE 4302 SOUTH AFRICA LASER COMPONENTS IN INDIUM MARKET, BY PURITY GRADE, 2018-2033 (USD THOUSAND)
TABLE 4303 SOUTH AFRICA OPTICAL SENSORS IN INDIUM MARKET, BY PURITY GRADE, 2018-2033 (USD THOUSAND)
TABLE 4304 SOUTH AFRICA INFRARED OPTICS IN INDIUM MARKET, BY PURITY GRADE, 2018-2033 (USD THOUSAND)
TABLE 4305 SOUTH AFRICA PICS IN INDIUM MARKET, BY PURITY GRADE, 2018-2033 (USD THOUSAND)
TABLE 4306 SOUTH AFRICA MIRRORS IN INDIUM MARKET, BY PURITY GRADE, 2018-2033 (USD THOUSAND)
TABLE 4307 SOUTH AFRICA SPECTROSCOPY IN INDIUM MARKET, BY PURITY GRADE, 2018-2033 (USD THOUSAND)
TABLE 4308 SOUTH AFRICA AEROSPACE & DEFENSE INDUSTRY IN INDIUM MARKET, BY TYPE, 2018-2033 (USD THOUSAND)
TABLE 4309 SOUTH AFRICA INFRARED IMAGING SYSTEMS IN INDIUM MARKET, BY PURITY GRADE, 2018-2033 (USD THOUSAND)
TABLE 4310 SOUTH AFRICA RADAR & RF COMPONENTS IN INDIUM MARKET, BY PURITY GRADE, 2018-2033 (USD THOUSAND)
TABLE 4311 SOUTH AFRICA SATELLITE COMMUNICATION IN INDIUM MARKET, BY PURITY GRADE, 2018-2033 (USD THOUSAND)
TABLE 4312 SOUTH AFRICA MILITARY OPTOELECTRONICS IN INDIUM MARKET, BY PURITY GRADE, 2018-2033 (USD THOUSAND)
TABLE 4313 SOUTH AFRICA AVIONICS DISPLAYS IN INDIUM MARKET, BY PURITY GRADE, 2018-2033 (USD THOUSAND)
TABLE 4314 SOUTH AFRICA SPACECRAFT SOLAR PANELS IN INDIUM MARKET, BY PURITY GRADE, 2018-2033 (USD THOUSAND)
TABLE 4315 SOUTH AFRICA THERMAL MATERIALS IN INDIUM MARKET, BY PURITY GRADE, 2018-2033 (USD THOUSAND)
TABLE 4316 SOUTH AFRICA CRYOGENIC MATERIALS IN INDIUM MARKET, BY PURITY GRADE, 2018-2033 (USD THOUSAND)
TABLE 4317 SOUTH AFRICA MEDICAL DEVICE INDUSTRY IN INDIUM MARKET, BY TYPE, 2018-2033 (USD THOUSAND)
TABLE 4318 SOUTH AFRICA MEDICAL IMAGING SENSORS IN INDIUM MARKET, BY PURITY GRADE, 2018-2033 (USD THOUSAND)
TABLE 4319 SOUTH AFRICA DIAGNOSTIC EQUIPMENT DISPLAYS IN INDIUM MARKET, BY PURITY GRADE, 2018-2033 (USD THOUSAND)
TABLE 4320 SOUTH AFRICA ADVANCED DIAGNOSTIC INSTRUMENTS IN INDIUM MARKET, BY PURITY GRADE, 2018-2033 (USD THOUSAND)
TABLE 4321 SOUTH AFRICA LASER SURGICAL EQUIPMENT IN INDIUM MARKET, BY PURITY GRADE, 2018-2033 (USD THOUSAND)
TABLE 4322 SOUTH AFRICA BIOMEDICAL OPTICAL DEVICES IN INDIUM MARKET, BY PURITY GRADE, 2018-2033 (USD THOUSAND)
TABLE 4323 SOUTH AFRICA RADIATION DETECTION EQUIPMENT IN INDIUM MARKET, BY PURITY GRADE, 2018-2033 (USD THOUSAND)
TABLE 4324 SOUTH AFRICA INFRARED MEDICAL SENSORS IN INDIUM MARKET, BY PURITY GRADE, 2018-2033 (USD THOUSAND)
TABLE 4325 SOUTH AFRICA PHOTOTHERAPY DEVICES IN INDIUM MARKET, BY PURITY GRADE, 2018-2033 (USD THOUSAND)
TABLE 4326 SOUTH AFRICA INDUSTRIAL EQUIPMENT MANUFACTURING IN INDIUM MARKET, BY TYPE, 2018-2033 (USD THOUSAND)
TABLE 4327 SOUTH AFRICA INDUSTRIAL SENSORS IN INDIUM MARKET, BY PURITY GRADE, 2018-2033 (USD THOUSAND)
TABLE 4328 SOUTH AFRICA VACUUM DEPOSITION COATINGS IN INDIUM MARKET, BY PURITY GRADE, 2018-2033 (USD THOUSAND)
TABLE 4329 SOUTH AFRICA PRECISION OPTICAL COMPONENTS IN INDIUM MARKET, BY PURITY GRADE, 2018-2033 (USD THOUSAND)
TABLE 4330 SOUTH AFRICA THERMAL INTERFACE MATERIALS IN INDIUM MARKET, BY PURITY GRADE, 2018-2033 (USD THOUSAND)
TABLE 4331 SOUTH AFRICA INDUSTRIAL LASER SYSTEMS IN INDIUM MARKET, BY PURITY GRADE, 2018-2033 (USD THOUSAND)
TABLE 4332 SOUTH AFRICA INDUSTRIAL INFRARED DETECTORS IN INDIUM MARKET, BY PURITY GRADE, 2018-2033 (USD THOUSAND)
TABLE 4333 SOUTH AFRICA PRECISION MEASUREMENT EQUIPMENT IN INDIUM MARKET, BY PURITY GRADE, 2018-2033 (USD THOUSAND)
TABLE 4334 SOUTH AFRICA SPECIALTY ELECTRONIC COMPONENTS IN INDIUM MARKET, BY PURITY GRADE, 2018-2033 (USD THOUSAND)
TABLE 4335 SOUTH AFRICA OTHERS IN INDIUM MARKET, BY TYPE, 2018-2033 (USD THOUSAND)
TABLE 4336 SOUTH AFRICA ADVANCED MATERIALS MANUFACTURING IN INDIUM MARKET, BY PURITY GRADE, 2018-2033 (USD THOUSAND)
TABLE 4337 SOUTH AFRICA SPECIALTY ALLOY PRODUCTION IN INDIUM MARKET, BY PURITY GRADE, 2018-2033 (USD THOUSAND)
TABLE 4338 SOUTH AFRICA THERMAL MANAGEMENT MATERIALS IN INDIUM MARKET, BY PURITY GRADE, 2018-2033 (USD THOUSAND)
TABLE 4339 SOUTH AFRICA PRECISION SCIENTIFIC INSTRUMENTS IN INDIUM MARKET, BY PURITY GRADE, 2018-2033 (USD THOUSAND)
TABLE 4340 SOUTH AFRICA RESEARCH INSTITUTES & UNIVERSITIES IN INDIUM MARKET, BY PURITY GRADE, 2018-2033 (USD THOUSAND)
TABLE 4341 SOUTH AFRICA NUCLEAR INDUSTRY APPLICATIONS IN INDIUM MARKET, BY PURITY GRADE, 2018-2033 (USD THOUSAND)
TABLE 4342 SOUTH AFRICA SPECIALTY CHEMICAL PRODUCTION IN INDIUM MARKET, BY PURITY GRADE, 2018-2033 (USD THOUSAND)
TABLE 4343 SOUTH AFRICA DEFENSE RESEARCH LABORATORIES IN INDIUM MARKET, BY PURITY GRADE, 2018-2033 (USD THOUSAND)
TABLE 4344 SOUTH AFRICA CRYOGENIC EQUIPMENT MANUFACTURING IN INDIUM MARKET, BY PURITY GRADE, 2018-2033 (USD THOUSAND)
TABLE 4345 SAUDI ARABIA INDIUM MARKET, BY PRODUCT TYPE, 2018-2033 (USD THOUSAND)
TABLE 4346 SAUDI ARABIA INGOTS IN INDIUM MARKET, BY TYPE, 2018-2033 (USD THOUSAND)
TABLE 4347 SAUDI ARABIA INDIUM MARKET, BY MATERIAL COMPOSITION, 2018-2033 (USD THOUSAND)
TABLE 4348 SAUDI ARABIA INDIUM ALLOYS IN INDIUM MARKET, BY TYPE, 2018-2033 (USD THOUSAND)
TABLE 4349 SAUDI ARABIA INDIUM COMPOUNDS IN INDIUM MARKET, BY TYPE, 2018-2033 (USD THOUSAND)
TABLE 4350 SAUDI ARABIA INDIUM MARKET, BY PURITY GRADE, 2018-2033 (USD THOUSAND)
TABLE 4351 SAUDI ARABIA INDIUM MARKET, BY EXTRACTION SOURCE, 2018-2033 (USD THOUSAND)
TABLE 4352 SAUDI ARABIA PRIMARY PRODUCTION IN INDIUM MARKET, BY TYPE, 2018-2033 (USD THOUSAND)
TABLE 4353 SAUDI ARABIA SECONDARY PRODUCTION IN INDIUM MARKET, BY TYPE, 2018-2033 (USD THOUSAND)
TABLE 4354 SAUDI ARABIA INDIUM MARKET, BY DISTRIBUTION CHANNEL, 2018-2033 (USD THOUSAND)
TABLE 4355 SAUDI ARABIA INDIUM MARKET, BY TECHNOLOGY PLATFORM, 2018-2033 (USD THOUSAND)
TABLE 4356 SAUDI ARABIA INDIUM MARKET, BY END-USER INDUSTRY, 2018-2033 (USD THOUSAND)
TABLE 4357 SAUDI ARABIA CONSUMER ELECTRONICS INDUSTRY IN INDIUM MARKET, BY TYPE, 2018-2033 (USD THOUSAND)
TABLE 4358 SAUDI ARABIA FLAT PANEL DISPLAYS (LCD/OLED/LED) IN INDIUM MARKET, BY PURITY GRADE, 2018-2033 (USD THOUSAND)
TABLE 4359 SAUDI ARABIA TRANSPARENT CONDUCTIVE COATINGS (ITO) IN INDIUM MARKET, BY PURITY GRADE, 2018-2033 (USD THOUSAND)
TABLE 4360 SAUDI ARABIA TOUCHSCREEN DISPLAYS IN INDIUM MARKET, BY PURITY GRADE, 2018-2033 (USD THOUSAND)
TABLE 4361 SAUDI ARABIA FLEXIBLE DISPLAYS & ELECTRONICS IN INDIUM MARKET, BY PURITY GRADE, 2018-2033 (USD THOUSAND)
TABLE 4362 SAUDI ARABIA WEARABLE ELECTRONICS DEVICES IN INDIUM MARKET, BY PURITY GRADE, 2018-2033 (USD THOUSAND)
TABLE 4363 SAUDI ARABIA CAMERA & OPTICAL SENSORS IN INDIUM MARKET, BY PURITY GRADE, 2018-2033 (USD THOUSAND)
TABLE 4364 SAUDI ARABIA MINI-LED BACKLIGHTING IN INDIUM MARKET, BY PURITY GRADE, 2018-2033 (USD THOUSAND)
TABLE 4365 SAUDI ARABIA MICRO-LED DISPLAYS IN INDIUM MARKET, BY PURITY GRADE, 2018-2033 (USD THOUSAND)
TABLE 4366 SAUDI ARABIA DISPLAY PANEL INDUSTRY IN INDIUM MARKET, BY TYPE, 2018-2033 (USD THOUSAND)
TABLE 4367 SAUDI ARABIA LCD PANEL MANUFACTURING IN INDIUM MARKET, BY PURITY GRADE, 2018-2033 (USD THOUSAND)
TABLE 4368 SAUDI ARABIA OLED PANEL MANUFACTURING IN INDIUM MARKET, BY PURITY GRADE, 2018-2033 (USD THOUSAND)
TABLE 4369 SAUDI ARABIA DISPLAY PANEL MANUFACTURING IN INDIUM MARKET, BY PURITY GRADE, 2018-2033 (USD THOUSAND)
TABLE 4370 SAUDI ARABIA TOUCH PANEL SENSORS IN INDIUM MARKET, BY PURITY GRADE, 2018-2033 (USD THOUSAND)
TABLE 4371 SAUDI ARABIA TRANSPARENT CONDUCTIVE FILMS IN INDIUM MARKET, BY PURITY GRADE, 2018-2033 (USD THOUSAND)
TABLE 4372 SAUDI ARABIA FLEXIBLE & FOLDABLE DISPLAYS IN INDIUM MARKET, BY PURITY GRADE, 2018-2033 (USD THOUSAND)
TABLE 4373 SAUDI ARABIA AR/VR DISPLAYS IN INDIUM MARKET, BY PURITY GRADE, 2018-2033 (USD THOUSAND)
TABLE 4374 SAUDI ARABIA MICRODISPLAY DEVICES IN INDIUM MARKET, BY PURITY GRADE, 2018-2033 (USD THOUSAND)
TABLE 4375 SAUDI ARABIA BACKPLANE COATINGS IN INDIUM MARKET, BY PURITY GRADE, 2018-2033 (USD THOUSAND)
TABLE 4376 SAUDI ARABIA SEMICONDUCTOR INDUSTRY IN INDIUM MARKET, BY TYPE, 2018-2033 (USD THOUSAND)
TABLE 4377 SAUDI ARABIA III-V COMPOUND SEMICONDUCTORS IN INDIUM MARKET, BY PURITY GRADE, 2018-2033 (USD THOUSAND)
TABLE 4378 SAUDI ARABIA HIGH-FREQUENCY RF COMPONENTS IN INDIUM MARKET, BY PURITY GRADE, 2018-2033 (USD THOUSAND)
TABLE 4379 SAUDI ARABIA SEMICONDUCTOR SUBSTRATES & EPITAXY IN INDIUM MARKET, BY PURITY GRADE, 2018-2033 (USD THOUSAND)
TABLE 4380 SAUDI ARABIA LASER DIODES IN INDIUM MARKET, BY PURITY GRADE, 2018-2033 (USD THOUSAND)
TABLE 4381 SAUDI ARABIA PHOTODETECTORS IN INDIUM MARKET, BY PURITY GRADE, 2018-2033 (USD THOUSAND)
TABLE 4382 SAUDI ARABIA HIGH-SPEED OPTOELECTRONICS IN INDIUM MARKET, BY PURITY GRADE, 2018-2033 (USD THOUSAND)
TABLE 4383 SAUDI ARABIA INFRARED DETECTORS IN INDIUM MARKET, BY PURITY GRADE, 2018-2033 (USD THOUSAND)
TABLE 4384 SAUDI ARABIA INTEGRATED PHOTONIC CIRCUITS IN INDIUM MARKET, BY PURITY GRADE, 2018-2033 (USD THOUSAND)
TABLE 4385 SAUDI ARABIA SOLAR PHOTOVOLTAIC INDUSTRY IN INDIUM MARKET, BY TYPE, 2018-2033 (USD THOUSAND)
TABLE 4386 SAUDI ARABIA CIGS THIN-FILM SOLAR CELLS IN INDIUM MARKET, BY PURITY GRADE, 2018-2033 (USD THOUSAND)
TABLE 4387 SAUDI ARABIAHIGH-EFFICIENCY MODULES IN INDIUM MARKET, BY PURITY GRADE, 2018-2033 (USD THOUSAND)
TABLE 4388 SAUDI ARABIA THIN-FILM COATINGS IN INDIUM MARKET, BY PURITY GRADE, 2018-2033 (USD THOUSAND)
TABLE 4389 SAUDI ARABIA TRANSPARENT ELECTRODES IN INDIUM MARKET, BY PURITY GRADE, 2018-2033 (USD THOUSAND)
TABLE 4390 SAUDI ARABIA BIPV IN INDIUM MARKET, BY PURITY GRADE, 2018-2033 (USD THOUSAND)
TABLE 4391 SAUDI ARABIA FLEXIBLE SOLAR PANELS IN INDIUM MARKET, BY PURITY GRADE, 2018-2033 (USD THOUSAND)
TABLE 4392 SAUDI ARABIA PORTABLE SOLAR SYSTEMS IN INDIUM MARKET, BY PURITY GRADE, 2018-2033 (USD THOUSAND)
TABLE 4393 SAUDI ARABIA CONCENTRATED PV IN INDIUM MARKET, BY PURITY GRADE, 2018-2033 (USD THOUSAND)
TABLE 4394 SAUDI ARABIA AUTOMOTIVE INDUSTRY IN INDIUM MARKET, BY TYPE, 2018-2033 (USD THOUSAND)
TABLE 4395 SAUDI ARABIA AUTOMOTIVE DISPLAY PANELS IN INDIUM MARKET, BY PURITY GRADE, 2018-2033 (USD THOUSAND)
TABLE 4396 SAUDI ARABIAADAS SENSORS IN INDIUM MARKET, BY PURITY GRADE, 2018-2033 (USD THOUSAND)
TABLE 4397 SAUDI ARABIA VEHICLE CAMERA MODULES IN INDIUM MARKET, BY PURITY GRADE, 2018-2033 (USD THOUSAND)
TABLE 4398 SAUDI ARABIA AUTOMOTIVE OPTOELECTRONICS IN INDIUM MARKET, BY PURITY GRADE, 2018-2033 (USD THOUSAND)
TABLE 4399 SAUDI ARABIA POWER ELECTRONICS IN INDIUM MARKET, BY PURITY GRADE, 2018-2033 (USD THOUSAND)
TABLE 4400 SAUDI ARABIA TOUCHSCREEN INTERFACES IN INDIUM MARKET, BY PURITY GRADE, 2018-2033 (USD THOUSAND)
TABLE 4401 SAUDI ARABIA INFRARED SENSORS IN INDIUM MARKET, BY PURITY GRADE, 2018-2033 (USD THOUSAND)
TABLE 4402 SAUDI ARABIA SMART LIGHTING IN INDIUM MARKET, BY PURITY GRADE, 2018-2033 (USD THOUSAND)
TABLE 4403 SAUDI ARABIA TELECOMMUNICATION EQUIPMENT INDUSTRY IN INDIUM MARKET, BY TYPE, 2018-2033 (USD THOUSAND)
TABLE 4404 SAUDI ARABIA OPTICAL TRANSCEIVERS IN INDIUM MARKET, BY PURITY GRADE, 2018-2033 (USD THOUSAND)
TABLE 4405 SAUDI ARABIA RF POWER AMPLIFIERS IN INDIUM MARKET, BY PURITY GRADE, 2018-2033 (USD THOUSAND)
TABLE 4406 SAUDI ARABIA HIGH-FREQUENCY COMMUNICATION CHIPS IN INDIUM MARKET, BY PURITY GRADE, 2018-2033 (USD THOUSAND)
TABLE 4407 SAUDI ARABIA FIBER-OPTIC COMMUNICATION LASERS IN INDIUM MARKET, BY PURITY GRADE, 2018-2033 (USD THOUSAND)
TABLE 4408 SAUDI ARABIA PHOTODETECTORS FOR OPTICAL NETWORKS IN INDIUM MARKET, BY PURITY GRADE, 2018-2033 (USD THOUSAND)
TABLE 4409 SAUDI ARABIA 5G INFRASTRUCTURE COMPONENTS IN INDIUM MARKET, BY PURITY GRADE, 2018-2033 (USD THOUSAND)
TABLE 4410 SAUDI ARABIA OPTICAL NETWORK SWITCHING DEVICES IN INDIUM MARKET, BY PURITY GRADE, 2018-2033 (USD THOUSAND)
TABLE 4411 SAUDI ARABIA SATELLITE COMMUNICATION MODULES IN INDIUM MARKET, BY PURITY GRADE, 2018-2033 (USD THOUSAND)
TABLE 4412 SAUDI ARABIA OPTICAL & PHOTONICS INDUSTRY IN INDIUM MARKET, BY TYPE, 2018-2033 (USD THOUSAND)
TABLE 4413 SAUDI ARABIA OPTICAL COATINGS IN INDIUM MARKET, BY PURITY GRADE, 2018-2033 (USD THOUSAND)
TABLE 4414 SAUDI ARABIA FIBER OPTIC COMPONENTS IN INDIUM MARKET, BY PURITY GRADE, 2018-2033 (USD THOUSAND)
TABLE 4415 SAUDI ARABIA LASER COMPONENTS IN INDIUM MARKET, BY PURITY GRADE, 2018-2033 (USD THOUSAND)
TABLE 4416 SAUDI ARABIA OPTICAL SENSORS IN INDIUM MARKET, BY PURITY GRADE, 2018-2033 (USD THOUSAND)
TABLE 4417 SAUDI ARABIA INFRARED OPTICS IN INDIUM MARKET, BY PURITY GRADE, 2018-2033 (USD THOUSAND)
TABLE 4418 SAUDI ARABIA PICS IN INDIUM MARKET, BY PURITY GRADE, 2018-2033 (USD THOUSAND)
TABLE 4419 SAUDI ARABIA MIRRORS IN INDIUM MARKET, BY PURITY GRADE, 2018-2033 (USD THOUSAND)
TABLE 4420 SAUDI ARABIA SPECTROSCOPY IN INDIUM MARKET, BY PURITY GRADE, 2018-2033 (USD THOUSAND)
TABLE 4421 SAUDI ARABIA AEROSPACE & DEFENSE INDUSTRY IN INDIUM MARKET, BY TYPE, 2018-2033 (USD THOUSAND)
TABLE 4422 SAUDI ARABIA INFRARED IMAGING SYSTEMS IN INDIUM MARKET, BY PURITY GRADE, 2018-2033 (USD THOUSAND)
TABLE 4423 SAUDI ARABIA RADAR & RF COMPONENTS IN INDIUM MARKET, BY PURITY GRADE, 2018-2033 (USD THOUSAND)
TABLE 4424 SAUDI ARABIA SATELLITE COMMUNICATION IN INDIUM MARKET, BY PURITY GRADE, 2018-2033 (USD THOUSAND)
TABLE 4425 SAUDI ARABIA MILITARY OPTOELECTRONICS IN INDIUM MARKET, BY PURITY GRADE, 2018-2033 (USD THOUSAND)
TABLE 4426 SAUDI ARABIA AVIONICS DISPLAYS IN INDIUM MARKET, BY PURITY GRADE, 2018-2033 (USD THOUSAND)
TABLE 4427 SAUDI ARABIA SPACECRAFT SOLAR PANELS IN INDIUM MARKET, BY PURITY GRADE, 2018-2033 (USD THOUSAND)
TABLE 4428 SAUDI ARABIA THERMAL MATERIALS IN INDIUM MARKET, BY PURITY GRADE, 2018-2033 (USD THOUSAND)
TABLE 4429 SAUDI ARABIA CRYOGENIC MATERIALS IN INDIUM MARKET, BY PURITY GRADE, 2018-2033 (USD THOUSAND)
TABLE 4430 SAUDI ARABIA MEDICAL DEVICE INDUSTRY IN INDIUM MARKET, BY TYPE, 2018-2033 (USD THOUSAND)
TABLE 4431 SAUDI ARABIA MEDICAL IMAGING SENSORS IN INDIUM MARKET, BY PURITY GRADE, 2018-2033 (USD THOUSAND)
TABLE 4432 SAUDI ARABIA DIAGNOSTIC EQUIPMENT DISPLAYS IN INDIUM MARKET, BY PURITY GRADE, 2018-2033 (USD THOUSAND)
TABLE 4433 SAUDI ARABIA ADVANCED DIAGNOSTIC INSTRUMENTS IN INDIUM MARKET, BY PURITY GRADE, 2018-2033 (USD THOUSAND)
TABLE 4434 SAUDI ARABIA LASER SURGICAL EQUIPMENT IN INDIUM MARKET, BY PURITY GRADE, 2018-2033 (USD THOUSAND)
TABLE 4435 SAUDI ARABIA BIOMEDICAL OPTICAL DEVICES IN INDIUM MARKET, BY PURITY GRADE, 2018-2033 (USD THOUSAND)
TABLE 4436 SAUDI ARABIA RADIATION DETECTION EQUIPMENT IN INDIUM MARKET, BY PURITY GRADE, 2018-2033 (USD THOUSAND)
TABLE 4437 SAUDI ARABIA INFRARED MEDICAL SENSORS IN INDIUM MARKET, BY PURITY GRADE, 2018-2033 (USD THOUSAND)
TABLE 4438 SAUDI ARABIA PHOTOTHERAPY DEVICES IN INDIUM MARKET, BY PURITY GRADE, 2018-2033 (USD THOUSAND)
TABLE 4439 SAUDI ARABIA INDUSTRIAL EQUIPMENT MANUFACTURING IN INDIUM MARKET, BY TYPE, 2018-2033 (USD THOUSAND)
TABLE 4440 SAUDI ARABIA INDUSTRIAL SENSORS IN INDIUM MARKET, BY PURITY GRADE, 2018-2033 (USD THOUSAND)
TABLE 4441 SAUDI ARABIA VACUUM DEPOSITION COATINGS IN INDIUM MARKET, BY PURITY GRADE, 2018-2033 (USD THOUSAND)
TABLE 4442 SAUDI ARABIA PRECISION OPTICAL COMPONENTS IN INDIUM MARKET, BY PURITY GRADE, 2018-2033 (USD THOUSAND)
TABLE 4443 SAUDI ARABIA THERMAL INTERFACE MATERIALS IN INDIUM MARKET, BY PURITY GRADE, 2018-2033 (USD THOUSAND)
TABLE 4444 SAUDI ARABIA INDUSTRIAL LASER SYSTEMS IN INDIUM MARKET, BY PURITY GRADE, 2018-2033 (USD THOUSAND)
TABLE 4445 SAUDI ARABIA INDUSTRIAL INFRARED DETECTORS IN INDIUM MARKET, BY PURITY GRADE, 2018-2033 (USD THOUSAND)
TABLE 4446 SAUDI ARABIA PRECISION MEASUREMENT EQUIPMENT IN INDIUM MARKET, BY PURITY GRADE, 2018-2033 (USD THOUSAND)
TABLE 4447 SAUDI ARABIA SPECIALTY ELECTRONIC COMPONENTS IN INDIUM MARKET, BY PURITY GRADE, 2018-2033 (USD THOUSAND)
TABLE 4448 SAUDI ARABIA OTHERS IN INDIUM MARKET, BY TYPE, 2018-2033 (USD THOUSAND)
TABLE 4449 SAUDI ARABIA ADVANCED MATERIALS MANUFACTURING IN INDIUM MARKET, BY PURITY GRADE, 2018-2033 (USD THOUSAND)
TABLE 4450 SAUDI ARABIA SPECIALTY ALLOY PRODUCTION IN INDIUM MARKET, BY PURITY GRADE, 2018-2033 (USD THOUSAND)
TABLE 4451 SAUDI ARABIA THERMAL MANAGEMENT MATERIALS IN INDIUM MARKET, BY PURITY GRADE, 2018-2033 (USD THOUSAND)
TABLE 4452 SAUDI ARABIA PRECISION SCIENTIFIC INSTRUMENTS IN INDIUM MARKET, BY PURITY GRADE, 2018-2033 (USD THOUSAND)
TABLE 4453 SAUDI ARABIA RESEARCH INSTITUTES & UNIVERSITIES IN INDIUM MARKET, BY PURITY GRADE, 2018-2033 (USD THOUSAND)
TABLE 4454 SAUDI ARABIA NUCLEAR INDUSTRY APPLICATIONS IN INDIUM MARKET, BY PURITY GRADE, 2018-2033 (USD THOUSAND)
TABLE 4455 SAUDI ARABIA SPECIALTY CHEMICAL PRODUCTION IN INDIUM MARKET, BY PURITY GRADE, 2018-2033 (USD THOUSAND)
TABLE 4456 SAUDI ARABIA DEFENSE RESEARCH LABORATORIES IN INDIUM MARKET, BY PURITY GRADE, 2018-2033 (USD THOUSAND)
TABLE 4457 SAUDI ARABIA CRYOGENIC EQUIPMENT MANUFACTURING IN INDIUM MARKET, BY PURITY GRADE, 2018-2033 (USD THOUSAND)
TABLE 4458 UNITED ARAB EMIRATES INDIUM MARKET, BY PRODUCT TYPE, 2018-2033 (USD THOUSAND)
TABLE 4459 UNITED ARAB EMIRATES INGOTS IN INDIUM MARKET, BY TYPE, 2018-2033 (USD THOUSAND)
TABLE 4460 UNITED ARAB EMIRATES INDIUM MARKET, BY MATERIAL COMPOSITION, 2018-2033 (USD THOUSAND)
TABLE 4461 UNITED ARAB EMIRATES INDIUM ALLOYS IN INDIUM MARKET, BY TYPE, 2018-2033 (USD THOUSAND)
TABLE 4462 UNITED ARAB EMIRATES INDIUM COMPOUNDS IN INDIUM MARKET, BY TYPE, 2018-2033 (USD THOUSAND)
TABLE 4463 UNITED ARAB EMIRATES INDIUM MARKET, BY PURITY GRADE, 2018-2033 (USD THOUSAND)
TABLE 4464 UNITED ARAB EMIRATES INDIUM MARKET, BY EXTRACTION SOURCE, 2018-2033 (USD THOUSAND)
TABLE 4465 UNITED ARAB EMIRATES PRIMARY PRODUCTION IN INDIUM MARKET, BY TYPE, 2018-2033 (USD THOUSAND)
TABLE 4466 UNITED ARAB EMIRATES SECONDARY PRODUCTION IN INDIUM MARKET, BY TYPE, 2018-2033 (USD THOUSAND)
TABLE 4467 UNITED ARAB EMIRATES INDIUM MARKET, BY DISTRIBUTION CHANNEL, 2018-2033 (USD THOUSAND)
TABLE 4468 UNITED ARAB EMIRATES INDIUM MARKET, BY TECHNOLOGY PLATFORM, 2018-2033 (USD THOUSAND)
TABLE 4469 UNITED ARAB EMIRATES INDIUM MARKET, BY END-USER INDUSTRY, 2018-2033 (USD THOUSAND)
TABLE 4470 UNITED ARAB EMIRATES CONSUMER ELECTRONICS INDUSTRY IN INDIUM MARKET, BY TYPE, 2018-2033 (USD THOUSAND)
TABLE 4471 UNITED ARAB EMIRATES FLAT PANEL DISPLAYS (LCD/OLED/LED) IN INDIUM MARKET, BY PURITY GRADE, 2018-2033 (USD THOUSAND)
TABLE 4472 UNITED ARAB EMIRATES TRANSPARENT CONDUCTIVE COATINGS (ITO) IN INDIUM MARKET, BY PURITY GRADE, 2018-2033 (USD THOUSAND)
TABLE 4473 UNITED ARAB EMIRATES TOUCHSCREEN DISPLAYS IN INDIUM MARKET, BY PURITY GRADE, 2018-2033 (USD THOUSAND)
TABLE 4474 UNITED ARAB EMIRATES FLEXIBLE DISPLAYS & ELECTRONICS IN INDIUM MARKET, BY PURITY GRADE, 2018-2033 (USD THOUSAND)
TABLE 4475 UNITED ARAB EMIRATES WEARABLE ELECTRONICS DEVICES IN INDIUM MARKET, BY PURITY GRADE, 2018-2033 (USD THOUSAND)
TABLE 4476 UNITED ARAB EMIRATES CAMERA & OPTICAL SENSORS IN INDIUM MARKET, BY PURITY GRADE, 2018-2033 (USD THOUSAND)
TABLE 4477 UNITED ARAB EMIRATES MINI-LED BACKLIGHTING IN INDIUM MARKET, BY PURITY GRADE, 2018-2033 (USD THOUSAND)
TABLE 4478 UNITED ARAB EMIRATES MICRO-LED DISPLAYS IN INDIUM MARKET, BY PURITY GRADE, 2018-2033 (USD THOUSAND)
TABLE 4479 UNITED ARAB EMIRATES DISPLAY PANEL INDUSTRY IN INDIUM MARKET, BY TYPE, 2018-2033 (USD THOUSAND)
TABLE 4480 UNITED ARAB EMIRATES LCD PANEL MANUFACTURING IN INDIUM MARKET, BY PURITY GRADE, 2018-2033 (USD THOUSAND)
TABLE 4481 UNITED ARAB EMIRATES OLED PANEL MANUFACTURING IN INDIUM MARKET, BY PURITY GRADE, 2018-2033 (USD THOUSAND)
TABLE 4482 UNITED ARAB EMIRATES DISPLAY PANEL MANUFACTURING IN INDIUM MARKET, BY PURITY GRADE, 2018-2033 (USD THOUSAND)
TABLE 4483 UNITED ARAB EMIRATES TOUCH PANEL SENSORS IN INDIUM MARKET, BY PURITY GRADE, 2018-2033 (USD THOUSAND)
TABLE 4484 UNITED ARAB EMIRATES TRANSPARENT CONDUCTIVE FILMS IN INDIUM MARKET, BY PURITY GRADE, 2018-2033 (USD THOUSAND)
TABLE 4485 UNITED ARAB EMIRATES FLEXIBLE & FOLDABLE DISPLAYS IN INDIUM MARKET, BY PURITY GRADE, 2018-2033 (USD THOUSAND)
TABLE 4486 UNITED ARAB EMIRATES AR/VR DISPLAYS IN INDIUM MARKET, BY PURITY GRADE, 2018-2033 (USD THOUSAND)
TABLE 4487 UNITED ARAB EMIRATES MICRODISPLAY DEVICES IN INDIUM MARKET, BY PURITY GRADE, 2018-2033 (USD THOUSAND)
TABLE 4488 UNITED ARAB EMIRATES BACKPLANE COATINGS IN INDIUM MARKET, BY PURITY GRADE, 2018-2033 (USD THOUSAND)
TABLE 4489 UNITED ARAB EMIRATES SEMICONDUCTOR INDUSTRY IN INDIUM MARKET, BY TYPE, 2018-2033 (USD THOUSAND)
TABLE 4490 UNITED ARAB EMIRATES III-V COMPOUND SEMICONDUCTORS IN INDIUM MARKET, BY PURITY GRADE, 2018-2033 (USD THOUSAND)
TABLE 4491 UNITED ARAB EMIRATES HIGH-FREQUENCY RF COMPONENTS IN INDIUM MARKET, BY PURITY GRADE, 2018-2033 (USD THOUSAND)
TABLE 4492 UNITED ARAB EMIRATES SEMICONDUCTOR SUBSTRATES & EPITAXY IN INDIUM MARKET, BY PURITY GRADE, 2018-2033 (USD THOUSAND)
TABLE 4493 UNITED ARAB EMIRATES LASER DIODES IN INDIUM MARKET, BY PURITY GRADE, 2018-2033 (USD THOUSAND)
TABLE 4494 UNITED ARAB EMIRATES PHOTODETECTORS IN INDIUM MARKET, BY PURITY GRADE, 2018-2033 (USD THOUSAND)
TABLE 4495 UNITED ARAB EMIRATES HIGH-SPEED OPTOELECTRONICS IN INDIUM MARKET, BY PURITY GRADE, 2018-2033 (USD THOUSAND)
TABLE 4496 UNITED ARAB EMIRATES INFRARED DETECTORS IN INDIUM MARKET, BY PURITY GRADE, 2018-2033 (USD THOUSAND)
TABLE 4497 UNITED ARAB EMIRATES INTEGRATED PHOTONIC CIRCUITS IN INDIUM MARKET, BY PURITY GRADE, 2018-2033 (USD THOUSAND)
TABLE 4498 UNITED ARAB EMIRATES SOLAR PHOTOVOLTAIC INDUSTRY IN INDIUM MARKET, BY TYPE, 2018-2033 (USD THOUSAND)
TABLE 4499 UNITED ARAB EMIRATES CIGS THIN-FILM SOLAR CELLS IN INDIUM MARKET, BY PURITY GRADE, 2018-2033 (USD THOUSAND)
TABLE 4500 UNITED ARAB EMIRATESHIGH-EFFICIENCY MODULES IN INDIUM MARKET, BY PURITY GRADE, 2018-2033 (USD THOUSAND)
TABLE 4501 UNITED ARAB EMIRATES THIN-FILM COATINGS IN INDIUM MARKET, BY PURITY GRADE, 2018-2033 (USD THOUSAND)
TABLE 4502 UNITED ARAB EMIRATES TRANSPARENT ELECTRODES IN INDIUM MARKET, BY PURITY GRADE, 2018-2033 (USD THOUSAND)
TABLE 4503 UNITED ARAB EMIRATES BIPV IN INDIUM MARKET, BY PURITY GRADE, 2018-2033 (USD THOUSAND)
TABLE 4504 UNITED ARAB EMIRATES FLEXIBLE SOLAR PANELS IN INDIUM MARKET, BY PURITY GRADE, 2018-2033 (USD THOUSAND)
TABLE 4505 UNITED ARAB EMIRATES PORTABLE SOLAR SYSTEMS IN INDIUM MARKET, BY PURITY GRADE, 2018-2033 (USD THOUSAND)
TABLE 4506 UNITED ARAB EMIRATES CONCENTRATED PV IN INDIUM MARKET, BY PURITY GRADE, 2018-2033 (USD THOUSAND)
TABLE 4507 UNITED ARAB EMIRATES AUTOMOTIVE INDUSTRY IN INDIUM MARKET, BY TYPE, 2018-2033 (USD THOUSAND)
TABLE 4508 UNITED ARAB EMIRATES AUTOMOTIVE DISPLAY PANELS IN INDIUM MARKET, BY PURITY GRADE, 2018-2033 (USD THOUSAND)
TABLE 4509 UNITED ARAB EMIRATESADAS SENSORS IN INDIUM MARKET, BY PURITY GRADE, 2018-2033 (USD THOUSAND)
TABLE 4510 UNITED ARAB EMIRATES VEHICLE CAMERA MODULES IN INDIUM MARKET, BY PURITY GRADE, 2018-2033 (USD THOUSAND)
TABLE 4511 UNITED ARAB EMIRATES AUTOMOTIVE OPTOELECTRONICS IN INDIUM MARKET, BY PURITY GRADE, 2018-2033 (USD THOUSAND)
TABLE 4512 UNITED ARAB EMIRATES POWER ELECTRONICS IN INDIUM MARKET, BY PURITY GRADE, 2018-2033 (USD THOUSAND)
TABLE 4513 UNITED ARAB EMIRATES TOUCHSCREEN INTERFACES IN INDIUM MARKET, BY PURITY GRADE, 2018-2033 (USD THOUSAND)
TABLE 4514 UNITED ARAB EMIRATES INFRARED SENSORS IN INDIUM MARKET, BY PURITY GRADE, 2018-2033 (USD THOUSAND)
TABLE 4515 UNITED ARAB EMIRATES SMART LIGHTING IN INDIUM MARKET, BY PURITY GRADE, 2018-2033 (USD THOUSAND)
TABLE 4516 UNITED ARAB EMIRATES TELECOMMUNICATION EQUIPMENT INDUSTRY IN INDIUM MARKET, BY TYPE, 2018-2033 (USD THOUSAND)
TABLE 4517 UNITED ARAB EMIRATES OPTICAL TRANSCEIVERS IN INDIUM MARKET, BY PURITY GRADE, 2018-2033 (USD THOUSAND)
TABLE 4518 UNITED ARAB EMIRATES RF POWER AMPLIFIERS IN INDIUM MARKET, BY PURITY GRADE, 2018-2033 (USD THOUSAND)
TABLE 4519 UNITED ARAB EMIRATES HIGH-FREQUENCY COMMUNICATION CHIPS IN INDIUM MARKET, BY PURITY GRADE, 2018-2033 (USD THOUSAND)
TABLE 4520 UNITED ARAB EMIRATES FIBER-OPTIC COMMUNICATION LASERS IN INDIUM MARKET, BY PURITY GRADE, 2018-2033 (USD THOUSAND)
TABLE 4521 UNITED ARAB EMIRATES PHOTODETECTORS FOR OPTICAL NETWORKS IN INDIUM MARKET, BY PURITY GRADE, 2018-2033 (USD THOUSAND)
TABLE 4522 UNITED ARAB EMIRATES 5G INFRASTRUCTURE COMPONENTS IN INDIUM MARKET, BY PURITY GRADE, 2018-2033 (USD THOUSAND)
TABLE 4523 UNITED ARAB EMIRATES OPTICAL NETWORK SWITCHING DEVICES IN INDIUM MARKET, BY PURITY GRADE, 2018-2033 (USD THOUSAND)
TABLE 4524 UNITED ARAB EMIRATES SATELLITE COMMUNICATION MODULES IN INDIUM MARKET, BY PURITY GRADE, 2018-2033 (USD THOUSAND)
TABLE 4525 UNITED ARAB EMIRATES OPTICAL & PHOTONICS INDUSTRY IN INDIUM MARKET, BY TYPE, 2018-2033 (USD THOUSAND)
TABLE 4526 UNITED ARAB EMIRATES OPTICAL COATINGS IN INDIUM MARKET, BY PURITY GRADE, 2018-2033 (USD THOUSAND)
TABLE 4527 UNITED ARAB EMIRATES FIBER OPTIC COMPONENTS IN INDIUM MARKET, BY PURITY GRADE, 2018-2033 (USD THOUSAND)
TABLE 4528 UNITED ARAB EMIRATES LASER COMPONENTS IN INDIUM MARKET, BY PURITY GRADE, 2018-2033 (USD THOUSAND)
TABLE 4529 UNITED ARAB EMIRATES OPTICAL SENSORS IN INDIUM MARKET, BY PURITY GRADE, 2018-2033 (USD THOUSAND)
TABLE 4530 UNITED ARAB EMIRATES INFRARED OPTICS IN INDIUM MARKET, BY PURITY GRADE, 2018-2033 (USD THOUSAND)
TABLE 4531 UNITED ARAB EMIRATES PICS IN INDIUM MARKET, BY PURITY GRADE, 2018-2033 (USD THOUSAND)
TABLE 4532 UNITED ARAB EMIRATES MIRRORS IN INDIUM MARKET, BY PURITY GRADE, 2018-2033 (USD THOUSAND)
TABLE 4533 UNITED ARAB EMIRATES SPECTROSCOPY IN INDIUM MARKET, BY PURITY GRADE, 2018-2033 (USD THOUSAND)
TABLE 4534 UNITED ARAB EMIRATES AEROSPACE & DEFENSE INDUSTRY IN INDIUM MARKET, BY TYPE, 2018-2033 (USD THOUSAND)
TABLE 4535 UNITED ARAB EMIRATES INFRARED IMAGING SYSTEMS IN INDIUM MARKET, BY PURITY GRADE, 2018-2033 (USD THOUSAND)
TABLE 4536 UNITED ARAB EMIRATES RADAR & RF COMPONENTS IN INDIUM MARKET, BY PURITY GRADE, 2018-2033 (USD THOUSAND)
TABLE 4537 UNITED ARAB EMIRATES SATELLITE COMMUNICATION IN INDIUM MARKET, BY PURITY GRADE, 2018-2033 (USD THOUSAND)
TABLE 4538 UNITED ARAB EMIRATES MILITARY OPTOELECTRONICS IN INDIUM MARKET, BY PURITY GRADE, 2018-2033 (USD THOUSAND)
TABLE 4539 UNITED ARAB EMIRATES AVIONICS DISPLAYS IN INDIUM MARKET, BY PURITY GRADE, 2018-2033 (USD THOUSAND)
TABLE 4540 UNITED ARAB EMIRATES SPACECRAFT SOLAR PANELS IN INDIUM MARKET, BY PURITY GRADE, 2018-2033 (USD THOUSAND)
TABLE 4541 UNITED ARAB EMIRATES THERMAL MATERIALS IN INDIUM MARKET, BY PURITY GRADE, 2018-2033 (USD THOUSAND)
TABLE 4542 UNITED ARAB EMIRATES CRYOGENIC MATERIALS IN INDIUM MARKET, BY PURITY GRADE, 2018-2033 (USD THOUSAND)
TABLE 4543 UNITED ARAB EMIRATES MEDICAL DEVICE INDUSTRY IN INDIUM MARKET, BY TYPE, 2018-2033 (USD THOUSAND)
TABLE 4544 UNITED ARAB EMIRATES MEDICAL IMAGING SENSORS IN INDIUM MARKET, BY PURITY GRADE, 2018-2033 (USD THOUSAND)
TABLE 4545 UNITED ARAB EMIRATES DIAGNOSTIC EQUIPMENT DISPLAYS IN INDIUM MARKET, BY PURITY GRADE, 2018-2033 (USD THOUSAND)
TABLE 4546 UNITED ARAB EMIRATES ADVANCED DIAGNOSTIC INSTRUMENTS IN INDIUM MARKET, BY PURITY GRADE, 2018-2033 (USD THOUSAND)
TABLE 4547 UNITED ARAB EMIRATES LASER SURGICAL EQUIPMENT IN INDIUM MARKET, BY PURITY GRADE, 2018-2033 (USD THOUSAND)
TABLE 4548 UNITED ARAB EMIRATES BIOMEDICAL OPTICAL DEVICES IN INDIUM MARKET, BY PURITY GRADE, 2018-2033 (USD THOUSAND)
TABLE 4549 UNITED ARAB EMIRATES RADIATION DETECTION EQUIPMENT IN INDIUM MARKET, BY PURITY GRADE, 2018-2033 (USD THOUSAND)
TABLE 4550 UNITED ARAB EMIRATES INFRARED MEDICAL SENSORS IN INDIUM MARKET, BY PURITY GRADE, 2018-2033 (USD THOUSAND)
TABLE 4551 UNITED ARAB EMIRATES PHOTOTHERAPY DEVICES IN INDIUM MARKET, BY PURITY GRADE, 2018-2033 (USD THOUSAND)
TABLE 4552 UNITED ARAB EMIRATES INDUSTRIAL EQUIPMENT MANUFACTURING IN INDIUM MARKET, BY TYPE, 2018-2033 (USD THOUSAND)
TABLE 4553 UNITED ARAB EMIRATES INDUSTRIAL SENSORS IN INDIUM MARKET, BY PURITY GRADE, 2018-2033 (USD THOUSAND)
TABLE 4554 UNITED ARAB EMIRATES VACUUM DEPOSITION COATINGS IN INDIUM MARKET, BY PURITY GRADE, 2018-2033 (USD THOUSAND)
TABLE 4555 UNITED ARAB EMIRATES PRECISION OPTICAL COMPONENTS IN INDIUM MARKET, BY PURITY GRADE, 2018-2033 (USD THOUSAND)
TABLE 4556 UNITED ARAB EMIRATES THERMAL INTERFACE MATERIALS IN INDIUM MARKET, BY PURITY GRADE, 2018-2033 (USD THOUSAND)
TABLE 4557 UNITED ARAB EMIRATES INDUSTRIAL LASER SYSTEMS IN INDIUM MARKET, BY PURITY GRADE, 2018-2033 (USD THOUSAND)
TABLE 4558 UNITED ARAB EMIRATES INDUSTRIAL INFRARED DETECTORS IN INDIUM MARKET, BY PURITY GRADE, 2018-2033 (USD THOUSAND)
TABLE 4559 UNITED ARAB EMIRATES PRECISION MEASUREMENT EQUIPMENT IN INDIUM MARKET, BY PURITY GRADE, 2018-2033 (USD THOUSAND)
TABLE 4560 UNITED ARAB EMIRATES SPECIALTY ELECTRONIC COMPONENTS IN INDIUM MARKET, BY PURITY GRADE, 2018-2033 (USD THOUSAND)
TABLE 4561 UNITED ARAB EMIRATES OTHERS IN INDIUM MARKET, BY TYPE, 2018-2033 (USD THOUSAND)
TABLE 4562 UNITED ARAB EMIRATES ADVANCED MATERIALS MANUFACTURING IN INDIUM MARKET, BY PURITY GRADE, 2018-2033 (USD THOUSAND)
TABLE 4563 UNITED ARAB EMIRATES SPECIALTY ALLOY PRODUCTION IN INDIUM MARKET, BY PURITY GRADE, 2018-2033 (USD THOUSAND)
TABLE 4564 UNITED ARAB EMIRATES THERMAL MANAGEMENT MATERIALS IN INDIUM MARKET, BY PURITY GRADE, 2018-2033 (USD THOUSAND)
TABLE 4565 UNITED ARAB EMIRATES PRECISION SCIENTIFIC INSTRUMENTS IN INDIUM MARKET, BY PURITY GRADE, 2018-2033 (USD THOUSAND)
TABLE 4566 UNITED ARAB EMIRATES RESEARCH INSTITUTES & UNIVERSITIES IN INDIUM MARKET, BY PURITY GRADE, 2018-2033 (USD THOUSAND)
TABLE 4567 UNITED ARAB EMIRATES NUCLEAR INDUSTRY APPLICATIONS IN INDIUM MARKET, BY PURITY GRADE, 2018-2033 (USD THOUSAND)
TABLE 4568 UNITED ARAB EMIRATES SPECIALTY CHEMICAL PRODUCTION IN INDIUM MARKET, BY PURITY GRADE, 2018-2033 (USD THOUSAND)
TABLE 4569 UNITED ARAB EMIRATES DEFENSE RESEARCH LABORATORIES IN INDIUM MARKET, BY PURITY GRADE, 2018-2033 (USD THOUSAND)
TABLE 4570 UNITED ARAB EMIRATES CRYOGENIC EQUIPMENT MANUFACTURING IN INDIUM MARKET, BY PURITY GRADE, 2018-2033 (USD THOUSAND)
TABLE 4571 ISRAEL INDIUM MARKET, BY PRODUCT TYPE, 2018-2033 (USD THOUSAND)
TABLE 4572 ISRAEL INGOTS IN INDIUM MARKET, BY TYPE, 2018-2033 (USD THOUSAND)
TABLE 4573 ISRAEL INDIUM MARKET, BY MATERIAL COMPOSITION, 2018-2033 (USD THOUSAND)
TABLE 4574 ISRAEL INDIUM ALLOYS IN INDIUM MARKET, BY TYPE, 2018-2033 (USD THOUSAND)
TABLE 4575 ISRAEL INDIUM COMPOUNDS IN INDIUM MARKET, BY TYPE, 2018-2033 (USD THOUSAND)
TABLE 4576 ISRAEL INDIUM MARKET, BY PURITY GRADE, 2018-2033 (USD THOUSAND)
TABLE 4577 ISRAEL INDIUM MARKET, BY EXTRACTION SOURCE, 2018-2033 (USD THOUSAND)
TABLE 4578 ISRAEL PRIMARY PRODUCTION IN INDIUM MARKET, BY TYPE, 2018-2033 (USD THOUSAND)
TABLE 4579 ISRAEL SECONDARY PRODUCTION IN INDIUM MARKET, BY TYPE, 2018-2033 (USD THOUSAND)
TABLE 4580 ISRAEL INDIUM MARKET, BY DISTRIBUTION CHANNEL, 2018-2033 (USD THOUSAND)
TABLE 4581 ISRAEL INDIUM MARKET, BY TECHNOLOGY PLATFORM, 2018-2033 (USD THOUSAND)
TABLE 4582 ISRAEL INDIUM MARKET, BY END-USER INDUSTRY, 2018-2033 (USD THOUSAND)
TABLE 4583 ISRAEL CONSUMER ELECTRONICS INDUSTRY IN INDIUM MARKET, BY TYPE, 2018-2033 (USD THOUSAND)
TABLE 4584 ISRAEL FLAT PANEL DISPLAYS (LCD/OLED/LED) IN INDIUM MARKET, BY PURITY GRADE, 2018-2033 (USD THOUSAND)
TABLE 4585 ISRAEL TRANSPARENT CONDUCTIVE COATINGS (ITO) IN INDIUM MARKET, BY PURITY GRADE, 2018-2033 (USD THOUSAND)
TABLE 4586 ISRAEL TOUCHSCREEN DISPLAYS IN INDIUM MARKET, BY PURITY GRADE, 2018-2033 (USD THOUSAND)
TABLE 4587 ISRAEL FLEXIBLE DISPLAYS & ELECTRONICS IN INDIUM MARKET, BY PURITY GRADE, 2018-2033 (USD THOUSAND)
TABLE 4588 ISRAEL WEARABLE ELECTRONICS DEVICES IN INDIUM MARKET, BY PURITY GRADE, 2018-2033 (USD THOUSAND)
TABLE 4589 ISRAEL CAMERA & OPTICAL SENSORS IN INDIUM MARKET, BY PURITY GRADE, 2018-2033 (USD THOUSAND)
TABLE 4590 ISRAEL MINI-LED BACKLIGHTING IN INDIUM MARKET, BY PURITY GRADE, 2018-2033 (USD THOUSAND)
TABLE 4591 ISRAEL MICRO-LED DISPLAYS IN INDIUM MARKET, BY PURITY GRADE, 2018-2033 (USD THOUSAND)
TABLE 4592 ISRAEL DISPLAY PANEL INDUSTRY IN INDIUM MARKET, BY TYPE, 2018-2033 (USD THOUSAND)
TABLE 4593 ISRAEL LCD PANEL MANUFACTURING IN INDIUM MARKET, BY PURITY GRADE, 2018-2033 (USD THOUSAND)
TABLE 4594 ISRAEL OLED PANEL MANUFACTURING IN INDIUM MARKET, BY PURITY GRADE, 2018-2033 (USD THOUSAND)
TABLE 4595 ISRAEL DISPLAY PANEL MANUFACTURING IN INDIUM MARKET, BY PURITY GRADE, 2018-2033 (USD THOUSAND)
TABLE 4596 ISRAEL TOUCH PANEL SENSORS IN INDIUM MARKET, BY PURITY GRADE, 2018-2033 (USD THOUSAND)
TABLE 4597 ISRAEL TRANSPARENT CONDUCTIVE FILMS IN INDIUM MARKET, BY PURITY GRADE, 2018-2033 (USD THOUSAND)
TABLE 4598 ISRAEL FLEXIBLE & FOLDABLE DISPLAYS IN INDIUM MARKET, BY PURITY GRADE, 2018-2033 (USD THOUSAND)
TABLE 4599 ISRAEL AR/VR DISPLAYS IN INDIUM MARKET, BY PURITY GRADE, 2018-2033 (USD THOUSAND)
TABLE 4600 ISRAEL MICRODISPLAY DEVICES IN INDIUM MARKET, BY PURITY GRADE, 2018-2033 (USD THOUSAND)
TABLE 4601 ISRAEL BACKPLANE COATINGS IN INDIUM MARKET, BY PURITY GRADE, 2018-2033 (USD THOUSAND)
TABLE 4602 ISRAEL SEMICONDUCTOR INDUSTRY IN INDIUM MARKET, BY TYPE, 2018-2033 (USD THOUSAND)
TABLE 4603 ISRAEL III-V COMPOUND SEMICONDUCTORS IN INDIUM MARKET, BY PURITY GRADE, 2018-2033 (USD THOUSAND)
TABLE 4604 ISRAEL HIGH-FREQUENCY RF COMPONENTS IN INDIUM MARKET, BY PURITY GRADE, 2018-2033 (USD THOUSAND)
TABLE 4605 ISRAEL SEMICONDUCTOR SUBSTRATES & EPITAXY IN INDIUM MARKET, BY PURITY GRADE, 2018-2033 (USD THOUSAND)
TABLE 4606 ISRAEL LASER DIODES IN INDIUM MARKET, BY PURITY GRADE, 2018-2033 (USD THOUSAND)
TABLE 4607 ISRAEL PHOTODETECTORS IN INDIUM MARKET, BY PURITY GRADE, 2018-2033 (USD THOUSAND)
TABLE 4608 ISRAEL HIGH-SPEED OPTOELECTRONICS IN INDIUM MARKET, BY PURITY GRADE, 2018-2033 (USD THOUSAND)
TABLE 4609 ISRAEL INFRARED DETECTORS IN INDIUM MARKET, BY PURITY GRADE, 2018-2033 (USD THOUSAND)
TABLE 4610 ISRAEL INTEGRATED PHOTONIC CIRCUITS IN INDIUM MARKET, BY PURITY GRADE, 2018-2033 (USD THOUSAND)
TABLE 4611 ISRAEL SOLAR PHOTOVOLTAIC INDUSTRY IN INDIUM MARKET, BY TYPE, 2018-2033 (USD THOUSAND)
TABLE 4612 ISRAEL CIGS THIN-FILM SOLAR CELLS IN INDIUM MARKET, BY PURITY GRADE, 2018-2033 (USD THOUSAND)
TABLE 4613 ISRAELHIGH-EFFICIENCY MODULES IN INDIUM MARKET, BY PURITY GRADE, 2018-2033 (USD THOUSAND)
TABLE 4614 ISRAEL THIN-FILM COATINGS IN INDIUM MARKET, BY PURITY GRADE, 2018-2033 (USD THOUSAND)
TABLE 4615 ISRAEL TRANSPARENT ELECTRODES IN INDIUM MARKET, BY PURITY GRADE, 2018-2033 (USD THOUSAND)
TABLE 4616 ISRAEL BIPV IN INDIUM MARKET, BY PURITY GRADE, 2018-2033 (USD THOUSAND)
TABLE 4617 ISRAEL FLEXIBLE SOLAR PANELS IN INDIUM MARKET, BY PURITY GRADE, 2018-2033 (USD THOUSAND)
TABLE 4618 ISRAEL PORTABLE SOLAR SYSTEMS IN INDIUM MARKET, BY PURITY GRADE, 2018-2033 (USD THOUSAND)
TABLE 4619 ISRAEL CONCENTRATED PV IN INDIUM MARKET, BY PURITY GRADE, 2018-2033 (USD THOUSAND)
TABLE 4620 ISRAEL AUTOMOTIVE INDUSTRY IN INDIUM MARKET, BY TYPE, 2018-2033 (USD THOUSAND)
TABLE 4621 ISRAEL AUTOMOTIVE DISPLAY PANELS IN INDIUM MARKET, BY PURITY GRADE, 2018-2033 (USD THOUSAND)
TABLE 4622 ISRAELADAS SENSORS IN INDIUM MARKET, BY PURITY GRADE, 2018-2033 (USD THOUSAND)
TABLE 4623 ISRAEL VEHICLE CAMERA MODULES IN INDIUM MARKET, BY PURITY GRADE, 2018-2033 (USD THOUSAND)
TABLE 4624 ISRAEL AUTOMOTIVE OPTOELECTRONICS IN INDIUM MARKET, BY PURITY GRADE, 2018-2033 (USD THOUSAND)
TABLE 4625 ISRAEL POWER ELECTRONICS IN INDIUM MARKET, BY PURITY GRADE, 2018-2033 (USD THOUSAND)
TABLE 4626 ISRAEL TOUCHSCREEN INTERFACES IN INDIUM MARKET, BY PURITY GRADE, 2018-2033 (USD THOUSAND)
TABLE 4627 ISRAEL INFRARED SENSORS IN INDIUM MARKET, BY PURITY GRADE, 2018-2033 (USD THOUSAND)
TABLE 4628 ISRAEL SMART LIGHTING IN INDIUM MARKET, BY PURITY GRADE, 2018-2033 (USD THOUSAND)
TABLE 4629 ISRAEL TELECOMMUNICATION EQUIPMENT INDUSTRY IN INDIUM MARKET, BY TYPE, 2018-2033 (USD THOUSAND)
TABLE 4630 ISRAEL OPTICAL TRANSCEIVERS IN INDIUM MARKET, BY PURITY GRADE, 2018-2033 (USD THOUSAND)
TABLE 4631 ISRAEL RF POWER AMPLIFIERS IN INDIUM MARKET, BY PURITY GRADE, 2018-2033 (USD THOUSAND)
TABLE 4632 ISRAEL HIGH-FREQUENCY COMMUNICATION CHIPS IN INDIUM MARKET, BY PURITY GRADE, 2018-2033 (USD THOUSAND)
TABLE 4633 ISRAEL FIBER-OPTIC COMMUNICATION LASERS IN INDIUM MARKET, BY PURITY GRADE, 2018-2033 (USD THOUSAND)
TABLE 4634 ISRAEL PHOTODETECTORS FOR OPTICAL NETWORKS IN INDIUM MARKET, BY PURITY GRADE, 2018-2033 (USD THOUSAND)
TABLE 4635 ISRAEL 5G INFRASTRUCTURE COMPONENTS IN INDIUM MARKET, BY PURITY GRADE, 2018-2033 (USD THOUSAND)
TABLE 4636 ISRAEL OPTICAL NETWORK SWITCHING DEVICES IN INDIUM MARKET, BY PURITY GRADE, 2018-2033 (USD THOUSAND)
TABLE 4637 ISRAEL SATELLITE COMMUNICATION MODULES IN INDIUM MARKET, BY PURITY GRADE, 2018-2033 (USD THOUSAND)
TABLE 4638 ISRAEL OPTICAL & PHOTONICS INDUSTRY IN INDIUM MARKET, BY TYPE, 2018-2033 (USD THOUSAND)
TABLE 4639 ISRAEL OPTICAL COATINGS IN INDIUM MARKET, BY PURITY GRADE, 2018-2033 (USD THOUSAND)
TABLE 4640 ISRAEL FIBER OPTIC COMPONENTS IN INDIUM MARKET, BY PURITY GRADE, 2018-2033 (USD THOUSAND)
TABLE 4641 ISRAEL LASER COMPONENTS IN INDIUM MARKET, BY PURITY GRADE, 2018-2033 (USD THOUSAND)
TABLE 4642 ISRAEL OPTICAL SENSORS IN INDIUM MARKET, BY PURITY GRADE, 2018-2033 (USD THOUSAND)
TABLE 4643 ISRAEL INFRARED OPTICS IN INDIUM MARKET, BY PURITY GRADE, 2018-2033 (USD THOUSAND)
TABLE 4644 ISRAEL PICS IN INDIUM MARKET, BY PURITY GRADE, 2018-2033 (USD THOUSAND)
TABLE 4645 ISRAEL MIRRORS IN INDIUM MARKET, BY PURITY GRADE, 2018-2033 (USD THOUSAND)
TABLE 4646 ISRAEL SPECTROSCOPY IN INDIUM MARKET, BY PURITY GRADE, 2018-2033 (USD THOUSAND)
TABLE 4647 ISRAEL AEROSPACE & DEFENSE INDUSTRY IN INDIUM MARKET, BY TYPE, 2018-2033 (USD THOUSAND)
TABLE 4648 ISRAEL INFRARED IMAGING SYSTEMS IN INDIUM MARKET, BY PURITY GRADE, 2018-2033 (USD THOUSAND)
TABLE 4649 ISRAEL RADAR & RF COMPONENTS IN INDIUM MARKET, BY PURITY GRADE, 2018-2033 (USD THOUSAND)
TABLE 4650 ISRAEL SATELLITE COMMUNICATION IN INDIUM MARKET, BY PURITY GRADE, 2018-2033 (USD THOUSAND)
TABLE 4651 ISRAEL MILITARY OPTOELECTRONICS IN INDIUM MARKET, BY PURITY GRADE, 2018-2033 (USD THOUSAND)
TABLE 4652 ISRAEL AVIONICS DISPLAYS IN INDIUM MARKET, BY PURITY GRADE, 2018-2033 (USD THOUSAND)
TABLE 4653 ISRAEL SPACECRAFT SOLAR PANELS IN INDIUM MARKET, BY PURITY GRADE, 2018-2033 (USD THOUSAND)
TABLE 4654 ISRAEL THERMAL MATERIALS IN INDIUM MARKET, BY PURITY GRADE, 2018-2033 (USD THOUSAND)
TABLE 4655 ISRAEL CRYOGENIC MATERIALS IN INDIUM MARKET, BY PURITY GRADE, 2018-2033 (USD THOUSAND)
TABLE 4656 ISRAEL MEDICAL DEVICE INDUSTRY IN INDIUM MARKET, BY TYPE, 2018-2033 (USD THOUSAND)
TABLE 4657 ISRAEL MEDICAL IMAGING SENSORS IN INDIUM MARKET, BY PURITY GRADE, 2018-2033 (USD THOUSAND)
TABLE 4658 ISRAEL DIAGNOSTIC EQUIPMENT DISPLAYS IN INDIUM MARKET, BY PURITY GRADE, 2018-2033 (USD THOUSAND)
TABLE 4659 ISRAEL ADVANCED DIAGNOSTIC INSTRUMENTS IN INDIUM MARKET, BY PURITY GRADE, 2018-2033 (USD THOUSAND)
TABLE 4660 ISRAEL LASER SURGICAL EQUIPMENT IN INDIUM MARKET, BY PURITY GRADE, 2018-2033 (USD THOUSAND)
TABLE 4661 ISRAEL BIOMEDICAL OPTICAL DEVICES IN INDIUM MARKET, BY PURITY GRADE, 2018-2033 (USD THOUSAND)
TABLE 4662 ISRAEL RADIATION DETECTION EQUIPMENT IN INDIUM MARKET, BY PURITY GRADE, 2018-2033 (USD THOUSAND)
TABLE 4663 ISRAEL INFRARED MEDICAL SENSORS IN INDIUM MARKET, BY PURITY GRADE, 2018-2033 (USD THOUSAND)
TABLE 4664 ISRAEL PHOTOTHERAPY DEVICES IN INDIUM MARKET, BY PURITY GRADE, 2018-2033 (USD THOUSAND)
TABLE 4665 ISRAEL INDUSTRIAL EQUIPMENT MANUFACTURING IN INDIUM MARKET, BY TYPE, 2018-2033 (USD THOUSAND)
TABLE 4666 ISRAEL INDUSTRIAL SENSORS IN INDIUM MARKET, BY PURITY GRADE, 2018-2033 (USD THOUSAND)
TABLE 4667 ISRAEL VACUUM DEPOSITION COATINGS IN INDIUM MARKET, BY PURITY GRADE, 2018-2033 (USD THOUSAND)
TABLE 4668 ISRAEL PRECISION OPTICAL COMPONENTS IN INDIUM MARKET, BY PURITY GRADE, 2018-2033 (USD THOUSAND)
TABLE 4669 ISRAEL THERMAL INTERFACE MATERIALS IN INDIUM MARKET, BY PURITY GRADE, 2018-2033 (USD THOUSAND)
TABLE 4670 ISRAEL INDUSTRIAL LASER SYSTEMS IN INDIUM MARKET, BY PURITY GRADE, 2018-2033 (USD THOUSAND)
TABLE 4671 ISRAEL INDUSTRIAL INFRARED DETECTORS IN INDIUM MARKET, BY PURITY GRADE, 2018-2033 (USD THOUSAND)
TABLE 4672 ISRAEL PRECISION MEASUREMENT EQUIPMENT IN INDIUM MARKET, BY PURITY GRADE, 2018-2033 (USD THOUSAND)
TABLE 4673 ISRAEL SPECIALTY ELECTRONIC COMPONENTS IN INDIUM MARKET, BY PURITY GRADE, 2018-2033 (USD THOUSAND)
TABLE 4674 ISRAEL OTHERS IN INDIUM MARKET, BY TYPE, 2018-2033 (USD THOUSAND)
TABLE 4675 ISRAEL ADVANCED MATERIALS MANUFACTURING IN INDIUM MARKET, BY PURITY GRADE, 2018-2033 (USD THOUSAND)
TABLE 4676 ISRAEL SPECIALTY ALLOY PRODUCTION IN INDIUM MARKET, BY PURITY GRADE, 2018-2033 (USD THOUSAND)
TABLE 4677 ISRAEL THERMAL MANAGEMENT MATERIALS IN INDIUM MARKET, BY PURITY GRADE, 2018-2033 (USD THOUSAND)
TABLE 4678 ISRAEL PRECISION SCIENTIFIC INSTRUMENTS IN INDIUM MARKET, BY PURITY GRADE, 2018-2033 (USD THOUSAND)
TABLE 4679 ISRAEL RESEARCH INSTITUTES & UNIVERSITIES IN INDIUM MARKET, BY PURITY GRADE, 2018-2033 (USD THOUSAND)
TABLE 4680 ISRAEL NUCLEAR INDUSTRY APPLICATIONS IN INDIUM MARKET, BY PURITY GRADE, 2018-2033 (USD THOUSAND)
TABLE 4681 ISRAEL SPECIALTY CHEMICAL PRODUCTION IN INDIUM MARKET, BY PURITY GRADE, 2018-2033 (USD THOUSAND)
TABLE 4682 ISRAEL DEFENSE RESEARCH LABORATORIES IN INDIUM MARKET, BY PURITY GRADE, 2018-2033 (USD THOUSAND)
TABLE 4683 ISRAEL CRYOGENIC EQUIPMENT MANUFACTURING IN INDIUM MARKET, BY PURITY GRADE, 2018-2033 (USD THOUSAND)
TABLE 4684 EGYPT INDIUM MARKET, BY PRODUCT TYPE, 2018-2033 (USD THOUSAND)
TABLE 4685 EGYPT INGOTS IN INDIUM MARKET, BY TYPE, 2018-2033 (USD THOUSAND)
TABLE 4686 EGYPT INDIUM MARKET, BY MATERIAL COMPOSITION, 2018-2033 (USD THOUSAND)
TABLE 4687 EGYPT INDIUM ALLOYS IN INDIUM MARKET, BY TYPE, 2018-2033 (USD THOUSAND)
TABLE 4688 EGYPT INDIUM COMPOUNDS IN INDIUM MARKET, BY TYPE, 2018-2033 (USD THOUSAND)
TABLE 4689 EGYPT INDIUM MARKET, BY PURITY GRADE, 2018-2033 (USD THOUSAND)
TABLE 4690 EGYPT INDIUM MARKET, BY EXTRACTION SOURCE, 2018-2033 (USD THOUSAND)
TABLE 4691 EGYPT PRIMARY PRODUCTION IN INDIUM MARKET, BY TYPE, 2018-2033 (USD THOUSAND)
TABLE 4692 EGYPT SECONDARY PRODUCTION IN INDIUM MARKET, BY TYPE, 2018-2033 (USD THOUSAND)
TABLE 4693 EGYPT INDIUM MARKET, BY DISTRIBUTION CHANNEL, 2018-2033 (USD THOUSAND)
TABLE 4694 EGYPT INDIUM MARKET, BY TECHNOLOGY PLATFORM, 2018-2033 (USD THOUSAND)
TABLE 4695 EGYPT INDIUM MARKET, BY END-USER INDUSTRY, 2018-2033 (USD THOUSAND)
TABLE 4696 EGYPT CONSUMER ELECTRONICS INDUSTRY IN INDIUM MARKET, BY TYPE, 2018-2033 (USD THOUSAND)
TABLE 4697 EGYPT FLAT PANEL DISPLAYS (LCD/OLED/LED) IN INDIUM MARKET, BY PURITY GRADE, 2018-2033 (USD THOUSAND)
TABLE 4698 EGYPT TRANSPARENT CONDUCTIVE COATINGS (ITO) IN INDIUM MARKET, BY PURITY GRADE, 2018-2033 (USD THOUSAND)
TABLE 4699 EGYPT TOUCHSCREEN DISPLAYS IN INDIUM MARKET, BY PURITY GRADE, 2018-2033 (USD THOUSAND)
TABLE 4700 EGYPT FLEXIBLE DISPLAYS & ELECTRONICS IN INDIUM MARKET, BY PURITY GRADE, 2018-2033 (USD THOUSAND)
TABLE 4701 EGYPT WEARABLE ELECTRONICS DEVICES IN INDIUM MARKET, BY PURITY GRADE, 2018-2033 (USD THOUSAND)
TABLE 4702 EGYPT CAMERA & OPTICAL SENSORS IN INDIUM MARKET, BY PURITY GRADE, 2018-2033 (USD THOUSAND)
TABLE 4703 EGYPT MINI-LED BACKLIGHTING IN INDIUM MARKET, BY PURITY GRADE, 2018-2033 (USD THOUSAND)
TABLE 4704 EGYPT MICRO-LED DISPLAYS IN INDIUM MARKET, BY PURITY GRADE, 2018-2033 (USD THOUSAND)
TABLE 4705 EGYPT DISPLAY PANEL INDUSTRY IN INDIUM MARKET, BY TYPE, 2018-2033 (USD THOUSAND)
TABLE 4706 EGYPT LCD PANEL MANUFACTURING IN INDIUM MARKET, BY PURITY GRADE, 2018-2033 (USD THOUSAND)
TABLE 4707 EGYPT OLED PANEL MANUFACTURING IN INDIUM MARKET, BY PURITY GRADE, 2018-2033 (USD THOUSAND)
TABLE 4708 EGYPT DISPLAY PANEL MANUFACTURING IN INDIUM MARKET, BY PURITY GRADE, 2018-2033 (USD THOUSAND)
TABLE 4709 EGYPT TOUCH PANEL SENSORS IN INDIUM MARKET, BY PURITY GRADE, 2018-2033 (USD THOUSAND)
TABLE 4710 EGYPT TRANSPARENT CONDUCTIVE FILMS IN INDIUM MARKET, BY PURITY GRADE, 2018-2033 (USD THOUSAND)
TABLE 4711 EGYPT FLEXIBLE & FOLDABLE DISPLAYS IN INDIUM MARKET, BY PURITY GRADE, 2018-2033 (USD THOUSAND)
TABLE 4712 EGYPT AR/VR DISPLAYS IN INDIUM MARKET, BY PURITY GRADE, 2018-2033 (USD THOUSAND)
TABLE 4713 EGYPT MICRODISPLAY DEVICES IN INDIUM MARKET, BY PURITY GRADE, 2018-2033 (USD THOUSAND)
TABLE 4714 EGYPT BACKPLANE COATINGS IN INDIUM MARKET, BY PURITY GRADE, 2018-2033 (USD THOUSAND)
TABLE 4715 EGYPT SEMICONDUCTOR INDUSTRY IN INDIUM MARKET, BY TYPE, 2018-2033 (USD THOUSAND)
TABLE 4716 EGYPT III-V COMPOUND SEMICONDUCTORS IN INDIUM MARKET, BY PURITY GRADE, 2018-2033 (USD THOUSAND)
TABLE 4717 EGYPT HIGH-FREQUENCY RF COMPONENTS IN INDIUM MARKET, BY PURITY GRADE, 2018-2033 (USD THOUSAND)
TABLE 4718 EGYPT SEMICONDUCTOR SUBSTRATES & EPITAXY IN INDIUM MARKET, BY PURITY GRADE, 2018-2033 (USD THOUSAND)
TABLE 4719 EGYPT LASER DIODES IN INDIUM MARKET, BY PURITY GRADE, 2018-2033 (USD THOUSAND)
TABLE 4720 EGYPT PHOTODETECTORS IN INDIUM MARKET, BY PURITY GRADE, 2018-2033 (USD THOUSAND)
TABLE 4721 EGYPT HIGH-SPEED OPTOELECTRONICS IN INDIUM MARKET, BY PURITY GRADE, 2018-2033 (USD THOUSAND)
TABLE 4722 EGYPT INFRARED DETECTORS IN INDIUM MARKET, BY PURITY GRADE, 2018-2033 (USD THOUSAND)
TABLE 4723 EGYPT INTEGRATED PHOTONIC CIRCUITS IN INDIUM MARKET, BY PURITY GRADE, 2018-2033 (USD THOUSAND)
TABLE 4724 EGYPT SOLAR PHOTOVOLTAIC INDUSTRY IN INDIUM MARKET, BY TYPE, 2018-2033 (USD THOUSAND)
TABLE 4725 EGYPT CIGS THIN-FILM SOLAR CELLS IN INDIUM MARKET, BY PURITY GRADE, 2018-2033 (USD THOUSAND)
TABLE 4726 EGYPTHIGH-EFFICIENCY MODULES IN INDIUM MARKET, BY PURITY GRADE, 2018-2033 (USD THOUSAND)
TABLE 4727 EGYPT THIN-FILM COATINGS IN INDIUM MARKET, BY PURITY GRADE, 2018-2033 (USD THOUSAND)
TABLE 4728 EGYPT TRANSPARENT ELECTRODES IN INDIUM MARKET, BY PURITY GRADE, 2018-2033 (USD THOUSAND)
TABLE 4729 EGYPT BIPV IN INDIUM MARKET, BY PURITY GRADE, 2018-2033 (USD THOUSAND)
TABLE 4730 EGYPT FLEXIBLE SOLAR PANELS IN INDIUM MARKET, BY PURITY GRADE, 2018-2033 (USD THOUSAND)
TABLE 4731 EGYPT PORTABLE SOLAR SYSTEMS IN INDIUM MARKET, BY PURITY GRADE, 2018-2033 (USD THOUSAND)
TABLE 4732 EGYPT CONCENTRATED PV IN INDIUM MARKET, BY PURITY GRADE, 2018-2033 (USD THOUSAND)
TABLE 4733 EGYPT AUTOMOTIVE INDUSTRY IN INDIUM MARKET, BY TYPE, 2018-2033 (USD THOUSAND)
TABLE 4734 EGYPT AUTOMOTIVE DISPLAY PANELS IN INDIUM MARKET, BY PURITY GRADE, 2018-2033 (USD THOUSAND)
TABLE 4735 EGYPTADAS SENSORS IN INDIUM MARKET, BY PURITY GRADE, 2018-2033 (USD THOUSAND)
TABLE 4736 EGYPT VEHICLE CAMERA MODULES IN INDIUM MARKET, BY PURITY GRADE, 2018-2033 (USD THOUSAND)
TABLE 4737 EGYPT AUTOMOTIVE OPTOELECTRONICS IN INDIUM MARKET, BY PURITY GRADE, 2018-2033 (USD THOUSAND)
TABLE 4738 EGYPT POWER ELECTRONICS IN INDIUM MARKET, BY PURITY GRADE, 2018-2033 (USD THOUSAND)
TABLE 4739 EGYPT TOUCHSCREEN INTERFACES IN INDIUM MARKET, BY PURITY GRADE, 2018-2033 (USD THOUSAND)
TABLE 4740 EGYPT INFRARED SENSORS IN INDIUM MARKET, BY PURITY GRADE, 2018-2033 (USD THOUSAND)
TABLE 4741 EGYPT SMART LIGHTING IN INDIUM MARKET, BY PURITY GRADE, 2018-2033 (USD THOUSAND)
TABLE 4742 EGYPT TELECOMMUNICATION EQUIPMENT INDUSTRY IN INDIUM MARKET, BY TYPE, 2018-2033 (USD THOUSAND)
TABLE 4743 EGYPT OPTICAL TRANSCEIVERS IN INDIUM MARKET, BY PURITY GRADE, 2018-2033 (USD THOUSAND)
TABLE 4744 EGYPT RF POWER AMPLIFIERS IN INDIUM MARKET, BY PURITY GRADE, 2018-2033 (USD THOUSAND)
TABLE 4745 EGYPT HIGH-FREQUENCY COMMUNICATION CHIPS IN INDIUM MARKET, BY PURITY GRADE, 2018-2033 (USD THOUSAND)
TABLE 4746 EGYPT FIBER-OPTIC COMMUNICATION LASERS IN INDIUM MARKET, BY PURITY GRADE, 2018-2033 (USD THOUSAND)
TABLE 4747 EGYPT PHOTODETECTORS FOR OPTICAL NETWORKS IN INDIUM MARKET, BY PURITY GRADE, 2018-2033 (USD THOUSAND)
TABLE 4748 EGYPT 5G INFRASTRUCTURE COMPONENTS IN INDIUM MARKET, BY PURITY GRADE, 2018-2033 (USD THOUSAND)
TABLE 4749 EGYPT OPTICAL NETWORK SWITCHING DEVICES IN INDIUM MARKET, BY PURITY GRADE, 2018-2033 (USD THOUSAND)
TABLE 4750 EGYPT SATELLITE COMMUNICATION MODULES IN INDIUM MARKET, BY PURITY GRADE, 2018-2033 (USD THOUSAND)
TABLE 4751 EGYPT OPTICAL & PHOTONICS INDUSTRY IN INDIUM MARKET, BY TYPE, 2018-2033 (USD THOUSAND)
TABLE 4752 EGYPT OPTICAL COATINGS IN INDIUM MARKET, BY PURITY GRADE, 2018-2033 (USD THOUSAND)
TABLE 4753 EGYPT FIBER OPTIC COMPONENTS IN INDIUM MARKET, BY PURITY GRADE, 2018-2033 (USD THOUSAND)
TABLE 4754 EGYPT LASER COMPONENTS IN INDIUM MARKET, BY PURITY GRADE, 2018-2033 (USD THOUSAND)
TABLE 4755 EGYPT OPTICAL SENSORS IN INDIUM MARKET, BY PURITY GRADE, 2018-2033 (USD THOUSAND)
TABLE 4756 EGYPT INFRARED OPTICS IN INDIUM MARKET, BY PURITY GRADE, 2018-2033 (USD THOUSAND)
TABLE 4757 EGYPT PICS IN INDIUM MARKET, BY PURITY GRADE, 2018-2033 (USD THOUSAND)
TABLE 4758 EGYPT MIRRORS IN INDIUM MARKET, BY PURITY GRADE, 2018-2033 (USD THOUSAND)
TABLE 4759 EGYPT SPECTROSCOPY IN INDIUM MARKET, BY PURITY GRADE, 2018-2033 (USD THOUSAND)
TABLE 4760 EGYPT AEROSPACE & DEFENSE INDUSTRY IN INDIUM MARKET, BY TYPE, 2018-2033 (USD THOUSAND)
TABLE 4761 EGYPT INFRARED IMAGING SYSTEMS IN INDIUM MARKET, BY PURITY GRADE, 2018-2033 (USD THOUSAND)
TABLE 4762 EGYPT RADAR & RF COMPONENTS IN INDIUM MARKET, BY PURITY GRADE, 2018-2033 (USD THOUSAND)
TABLE 4763 EGYPT SATELLITE COMMUNICATION IN INDIUM MARKET, BY PURITY GRADE, 2018-2033 (USD THOUSAND)
TABLE 4764 EGYPT MILITARY OPTOELECTRONICS IN INDIUM MARKET, BY PURITY GRADE, 2018-2033 (USD THOUSAND)
TABLE 4765 EGYPT AVIONICS DISPLAYS IN INDIUM MARKET, BY PURITY GRADE, 2018-2033 (USD THOUSAND)
TABLE 4766 EGYPT SPACECRAFT SOLAR PANELS IN INDIUM MARKET, BY PURITY GRADE, 2018-2033 (USD THOUSAND)
TABLE 4767 EGYPT THERMAL MATERIALS IN INDIUM MARKET, BY PURITY GRADE, 2018-2033 (USD THOUSAND)
TABLE 4768 EGYPT CRYOGENIC MATERIALS IN INDIUM MARKET, BY PURITY GRADE, 2018-2033 (USD THOUSAND)
TABLE 4769 EGYPT MEDICAL DEVICE INDUSTRY IN INDIUM MARKET, BY TYPE, 2018-2033 (USD THOUSAND)
TABLE 4770 EGYPT MEDICAL IMAGING SENSORS IN INDIUM MARKET, BY PURITY GRADE, 2018-2033 (USD THOUSAND)
TABLE 4771 EGYPT DIAGNOSTIC EQUIPMENT DISPLAYS IN INDIUM MARKET, BY PURITY GRADE, 2018-2033 (USD THOUSAND)
TABLE 4772 EGYPT ADVANCED DIAGNOSTIC INSTRUMENTS IN INDIUM MARKET, BY PURITY GRADE, 2018-2033 (USD THOUSAND)
TABLE 4773 EGYPT LASER SURGICAL EQUIPMENT IN INDIUM MARKET, BY PURITY GRADE, 2018-2033 (USD THOUSAND)
TABLE 4774 EGYPT BIOMEDICAL OPTICAL DEVICES IN INDIUM MARKET, BY PURITY GRADE, 2018-2033 (USD THOUSAND)
TABLE 4775 EGYPT RADIATION DETECTION EQUIPMENT IN INDIUM MARKET, BY PURITY GRADE, 2018-2033 (USD THOUSAND)
TABLE 4776 EGYPT INFRARED MEDICAL SENSORS IN INDIUM MARKET, BY PURITY GRADE, 2018-2033 (USD THOUSAND)
TABLE 4777 EGYPT PHOTOTHERAPY DEVICES IN INDIUM MARKET, BY PURITY GRADE, 2018-2033 (USD THOUSAND)
TABLE 4778 EGYPT INDUSTRIAL EQUIPMENT MANUFACTURING IN INDIUM MARKET, BY TYPE, 2018-2033 (USD THOUSAND)
TABLE 4779 EGYPT INDUSTRIAL SENSORS IN INDIUM MARKET, BY PURITY GRADE, 2018-2033 (USD THOUSAND)
TABLE 4780 EGYPT VACUUM DEPOSITION COATINGS IN INDIUM MARKET, BY PURITY GRADE, 2018-2033 (USD THOUSAND)
TABLE 4781 EGYPT PRECISION OPTICAL COMPONENTS IN INDIUM MARKET, BY PURITY GRADE, 2018-2033 (USD THOUSAND)
TABLE 4782 EGYPT THERMAL INTERFACE MATERIALS IN INDIUM MARKET, BY PURITY GRADE, 2018-2033 (USD THOUSAND)
TABLE 4783 EGYPT INDUSTRIAL LASER SYSTEMS IN INDIUM MARKET, BY PURITY GRADE, 2018-2033 (USD THOUSAND)
TABLE 4784 EGYPT INDUSTRIAL INFRARED DETECTORS IN INDIUM MARKET, BY PURITY GRADE, 2018-2033 (USD THOUSAND)
TABLE 4785 EGYPT PRECISION MEASUREMENT EQUIPMENT IN INDIUM MARKET, BY PURITY GRADE, 2018-2033 (USD THOUSAND)
TABLE 4786 EGYPT SPECIALTY ELECTRONIC COMPONENTS IN INDIUM MARKET, BY PURITY GRADE, 2018-2033 (USD THOUSAND)
TABLE 4787 EGYPT OTHERS IN INDIUM MARKET, BY TYPE, 2018-2033 (USD THOUSAND)
TABLE 4788 EGYPT ADVANCED MATERIALS MANUFACTURING IN INDIUM MARKET, BY PURITY GRADE, 2018-2033 (USD THOUSAND)
TABLE 4789 EGYPT SPECIALTY ALLOY PRODUCTION IN INDIUM MARKET, BY PURITY GRADE, 2018-2033 (USD THOUSAND)
TABLE 4790 EGYPT THERMAL MANAGEMENT MATERIALS IN INDIUM MARKET, BY PURITY GRADE, 2018-2033 (USD THOUSAND)
TABLE 4791 EGYPT PRECISION SCIENTIFIC INSTRUMENTS IN INDIUM MARKET, BY PURITY GRADE, 2018-2033 (USD THOUSAND)
TABLE 4792 EGYPT RESEARCH INSTITUTES & UNIVERSITIES IN INDIUM MARKET, BY PURITY GRADE, 2018-2033 (USD THOUSAND)
TABLE 4793 EGYPT NUCLEAR INDUSTRY APPLICATIONS IN INDIUM MARKET, BY PURITY GRADE, 2018-2033 (USD THOUSAND)
TABLE 4794 EGYPT SPECIALTY CHEMICAL PRODUCTION IN INDIUM MARKET, BY PURITY GRADE, 2018-2033 (USD THOUSAND)
TABLE 4795 EGYPT DEFENSE RESEARCH LABORATORIES IN INDIUM MARKET, BY PURITY GRADE, 2018-2033 (USD THOUSAND)
TABLE 4796 EGYPT CRYOGENIC EQUIPMENT MANUFACTURING IN INDIUM MARKET, BY PURITY GRADE, 2018-2033 (USD THOUSAND)
TABLE 4797 QATAR INDIUM MARKET, BY PRODUCT TYPE, 2018-2033 (USD THOUSAND)
TABLE 4798 QATAR INGOTS IN INDIUM MARKET, BY TYPE, 2018-2033 (USD THOUSAND)
TABLE 4799 QATAR INDIUM MARKET, BY MATERIAL COMPOSITION, 2018-2033 (USD THOUSAND)
TABLE 4800 QATAR INDIUM ALLOYS IN INDIUM MARKET, BY TYPE, 2018-2033 (USD THOUSAND)
TABLE 4801 QATAR INDIUM COMPOUNDS IN INDIUM MARKET, BY TYPE, 2018-2033 (USD THOUSAND)
TABLE 4802 QATAR INDIUM MARKET, BY PURITY GRADE, 2018-2033 (USD THOUSAND)
TABLE 4803 QATAR INDIUM MARKET, BY EXTRACTION SOURCE, 2018-2033 (USD THOUSAND)
TABLE 4804 QATAR PRIMARY PRODUCTION IN INDIUM MARKET, BY TYPE, 2018-2033 (USD THOUSAND)
TABLE 4805 QATAR SECONDARY PRODUCTION IN INDIUM MARKET, BY TYPE, 2018-2033 (USD THOUSAND)
TABLE 4806 QATAR INDIUM MARKET, BY DISTRIBUTION CHANNEL, 2018-2033 (USD THOUSAND)
TABLE 4807 QATAR INDIUM MARKET, BY TECHNOLOGY PLATFORM, 2018-2033 (USD THOUSAND)
TABLE 4808 QATAR INDIUM MARKET, BY END-USER INDUSTRY, 2018-2033 (USD THOUSAND)
TABLE 4809 QATAR CONSUMER ELECTRONICS INDUSTRY IN INDIUM MARKET, BY TYPE, 2018-2033 (USD THOUSAND)
TABLE 4810 QATAR FLAT PANEL DISPLAYS (LCD/OLED/LED) IN INDIUM MARKET, BY PURITY GRADE, 2018-2033 (USD THOUSAND)
TABLE 4811 QATAR TRANSPARENT CONDUCTIVE COATINGS (ITO) IN INDIUM MARKET, BY PURITY GRADE, 2018-2033 (USD THOUSAND)
TABLE 4812 QATAR TOUCHSCREEN DISPLAYS IN INDIUM MARKET, BY PURITY GRADE, 2018-2033 (USD THOUSAND)
TABLE 4813 QATAR FLEXIBLE DISPLAYS & ELECTRONICS IN INDIUM MARKET, BY PURITY GRADE, 2018-2033 (USD THOUSAND)
TABLE 4814 QATAR WEARABLE ELECTRONICS DEVICES IN INDIUM MARKET, BY PURITY GRADE, 2018-2033 (USD THOUSAND)
TABLE 4815 QATAR CAMERA & OPTICAL SENSORS IN INDIUM MARKET, BY PURITY GRADE, 2018-2033 (USD THOUSAND)
TABLE 4816 QATAR MINI-LED BACKLIGHTING IN INDIUM MARKET, BY PURITY GRADE, 2018-2033 (USD THOUSAND)
TABLE 4817 QATAR MICRO-LED DISPLAYS IN INDIUM MARKET, BY PURITY GRADE, 2018-2033 (USD THOUSAND)
TABLE 4818 QATAR DISPLAY PANEL INDUSTRY IN INDIUM MARKET, BY TYPE, 2018-2033 (USD THOUSAND)
TABLE 4819 QATAR LCD PANEL MANUFACTURING IN INDIUM MARKET, BY PURITY GRADE, 2018-2033 (USD THOUSAND)
TABLE 4820 QATAR OLED PANEL MANUFACTURING IN INDIUM MARKET, BY PURITY GRADE, 2018-2033 (USD THOUSAND)
TABLE 4821 QATAR DISPLAY PANEL MANUFACTURING IN INDIUM MARKET, BY PURITY GRADE, 2018-2033 (USD THOUSAND)
TABLE 4822 QATAR TOUCH PANEL SENSORS IN INDIUM MARKET, BY PURITY GRADE, 2018-2033 (USD THOUSAND)
TABLE 4823 QATAR TRANSPARENT CONDUCTIVE FILMS IN INDIUM MARKET, BY PURITY GRADE, 2018-2033 (USD THOUSAND)
TABLE 4824 QATAR FLEXIBLE & FOLDABLE DISPLAYS IN INDIUM MARKET, BY PURITY GRADE, 2018-2033 (USD THOUSAND)
TABLE 4825 QATAR AR/VR DISPLAYS IN INDIUM MARKET, BY PURITY GRADE, 2018-2033 (USD THOUSAND)
TABLE 4826 QATAR MICRODISPLAY DEVICES IN INDIUM MARKET, BY PURITY GRADE, 2018-2033 (USD THOUSAND)
TABLE 4827 QATAR BACKPLANE COATINGS IN INDIUM MARKET, BY PURITY GRADE, 2018-2033 (USD THOUSAND)
TABLE 4828 QATAR SEMICONDUCTOR INDUSTRY IN INDIUM MARKET, BY TYPE, 2018-2033 (USD THOUSAND)
TABLE 4829 QATAR III-V COMPOUND SEMICONDUCTORS IN INDIUM MARKET, BY PURITY GRADE, 2018-2033 (USD THOUSAND)
TABLE 4830 QATAR HIGH-FREQUENCY RF COMPONENTS IN INDIUM MARKET, BY PURITY GRADE, 2018-2033 (USD THOUSAND)
TABLE 4831 QATAR SEMICONDUCTOR SUBSTRATES & EPITAXY IN INDIUM MARKET, BY PURITY GRADE, 2018-2033 (USD THOUSAND)
TABLE 4832 QATAR LASER DIODES IN INDIUM MARKET, BY PURITY GRADE, 2018-2033 (USD THOUSAND)
TABLE 4833 QATAR PHOTODETECTORS IN INDIUM MARKET, BY PURITY GRADE, 2018-2033 (USD THOUSAND)
TABLE 4834 QATAR HIGH-SPEED OPTOELECTRONICS IN INDIUM MARKET, BY PURITY GRADE, 2018-2033 (USD THOUSAND)
TABLE 4835 QATAR INFRARED DETECTORS IN INDIUM MARKET, BY PURITY GRADE, 2018-2033 (USD THOUSAND)
TABLE 4836 QATAR INTEGRATED PHOTONIC CIRCUITS IN INDIUM MARKET, BY PURITY GRADE, 2018-2033 (USD THOUSAND)
TABLE 4837 QATAR SOLAR PHOTOVOLTAIC INDUSTRY IN INDIUM MARKET, BY TYPE, 2018-2033 (USD THOUSAND)
TABLE 4838 QATAR CIGS THIN-FILM SOLAR CELLS IN INDIUM MARKET, BY PURITY GRADE, 2018-2033 (USD THOUSAND)
TABLE 4839 QATARHIGH-EFFICIENCY MODULES IN INDIUM MARKET, BY PURITY GRADE, 2018-2033 (USD THOUSAND)
TABLE 4840 QATAR THIN-FILM COATINGS IN INDIUM MARKET, BY PURITY GRADE, 2018-2033 (USD THOUSAND)
TABLE 4841 QATAR TRANSPARENT ELECTRODES IN INDIUM MARKET, BY PURITY GRADE, 2018-2033 (USD THOUSAND)
TABLE 4842 QATAR BIPV IN INDIUM MARKET, BY PURITY GRADE, 2018-2033 (USD THOUSAND)
TABLE 4843 QATAR FLEXIBLE SOLAR PANELS IN INDIUM MARKET, BY PURITY GRADE, 2018-2033 (USD THOUSAND)
TABLE 4844 QATAR PORTABLE SOLAR SYSTEMS IN INDIUM MARKET, BY PURITY GRADE, 2018-2033 (USD THOUSAND)
TABLE 4845 QATAR CONCENTRATED PV IN INDIUM MARKET, BY PURITY GRADE, 2018-2033 (USD THOUSAND)
TABLE 4846 QATAR AUTOMOTIVE INDUSTRY IN INDIUM MARKET, BY TYPE, 2018-2033 (USD THOUSAND)
TABLE 4847 QATAR AUTOMOTIVE DISPLAY PANELS IN INDIUM MARKET, BY PURITY GRADE, 2018-2033 (USD THOUSAND)
TABLE 4848 QATARADAS SENSORS IN INDIUM MARKET, BY PURITY GRADE, 2018-2033 (USD THOUSAND)
TABLE 4849 QATAR VEHICLE CAMERA MODULES IN INDIUM MARKET, BY PURITY GRADE, 2018-2033 (USD THOUSAND)
TABLE 4850 QATAR AUTOMOTIVE OPTOELECTRONICS IN INDIUM MARKET, BY PURITY GRADE, 2018-2033 (USD THOUSAND)
TABLE 4851 QATAR POWER ELECTRONICS IN INDIUM MARKET, BY PURITY GRADE, 2018-2033 (USD THOUSAND)
TABLE 4852 QATAR TOUCHSCREEN INTERFACES IN INDIUM MARKET, BY PURITY GRADE, 2018-2033 (USD THOUSAND)
TABLE 4853 QATAR INFRARED SENSORS IN INDIUM MARKET, BY PURITY GRADE, 2018-2033 (USD THOUSAND)
TABLE 4854 QATAR SMART LIGHTING IN INDIUM MARKET, BY PURITY GRADE, 2018-2033 (USD THOUSAND)
TABLE 4855 QATAR TELECOMMUNICATION EQUIPMENT INDUSTRY IN INDIUM MARKET, BY TYPE, 2018-2033 (USD THOUSAND)
TABLE 4856 QATAR OPTICAL TRANSCEIVERS IN INDIUM MARKET, BY PURITY GRADE, 2018-2033 (USD THOUSAND)
TABLE 4857 QATAR RF POWER AMPLIFIERS IN INDIUM MARKET, BY PURITY GRADE, 2018-2033 (USD THOUSAND)
TABLE 4858 QATAR HIGH-FREQUENCY COMMUNICATION CHIPS IN INDIUM MARKET, BY PURITY GRADE, 2018-2033 (USD THOUSAND)
TABLE 4859 QATAR FIBER-OPTIC COMMUNICATION LASERS IN INDIUM MARKET, BY PURITY GRADE, 2018-2033 (USD THOUSAND)
TABLE 4860 QATAR PHOTODETECTORS FOR OPTICAL NETWORKS IN INDIUM MARKET, BY PURITY GRADE, 2018-2033 (USD THOUSAND)
TABLE 4861 QATAR 5G INFRASTRUCTURE COMPONENTS IN INDIUM MARKET, BY PURITY GRADE, 2018-2033 (USD THOUSAND)
TABLE 4862 QATAR OPTICAL NETWORK SWITCHING DEVICES IN INDIUM MARKET, BY PURITY GRADE, 2018-2033 (USD THOUSAND)
TABLE 4863 QATAR SATELLITE COMMUNICATION MODULES IN INDIUM MARKET, BY PURITY GRADE, 2018-2033 (USD THOUSAND)
TABLE 4864 QATAR OPTICAL & PHOTONICS INDUSTRY IN INDIUM MARKET, BY TYPE, 2018-2033 (USD THOUSAND)
TABLE 4865 QATAR OPTICAL COATINGS IN INDIUM MARKET, BY PURITY GRADE, 2018-2033 (USD THOUSAND)
TABLE 4866 QATAR FIBER OPTIC COMPONENTS IN INDIUM MARKET, BY PURITY GRADE, 2018-2033 (USD THOUSAND)
TABLE 4867 QATAR LASER COMPONENTS IN INDIUM MARKET, BY PURITY GRADE, 2018-2033 (USD THOUSAND)
TABLE 4868 QATAR OPTICAL SENSORS IN INDIUM MARKET, BY PURITY GRADE, 2018-2033 (USD THOUSAND)
TABLE 4869 QATAR INFRARED OPTICS IN INDIUM MARKET, BY PURITY GRADE, 2018-2033 (USD THOUSAND)
TABLE 4870 QATAR PICS IN INDIUM MARKET, BY PURITY GRADE, 2018-2033 (USD THOUSAND)
TABLE 4871 QATAR MIRRORS IN INDIUM MARKET, BY PURITY GRADE, 2018-2033 (USD THOUSAND)
TABLE 4872 QATAR SPECTROSCOPY IN INDIUM MARKET, BY PURITY GRADE, 2018-2033 (USD THOUSAND)
TABLE 4873 QATAR AEROSPACE & DEFENSE INDUSTRY IN INDIUM MARKET, BY TYPE, 2018-2033 (USD THOUSAND)
TABLE 4874 QATAR INFRARED IMAGING SYSTEMS IN INDIUM MARKET, BY PURITY GRADE, 2018-2033 (USD THOUSAND)
TABLE 4875 QATAR RADAR & RF COMPONENTS IN INDIUM MARKET, BY PURITY GRADE, 2018-2033 (USD THOUSAND)
TABLE 4876 QATAR SATELLITE COMMUNICATION IN INDIUM MARKET, BY PURITY GRADE, 2018-2033 (USD THOUSAND)
TABLE 4877 QATAR MILITARY OPTOELECTRONICS IN INDIUM MARKET, BY PURITY GRADE, 2018-2033 (USD THOUSAND)
TABLE 4878 QATAR AVIONICS DISPLAYS IN INDIUM MARKET, BY PURITY GRADE, 2018-2033 (USD THOUSAND)
TABLE 4879 QATAR SPACECRAFT SOLAR PANELS IN INDIUM MARKET, BY PURITY GRADE, 2018-2033 (USD THOUSAND)
TABLE 4880 QATAR THERMAL MATERIALS IN INDIUM MARKET, BY PURITY GRADE, 2018-2033 (USD THOUSAND)
TABLE 4881 QATAR CRYOGENIC MATERIALS IN INDIUM MARKET, BY PURITY GRADE, 2018-2033 (USD THOUSAND)
TABLE 4882 QATAR MEDICAL DEVICE INDUSTRY IN INDIUM MARKET, BY TYPE, 2018-2033 (USD THOUSAND)
TABLE 4883 QATAR MEDICAL IMAGING SENSORS IN INDIUM MARKET, BY PURITY GRADE, 2018-2033 (USD THOUSAND)
TABLE 4884 QATAR DIAGNOSTIC EQUIPMENT DISPLAYS IN INDIUM MARKET, BY PURITY GRADE, 2018-2033 (USD THOUSAND)
TABLE 4885 QATAR ADVANCED DIAGNOSTIC INSTRUMENTS IN INDIUM MARKET, BY PURITY GRADE, 2018-2033 (USD THOUSAND)
TABLE 4886 QATAR LASER SURGICAL EQUIPMENT IN INDIUM MARKET, BY PURITY GRADE, 2018-2033 (USD THOUSAND)
TABLE 4887 QATAR BIOMEDICAL OPTICAL DEVICES IN INDIUM MARKET, BY PURITY GRADE, 2018-2033 (USD THOUSAND)
TABLE 4888 QATAR RADIATION DETECTION EQUIPMENT IN INDIUM MARKET, BY PURITY GRADE, 2018-2033 (USD THOUSAND)
TABLE 4889 QATAR INFRARED MEDICAL SENSORS IN INDIUM MARKET, BY PURITY GRADE, 2018-2033 (USD THOUSAND)
TABLE 4890 QATAR PHOTOTHERAPY DEVICES IN INDIUM MARKET, BY PURITY GRADE, 2018-2033 (USD THOUSAND)
TABLE 4891 QATAR INDUSTRIAL EQUIPMENT MANUFACTURING IN INDIUM MARKET, BY TYPE, 2018-2033 (USD THOUSAND)
TABLE 4892 QATAR INDUSTRIAL SENSORS IN INDIUM MARKET, BY PURITY GRADE, 2018-2033 (USD THOUSAND)
TABLE 4893 QATAR VACUUM DEPOSITION COATINGS IN INDIUM MARKET, BY PURITY GRADE, 2018-2033 (USD THOUSAND)
TABLE 4894 QATAR PRECISION OPTICAL COMPONENTS IN INDIUM MARKET, BY PURITY GRADE, 2018-2033 (USD THOUSAND)
TABLE 4895 QATAR THERMAL INTERFACE MATERIALS IN INDIUM MARKET, BY PURITY GRADE, 2018-2033 (USD THOUSAND)
TABLE 4896 QATAR INDUSTRIAL LASER SYSTEMS IN INDIUM MARKET, BY PURITY GRADE, 2018-2033 (USD THOUSAND)
TABLE 4897 QATAR INDUSTRIAL INFRARED DETECTORS IN INDIUM MARKET, BY PURITY GRADE, 2018-2033 (USD THOUSAND)
TABLE 4898 QATAR PRECISION MEASUREMENT EQUIPMENT IN INDIUM MARKET, BY PURITY GRADE, 2018-2033 (USD THOUSAND)
TABLE 4899 QATAR SPECIALTY ELECTRONIC COMPONENTS IN INDIUM MARKET, BY PURITY GRADE, 2018-2033 (USD THOUSAND)
TABLE 4900 QATAR OTHERS IN INDIUM MARKET, BY TYPE, 2018-2033 (USD THOUSAND)
TABLE 4901 QATAR ADVANCED MATERIALS MANUFACTURING IN INDIUM MARKET, BY PURITY GRADE, 2018-2033 (USD THOUSAND)
TABLE 4902 QATAR SPECIALTY ALLOY PRODUCTION IN INDIUM MARKET, BY PURITY GRADE, 2018-2033 (USD THOUSAND)
TABLE 4903 QATAR THERMAL MANAGEMENT MATERIALS IN INDIUM MARKET, BY PURITY GRADE, 2018-2033 (USD THOUSAND)
TABLE 4904 QATAR PRECISION SCIENTIFIC INSTRUMENTS IN INDIUM MARKET, BY PURITY GRADE, 2018-2033 (USD THOUSAND)
TABLE 4905 QATAR RESEARCH INSTITUTES & UNIVERSITIES IN INDIUM MARKET, BY PURITY GRADE, 2018-2033 (USD THOUSAND)
TABLE 4906 QATAR NUCLEAR INDUSTRY APPLICATIONS IN INDIUM MARKET, BY PURITY GRADE, 2018-2033 (USD THOUSAND)
TABLE 4907 QATAR SPECIALTY CHEMICAL PRODUCTION IN INDIUM MARKET, BY PURITY GRADE, 2018-2033 (USD THOUSAND)
TABLE 4908 QATAR DEFENSE RESEARCH LABORATORIES IN INDIUM MARKET, BY PURITY GRADE, 2018-2033 (USD THOUSAND)
TABLE 4909 QATAR CRYOGENIC EQUIPMENT MANUFACTURING IN INDIUM MARKET, BY PURITY GRADE, 2018-2033 (USD THOUSAND)
TABLE 4910 KUWAIT INDIUM MARKET, BY PRODUCT TYPE, 2018-2033 (USD THOUSAND)
TABLE 4911 KUWAIT INGOTS IN INDIUM MARKET, BY TYPE, 2018-2033 (USD THOUSAND)
TABLE 4912 KUWAIT INDIUM MARKET, BY MATERIAL COMPOSITION, 2018-2033 (USD THOUSAND)
TABLE 4913 KUWAIT INDIUM ALLOYS IN INDIUM MARKET, BY TYPE, 2018-2033 (USD THOUSAND)
TABLE 4914 KUWAIT INDIUM COMPOUNDS IN INDIUM MARKET, BY TYPE, 2018-2033 (USD THOUSAND)
TABLE 4915 KUWAIT INDIUM MARKET, BY PURITY GRADE, 2018-2033 (USD THOUSAND)
TABLE 4916 KUWAIT INDIUM MARKET, BY EXTRACTION SOURCE, 2018-2033 (USD THOUSAND)
TABLE 4917 KUWAIT PRIMARY PRODUCTION IN INDIUM MARKET, BY TYPE, 2018-2033 (USD THOUSAND)
TABLE 4918 KUWAIT SECONDARY PRODUCTION IN INDIUM MARKET, BY TYPE, 2018-2033 (USD THOUSAND)
TABLE 4919 KUWAIT INDIUM MARKET, BY DISTRIBUTION CHANNEL, 2018-2033 (USD THOUSAND)
TABLE 4920 KUWAIT INDIUM MARKET, BY TECHNOLOGY PLATFORM, 2018-2033 (USD THOUSAND)
TABLE 4921 KUWAIT INDIUM MARKET, BY END-USER INDUSTRY, 2018-2033 (USD THOUSAND)
TABLE 4922 KUWAIT CONSUMER ELECTRONICS INDUSTRY IN INDIUM MARKET, BY TYPE, 2018-2033 (USD THOUSAND)
TABLE 4923 KUWAIT FLAT PANEL DISPLAYS (LCD/OLED/LED) IN INDIUM MARKET, BY PURITY GRADE, 2018-2033 (USD THOUSAND)
TABLE 4924 KUWAIT TRANSPARENT CONDUCTIVE COATINGS (ITO) IN INDIUM MARKET, BY PURITY GRADE, 2018-2033 (USD THOUSAND)
TABLE 4925 KUWAIT TOUCHSCREEN DISPLAYS IN INDIUM MARKET, BY PURITY GRADE, 2018-2033 (USD THOUSAND)
TABLE 4926 KUWAIT FLEXIBLE DISPLAYS & ELECTRONICS IN INDIUM MARKET, BY PURITY GRADE, 2018-2033 (USD THOUSAND)
TABLE 4927 KUWAIT WEARABLE ELECTRONICS DEVICES IN INDIUM MARKET, BY PURITY GRADE, 2018-2033 (USD THOUSAND)
TABLE 4928 KUWAIT CAMERA & OPTICAL SENSORS IN INDIUM MARKET, BY PURITY GRADE, 2018-2033 (USD THOUSAND)
TABLE 4929 KUWAIT MINI-LED BACKLIGHTING IN INDIUM MARKET, BY PURITY GRADE, 2018-2033 (USD THOUSAND)
TABLE 4930 KUWAIT MICRO-LED DISPLAYS IN INDIUM MARKET, BY PURITY GRADE, 2018-2033 (USD THOUSAND)
TABLE 4931 KUWAIT DISPLAY PANEL INDUSTRY IN INDIUM MARKET, BY TYPE, 2018-2033 (USD THOUSAND)
TABLE 4932 KUWAIT LCD PANEL MANUFACTURING IN INDIUM MARKET, BY PURITY GRADE, 2018-2033 (USD THOUSAND)
TABLE 4933 KUWAIT OLED PANEL MANUFACTURING IN INDIUM MARKET, BY PURITY GRADE, 2018-2033 (USD THOUSAND)
TABLE 4934 KUWAIT DISPLAY PANEL MANUFACTURING IN INDIUM MARKET, BY PURITY GRADE, 2018-2033 (USD THOUSAND)
TABLE 4935 KUWAIT TOUCH PANEL SENSORS IN INDIUM MARKET, BY PURITY GRADE, 2018-2033 (USD THOUSAND)
TABLE 4936 KUWAIT TRANSPARENT CONDUCTIVE FILMS IN INDIUM MARKET, BY PURITY GRADE, 2018-2033 (USD THOUSAND)
TABLE 4937 KUWAIT FLEXIBLE & FOLDABLE DISPLAYS IN INDIUM MARKET, BY PURITY GRADE, 2018-2033 (USD THOUSAND)
TABLE 4938 KUWAIT AR/VR DISPLAYS IN INDIUM MARKET, BY PURITY GRADE, 2018-2033 (USD THOUSAND)
TABLE 4939 KUWAIT MICRODISPLAY DEVICES IN INDIUM MARKET, BY PURITY GRADE, 2018-2033 (USD THOUSAND)
TABLE 4940 KUWAIT BACKPLANE COATINGS IN INDIUM MARKET, BY PURITY GRADE, 2018-2033 (USD THOUSAND)
TABLE 4941 KUWAIT SEMICONDUCTOR INDUSTRY IN INDIUM MARKET, BY TYPE, 2018-2033 (USD THOUSAND)
TABLE 4942 KUWAIT III-V COMPOUND SEMICONDUCTORS IN INDIUM MARKET, BY PURITY GRADE, 2018-2033 (USD THOUSAND)
TABLE 4943 KUWAIT HIGH-FREQUENCY RF COMPONENTS IN INDIUM MARKET, BY PURITY GRADE, 2018-2033 (USD THOUSAND)
TABLE 4944 KUWAIT SEMICONDUCTOR SUBSTRATES & EPITAXY IN INDIUM MARKET, BY PURITY GRADE, 2018-2033 (USD THOUSAND)
TABLE 4945 KUWAIT LASER DIODES IN INDIUM MARKET, BY PURITY GRADE, 2018-2033 (USD THOUSAND)
TABLE 4946 KUWAIT PHOTODETECTORS IN INDIUM MARKET, BY PURITY GRADE, 2018-2033 (USD THOUSAND)
TABLE 4947 KUWAIT HIGH-SPEED OPTOELECTRONICS IN INDIUM MARKET, BY PURITY GRADE, 2018-2033 (USD THOUSAND)
TABLE 4948 KUWAIT INFRARED DETECTORS IN INDIUM MARKET, BY PURITY GRADE, 2018-2033 (USD THOUSAND)
TABLE 4949 KUWAIT INTEGRATED PHOTONIC CIRCUITS IN INDIUM MARKET, BY PURITY GRADE, 2018-2033 (USD THOUSAND)
TABLE 4950 KUWAIT SOLAR PHOTOVOLTAIC INDUSTRY IN INDIUM MARKET, BY TYPE, 2018-2033 (USD THOUSAND)
TABLE 4951 KUWAIT CIGS THIN-FILM SOLAR CELLS IN INDIUM MARKET, BY PURITY GRADE, 2018-2033 (USD THOUSAND)
TABLE 4952 KUWAITHIGH-EFFICIENCY MODULES IN INDIUM MARKET, BY PURITY GRADE, 2018-2033 (USD THOUSAND)
TABLE 4953 KUWAIT THIN-FILM COATINGS IN INDIUM MARKET, BY PURITY GRADE, 2018-2033 (USD THOUSAND)
TABLE 4954 KUWAIT TRANSPARENT ELECTRODES IN INDIUM MARKET, BY PURITY GRADE, 2018-2033 (USD THOUSAND)
TABLE 4955 KUWAIT BIPV IN INDIUM MARKET, BY PURITY GRADE, 2018-2033 (USD THOUSAND)
TABLE 4956 KUWAIT FLEXIBLE SOLAR PANELS IN INDIUM MARKET, BY PURITY GRADE, 2018-2033 (USD THOUSAND)
TABLE 4957 KUWAIT PORTABLE SOLAR SYSTEMS IN INDIUM MARKET, BY PURITY GRADE, 2018-2033 (USD THOUSAND)
TABLE 4958 KUWAIT CONCENTRATED PV IN INDIUM MARKET, BY PURITY GRADE, 2018-2033 (USD THOUSAND)
TABLE 4959 KUWAIT AUTOMOTIVE INDUSTRY IN INDIUM MARKET, BY TYPE, 2018-2033 (USD THOUSAND)
TABLE 4960 KUWAIT AUTOMOTIVE DISPLAY PANELS IN INDIUM MARKET, BY PURITY GRADE, 2018-2033 (USD THOUSAND)
TABLE 4961 KUWAITADAS SENSORS IN INDIUM MARKET, BY PURITY GRADE, 2018-2033 (USD THOUSAND)
TABLE 4962 KUWAIT VEHICLE CAMERA MODULES IN INDIUM MARKET, BY PURITY GRADE, 2018-2033 (USD THOUSAND)
TABLE 4963 KUWAIT AUTOMOTIVE OPTOELECTRONICS IN INDIUM MARKET, BY PURITY GRADE, 2018-2033 (USD THOUSAND)
TABLE 4964 KUWAIT POWER ELECTRONICS IN INDIUM MARKET, BY PURITY GRADE, 2018-2033 (USD THOUSAND)
TABLE 4965 KUWAIT TOUCHSCREEN INTERFACES IN INDIUM MARKET, BY PURITY GRADE, 2018-2033 (USD THOUSAND)
TABLE 4966 KUWAIT INFRARED SENSORS IN INDIUM MARKET, BY PURITY GRADE, 2018-2033 (USD THOUSAND)
TABLE 4967 KUWAIT SMART LIGHTING IN INDIUM MARKET, BY PURITY GRADE, 2018-2033 (USD THOUSAND)
TABLE 4968 KUWAIT TELECOMMUNICATION EQUIPMENT INDUSTRY IN INDIUM MARKET, BY TYPE, 2018-2033 (USD THOUSAND)
TABLE 4969 KUWAIT OPTICAL TRANSCEIVERS IN INDIUM MARKET, BY PURITY GRADE, 2018-2033 (USD THOUSAND)
TABLE 4970 KUWAIT RF POWER AMPLIFIERS IN INDIUM MARKET, BY PURITY GRADE, 2018-2033 (USD THOUSAND)
TABLE 4971 KUWAIT HIGH-FREQUENCY COMMUNICATION CHIPS IN INDIUM MARKET, BY PURITY GRADE, 2018-2033 (USD THOUSAND)
TABLE 4972 KUWAIT FIBER-OPTIC COMMUNICATION LASERS IN INDIUM MARKET, BY PURITY GRADE, 2018-2033 (USD THOUSAND)
TABLE 4973 KUWAIT PHOTODETECTORS FOR OPTICAL NETWORKS IN INDIUM MARKET, BY PURITY GRADE, 2018-2033 (USD THOUSAND)
TABLE 4974 KUWAIT 5G INFRASTRUCTURE COMPONENTS IN INDIUM MARKET, BY PURITY GRADE, 2018-2033 (USD THOUSAND)
TABLE 4975 KUWAIT OPTICAL NETWORK SWITCHING DEVICES IN INDIUM MARKET, BY PURITY GRADE, 2018-2033 (USD THOUSAND)
TABLE 4976 KUWAIT SATELLITE COMMUNICATION MODULES IN INDIUM MARKET, BY PURITY GRADE, 2018-2033 (USD THOUSAND)
TABLE 4977 KUWAIT OPTICAL & PHOTONICS INDUSTRY IN INDIUM MARKET, BY TYPE, 2018-2033 (USD THOUSAND)
TABLE 4978 KUWAIT OPTICAL COATINGS IN INDIUM MARKET, BY PURITY GRADE, 2018-2033 (USD THOUSAND)
TABLE 4979 KUWAIT FIBER OPTIC COMPONENTS IN INDIUM MARKET, BY PURITY GRADE, 2018-2033 (USD THOUSAND)
TABLE 4980 KUWAIT LASER COMPONENTS IN INDIUM MARKET, BY PURITY GRADE, 2018-2033 (USD THOUSAND)
TABLE 4981 KUWAIT OPTICAL SENSORS IN INDIUM MARKET, BY PURITY GRADE, 2018-2033 (USD THOUSAND)
TABLE 4982 KUWAIT INFRARED OPTICS IN INDIUM MARKET, BY PURITY GRADE, 2018-2033 (USD THOUSAND)
TABLE 4983 KUWAIT PICS IN INDIUM MARKET, BY PURITY GRADE, 2018-2033 (USD THOUSAND)
TABLE 4984 KUWAIT MIRRORS IN INDIUM MARKET, BY PURITY GRADE, 2018-2033 (USD THOUSAND)
TABLE 4985 KUWAIT SPECTROSCOPY IN INDIUM MARKET, BY PURITY GRADE, 2018-2033 (USD THOUSAND)
TABLE 4986 KUWAIT AEROSPACE & DEFENSE INDUSTRY IN INDIUM MARKET, BY TYPE, 2018-2033 (USD THOUSAND)
TABLE 4987 KUWAIT INFRARED IMAGING SYSTEMS IN INDIUM MARKET, BY PURITY GRADE, 2018-2033 (USD THOUSAND)
TABLE 4988 KUWAIT RADAR & RF COMPONENTS IN INDIUM MARKET, BY PURITY GRADE, 2018-2033 (USD THOUSAND)
TABLE 4989 KUWAIT SATELLITE COMMUNICATION IN INDIUM MARKET, BY PURITY GRADE, 2018-2033 (USD THOUSAND)
TABLE 4990 KUWAIT MILITARY OPTOELECTRONICS IN INDIUM MARKET, BY PURITY GRADE, 2018-2033 (USD THOUSAND)
TABLE 4991 KUWAIT AVIONICS DISPLAYS IN INDIUM MARKET, BY PURITY GRADE, 2018-2033 (USD THOUSAND)
TABLE 4992 KUWAIT SPACECRAFT SOLAR PANELS IN INDIUM MARKET, BY PURITY GRADE, 2018-2033 (USD THOUSAND)
TABLE 4993 KUWAIT THERMAL MATERIALS IN INDIUM MARKET, BY PURITY GRADE, 2018-2033 (USD THOUSAND)
TABLE 4994 KUWAIT CRYOGENIC MATERIALS IN INDIUM MARKET, BY PURITY GRADE, 2018-2033 (USD THOUSAND)
TABLE 4995 KUWAIT MEDICAL DEVICE INDUSTRY IN INDIUM MARKET, BY TYPE, 2018-2033 (USD THOUSAND)
TABLE 4996 KUWAIT MEDICAL IMAGING SENSORS IN INDIUM MARKET, BY PURITY GRADE, 2018-2033 (USD THOUSAND)
TABLE 4997 KUWAIT DIAGNOSTIC EQUIPMENT DISPLAYS IN INDIUM MARKET, BY PURITY GRADE, 2018-2033 (USD THOUSAND)
TABLE 4998 KUWAIT ADVANCED DIAGNOSTIC INSTRUMENTS IN INDIUM MARKET, BY PURITY GRADE, 2018-2033 (USD THOUSAND)
TABLE 4999 KUWAIT LASER SURGICAL EQUIPMENT IN INDIUM MARKET, BY PURITY GRADE, 2018-2033 (USD THOUSAND)
TABLE 5000 KUWAIT BIOMEDICAL OPTICAL DEVICES IN INDIUM MARKET, BY PURITY GRADE, 2018-2033 (USD THOUSAND)
TABLE 5001 KUWAIT RADIATION DETECTION EQUIPMENT IN INDIUM MARKET, BY PURITY GRADE, 2018-2033 (USD THOUSAND)
TABLE 5002 KUWAIT INFRARED MEDICAL SENSORS IN INDIUM MARKET, BY PURITY GRADE, 2018-2033 (USD THOUSAND)
TABLE 5003 KUWAIT PHOTOTHERAPY DEVICES IN INDIUM MARKET, BY PURITY GRADE, 2018-2033 (USD THOUSAND)
TABLE 5004 KUWAIT INDUSTRIAL EQUIPMENT MANUFACTURING IN INDIUM MARKET, BY TYPE, 2018-2033 (USD THOUSAND)
TABLE 5005 KUWAIT INDUSTRIAL SENSORS IN INDIUM MARKET, BY PURITY GRADE, 2018-2033 (USD THOUSAND)
TABLE 5006 KUWAIT VACUUM DEPOSITION COATINGS IN INDIUM MARKET, BY PURITY GRADE, 2018-2033 (USD THOUSAND)
TABLE 5007 KUWAIT PRECISION OPTICAL COMPONENTS IN INDIUM MARKET, BY PURITY GRADE, 2018-2033 (USD THOUSAND)
TABLE 5008 KUWAIT THERMAL INTERFACE MATERIALS IN INDIUM MARKET, BY PURITY GRADE, 2018-2033 (USD THOUSAND)
TABLE 5009 KUWAIT INDUSTRIAL LASER SYSTEMS IN INDIUM MARKET, BY PURITY GRADE, 2018-2033 (USD THOUSAND)
TABLE 5010 KUWAIT INDUSTRIAL INFRARED DETECTORS IN INDIUM MARKET, BY PURITY GRADE, 2018-2033 (USD THOUSAND)
TABLE 5011 KUWAIT PRECISION MEASUREMENT EQUIPMENT IN INDIUM MARKET, BY PURITY GRADE, 2018-2033 (USD THOUSAND)
TABLE 5012 KUWAIT SPECIALTY ELECTRONIC COMPONENTS IN INDIUM MARKET, BY PURITY GRADE, 2018-2033 (USD THOUSAND)
TABLE 5013 KUWAIT OTHERS IN INDIUM MARKET, BY TYPE, 2018-2033 (USD THOUSAND)
TABLE 5014 KUWAIT ADVANCED MATERIALS MANUFACTURING IN INDIUM MARKET, BY PURITY GRADE, 2018-2033 (USD THOUSAND)
TABLE 5015 KUWAIT SPECIALTY ALLOY PRODUCTION IN INDIUM MARKET, BY PURITY GRADE, 2018-2033 (USD THOUSAND)
TABLE 5016 KUWAIT THERMAL MANAGEMENT MATERIALS IN INDIUM MARKET, BY PURITY GRADE, 2018-2033 (USD THOUSAND)
TABLE 5017 KUWAIT PRECISION SCIENTIFIC INSTRUMENTS IN INDIUM MARKET, BY PURITY GRADE, 2018-2033 (USD THOUSAND)
TABLE 5018 KUWAIT RESEARCH INSTITUTES & UNIVERSITIES IN INDIUM MARKET, BY PURITY GRADE, 2018-2033 (USD THOUSAND)
TABLE 5019 KUWAIT NUCLEAR INDUSTRY APPLICATIONS IN INDIUM MARKET, BY PURITY GRADE, 2018-2033 (USD THOUSAND)
TABLE 5020 KUWAIT SPECIALTY CHEMICAL PRODUCTION IN INDIUM MARKET, BY PURITY GRADE, 2018-2033 (USD THOUSAND)
TABLE 5021 KUWAIT DEFENSE RESEARCH LABORATORIES IN INDIUM MARKET, BY PURITY GRADE, 2018-2033 (USD THOUSAND)
TABLE 5022 KUWAIT CRYOGENIC EQUIPMENT MANUFACTURING IN INDIUM MARKET, BY PURITY GRADE, 2018-2033 (USD THOUSAND)
TABLE 5023 OMAN INDIUM MARKET, BY PRODUCT TYPE, 2018-2033 (USD THOUSAND)
TABLE 5024 OMAN INGOTS IN INDIUM MARKET, BY TYPE, 2018-2033 (USD THOUSAND)
TABLE 5025 OMAN INDIUM MARKET, BY MATERIAL COMPOSITION, 2018-2033 (USD THOUSAND)
TABLE 5026 OMAN INDIUM ALLOYS IN INDIUM MARKET, BY TYPE, 2018-2033 (USD THOUSAND)
TABLE 5027 OMAN INDIUM COMPOUNDS IN INDIUM MARKET, BY TYPE, 2018-2033 (USD THOUSAND)
TABLE 5028 OMAN INDIUM MARKET, BY PURITY GRADE, 2018-2033 (USD THOUSAND)
TABLE 5029 OMAN INDIUM MARKET, BY EXTRACTION SOURCE, 2018-2033 (USD THOUSAND)
TABLE 5030 OMAN PRIMARY PRODUCTION IN INDIUM MARKET, BY TYPE, 2018-2033 (USD THOUSAND)
TABLE 5031 OMAN SECONDARY PRODUCTION IN INDIUM MARKET, BY TYPE, 2018-2033 (USD THOUSAND)
TABLE 5032 OMAN INDIUM MARKET, BY DISTRIBUTION CHANNEL, 2018-2033 (USD THOUSAND)
TABLE 5033 OMAN INDIUM MARKET, BY TECHNOLOGY PLATFORM, 2018-2033 (USD THOUSAND)
TABLE 5034 OMAN INDIUM MARKET, BY END-USER INDUSTRY, 2018-2033 (USD THOUSAND)
TABLE 5035 OMAN CONSUMER ELECTRONICS INDUSTRY IN INDIUM MARKET, BY TYPE, 2018-2033 (USD THOUSAND)
TABLE 5036 OMAN FLAT PANEL DISPLAYS (LCD/OLED/LED) IN INDIUM MARKET, BY PURITY GRADE, 2018-2033 (USD THOUSAND)
TABLE 5037 OMAN TRANSPARENT CONDUCTIVE COATINGS (ITO) IN INDIUM MARKET, BY PURITY GRADE, 2018-2033 (USD THOUSAND)
TABLE 5038 OMAN TOUCHSCREEN DISPLAYS IN INDIUM MARKET, BY PURITY GRADE, 2018-2033 (USD THOUSAND)
TABLE 5039 OMAN FLEXIBLE DISPLAYS & ELECTRONICS IN INDIUM MARKET, BY PURITY GRADE, 2018-2033 (USD THOUSAND)
TABLE 5040 OMAN WEARABLE ELECTRONICS DEVICES IN INDIUM MARKET, BY PURITY GRADE, 2018-2033 (USD THOUSAND)
TABLE 5041 OMAN CAMERA & OPTICAL SENSORS IN INDIUM MARKET, BY PURITY GRADE, 2018-2033 (USD THOUSAND)
TABLE 5042 OMAN MINI-LED BACKLIGHTING IN INDIUM MARKET, BY PURITY GRADE, 2018-2033 (USD THOUSAND)
TABLE 5043 OMAN MICRO-LED DISPLAYS IN INDIUM MARKET, BY PURITY GRADE, 2018-2033 (USD THOUSAND)
TABLE 5044 OMAN DISPLAY PANEL INDUSTRY IN INDIUM MARKET, BY TYPE, 2018-2033 (USD THOUSAND)
TABLE 5045 OMAN LCD PANEL MANUFACTURING IN INDIUM MARKET, BY PURITY GRADE, 2018-2033 (USD THOUSAND)
TABLE 5046 OMAN OLED PANEL MANUFACTURING IN INDIUM MARKET, BY PURITY GRADE, 2018-2033 (USD THOUSAND)
TABLE 5047 OMAN DISPLAY PANEL MANUFACTURING IN INDIUM MARKET, BY PURITY GRADE, 2018-2033 (USD THOUSAND)
TABLE 5048 OMAN TOUCH PANEL SENSORS IN INDIUM MARKET, BY PURITY GRADE, 2018-2033 (USD THOUSAND)
TABLE 5049 OMAN TRANSPARENT CONDUCTIVE FILMS IN INDIUM MARKET, BY PURITY GRADE, 2018-2033 (USD THOUSAND)
TABLE 5050 OMAN FLEXIBLE & FOLDABLE DISPLAYS IN INDIUM MARKET, BY PURITY GRADE, 2018-2033 (USD THOUSAND)
TABLE 5051 OMAN AR/VR DISPLAYS IN INDIUM MARKET, BY PURITY GRADE, 2018-2033 (USD THOUSAND)
TABLE 5052 OMAN MICRODISPLAY DEVICES IN INDIUM MARKET, BY PURITY GRADE, 2018-2033 (USD THOUSAND)
TABLE 5053 OMAN BACKPLANE COATINGS IN INDIUM MARKET, BY PURITY GRADE, 2018-2033 (USD THOUSAND)
TABLE 5054 OMAN SEMICONDUCTOR INDUSTRY IN INDIUM MARKET, BY TYPE, 2018-2033 (USD THOUSAND)
TABLE 5055 OMAN III-V COMPOUND SEMICONDUCTORS IN INDIUM MARKET, BY PURITY GRADE, 2018-2033 (USD THOUSAND)
TABLE 5056 OMAN HIGH-FREQUENCY RF COMPONENTS IN INDIUM MARKET, BY PURITY GRADE, 2018-2033 (USD THOUSAND)
TABLE 5057 OMAN SEMICONDUCTOR SUBSTRATES & EPITAXY IN INDIUM MARKET, BY PURITY GRADE, 2018-2033 (USD THOUSAND)
TABLE 5058 OMAN LASER DIODES IN INDIUM MARKET, BY PURITY GRADE, 2018-2033 (USD THOUSAND)
TABLE 5059 OMAN PHOTODETECTORS IN INDIUM MARKET, BY PURITY GRADE, 2018-2033 (USD THOUSAND)
TABLE 5060 OMAN HIGH-SPEED OPTOELECTRONICS IN INDIUM MARKET, BY PURITY GRADE, 2018-2033 (USD THOUSAND)
TABLE 5061 OMAN INFRARED DETECTORS IN INDIUM MARKET, BY PURITY GRADE, 2018-2033 (USD THOUSAND)
TABLE 5062 OMAN INTEGRATED PHOTONIC CIRCUITS IN INDIUM MARKET, BY PURITY GRADE, 2018-2033 (USD THOUSAND)
TABLE 5063 OMAN SOLAR PHOTOVOLTAIC INDUSTRY IN INDIUM MARKET, BY TYPE, 2018-2033 (USD THOUSAND)
TABLE 5064 OMAN CIGS THIN-FILM SOLAR CELLS IN INDIUM MARKET, BY PURITY GRADE, 2018-2033 (USD THOUSAND)
TABLE 5065 OMANHIGH-EFFICIENCY MODULES IN INDIUM MARKET, BY PURITY GRADE, 2018-2033 (USD THOUSAND)
TABLE 5066 OMAN THIN-FILM COATINGS IN INDIUM MARKET, BY PURITY GRADE, 2018-2033 (USD THOUSAND)
TABLE 5067 OMAN TRANSPARENT ELECTRODES IN INDIUM MARKET, BY PURITY GRADE, 2018-2033 (USD THOUSAND)
TABLE 5068 OMAN BIPV IN INDIUM MARKET, BY PURITY GRADE, 2018-2033 (USD THOUSAND)
TABLE 5069 OMAN FLEXIBLE SOLAR PANELS IN INDIUM MARKET, BY PURITY GRADE, 2018-2033 (USD THOUSAND)
TABLE 5070 OMAN PORTABLE SOLAR SYSTEMS IN INDIUM MARKET, BY PURITY GRADE, 2018-2033 (USD THOUSAND)
TABLE 5071 OMAN CONCENTRATED PV IN INDIUM MARKET, BY PURITY GRADE, 2018-2033 (USD THOUSAND)
TABLE 5072 OMAN AUTOMOTIVE INDUSTRY IN INDIUM MARKET, BY TYPE, 2018-2033 (USD THOUSAND)
TABLE 5073 OMAN AUTOMOTIVE DISPLAY PANELS IN INDIUM MARKET, BY PURITY GRADE, 2018-2033 (USD THOUSAND)
TABLE 5074 OMANADAS SENSORS IN INDIUM MARKET, BY PURITY GRADE, 2018-2033 (USD THOUSAND)
TABLE 5075 OMAN VEHICLE CAMERA MODULES IN INDIUM MARKET, BY PURITY GRADE, 2018-2033 (USD THOUSAND)
TABLE 5076 OMAN AUTOMOTIVE OPTOELECTRONICS IN INDIUM MARKET, BY PURITY GRADE, 2018-2033 (USD THOUSAND)
TABLE 5077 OMAN POWER ELECTRONICS IN INDIUM MARKET, BY PURITY GRADE, 2018-2033 (USD THOUSAND)
TABLE 5078 OMAN TOUCHSCREEN INTERFACES IN INDIUM MARKET, BY PURITY GRADE, 2018-2033 (USD THOUSAND)
TABLE 5079 OMAN INFRARED SENSORS IN INDIUM MARKET, BY PURITY GRADE, 2018-2033 (USD THOUSAND)
TABLE 5080 OMAN SMART LIGHTING IN INDIUM MARKET, BY PURITY GRADE, 2018-2033 (USD THOUSAND)
TABLE 5081 OMAN TELECOMMUNICATION EQUIPMENT INDUSTRY IN INDIUM MARKET, BY TYPE, 2018-2033 (USD THOUSAND)
TABLE 5082 OMAN OPTICAL TRANSCEIVERS IN INDIUM MARKET, BY PURITY GRADE, 2018-2033 (USD THOUSAND)
TABLE 5083 OMAN RF POWER AMPLIFIERS IN INDIUM MARKET, BY PURITY GRADE, 2018-2033 (USD THOUSAND)
TABLE 5084 OMAN HIGH-FREQUENCY COMMUNICATION CHIPS IN INDIUM MARKET, BY PURITY GRADE, 2018-2033 (USD THOUSAND)
TABLE 5085 OMAN FIBER-OPTIC COMMUNICATION LASERS IN INDIUM MARKET, BY PURITY GRADE, 2018-2033 (USD THOUSAND)
TABLE 5086 OMAN PHOTODETECTORS FOR OPTICAL NETWORKS IN INDIUM MARKET, BY PURITY GRADE, 2018-2033 (USD THOUSAND)
TABLE 5087 OMAN 5G INFRASTRUCTURE COMPONENTS IN INDIUM MARKET, BY PURITY GRADE, 2018-2033 (USD THOUSAND)
TABLE 5088 OMAN OPTICAL NETWORK SWITCHING DEVICES IN INDIUM MARKET, BY PURITY GRADE, 2018-2033 (USD THOUSAND)
TABLE 5089 OMAN SATELLITE COMMUNICATION MODULES IN INDIUM MARKET, BY PURITY GRADE, 2018-2033 (USD THOUSAND)
TABLE 5090 OMAN OPTICAL & PHOTONICS INDUSTRY IN INDIUM MARKET, BY TYPE, 2018-2033 (USD THOUSAND)
TABLE 5091 OMAN OPTICAL COATINGS IN INDIUM MARKET, BY PURITY GRADE, 2018-2033 (USD THOUSAND)
TABLE 5092 OMAN FIBER OPTIC COMPONENTS IN INDIUM MARKET, BY PURITY GRADE, 2018-2033 (USD THOUSAND)
TABLE 5093 OMAN LASER COMPONENTS IN INDIUM MARKET, BY PURITY GRADE, 2018-2033 (USD THOUSAND)
TABLE 5094 OMAN OPTICAL SENSORS IN INDIUM MARKET, BY PURITY GRADE, 2018-2033 (USD THOUSAND)
TABLE 5095 OMAN INFRARED OPTICS IN INDIUM MARKET, BY PURITY GRADE, 2018-2033 (USD THOUSAND)
TABLE 5096 OMAN PICS IN INDIUM MARKET, BY PURITY GRADE, 2018-2033 (USD THOUSAND)
TABLE 5097 OMAN MIRRORS IN INDIUM MARKET, BY PURITY GRADE, 2018-2033 (USD THOUSAND)
TABLE 5098 OMAN SPECTROSCOPY IN INDIUM MARKET, BY PURITY GRADE, 2018-2033 (USD THOUSAND)
TABLE 5099 OMAN AEROSPACE & DEFENSE INDUSTRY IN INDIUM MARKET, BY TYPE, 2018-2033 (USD THOUSAND)
TABLE 5100 OMAN INFRARED IMAGING SYSTEMS IN INDIUM MARKET, BY PURITY GRADE, 2018-2033 (USD THOUSAND)
TABLE 5101 OMAN RADAR & RF COMPONENTS IN INDIUM MARKET, BY PURITY GRADE, 2018-2033 (USD THOUSAND)
TABLE 5102 OMAN SATELLITE COMMUNICATION IN INDIUM MARKET, BY PURITY GRADE, 2018-2033 (USD THOUSAND)
TABLE 5103 OMAN MILITARY OPTOELECTRONICS IN INDIUM MARKET, BY PURITY GRADE, 2018-2033 (USD THOUSAND)
TABLE 5104 OMAN AVIONICS DISPLAYS IN INDIUM MARKET, BY PURITY GRADE, 2018-2033 (USD THOUSAND)
TABLE 5105 OMAN SPACECRAFT SOLAR PANELS IN INDIUM MARKET, BY PURITY GRADE, 2018-2033 (USD THOUSAND)
TABLE 5106 OMAN THERMAL MATERIALS IN INDIUM MARKET, BY PURITY GRADE, 2018-2033 (USD THOUSAND)
TABLE 5107 OMAN CRYOGENIC MATERIALS IN INDIUM MARKET, BY PURITY GRADE, 2018-2033 (USD THOUSAND)
TABLE 5108 OMAN MEDICAL DEVICE INDUSTRY IN INDIUM MARKET, BY TYPE, 2018-2033 (USD THOUSAND)
TABLE 5109 OMAN MEDICAL IMAGING SENSORS IN INDIUM MARKET, BY PURITY GRADE, 2018-2033 (USD THOUSAND)
TABLE 5110 OMAN DIAGNOSTIC EQUIPMENT DISPLAYS IN INDIUM MARKET, BY PURITY GRADE, 2018-2033 (USD THOUSAND)
TABLE 5111 OMAN ADVANCED DIAGNOSTIC INSTRUMENTS IN INDIUM MARKET, BY PURITY GRADE, 2018-2033 (USD THOUSAND)
TABLE 5112 OMAN LASER SURGICAL EQUIPMENT IN INDIUM MARKET, BY PURITY GRADE, 2018-2033 (USD THOUSAND)
TABLE 5113 OMAN BIOMEDICAL OPTICAL DEVICES IN INDIUM MARKET, BY PURITY GRADE, 2018-2033 (USD THOUSAND)
TABLE 5114 OMAN RADIATION DETECTION EQUIPMENT IN INDIUM MARKET, BY PURITY GRADE, 2018-2033 (USD THOUSAND)
TABLE 5115 OMAN INFRARED MEDICAL SENSORS IN INDIUM MARKET, BY PURITY GRADE, 2018-2033 (USD THOUSAND)
TABLE 5116 OMAN PHOTOTHERAPY DEVICES IN INDIUM MARKET, BY PURITY GRADE, 2018-2033 (USD THOUSAND)
TABLE 5117 OMAN INDUSTRIAL EQUIPMENT MANUFACTURING IN INDIUM MARKET, BY TYPE, 2018-2033 (USD THOUSAND)
TABLE 5118 OMAN INDUSTRIAL SENSORS IN INDIUM MARKET, BY PURITY GRADE, 2018-2033 (USD THOUSAND)
TABLE 5119 OMAN VACUUM DEPOSITION COATINGS IN INDIUM MARKET, BY PURITY GRADE, 2018-2033 (USD THOUSAND)
TABLE 5120 OMAN PRECISION OPTICAL COMPONENTS IN INDIUM MARKET, BY PURITY GRADE, 2018-2033 (USD THOUSAND)
TABLE 5121 OMAN THERMAL INTERFACE MATERIALS IN INDIUM MARKET, BY PURITY GRADE, 2018-2033 (USD THOUSAND)
TABLE 5122 OMAN INDUSTRIAL LASER SYSTEMS IN INDIUM MARKET, BY PURITY GRADE, 2018-2033 (USD THOUSAND)
TABLE 5123 OMAN INDUSTRIAL INFRARED DETECTORS IN INDIUM MARKET, BY PURITY GRADE, 2018-2033 (USD THOUSAND)
TABLE 5124 OMAN PRECISION MEASUREMENT EQUIPMENT IN INDIUM MARKET, BY PURITY GRADE, 2018-2033 (USD THOUSAND)
TABLE 5125 OMAN SPECIALTY ELECTRONIC COMPONENTS IN INDIUM MARKET, BY PURITY GRADE, 2018-2033 (USD THOUSAND)
TABLE 5126 OMAN OTHERS IN INDIUM MARKET, BY TYPE, 2018-2033 (USD THOUSAND)
TABLE 5127 OMAN ADVANCED MATERIALS MANUFACTURING IN INDIUM MARKET, BY PURITY GRADE, 2018-2033 (USD THOUSAND)
TABLE 5128 OMAN SPECIALTY ALLOY PRODUCTION IN INDIUM MARKET, BY PURITY GRADE, 2018-2033 (USD THOUSAND)
TABLE 5129 OMAN THERMAL MANAGEMENT MATERIALS IN INDIUM MARKET, BY PURITY GRADE, 2018-2033 (USD THOUSAND)
TABLE 5130 OMAN PRECISION SCIENTIFIC INSTRUMENTS IN INDIUM MARKET, BY PURITY GRADE, 2018-2033 (USD THOUSAND)
TABLE 5131 OMAN RESEARCH INSTITUTES & UNIVERSITIES IN INDIUM MARKET, BY PURITY GRADE, 2018-2033 (USD THOUSAND)
TABLE 5132 OMAN NUCLEAR INDUSTRY APPLICATIONS IN INDIUM MARKET, BY PURITY GRADE, 2018-2033 (USD THOUSAND)
TABLE 5133 OMAN SPECIALTY CHEMICAL PRODUCTION IN INDIUM MARKET, BY PURITY GRADE, 2018-2033 (USD THOUSAND)
TABLE 5134 OMAN DEFENSE RESEARCH LABORATORIES IN INDIUM MARKET, BY PURITY GRADE, 2018-2033 (USD THOUSAND)
TABLE 5135 OMAN CRYOGENIC EQUIPMENT MANUFACTURING IN INDIUM MARKET, BY PURITY GRADE, 2018-2033 (USD THOUSAND)
TABLE 5136 BAHRAIN INDIUM MARKET, BY PRODUCT TYPE, 2018-2033 (USD THOUSAND)
TABLE 5137 BAHRAIN INGOTS IN INDIUM MARKET, BY TYPE, 2018-2033 (USD THOUSAND)
TABLE 5138 BAHRAIN INDIUM MARKET, BY MATERIAL COMPOSITION, 2018-2033 (USD THOUSAND)
TABLE 5139 BAHRAIN INDIUM ALLOYS IN INDIUM MARKET, BY TYPE, 2018-2033 (USD THOUSAND)
TABLE 5140 BAHRAIN INDIUM COMPOUNDS IN INDIUM MARKET, BY TYPE, 2018-2033 (USD THOUSAND)
TABLE 5141 BAHRAIN INDIUM MARKET, BY PURITY GRADE, 2018-2033 (USD THOUSAND)
TABLE 5142 BAHRAIN INDIUM MARKET, BY EXTRACTION SOURCE, 2018-2033 (USD THOUSAND)
TABLE 5143 BAHRAIN PRIMARY PRODUCTION IN INDIUM MARKET, BY TYPE, 2018-2033 (USD THOUSAND)
TABLE 5144 BAHRAIN SECONDARY PRODUCTION IN INDIUM MARKET, BY TYPE, 2018-2033 (USD THOUSAND)
TABLE 5145 BAHRAIN INDIUM MARKET, BY DISTRIBUTION CHANNEL, 2018-2033 (USD THOUSAND)
TABLE 5146 BAHRAIN INDIUM MARKET, BY TECHNOLOGY PLATFORM, 2018-2033 (USD THOUSAND)
TABLE 5147 BAHRAIN INDIUM MARKET, BY END-USER INDUSTRY, 2018-2033 (USD THOUSAND)
TABLE 5148 BAHRAIN CONSUMER ELECTRONICS INDUSTRY IN INDIUM MARKET, BY TYPE, 2018-2033 (USD THOUSAND)
TABLE 5149 BAHRAIN FLAT PANEL DISPLAYS (LCD/OLED/LED) IN INDIUM MARKET, BY PURITY GRADE, 2018-2033 (USD THOUSAND)
TABLE 5150 BAHRAIN TRANSPARENT CONDUCTIVE COATINGS (ITO) IN INDIUM MARKET, BY PURITY GRADE, 2018-2033 (USD THOUSAND)
TABLE 5151 BAHRAIN TOUCHSCREEN DISPLAYS IN INDIUM MARKET, BY PURITY GRADE, 2018-2033 (USD THOUSAND)
TABLE 5152 BAHRAIN FLEXIBLE DISPLAYS & ELECTRONICS IN INDIUM MARKET, BY PURITY GRADE, 2018-2033 (USD THOUSAND)
TABLE 5153 BAHRAIN WEARABLE ELECTRONICS DEVICES IN INDIUM MARKET, BY PURITY GRADE, 2018-2033 (USD THOUSAND)
TABLE 5154 BAHRAIN CAMERA & OPTICAL SENSORS IN INDIUM MARKET, BY PURITY GRADE, 2018-2033 (USD THOUSAND)
TABLE 5155 BAHRAIN MINI-LED BACKLIGHTING IN INDIUM MARKET, BY PURITY GRADE, 2018-2033 (USD THOUSAND)
TABLE 5156 BAHRAIN MICRO-LED DISPLAYS IN INDIUM MARKET, BY PURITY GRADE, 2018-2033 (USD THOUSAND)
TABLE 5157 BAHRAIN DISPLAY PANEL INDUSTRY IN INDIUM MARKET, BY TYPE, 2018-2033 (USD THOUSAND)
TABLE 5158 BAHRAIN LCD PANEL MANUFACTURING IN INDIUM MARKET, BY PURITY GRADE, 2018-2033 (USD THOUSAND)
TABLE 5159 BAHRAIN OLED PANEL MANUFACTURING IN INDIUM MARKET, BY PURITY GRADE, 2018-2033 (USD THOUSAND)
TABLE 5160 BAHRAIN DISPLAY PANEL MANUFACTURING IN INDIUM MARKET, BY PURITY GRADE, 2018-2033 (USD THOUSAND)
TABLE 5161 BAHRAIN TOUCH PANEL SENSORS IN INDIUM MARKET, BY PURITY GRADE, 2018-2033 (USD THOUSAND)
TABLE 5162 BAHRAIN TRANSPARENT CONDUCTIVE FILMS IN INDIUM MARKET, BY PURITY GRADE, 2018-2033 (USD THOUSAND)
TABLE 5163 BAHRAIN FLEXIBLE & FOLDABLE DISPLAYS IN INDIUM MARKET, BY PURITY GRADE, 2018-2033 (USD THOUSAND)
TABLE 5164 BAHRAIN AR/VR DISPLAYS IN INDIUM MARKET, BY PURITY GRADE, 2018-2033 (USD THOUSAND)
TABLE 5165 BAHRAIN MICRODISPLAY DEVICES IN INDIUM MARKET, BY PURITY GRADE, 2018-2033 (USD THOUSAND)
TABLE 5166 BAHRAIN BACKPLANE COATINGS IN INDIUM MARKET, BY PURITY GRADE, 2018-2033 (USD THOUSAND)
TABLE 5167 BAHRAIN SEMICONDUCTOR INDUSTRY IN INDIUM MARKET, BY TYPE, 2018-2033 (USD THOUSAND)
TABLE 5168 BAHRAIN III-V COMPOUND SEMICONDUCTORS IN INDIUM MARKET, BY PURITY GRADE, 2018-2033 (USD THOUSAND)
TABLE 5169 BAHRAIN HIGH-FREQUENCY RF COMPONENTS IN INDIUM MARKET, BY PURITY GRADE, 2018-2033 (USD THOUSAND)
TABLE 5170 BAHRAIN SEMICONDUCTOR SUBSTRATES & EPITAXY IN INDIUM MARKET, BY PURITY GRADE, 2018-2033 (USD THOUSAND)
TABLE 5171 BAHRAIN LASER DIODES IN INDIUM MARKET, BY PURITY GRADE, 2018-2033 (USD THOUSAND)
TABLE 5172 BAHRAIN PHOTODETECTORS IN INDIUM MARKET, BY PURITY GRADE, 2018-2033 (USD THOUSAND)
TABLE 5173 BAHRAIN HIGH-SPEED OPTOELECTRONICS IN INDIUM MARKET, BY PURITY GRADE, 2018-2033 (USD THOUSAND)
TABLE 5174 BAHRAIN INFRARED DETECTORS IN INDIUM MARKET, BY PURITY GRADE, 2018-2033 (USD THOUSAND)
TABLE 5175 BAHRAIN INTEGRATED PHOTONIC CIRCUITS IN INDIUM MARKET, BY PURITY GRADE, 2018-2033 (USD THOUSAND)
TABLE 5176 BAHRAIN SOLAR PHOTOVOLTAIC INDUSTRY IN INDIUM MARKET, BY TYPE, 2018-2033 (USD THOUSAND)
TABLE 5177 BAHRAIN CIGS THIN-FILM SOLAR CELLS IN INDIUM MARKET, BY PURITY GRADE, 2018-2033 (USD THOUSAND)
TABLE 5178 BAHRAINHIGH-EFFICIENCY MODULES IN INDIUM MARKET, BY PURITY GRADE, 2018-2033 (USD THOUSAND)
TABLE 5179 BAHRAIN THIN-FILM COATINGS IN INDIUM MARKET, BY PURITY GRADE, 2018-2033 (USD THOUSAND)
TABLE 5180 BAHRAIN TRANSPARENT ELECTRODES IN INDIUM MARKET, BY PURITY GRADE, 2018-2033 (USD THOUSAND)
TABLE 5181 BAHRAIN BIPV IN INDIUM MARKET, BY PURITY GRADE, 2018-2033 (USD THOUSAND)
TABLE 5182 BAHRAIN FLEXIBLE SOLAR PANELS IN INDIUM MARKET, BY PURITY GRADE, 2018-2033 (USD THOUSAND)
TABLE 5183 BAHRAIN PORTABLE SOLAR SYSTEMS IN INDIUM MARKET, BY PURITY GRADE, 2018-2033 (USD THOUSAND)
TABLE 5184 BAHRAIN CONCENTRATED PV IN INDIUM MARKET, BY PURITY GRADE, 2018-2033 (USD THOUSAND)
TABLE 5185 BAHRAIN AUTOMOTIVE INDUSTRY IN INDIUM MARKET, BY TYPE, 2018-2033 (USD THOUSAND)
TABLE 5186 BAHRAIN AUTOMOTIVE DISPLAY PANELS IN INDIUM MARKET, BY PURITY GRADE, 2018-2033 (USD THOUSAND)
TABLE 5187 BAHRAINADAS SENSORS IN INDIUM MARKET, BY PURITY GRADE, 2018-2033 (USD THOUSAND)
TABLE 5188 BAHRAIN VEHICLE CAMERA MODULES IN INDIUM MARKET, BY PURITY GRADE, 2018-2033 (USD THOUSAND)
TABLE 5189 BAHRAIN AUTOMOTIVE OPTOELECTRONICS IN INDIUM MARKET, BY PURITY GRADE, 2018-2033 (USD THOUSAND)
TABLE 5190 BAHRAIN POWER ELECTRONICS IN INDIUM MARKET, BY PURITY GRADE, 2018-2033 (USD THOUSAND)
TABLE 5191 BAHRAIN TOUCHSCREEN INTERFACES IN INDIUM MARKET, BY PURITY GRADE, 2018-2033 (USD THOUSAND)
TABLE 5192 BAHRAIN INFRARED SENSORS IN INDIUM MARKET, BY PURITY GRADE, 2018-2033 (USD THOUSAND)
TABLE 5193 BAHRAIN SMART LIGHTING IN INDIUM MARKET, BY PURITY GRADE, 2018-2033 (USD THOUSAND)
TABLE 5194 BAHRAIN TELECOMMUNICATION EQUIPMENT INDUSTRY IN INDIUM MARKET, BY TYPE, 2018-2033 (USD THOUSAND)
TABLE 5195 BAHRAIN OPTICAL TRANSCEIVERS IN INDIUM MARKET, BY PURITY GRADE, 2018-2033 (USD THOUSAND)
TABLE 5196 BAHRAIN RF POWER AMPLIFIERS IN INDIUM MARKET, BY PURITY GRADE, 2018-2033 (USD THOUSAND)
TABLE 5197 BAHRAIN HIGH-FREQUENCY COMMUNICATION CHIPS IN INDIUM MARKET, BY PURITY GRADE, 2018-2033 (USD THOUSAND)
TABLE 5198 BAHRAIN FIBER-OPTIC COMMUNICATION LASERS IN INDIUM MARKET, BY PURITY GRADE, 2018-2033 (USD THOUSAND)
TABLE 5199 BAHRAIN PHOTODETECTORS FOR OPTICAL NETWORKS IN INDIUM MARKET, BY PURITY GRADE, 2018-2033 (USD THOUSAND)
TABLE 5200 BAHRAIN 5G INFRASTRUCTURE COMPONENTS IN INDIUM MARKET, BY PURITY GRADE, 2018-2033 (USD THOUSAND)
TABLE 5201 BAHRAIN OPTICAL NETWORK SWITCHING DEVICES IN INDIUM MARKET, BY PURITY GRADE, 2018-2033 (USD THOUSAND)
TABLE 5202 BAHRAIN SATELLITE COMMUNICATION MODULES IN INDIUM MARKET, BY PURITY GRADE, 2018-2033 (USD THOUSAND)
TABLE 5203 BAHRAIN OPTICAL & PHOTONICS INDUSTRY IN INDIUM MARKET, BY TYPE, 2018-2033 (USD THOUSAND)
TABLE 5204 BAHRAIN OPTICAL COATINGS IN INDIUM MARKET, BY PURITY GRADE, 2018-2033 (USD THOUSAND)
TABLE 5205 BAHRAIN FIBER OPTIC COMPONENTS IN INDIUM MARKET, BY PURITY GRADE, 2018-2033 (USD THOUSAND)
TABLE 5206 BAHRAIN LASER COMPONENTS IN INDIUM MARKET, BY PURITY GRADE, 2018-2033 (USD THOUSAND)
TABLE 5207 BAHRAIN OPTICAL SENSORS IN INDIUM MARKET, BY PURITY GRADE, 2018-2033 (USD THOUSAND)
TABLE 5208 BAHRAIN INFRARED OPTICS IN INDIUM MARKET, BY PURITY GRADE, 2018-2033 (USD THOUSAND)
TABLE 5209 BAHRAIN PICS IN INDIUM MARKET, BY PURITY GRADE, 2018-2033 (USD THOUSAND)
TABLE 5210 BAHRAIN MIRRORS IN INDIUM MARKET, BY PURITY GRADE, 2018-2033 (USD THOUSAND)
TABLE 5211 BAHRAIN SPECTROSCOPY IN INDIUM MARKET, BY PURITY GRADE, 2018-2033 (USD THOUSAND)
TABLE 5212 BAHRAIN AEROSPACE & DEFENSE INDUSTRY IN INDIUM MARKET, BY TYPE, 2018-2033 (USD THOUSAND)
TABLE 5213 BAHRAIN INFRARED IMAGING SYSTEMS IN INDIUM MARKET, BY PURITY GRADE, 2018-2033 (USD THOUSAND)
TABLE 5214 BAHRAIN RADAR & RF COMPONENTS IN INDIUM MARKET, BY PURITY GRADE, 2018-2033 (USD THOUSAND)
TABLE 5215 BAHRAIN SATELLITE COMMUNICATION IN INDIUM MARKET, BY PURITY GRADE, 2018-2033 (USD THOUSAND)
TABLE 5216 BAHRAIN MILITARY OPTOELECTRONICS IN INDIUM MARKET, BY PURITY GRADE, 2018-2033 (USD THOUSAND)
TABLE 5217 BAHRAIN AVIONICS DISPLAYS IN INDIUM MARKET, BY PURITY GRADE, 2018-2033 (USD THOUSAND)
TABLE 5218 BAHRAIN SPACECRAFT SOLAR PANELS IN INDIUM MARKET, BY PURITY GRADE, 2018-2033 (USD THOUSAND)
TABLE 5219 BAHRAIN THERMAL MATERIALS IN INDIUM MARKET, BY PURITY GRADE, 2018-2033 (USD THOUSAND)
TABLE 5220 BAHRAIN CRYOGENIC MATERIALS IN INDIUM MARKET, BY PURITY GRADE, 2018-2033 (USD THOUSAND)
TABLE 5221 BAHRAIN MEDICAL DEVICE INDUSTRY IN INDIUM MARKET, BY TYPE, 2018-2033 (USD THOUSAND)
TABLE 5222 BAHRAIN MEDICAL IMAGING SENSORS IN INDIUM MARKET, BY PURITY GRADE, 2018-2033 (USD THOUSAND)
TABLE 5223 BAHRAIN DIAGNOSTIC EQUIPMENT DISPLAYS IN INDIUM MARKET, BY PURITY GRADE, 2018-2033 (USD THOUSAND)
TABLE 5224 BAHRAIN ADVANCED DIAGNOSTIC INSTRUMENTS IN INDIUM MARKET, BY PURITY GRADE, 2018-2033 (USD THOUSAND)
TABLE 5225 BAHRAIN LASER SURGICAL EQUIPMENT IN INDIUM MARKET, BY PURITY GRADE, 2018-2033 (USD THOUSAND)
TABLE 5226 BAHRAIN BIOMEDICAL OPTICAL DEVICES IN INDIUM MARKET, BY PURITY GRADE, 2018-2033 (USD THOUSAND)
TABLE 5227 BAHRAIN RADIATION DETECTION EQUIPMENT IN INDIUM MARKET, BY PURITY GRADE, 2018-2033 (USD THOUSAND)
TABLE 5228 BAHRAIN INFRARED MEDICAL SENSORS IN INDIUM MARKET, BY PURITY GRADE, 2018-2033 (USD THOUSAND)
TABLE 5229 BAHRAIN PHOTOTHERAPY DEVICES IN INDIUM MARKET, BY PURITY GRADE, 2018-2033 (USD THOUSAND)
TABLE 5230 BAHRAIN INDUSTRIAL EQUIPMENT MANUFACTURING IN INDIUM MARKET, BY TYPE, 2018-2033 (USD THOUSAND)
TABLE 5231 BAHRAIN INDUSTRIAL SENSORS IN INDIUM MARKET, BY PURITY GRADE, 2018-2033 (USD THOUSAND)
TABLE 5232 BAHRAIN VACUUM DEPOSITION COATINGS IN INDIUM MARKET, BY PURITY GRADE, 2018-2033 (USD THOUSAND)
TABLE 5233 BAHRAIN PRECISION OPTICAL COMPONENTS IN INDIUM MARKET, BY PURITY GRADE, 2018-2033 (USD THOUSAND)
TABLE 5234 BAHRAIN THERMAL INTERFACE MATERIALS IN INDIUM MARKET, BY PURITY GRADE, 2018-2033 (USD THOUSAND)
TABLE 5235 BAHRAIN INDUSTRIAL LASER SYSTEMS IN INDIUM MARKET, BY PURITY GRADE, 2018-2033 (USD THOUSAND)
TABLE 5236 BAHRAIN INDUSTRIAL INFRARED DETECTORS IN INDIUM MARKET, BY PURITY GRADE, 2018-2033 (USD THOUSAND)
TABLE 5237 BAHRAIN PRECISION MEASUREMENT EQUIPMENT IN INDIUM MARKET, BY PURITY GRADE, 2018-2033 (USD THOUSAND)
TABLE 5238 BAHRAIN SPECIALTY ELECTRONIC COMPONENTS IN INDIUM MARKET, BY PURITY GRADE, 2018-2033 (USD THOUSAND)
TABLE 5239 BAHRAIN OTHERS IN INDIUM MARKET, BY TYPE, 2018-2033 (USD THOUSAND)
TABLE 5240 BAHRAIN ADVANCED MATERIALS MANUFACTURING IN INDIUM MARKET, BY PURITY GRADE, 2018-2033 (USD THOUSAND)
TABLE 5241 BAHRAIN SPECIALTY ALLOY PRODUCTION IN INDIUM MARKET, BY PURITY GRADE, 2018-2033 (USD THOUSAND)
TABLE 5242 BAHRAIN THERMAL MANAGEMENT MATERIALS IN INDIUM MARKET, BY PURITY GRADE, 2018-2033 (USD THOUSAND)
TABLE 5243 BAHRAIN PRECISION SCIENTIFIC INSTRUMENTS IN INDIUM MARKET, BY PURITY GRADE, 2018-2033 (USD THOUSAND)
TABLE 5244 BAHRAIN RESEARCH INSTITUTES & UNIVERSITIES IN INDIUM MARKET, BY PURITY GRADE, 2018-2033 (USD THOUSAND)
TABLE 5245 BAHRAIN NUCLEAR INDUSTRY APPLICATIONS IN INDIUM MARKET, BY PURITY GRADE, 2018-2033 (USD THOUSAND)
TABLE 5246 BAHRAIN SPECIALTY CHEMICAL PRODUCTION IN INDIUM MARKET, BY PURITY GRADE, 2018-2033 (USD THOUSAND)
TABLE 5247 BAHRAIN DEFENSE RESEARCH LABORATORIES IN INDIUM MARKET, BY PURITY GRADE, 2018-2033 (USD THOUSAND)
TABLE 5248 BAHRAIN CRYOGENIC EQUIPMENT MANUFACTURING IN INDIUM MARKET, BY PURITY GRADE, 2018-2033 (USD THOUSAND)
TABLE 5249 REST OF MIDDLE EAST AND AFRICA INDIUM MARKET, BY PRODUCT TYPE, 2018-2033 (USD THOUSAND)
TABLE 5250 REST OF MIDDLE EAST AND AFRICA INGOTS IN INDIUM MARKET, BY TYPE, 2018-2033 (USD THOUSAND)
TABLE 5251 REST OF MIDDLE EAST AND AFRICA INDIUM MARKET, BY MATERIAL COMPOSITION, 2018-2033 (USD THOUSAND)
TABLE 5252 REST OF MIDDLE EAST AND AFRICA INDIUM ALLOYS IN INDIUM MARKET, BY TYPE, 2018-2033 (USD THOUSAND)
TABLE 5253 REST OF MIDDLE EAST AND AFRICA INDIUM COMPOUNDS IN INDIUM MARKET, BY TYPE, 2018-2033 (USD THOUSAND)
TABLE 5254 REST OF MIDDLE EAST AND AFRICA INDIUM MARKET, BY PURITY GRADE, 2018-2033 (USD THOUSAND)
TABLE 5255 REST OF MIDDLE EAST AND AFRICA INDIUM MARKET, BY EXTRACTION SOURCE, 2018-2033 (USD THOUSAND)
TABLE 5256 REST OF MIDDLE EAST AND AFRICA PRIMARY PRODUCTION IN INDIUM MARKET, BY TYPE, 2018-2033 (USD THOUSAND)
TABLE 5257 REST OF MIDDLE EAST AND AFRICA SECONDARY PRODUCTION IN INDIUM MARKET, BY TYPE, 2018-2033 (USD THOUSAND)
TABLE 5258 REST OF MIDDLE EAST AND AFRICA INDIUM MARKET, BY DISTRIBUTION CHANNEL, 2018-2033 (USD THOUSAND)
TABLE 5259 REST OF MIDDLE EAST AND AFRICA INDIUM MARKET, BY TECHNOLOGY PLATFORM, 2018-2033 (USD THOUSAND)
TABLE 5260 REST OF MIDDLE EAST AND AFRICA INDIUM MARKET, BY END-USER INDUSTRY, 2018-2033 (USD THOUSAND)
TABLE 5261 REST OF MIDDLE EAST AND AFRICA CONSUMER ELECTRONICS INDUSTRY IN INDIUM MARKET, BY TYPE, 2018-2033 (USD THOUSAND)
TABLE 5262 REST OF MIDDLE EAST AND AFRICA FLAT PANEL DISPLAYS (LCD/OLED/LED) IN INDIUM MARKET, BY PURITY GRADE, 2018-2033 (USD THOUSAND)
TABLE 5263 REST OF MIDDLE EAST AND AFRICA TRANSPARENT CONDUCTIVE COATINGS (ITO) IN INDIUM MARKET, BY PURITY GRADE, 2018-2033 (USD THOUSAND)
TABLE 5264 REST OF MIDDLE EAST AND AFRICA TOUCHSCREEN DISPLAYS IN INDIUM MARKET, BY PURITY GRADE, 2018-2033 (USD THOUSAND)
TABLE 5265 REST OF MIDDLE EAST AND AFRICA FLEXIBLE DISPLAYS & ELECTRONICS IN INDIUM MARKET, BY PURITY GRADE, 2018-2033 (USD THOUSAND)
TABLE 5266 REST OF MIDDLE EAST AND AFRICA WEARABLE ELECTRONICS DEVICES IN INDIUM MARKET, BY PURITY GRADE, 2018-2033 (USD THOUSAND)
TABLE 5267 REST OF MIDDLE EAST AND AFRICA CAMERA & OPTICAL SENSORS IN INDIUM MARKET, BY PURITY GRADE, 2018-2033 (USD THOUSAND)
TABLE 5268 REST OF MIDDLE EAST AND AFRICA MINI-LED BACKLIGHTING IN INDIUM MARKET, BY PURITY GRADE, 2018-2033 (USD THOUSAND)
TABLE 5269 REST OF MIDDLE EAST AND AFRICA MICRO-LED DISPLAYS IN INDIUM MARKET, BY PURITY GRADE, 2018-2033 (USD THOUSAND)
TABLE 5270 REST OF MIDDLE EAST AND AFRICA DISPLAY PANEL INDUSTRY IN INDIUM MARKET, BY TYPE, 2018-2033 (USD THOUSAND)
TABLE 5271 REST OF MIDDLE EAST AND AFRICA LCD PANEL MANUFACTURING IN INDIUM MARKET, BY PURITY GRADE, 2018-2033 (USD THOUSAND)
TABLE 5272 REST OF MIDDLE EAST AND AFRICA OLED PANEL MANUFACTURING IN INDIUM MARKET, BY PURITY GRADE, 2018-2033 (USD THOUSAND)
TABLE 5273 REST OF MIDDLE EAST AND AFRICA DISPLAY PANEL MANUFACTURING IN INDIUM MARKET, BY PURITY GRADE, 2018-2033 (USD THOUSAND)
TABLE 5274 REST OF MIDDLE EAST AND AFRICA TOUCH PANEL SENSORS IN INDIUM MARKET, BY PURITY GRADE, 2018-2033 (USD THOUSAND)
TABLE 5275 REST OF MIDDLE EAST AND AFRICA TRANSPARENT CONDUCTIVE FILMS IN INDIUM MARKET, BY PURITY GRADE, 2018-2033 (USD THOUSAND)
TABLE 5276 REST OF MIDDLE EAST AND AFRICA FLEXIBLE & FOLDABLE DISPLAYS IN INDIUM MARKET, BY PURITY GRADE, 2018-2033 (USD THOUSAND)
TABLE 5277 REST OF MIDDLE EAST AND AFRICA AR/VR DISPLAYS IN INDIUM MARKET, BY PURITY GRADE, 2018-2033 (USD THOUSAND)
TABLE 5278 REST OF MIDDLE EAST AND AFRICA MICRODISPLAY DEVICES IN INDIUM MARKET, BY PURITY GRADE, 2018-2033 (USD THOUSAND)
TABLE 5279 REST OF MIDDLE EAST AND AFRICA BACKPLANE COATINGS IN INDIUM MARKET, BY PURITY GRADE, 2018-2033 (USD THOUSAND)
TABLE 5280 REST OF MIDDLE EAST AND AFRICA SEMICONDUCTOR INDUSTRY IN INDIUM MARKET, BY TYPE, 2018-2033 (USD THOUSAND)
TABLE 5281 REST OF MIDDLE EAST AND AFRICA III-V COMPOUND SEMICONDUCTORS IN INDIUM MARKET, BY PURITY GRADE, 2018-2033 (USD THOUSAND)
TABLE 5282 REST OF MIDDLE EAST AND AFRICA HIGH-FREQUENCY RF COMPONENTS IN INDIUM MARKET, BY PURITY GRADE, 2018-2033 (USD THOUSAND)
TABLE 5283 REST OF MIDDLE EAST AND AFRICA SEMICONDUCTOR SUBSTRATES & EPITAXY IN INDIUM MARKET, BY PURITY GRADE, 2018-2033 (USD THOUSAND)
TABLE 5284 REST OF MIDDLE EAST AND AFRICA LASER DIODES IN INDIUM MARKET, BY PURITY GRADE, 2018-2033 (USD THOUSAND)
TABLE 5285 REST OF MIDDLE EAST AND AFRICA PHOTODETECTORS IN INDIUM MARKET, BY PURITY GRADE, 2018-2033 (USD THOUSAND)
TABLE 5286 REST OF MIDDLE EAST AND AFRICA HIGH-SPEED OPTOELECTRONICS IN INDIUM MARKET, BY PURITY GRADE, 2018-2033 (USD THOUSAND)
TABLE 5287 REST OF MIDDLE EAST AND AFRICA INFRARED DETECTORS IN INDIUM MARKET, BY PURITY GRADE, 2018-2033 (USD THOUSAND)
TABLE 5288 REST OF MIDDLE EAST AND AFRICA INTEGRATED PHOTONIC CIRCUITS IN INDIUM MARKET, BY PURITY GRADE, 2018-2033 (USD THOUSAND)
TABLE 5289 REST OF MIDDLE EAST AND AFRICA SOLAR PHOTOVOLTAIC INDUSTRY IN INDIUM MARKET, BY TYPE, 2018-2033 (USD THOUSAND)
TABLE 5290 REST OF MIDDLE EAST AND AFRICA CIGS THIN-FILM SOLAR CELLS IN INDIUM MARKET, BY PURITY GRADE, 2018-2033 (USD THOUSAND)
TABLE 5291 REST OF MIDDLE EAST AND AFRICAHIGH-EFFICIENCY MODULES IN INDIUM MARKET, BY PURITY GRADE, 2018-2033 (USD THOUSAND)
TABLE 5292 REST OF MIDDLE EAST AND AFRICA THIN-FILM COATINGS IN INDIUM MARKET, BY PURITY GRADE, 2018-2033 (USD THOUSAND)
TABLE 5293 REST OF MIDDLE EAST AND AFRICA TRANSPARENT ELECTRODES IN INDIUM MARKET, BY PURITY GRADE, 2018-2033 (USD THOUSAND)
TABLE 5294 REST OF MIDDLE EAST AND AFRICA BIPV IN INDIUM MARKET, BY PURITY GRADE, 2018-2033 (USD THOUSAND)
TABLE 5295 REST OF MIDDLE EAST AND AFRICA FLEXIBLE SOLAR PANELS IN INDIUM MARKET, BY PURITY GRADE, 2018-2033 (USD THOUSAND)
TABLE 5296 REST OF MIDDLE EAST AND AFRICA PORTABLE SOLAR SYSTEMS IN INDIUM MARKET, BY PURITY GRADE, 2018-2033 (USD THOUSAND)
TABLE 5297 REST OF MIDDLE EAST AND AFRICA CONCENTRATED PV IN INDIUM MARKET, BY PURITY GRADE, 2018-2033 (USD THOUSAND)
TABLE 5298 REST OF MIDDLE EAST AND AFRICA AUTOMOTIVE INDUSTRY IN INDIUM MARKET, BY TYPE, 2018-2033 (USD THOUSAND)
TABLE 5299 REST OF MIDDLE EAST AND AFRICA AUTOMOTIVE DISPLAY PANELS IN INDIUM MARKET, BY PURITY GRADE, 2018-2033 (USD THOUSAND)
TABLE 5300 REST OF MIDDLE EAST AND AFRICAADAS SENSORS IN INDIUM MARKET, BY PURITY GRADE, 2018-2033 (USD THOUSAND)
TABLE 5301 REST OF MIDDLE EAST AND AFRICA VEHICLE CAMERA MODULES IN INDIUM MARKET, BY PURITY GRADE, 2018-2033 (USD THOUSAND)
TABLE 5302 REST OF MIDDLE EAST AND AFRICA AUTOMOTIVE OPTOELECTRONICS IN INDIUM MARKET, BY PURITY GRADE, 2018-2033 (USD THOUSAND)
TABLE 5303 REST OF MIDDLE EAST AND AFRICA POWER ELECTRONICS IN INDIUM MARKET, BY PURITY GRADE, 2018-2033 (USD THOUSAND)
TABLE 5304 REST OF MIDDLE EAST AND AFRICA TOUCHSCREEN INTERFACES IN INDIUM MARKET, BY PURITY GRADE, 2018-2033 (USD THOUSAND)
TABLE 5305 REST OF MIDDLE EAST AND AFRICA INFRARED SENSORS IN INDIUM MARKET, BY PURITY GRADE, 2018-2033 (USD THOUSAND)
TABLE 5306 REST OF MIDDLE EAST AND AFRICA SMART LIGHTING IN INDIUM MARKET, BY PURITY GRADE, 2018-2033 (USD THOUSAND)
TABLE 5307 REST OF MIDDLE EAST AND AFRICA TELECOMMUNICATION EQUIPMENT INDUSTRY IN INDIUM MARKET, BY TYPE, 2018-2033 (USD THOUSAND)
TABLE 5308 REST OF MIDDLE EAST AND AFRICA OPTICAL TRANSCEIVERS IN INDIUM MARKET, BY PURITY GRADE, 2018-2033 (USD THOUSAND)
TABLE 5309 REST OF MIDDLE EAST AND AFRICA RF POWER AMPLIFIERS IN INDIUM MARKET, BY PURITY GRADE, 2018-2033 (USD THOUSAND)
TABLE 5310 REST OF MIDDLE EAST AND AFRICA HIGH-FREQUENCY COMMUNICATION CHIPS IN INDIUM MARKET, BY PURITY GRADE, 2018-2033 (USD THOUSAND)
TABLE 5311 REST OF MIDDLE EAST AND AFRICA FIBER-OPTIC COMMUNICATION LASERS IN INDIUM MARKET, BY PURITY GRADE, 2018-2033 (USD THOUSAND)
TABLE 5312 REST OF MIDDLE EAST AND AFRICA PHOTODETECTORS FOR OPTICAL NETWORKS IN INDIUM MARKET, BY PURITY GRADE, 2018-2033 (USD THOUSAND)
TABLE 5313 REST OF MIDDLE EAST AND AFRICA 5G INFRASTRUCTURE COMPONENTS IN INDIUM MARKET, BY PURITY GRADE, 2018-2033 (USD THOUSAND)
TABLE 5314 REST OF MIDDLE EAST AND AFRICA OPTICAL NETWORK SWITCHING DEVICES IN INDIUM MARKET, BY PURITY GRADE, 2018-2033 (USD THOUSAND)
TABLE 5315 REST OF MIDDLE EAST AND AFRICA SATELLITE COMMUNICATION MODULES IN INDIUM MARKET, BY PURITY GRADE, 2018-2033 (USD THOUSAND)
TABLE 5316 REST OF MIDDLE EAST AND AFRICA OPTICAL & PHOTONICS INDUSTRY IN INDIUM MARKET, BY TYPE, 2018-2033 (USD THOUSAND)
TABLE 5317 REST OF MIDDLE EAST AND AFRICA OPTICAL COATINGS IN INDIUM MARKET, BY PURITY GRADE, 2018-2033 (USD THOUSAND)
TABLE 5318 REST OF MIDDLE EAST AND AFRICA FIBER OPTIC COMPONENTS IN INDIUM MARKET, BY PURITY GRADE, 2018-2033 (USD THOUSAND)
TABLE 5319 REST OF MIDDLE EAST AND AFRICA LASER COMPONENTS IN INDIUM MARKET, BY PURITY GRADE, 2018-2033 (USD THOUSAND)
TABLE 5320 REST OF MIDDLE EAST AND AFRICA OPTICAL SENSORS IN INDIUM MARKET, BY PURITY GRADE, 2018-2033 (USD THOUSAND)
TABLE 5321 REST OF MIDDLE EAST AND AFRICA INFRARED OPTICS IN INDIUM MARKET, BY PURITY GRADE, 2018-2033 (USD THOUSAND)
TABLE 5322 REST OF MIDDLE EAST AND AFRICA PICS IN INDIUM MARKET, BY PURITY GRADE, 2018-2033 (USD THOUSAND)
TABLE 5323 REST OF MIDDLE EAST AND AFRICA MIRRORS IN INDIUM MARKET, BY PURITY GRADE, 2018-2033 (USD THOUSAND)
TABLE 5324 REST OF MIDDLE EAST AND AFRICA SPECTROSCOPY IN INDIUM MARKET, BY PURITY GRADE, 2018-2033 (USD THOUSAND)
TABLE 5325 REST OF MIDDLE EAST AND AFRICA AEROSPACE & DEFENSE INDUSTRY IN INDIUM MARKET, BY TYPE, 2018-2033 (USD THOUSAND)
TABLE 5326 REST OF MIDDLE EAST AND AFRICA INFRARED IMAGING SYSTEMS IN INDIUM MARKET, BY PURITY GRADE, 2018-2033 (USD THOUSAND)
TABLE 5327 REST OF MIDDLE EAST AND AFRICA RADAR & RF COMPONENTS IN INDIUM MARKET, BY PURITY GRADE, 2018-2033 (USD THOUSAND)
TABLE 5328 REST OF MIDDLE EAST AND AFRICA SATELLITE COMMUNICATION IN INDIUM MARKET, BY PURITY GRADE, 2018-2033 (USD THOUSAND)
TABLE 5329 REST OF MIDDLE EAST AND AFRICA MILITARY OPTOELECTRONICS IN INDIUM MARKET, BY PURITY GRADE, 2018-2033 (USD THOUSAND)
TABLE 5330 REST OF MIDDLE EAST AND AFRICA AVIONICS DISPLAYS IN INDIUM MARKET, BY PURITY GRADE, 2018-2033 (USD THOUSAND)
TABLE 5331 REST OF MIDDLE EAST AND AFRICA SPACECRAFT SOLAR PANELS IN INDIUM MARKET, BY PURITY GRADE, 2018-2033 (USD THOUSAND)
TABLE 5332 REST OF MIDDLE EAST AND AFRICA THERMAL MATERIALS IN INDIUM MARKET, BY PURITY GRADE, 2018-2033 (USD THOUSAND)
TABLE 5333 REST OF MIDDLE EAST AND AFRICA CRYOGENIC MATERIALS IN INDIUM MARKET, BY PURITY GRADE, 2018-2033 (USD THOUSAND)
TABLE 5334 REST OF MIDDLE EAST AND AFRICA MEDICAL DEVICE INDUSTRY IN INDIUM MARKET, BY TYPE, 2018-2033 (USD THOUSAND)
TABLE 5335 REST OF MIDDLE EAST AND AFRICA MEDICAL IMAGING SENSORS IN INDIUM MARKET, BY PURITY GRADE, 2018-2033 (USD THOUSAND)
TABLE 5336 REST OF MIDDLE EAST AND AFRICA DIAGNOSTIC EQUIPMENT DISPLAYS IN INDIUM MARKET, BY PURITY GRADE, 2018-2033 (USD THOUSAND)
TABLE 5337 REST OF MIDDLE EAST AND AFRICA ADVANCED DIAGNOSTIC INSTRUMENTS IN INDIUM MARKET, BY PURITY GRADE, 2018-2033 (USD THOUSAND)
TABLE 5338 REST OF MIDDLE EAST AND AFRICA LASER SURGICAL EQUIPMENT IN INDIUM MARKET, BY PURITY GRADE, 2018-2033 (USD THOUSAND)
TABLE 5339 REST OF MIDDLE EAST AND AFRICA BIOMEDICAL OPTICAL DEVICES IN INDIUM MARKET, BY PURITY GRADE, 2018-2033 (USD THOUSAND)
TABLE 5340 REST OF MIDDLE EAST AND AFRICA RADIATION DETECTION EQUIPMENT IN INDIUM MARKET, BY PURITY GRADE, 2018-2033 (USD THOUSAND)
TABLE 5341 REST OF MIDDLE EAST AND AFRICA INFRARED MEDICAL SENSORS IN INDIUM MARKET, BY PURITY GRADE, 2018-2033 (USD THOUSAND)
TABLE 5342 REST OF MIDDLE EAST AND AFRICA PHOTOTHERAPY DEVICES IN INDIUM MARKET, BY PURITY GRADE, 2018-2033 (USD THOUSAND)
TABLE 5343 REST OF MIDDLE EAST AND AFRICA INDUSTRIAL EQUIPMENT MANUFACTURING IN INDIUM MARKET, BY TYPE, 2018-2033 (USD THOUSAND)
TABLE 5344 REST OF MIDDLE EAST AND AFRICA INDUSTRIAL SENSORS IN INDIUM MARKET, BY PURITY GRADE, 2018-2033 (USD THOUSAND)
TABLE 5345 REST OF MIDDLE EAST AND AFRICA VACUUM DEPOSITION COATINGS IN INDIUM MARKET, BY PURITY GRADE, 2018-2033 (USD THOUSAND)
TABLE 5346 REST OF MIDDLE EAST AND AFRICA PRECISION OPTICAL COMPONENTS IN INDIUM MARKET, BY PURITY GRADE, 2018-2033 (USD THOUSAND)
TABLE 5347 REST OF MIDDLE EAST AND AFRICA THERMAL INTERFACE MATERIALS IN INDIUM MARKET, BY PURITY GRADE, 2018-2033 (USD THOUSAND)
TABLE 5348 REST OF MIDDLE EAST AND AFRICA INDUSTRIAL LASER SYSTEMS IN INDIUM MARKET, BY PURITY GRADE, 2018-2033 (USD THOUSAND)
TABLE 5349 REST OF MIDDLE EAST AND AFRICA INDUSTRIAL INFRARED DETECTORS IN INDIUM MARKET, BY PURITY GRADE, 2018-2033 (USD THOUSAND)
TABLE 5350 REST OF MIDDLE EAST AND AFRICA PRECISION MEASUREMENT EQUIPMENT IN INDIUM MARKET, BY PURITY GRADE, 2018-2033 (USD THOUSAND)
TABLE 5351 REST OF MIDDLE EAST AND AFRICA SPECIALTY ELECTRONIC COMPONENTS IN INDIUM MARKET, BY PURITY GRADE, 2018-2033 (USD THOUSAND)
TABLE 5352 REST OF MIDDLE EAST AND AFRICA OTHERS IN INDIUM MARKET, BY TYPE, 2018-2033 (USD THOUSAND)
TABLE 5353 REST OF MIDDLE EAST AND AFRICA ADVANCED MATERIALS MANUFACTURING IN INDIUM MARKET, BY PURITY GRADE, 2018-2033 (USD THOUSAND)
TABLE 5354 REST OF MIDDLE EAST AND AFRICA SPECIALTY ALLOY PRODUCTION IN INDIUM MARKET, BY PURITY GRADE, 2018-2033 (USD THOUSAND)
TABLE 5355 REST OF MIDDLE EAST AND AFRICA THERMAL MANAGEMENT MATERIALS IN INDIUM MARKET, BY PURITY GRADE, 2018-2033 (USD THOUSAND)
TABLE 5356 REST OF MIDDLE EAST AND AFRICA PRECISION SCIENTIFIC INSTRUMENTS IN INDIUM MARKET, BY PURITY GRADE, 2018-2033 (USD THOUSAND)
TABLE 5357 REST OF MIDDLE EAST AND AFRICA RESEARCH INSTITUTES & UNIVERSITIES IN INDIUM MARKET, BY PURITY GRADE, 2018-2033 (USD THOUSAND)
TABLE 5358 REST OF MIDDLE EAST AND AFRICA NUCLEAR INDUSTRY APPLICATIONS IN INDIUM MARKET, BY PURITY GRADE, 2018-2033 (USD THOUSAND)
TABLE 5359 REST OF MIDDLE EAST AND AFRICA SPECIALTY CHEMICAL PRODUCTION IN INDIUM MARKET, BY PURITY GRADE, 2018-2033 (USD THOUSAND)
TABLE 5360 REST OF MIDDLE EAST AND AFRICA DEFENSE RESEARCH LABORATORIES IN INDIUM MARKET, BY PURITY GRADE, 2018-2033 (USD THOUSAND)
TABLE 5361 REST OF MIDDLE EAST AND AFRICA CRYOGENIC EQUIPMENT MANUFACTURING IN INDIUM MARKET, BY PURITY GRADE, 2018-2033 (USD THOUSAND)
TABLE 5362 SOUTH AMERICA INDIUM MARKET, BY COUNTRY, 2018-2033 (USD THOUSAND)
TABLE 5363 SOUTH AMERICA INDIUM MARKET, BY PRODUCT TYPE, 2018-2033 (USD THOUSAND)
TABLE 5364 SOUTH AMERICA INGOTS IN INDIUM MARKET, BY TYPE, 2018-2033 (USD THOUSAND)
TABLE 5365 SOUTH AMERICA INDIUM MARKET, BY MATERIAL COMPOSITION, 2018-2033 (USD THOUSAND)
TABLE 5366 SOUTH AMERICA INDIUM ALLOYS IN INDIUM MARKET, BY TYPE, 2018-2033 (USD THOUSAND)
TABLE 5367 SOUTH AMERICA INDIUM COMPOUNDS IN INDIUM MARKET, BY TYPE, 2018-2033 (USD THOUSAND)
TABLE 5368 SOUTH AMERICA INDIUM MARKET, BY PURITY GRADE, 2018-2033 (USD THOUSAND)
TABLE 5369 SOUTH AMERICA INDIUM MARKET, BY EXTRACTION SOURCE, 2018-2033 (USD THOUSAND)
TABLE 5370 SOUTH AMERICA PRIMARY PRODUCTION IN INDIUM MARKET, BY TYPE, 2018-2033 (USD THOUSAND)
TABLE 5371 SOUTH AMERICA SECONDARY PRODUCTION IN INDIUM MARKET, BY TYPE, 2018-2033 (USD THOUSAND)
TABLE 5372 SOUTH AMERICA INDIUM MARKET, BY DISTRIBUTION CHANNEL, 2018-2033 (USD THOUSAND)
TABLE 5373 SOUTH AMERICA INDIUM MARKET, BY TECHNOLOGY PLATFORM, 2018-2033 (USD THOUSAND)
TABLE 5374 SOUTH AMERICA INDIUM MARKET, BY END-USER INDUSTRY, 2018-2033 (USD THOUSAND)
TABLE 5375 SOUTH AMERICA CONSUMER ELECTRONICS INDUSTRY IN INDIUM MARKET, BY TYPE, 2018-2033 (USD THOUSAND)
TABLE 5376 SOUTH AMERICA FLAT PANEL DISPLAYS (LCD/OLED/LED) IN INDIUM MARKET, BY PURITY GRADE, 2018-2033 (USD THOUSAND)
TABLE 5377 SOUTH AMERICA TRANSPARENT CONDUCTIVE COATINGS (ITO) IN INDIUM MARKET, BY PURITY GRADE, 2018-2033 (USD THOUSAND)
TABLE 5378 SOUTH AMERICA TOUCHSCREEN DISPLAYS IN INDIUM MARKET, BY PURITY GRADE, 2018-2033 (USD THOUSAND)
TABLE 5379 SOUTH AMERICA FLEXIBLE DISPLAYS & ELECTRONICS IN INDIUM MARKET, BY PURITY GRADE, 2018-2033 (USD THOUSAND)
TABLE 5380 SOUTH AMERICA WEARABLE ELECTRONICS DEVICES IN INDIUM MARKET, BY PURITY GRADE, 2018-2033 (USD THOUSAND)
TABLE 5381 SOUTH AMERICA CAMERA & OPTICAL SENSORS IN INDIUM MARKET, BY PURITY GRADE, 2018-2033 (USD THOUSAND)
TABLE 5382 SOUTH AMERICA MINI-LED BACKLIGHTING IN INDIUM MARKET, BY PURITY GRADE, 2018-2033 (USD THOUSAND)
TABLE 5383 SOUTH AMERICA MICRO-LED DISPLAYS IN INDIUM MARKET, BY PURITY GRADE, 2018-2033 (USD THOUSAND)
TABLE 5384 SOUTH AMERICA DISPLAY PANEL INDUSTRY IN INDIUM MARKET, BY TYPE, 2018-2033 (USD THOUSAND)
TABLE 5385 SOUTH AMERICA LCD PANEL MANUFACTURING IN INDIUM MARKET, BY PURITY GRADE, 2018-2033 (USD THOUSAND)
TABLE 5386 SOUTH AMERICA OLED PANEL MANUFACTURING IN INDIUM MARKET, BY PURITY GRADE, 2018-2033 (USD THOUSAND)
TABLE 5387 SOUTH AMERICA DISPLAY PANEL MANUFACTURING IN INDIUM MARKET, BY PURITY GRADE, 2018-2033 (USD THOUSAND)
TABLE 5388 SOUTH AMERICA TOUCH PANEL SENSORS IN INDIUM MARKET, BY PURITY GRADE, 2018-2033 (USD THOUSAND)
TABLE 5389 SOUTH AMERICA TRANSPARENT CONDUCTIVE FILMS IN INDIUM MARKET, BY PURITY GRADE, 2018-2033 (USD THOUSAND)
TABLE 5390 SOUTH AMERICA FLEXIBLE & FOLDABLE DISPLAYS IN INDIUM MARKET, BY PURITY GRADE, 2018-2033 (USD THOUSAND)
TABLE 5391 SOUTH AMERICA AR/VR DISPLAYS IN INDIUM MARKET, BY PURITY GRADE, 2018-2033 (USD THOUSAND)
TABLE 5392 SOUTH AMERICA MICRODISPLAY DEVICES IN INDIUM MARKET, BY PURITY GRADE, 2018-2033 (USD THOUSAND)
TABLE 5393 SOUTH AMERICA BACKPLANE COATINGS IN INDIUM MARKET, BY PURITY GRADE, 2018-2033 (USD THOUSAND)
TABLE 5394 SOUTH AMERICA SEMICONDUCTOR INDUSTRY IN INDIUM MARKET, BY TYPE, 2018-2033 (USD THOUSAND)
TABLE 5395 SOUTH AMERICA III-V COMPOUND SEMICONDUCTORS IN INDIUM MARKET, BY PURITY GRADE, 2018-2033 (USD THOUSAND)
TABLE 5396 SOUTH AMERICA HIGH-FREQUENCY RF COMPONENTS IN INDIUM MARKET, BY PURITY GRADE, 2018-2033 (USD THOUSAND)
TABLE 5397 SOUTH AMERICA SEMICONDUCTOR SUBSTRATES & EPITAXY IN INDIUM MARKET, BY PURITY GRADE, 2018-2033 (USD THOUSAND)
TABLE 5398 SOUTH AMERICA LASER DIODES IN INDIUM MARKET, BY PURITY GRADE, 2018-2033 (USD THOUSAND)
TABLE 5399 SOUTH AMERICA PHOTODETECTORS IN INDIUM MARKET, BY PURITY GRADE, 2018-2033 (USD THOUSAND)
TABLE 5400 SOUTH AMERICA HIGH-SPEED OPTOELECTRONICS IN INDIUM MARKET, BY PURITY GRADE, 2018-2033 (USD THOUSAND)
TABLE 5401 SOUTH AMERICA INFRARED DETECTORS IN INDIUM MARKET, BY PURITY GRADE, 2018-2033 (USD THOUSAND)
TABLE 5402 SOUTH AMERICA INTEGRATED PHOTONIC CIRCUITS IN INDIUM MARKET, BY PURITY GRADE, 2018-2033 (USD THOUSAND)
TABLE 5403 SOUTH AMERICA SOLAR PHOTOVOLTAIC INDUSTRY IN INDIUM MARKET, BY TYPE, 2018-2033 (USD THOUSAND)
TABLE 5404 SOUTH AMERICA CIGS THIN-FILM SOLAR CELLS IN INDIUM MARKET, BY PURITY GRADE, 2018-2033 (USD THOUSAND)
TABLE 5405 SOUTH AMERICAHIGH-EFFICIENCY MODULES IN INDIUM MARKET, BY PURITY GRADE, 2018-2033 (USD THOUSAND)
TABLE 5406 SOUTH AMERICA THIN-FILM COATINGS IN INDIUM MARKET, BY PURITY GRADE, 2018-2033 (USD THOUSAND)
TABLE 5407 SOUTH AMERICA TRANSPARENT ELECTRODES IN INDIUM MARKET, BY PURITY GRADE, 2018-2033 (USD THOUSAND)
TABLE 5408 SOUTH AMERICA BIPV IN INDIUM MARKET, BY PURITY GRADE, 2018-2033 (USD THOUSAND)
TABLE 5409 SOUTH AMERICA FLEXIBLE SOLAR PANELS IN INDIUM MARKET, BY PURITY GRADE, 2018-2033 (USD THOUSAND)
TABLE 5410 SOUTH AMERICA PORTABLE SOLAR SYSTEMS IN INDIUM MARKET, BY PURITY GRADE, 2018-2033 (USD THOUSAND)
TABLE 5411 SOUTH AMERICA CONCENTRATED PV IN INDIUM MARKET, BY PURITY GRADE, 2018-2033 (USD THOUSAND)
TABLE 5412 SOUTH AMERICA AUTOMOTIVE INDUSTRY IN INDIUM MARKET, BY TYPE, 2018-2033 (USD THOUSAND)
TABLE 5413 SOUTH AMERICA AUTOMOTIVE DISPLAY PANELS IN INDIUM MARKET, BY PURITY GRADE, 2018-2033 (USD THOUSAND)
TABLE 5414 SOUTH AMERICAADAS SENSORS IN INDIUM MARKET, BY PURITY GRADE, 2018-2033 (USD THOUSAND)
TABLE 5415 SOUTH AMERICA VEHICLE CAMERA MODULES IN INDIUM MARKET, BY PURITY GRADE, 2018-2033 (USD THOUSAND)
TABLE 5416 SOUTH AMERICA AUTOMOTIVE OPTOELECTRONICS IN INDIUM MARKET, BY PURITY GRADE, 2018-2033 (USD THOUSAND)
TABLE 5417 SOUTH AMERICA POWER ELECTRONICS IN INDIUM MARKET, BY PURITY GRADE, 2018-2033 (USD THOUSAND)
TABLE 5418 SOUTH AMERICA TOUCHSCREEN INTERFACES IN INDIUM MARKET, BY PURITY GRADE, 2018-2033 (USD THOUSAND)
TABLE 5419 SOUTH AMERICA INFRARED SENSORS IN INDIUM MARKET, BY PURITY GRADE, 2018-2033 (USD THOUSAND)
TABLE 5420 SOUTH AMERICA SMART LIGHTING IN INDIUM MARKET, BY PURITY GRADE, 2018-2033 (USD THOUSAND)
TABLE 5421 SOUTH AMERICA TELECOMMUNICATION EQUIPMENT INDUSTRY IN INDIUM MARKET, BY TYPE, 2018-2033 (USD THOUSAND)
TABLE 5422 SOUTH AMERICA OPTICAL TRANSCEIVERS IN INDIUM MARKET, BY PURITY GRADE, 2018-2033 (USD THOUSAND)
TABLE 5423 SOUTH AMERICA RF POWER AMPLIFIERS IN INDIUM MARKET, BY PURITY GRADE, 2018-2033 (USD THOUSAND)
TABLE 5424 SOUTH AMERICA HIGH-FREQUENCY COMMUNICATION CHIPS IN INDIUM MARKET, BY PURITY GRADE, 2018-2033 (USD THOUSAND)
TABLE 5425 SOUTH AMERICA FIBER-OPTIC COMMUNICATION LASERS IN INDIUM MARKET, BY PURITY GRADE, 2018-2033 (USD THOUSAND)
TABLE 5426 SOUTH AMERICA PHOTODETECTORS FOR OPTICAL NETWORKS IN INDIUM MARKET, BY PURITY GRADE, 2018-2033 (USD THOUSAND)
TABLE 5427 SOUTH AMERICA 5G INFRASTRUCTURE COMPONENTS IN INDIUM MARKET, BY PURITY GRADE, 2018-2033 (USD THOUSAND)
TABLE 5428 SOUTH AMERICA OPTICAL NETWORK SWITCHING DEVICES IN INDIUM MARKET, BY PURITY GRADE, 2018-2033 (USD THOUSAND)
TABLE 5429 SOUTH AMERICA SATELLITE COMMUNICATION MODULES IN INDIUM MARKET, BY PURITY GRADE, 2018-2033 (USD THOUSAND)
TABLE 5430 SOUTH AMERICA OPTICAL & PHOTONICS INDUSTRY IN INDIUM MARKET, BY TYPE, 2018-2033 (USD THOUSAND)
TABLE 5431 SOUTH AMERICA OPTICAL COATINGS IN INDIUM MARKET, BY PURITY GRADE, 2018-2033 (USD THOUSAND)
TABLE 5432 SOUTH AMERICA FIBER OPTIC COMPONENTS IN INDIUM MARKET, BY PURITY GRADE, 2018-2033 (USD THOUSAND)
TABLE 5433 SOUTH AMERICA LASER COMPONENTS IN INDIUM MARKET, BY PURITY GRADE, 2018-2033 (USD THOUSAND)
TABLE 5434 SOUTH AMERICA OPTICAL SENSORS IN INDIUM MARKET, BY PURITY GRADE, 2018-2033 (USD THOUSAND)
TABLE 5435 SOUTH AMERICA INFRARED OPTICS IN INDIUM MARKET, BY PURITY GRADE, 2018-2033 (USD THOUSAND)
TABLE 5436 SOUTH AMERICA PICS IN INDIUM MARKET, BY PURITY GRADE, 2018-2033 (USD THOUSAND)
TABLE 5437 SOUTH AMERICA MIRRORS IN INDIUM MARKET, BY PURITY GRADE, 2018-2033 (USD THOUSAND)
TABLE 5438 SOUTH AMERICA SPECTROSCOPY IN INDIUM MARKET, BY PURITY GRADE, 2018-2033 (USD THOUSAND)
TABLE 5439 SOUTH AMERICA AEROSPACE & DEFENSE INDUSTRY IN INDIUM MARKET, BY TYPE, 2018-2033 (USD THOUSAND)
TABLE 5440 SOUTH AMERICA INFRARED IMAGING SYSTEMS IN INDIUM MARKET, BY PURITY GRADE, 2018-2033 (USD THOUSAND)
TABLE 5441 SOUTH AMERICA RADAR & RF COMPONENTS IN INDIUM MARKET, BY PURITY GRADE, 2018-2033 (USD THOUSAND)
TABLE 5442 SOUTH AMERICA SATELLITE COMMUNICATION IN INDIUM MARKET, BY PURITY GRADE, 2018-2033 (USD THOUSAND)
TABLE 5443 SOUTH AMERICA MILITARY OPTOELECTRONICS IN INDIUM MARKET, BY PURITY GRADE, 2018-2033 (USD THOUSAND)
TABLE 5444 SOUTH AMERICA AVIONICS DISPLAYS IN INDIUM MARKET, BY PURITY GRADE, 2018-2033 (USD THOUSAND)
TABLE 5445 SOUTH AMERICA SPACECRAFT SOLAR PANELS IN INDIUM MARKET, BY PURITY GRADE, 2018-2033 (USD THOUSAND)
TABLE 5446 SOUTH AMERICA THERMAL MATERIALS IN INDIUM MARKET, BY PURITY GRADE, 2018-2033 (USD THOUSAND)
TABLE 5447 SOUTH AMERICA CRYOGENIC MATERIALS IN INDIUM MARKET, BY PURITY GRADE, 2018-2033 (USD THOUSAND)
TABLE 5448 SOUTH AMERICA MEDICAL DEVICE INDUSTRY IN INDIUM MARKET, BY TYPE, 2018-2033 (USD THOUSAND)
TABLE 5449 SOUTH AMERICA MEDICAL IMAGING SENSORS IN INDIUM MARKET, BY PURITY GRADE, 2018-2033 (USD THOUSAND)
TABLE 5450 SOUTH AMERICA DIAGNOSTIC EQUIPMENT DISPLAYS IN INDIUM MARKET, BY PURITY GRADE, 2018-2033 (USD THOUSAND)
TABLE 5451 SOUTH AMERICA ADVANCED DIAGNOSTIC INSTRUMENTS IN INDIUM MARKET, BY PURITY GRADE, 2018-2033 (USD THOUSAND)
TABLE 5452 SOUTH AMERICA LASER SURGICAL EQUIPMENT IN INDIUM MARKET, BY PURITY GRADE, 2018-2033 (USD THOUSAND)
TABLE 5453 SOUTH AMERICA BIOMEDICAL OPTICAL DEVICES IN INDIUM MARKET, BY PURITY GRADE, 2018-2033 (USD THOUSAND)
TABLE 5454 SOUTH AMERICA RADIATION DETECTION EQUIPMENT IN INDIUM MARKET, BY PURITY GRADE, 2018-2033 (USD THOUSAND)
TABLE 5455 SOUTH AMERICA INFRARED MEDICAL SENSORS IN INDIUM MARKET, BY PURITY GRADE, 2018-2033 (USD THOUSAND)
TABLE 5456 SOUTH AMERICA PHOTOTHERAPY DEVICES IN INDIUM MARKET, BY PURITY GRADE, 2018-2033 (USD THOUSAND)
TABLE 5457 SOUTH AMERICA INDUSTRIAL EQUIPMENT MANUFACTURING IN INDIUM MARKET, BY TYPE, 2018-2033 (USD THOUSAND)
TABLE 5458 SOUTH AMERICA INDUSTRIAL SENSORS IN INDIUM MARKET, BY PURITY GRADE, 2018-2033 (USD THOUSAND)
TABLE 5459 SOUTH AMERICA VACUUM DEPOSITION COATINGS IN INDIUM MARKET, BY PURITY GRADE, 2018-2033 (USD THOUSAND)
TABLE 5460 SOUTH AMERICA PRECISION OPTICAL COMPONENTS IN INDIUM MARKET, BY PURITY GRADE, 2018-2033 (USD THOUSAND)
TABLE 5461 SOUTH AMERICA THERMAL INTERFACE MATERIALS IN INDIUM MARKET, BY PURITY GRADE, 2018-2033 (USD THOUSAND)
TABLE 5462 SOUTH AMERICA INDUSTRIAL LASER SYSTEMS IN INDIUM MARKET, BY PURITY GRADE, 2018-2033 (USD THOUSAND)
TABLE 5463 SOUTH AMERICA INDUSTRIAL INFRARED DETECTORS IN INDIUM MARKET, BY PURITY GRADE, 2018-2033 (USD THOUSAND)
TABLE 5464 SOUTH AMERICA PRECISION MEASUREMENT EQUIPMENT IN INDIUM MARKET, BY PURITY GRADE, 2018-2033 (USD THOUSAND)
TABLE 5465 SOUTH AMERICA SPECIALTY ELECTRONIC COMPONENTS IN INDIUM MARKET, BY PURITY GRADE, 2018-2033 (USD THOUSAND)
TABLE 5466 SOUTH AMERICA OTHERS IN INDIUM MARKET, BY TYPE, 2018-2033 (USD THOUSAND)
TABLE 5467 SOUTH AMERICA ADVANCED MATERIALS MANUFACTURING IN INDIUM MARKET, BY PURITY GRADE, 2018-2033 (USD THOUSAND)
TABLE 5468 SOUTH AMERICA SPECIALTY ALLOY PRODUCTION IN INDIUM MARKET, BY PURITY GRADE, 2018-2033 (USD THOUSAND)
TABLE 5469 SOUTH AMERICA THERMAL MANAGEMENT MATERIALS IN INDIUM MARKET, BY PURITY GRADE, 2018-2033 (USD THOUSAND)
TABLE 5470 SOUTH AMERICA PRECISION SCIENTIFIC INSTRUMENTS IN INDIUM MARKET, BY PURITY GRADE, 2018-2033 (USD THOUSAND)
TABLE 5471 SOUTH AMERICA RESEARCH INSTITUTES & UNIVERSITIES IN INDIUM MARKET, BY PURITY GRADE, 2018-2033 (USD THOUSAND)
TABLE 5472 SOUTH AMERICA NUCLEAR INDUSTRY APPLICATIONS IN INDIUM MARKET, BY PURITY GRADE, 2018-2033 (USD THOUSAND)
TABLE 5473 SOUTH AMERICA SPECIALTY CHEMICAL PRODUCTION IN INDIUM MARKET, BY PURITY GRADE, 2018-2033 (USD THOUSAND)
TABLE 5474 SOUTH AMERICA DEFENSE RESEARCH LABORATORIES IN INDIUM MARKET, BY PURITY GRADE, 2018-2033 (USD THOUSAND)
TABLE 5475 SOUTH AMERICA CRYOGENIC EQUIPMENT MANUFACTURING IN INDIUM MARKET, BY PURITY GRADE, 2018-2033 (USD THOUSAND)
TABLE 5476 BRAZIL INDIUM MARKET, BY PRODUCT TYPE, 2018-2033 (USD THOUSAND)
TABLE 5477 BRAZIL INGOTS IN INDIUM MARKET, BY TYPE, 2018-2033 (USD THOUSAND)
TABLE 5478 BRAZIL INDIUM MARKET, BY MATERIAL COMPOSITION, 2018-2033 (USD THOUSAND)
TABLE 5479 BRAZIL INDIUM ALLOYS IN INDIUM MARKET, BY TYPE, 2018-2033 (USD THOUSAND)
TABLE 5480 BRAZIL INDIUM COMPOUNDS IN INDIUM MARKET, BY TYPE, 2018-2033 (USD THOUSAND)
TABLE 5481 BRAZIL INDIUM MARKET, BY PURITY GRADE, 2018-2033 (USD THOUSAND)
TABLE 5482 BRAZIL INDIUM MARKET, BY EXTRACTION SOURCE, 2018-2033 (USD THOUSAND)
TABLE 5483 BRAZIL PRIMARY PRODUCTION IN INDIUM MARKET, BY TYPE, 2018-2033 (USD THOUSAND)
TABLE 5484 BRAZIL SECONDARY PRODUCTION IN INDIUM MARKET, BY TYPE, 2018-2033 (USD THOUSAND)
TABLE 5485 BRAZIL INDIUM MARKET, BY DISTRIBUTION CHANNEL, 2018-2033 (USD THOUSAND)
TABLE 5486 BRAZIL INDIUM MARKET, BY TECHNOLOGY PLATFORM, 2018-2033 (USD THOUSAND)
TABLE 5487 BRAZIL INDIUM MARKET, BY END-USER INDUSTRY, 2018-2033 (USD THOUSAND)
TABLE 5488 BRAZIL CONSUMER ELECTRONICS INDUSTRY IN INDIUM MARKET, BY TYPE, 2018-2033 (USD THOUSAND)
TABLE 5489 BRAZIL FLAT PANEL DISPLAYS (LCD/OLED/LED) IN INDIUM MARKET, BY PURITY GRADE, 2018-2033 (USD THOUSAND)
TABLE 5490 BRAZIL TRANSPARENT CONDUCTIVE COATINGS (ITO) IN INDIUM MARKET, BY PURITY GRADE, 2018-2033 (USD THOUSAND)
TABLE 5491 BRAZIL TOUCHSCREEN DISPLAYS IN INDIUM MARKET, BY PURITY GRADE, 2018-2033 (USD THOUSAND)
TABLE 5492 BRAZIL FLEXIBLE DISPLAYS & ELECTRONICS IN INDIUM MARKET, BY PURITY GRADE, 2018-2033 (USD THOUSAND)
TABLE 5493 BRAZIL WEARABLE ELECTRONICS DEVICES IN INDIUM MARKET, BY PURITY GRADE, 2018-2033 (USD THOUSAND)
TABLE 5494 BRAZIL CAMERA & OPTICAL SENSORS IN INDIUM MARKET, BY PURITY GRADE, 2018-2033 (USD THOUSAND)
TABLE 5495 BRAZIL MINI-LED BACKLIGHTING IN INDIUM MARKET, BY PURITY GRADE, 2018-2033 (USD THOUSAND)
TABLE 5496 BRAZIL MICRO-LED DISPLAYS IN INDIUM MARKET, BY PURITY GRADE, 2018-2033 (USD THOUSAND)
TABLE 5497 BRAZIL DISPLAY PANEL INDUSTRY IN INDIUM MARKET, BY TYPE, 2018-2033 (USD THOUSAND)
TABLE 5498 BRAZIL LCD PANEL MANUFACTURING IN INDIUM MARKET, BY PURITY GRADE, 2018-2033 (USD THOUSAND)
TABLE 5499 BRAZIL OLED PANEL MANUFACTURING IN INDIUM MARKET, BY PURITY GRADE, 2018-2033 (USD THOUSAND)
TABLE 5500 BRAZIL DISPLAY PANEL MANUFACTURING IN INDIUM MARKET, BY PURITY GRADE, 2018-2033 (USD THOUSAND)
TABLE 5501 BRAZIL TOUCH PANEL SENSORS IN INDIUM MARKET, BY PURITY GRADE, 2018-2033 (USD THOUSAND)
TABLE 5502 BRAZIL TRANSPARENT CONDUCTIVE FILMS IN INDIUM MARKET, BY PURITY GRADE, 2018-2033 (USD THOUSAND)
TABLE 5503 BRAZIL FLEXIBLE & FOLDABLE DISPLAYS IN INDIUM MARKET, BY PURITY GRADE, 2018-2033 (USD THOUSAND)
TABLE 5504 BRAZIL AR/VR DISPLAYS IN INDIUM MARKET, BY PURITY GRADE, 2018-2033 (USD THOUSAND)
TABLE 5505 BRAZIL MICRODISPLAY DEVICES IN INDIUM MARKET, BY PURITY GRADE, 2018-2033 (USD THOUSAND)
TABLE 5506 BRAZIL BACKPLANE COATINGS IN INDIUM MARKET, BY PURITY GRADE, 2018-2033 (USD THOUSAND)
TABLE 5507 BRAZIL SEMICONDUCTOR INDUSTRY IN INDIUM MARKET, BY TYPE, 2018-2033 (USD THOUSAND)
TABLE 5508 BRAZIL III-V COMPOUND SEMICONDUCTORS IN INDIUM MARKET, BY PURITY GRADE, 2018-2033 (USD THOUSAND)
TABLE 5509 BRAZIL HIGH-FREQUENCY RF COMPONENTS IN INDIUM MARKET, BY PURITY GRADE, 2018-2033 (USD THOUSAND)
TABLE 5510 BRAZIL SEMICONDUCTOR SUBSTRATES & EPITAXY IN INDIUM MARKET, BY PURITY GRADE, 2018-2033 (USD THOUSAND)
TABLE 5511 BRAZIL LASER DIODES IN INDIUM MARKET, BY PURITY GRADE, 2018-2033 (USD THOUSAND)
TABLE 5512 BRAZIL PHOTODETECTORS IN INDIUM MARKET, BY PURITY GRADE, 2018-2033 (USD THOUSAND)
TABLE 5513 BRAZIL HIGH-SPEED OPTOELECTRONICS IN INDIUM MARKET, BY PURITY GRADE, 2018-2033 (USD THOUSAND)
TABLE 5514 BRAZIL INFRARED DETECTORS IN INDIUM MARKET, BY PURITY GRADE, 2018-2033 (USD THOUSAND)
TABLE 5515 BRAZIL INTEGRATED PHOTONIC CIRCUITS IN INDIUM MARKET, BY PURITY GRADE, 2018-2033 (USD THOUSAND)
TABLE 5516 BRAZIL SOLAR PHOTOVOLTAIC INDUSTRY IN INDIUM MARKET, BY TYPE, 2018-2033 (USD THOUSAND)
TABLE 5517 BRAZIL CIGS THIN-FILM SOLAR CELLS IN INDIUM MARKET, BY PURITY GRADE, 2018-2033 (USD THOUSAND)
TABLE 5518 BRAZILHIGH-EFFICIENCY MODULES IN INDIUM MARKET, BY PURITY GRADE, 2018-2033 (USD THOUSAND)
TABLE 5519 BRAZIL THIN-FILM COATINGS IN INDIUM MARKET, BY PURITY GRADE, 2018-2033 (USD THOUSAND)
TABLE 5520 BRAZIL TRANSPARENT ELECTRODES IN INDIUM MARKET, BY PURITY GRADE, 2018-2033 (USD THOUSAND)
TABLE 5521 BRAZIL BIPV IN INDIUM MARKET, BY PURITY GRADE, 2018-2033 (USD THOUSAND)
TABLE 5522 BRAZIL FLEXIBLE SOLAR PANELS IN INDIUM MARKET, BY PURITY GRADE, 2018-2033 (USD THOUSAND)
TABLE 5523 BRAZIL PORTABLE SOLAR SYSTEMS IN INDIUM MARKET, BY PURITY GRADE, 2018-2033 (USD THOUSAND)
TABLE 5524 BRAZIL CONCENTRATED PV IN INDIUM MARKET, BY PURITY GRADE, 2018-2033 (USD THOUSAND)
TABLE 5525 BRAZIL AUTOMOTIVE INDUSTRY IN INDIUM MARKET, BY TYPE, 2018-2033 (USD THOUSAND)
TABLE 5526 BRAZIL AUTOMOTIVE DISPLAY PANELS IN INDIUM MARKET, BY PURITY GRADE, 2018-2033 (USD THOUSAND)
TABLE 5527 BRAZILADAS SENSORS IN INDIUM MARKET, BY PURITY GRADE, 2018-2033 (USD THOUSAND)
TABLE 5528 BRAZIL VEHICLE CAMERA MODULES IN INDIUM MARKET, BY PURITY GRADE, 2018-2033 (USD THOUSAND)
TABLE 5529 BRAZIL AUTOMOTIVE OPTOELECTRONICS IN INDIUM MARKET, BY PURITY GRADE, 2018-2033 (USD THOUSAND)
TABLE 5530 BRAZIL POWER ELECTRONICS IN INDIUM MARKET, BY PURITY GRADE, 2018-2033 (USD THOUSAND)
TABLE 5531 BRAZIL TOUCHSCREEN INTERFACES IN INDIUM MARKET, BY PURITY GRADE, 2018-2033 (USD THOUSAND)
TABLE 5532 BRAZIL INFRARED SENSORS IN INDIUM MARKET, BY PURITY GRADE, 2018-2033 (USD THOUSAND)
TABLE 5533 BRAZIL SMART LIGHTING IN INDIUM MARKET, BY PURITY GRADE, 2018-2033 (USD THOUSAND)
TABLE 5534 BRAZIL TELECOMMUNICATION EQUIPMENT INDUSTRY IN INDIUM MARKET, BY TYPE, 2018-2033 (USD THOUSAND)
TABLE 5535 BRAZIL OPTICAL TRANSCEIVERS IN INDIUM MARKET, BY PURITY GRADE, 2018-2033 (USD THOUSAND)
TABLE 5536 BRAZIL RF POWER AMPLIFIERS IN INDIUM MARKET, BY PURITY GRADE, 2018-2033 (USD THOUSAND)
TABLE 5537 BRAZIL HIGH-FREQUENCY COMMUNICATION CHIPS IN INDIUM MARKET, BY PURITY GRADE, 2018-2033 (USD THOUSAND)
TABLE 5538 BRAZIL FIBER-OPTIC COMMUNICATION LASERS IN INDIUM MARKET, BY PURITY GRADE, 2018-2033 (USD THOUSAND)
TABLE 5539 BRAZIL PHOTODETECTORS FOR OPTICAL NETWORKS IN INDIUM MARKET, BY PURITY GRADE, 2018-2033 (USD THOUSAND)
TABLE 5540 BRAZIL 5G INFRASTRUCTURE COMPONENTS IN INDIUM MARKET, BY PURITY GRADE, 2018-2033 (USD THOUSAND)
TABLE 5541 BRAZIL OPTICAL NETWORK SWITCHING DEVICES IN INDIUM MARKET, BY PURITY GRADE, 2018-2033 (USD THOUSAND)
TABLE 5542 BRAZIL SATELLITE COMMUNICATION MODULES IN INDIUM MARKET, BY PURITY GRADE, 2018-2033 (USD THOUSAND)
TABLE 5543 BRAZIL OPTICAL & PHOTONICS INDUSTRY IN INDIUM MARKET, BY TYPE, 2018-2033 (USD THOUSAND)
TABLE 5544 BRAZIL OPTICAL COATINGS IN INDIUM MARKET, BY PURITY GRADE, 2018-2033 (USD THOUSAND)
TABLE 5545 BRAZIL FIBER OPTIC COMPONENTS IN INDIUM MARKET, BY PURITY GRADE, 2018-2033 (USD THOUSAND)
TABLE 5546 BRAZIL LASER COMPONENTS IN INDIUM MARKET, BY PURITY GRADE, 2018-2033 (USD THOUSAND)
TABLE 5547 BRAZIL OPTICAL SENSORS IN INDIUM MARKET, BY PURITY GRADE, 2018-2033 (USD THOUSAND)
TABLE 5548 BRAZIL INFRARED OPTICS IN INDIUM MARKET, BY PURITY GRADE, 2018-2033 (USD THOUSAND)
TABLE 5549 BRAZIL PICS IN INDIUM MARKET, BY PURITY GRADE, 2018-2033 (USD THOUSAND)
TABLE 5550 BRAZIL MIRRORS IN INDIUM MARKET, BY PURITY GRADE, 2018-2033 (USD THOUSAND)
TABLE 5551 BRAZIL SPECTROSCOPY IN INDIUM MARKET, BY PURITY GRADE, 2018-2033 (USD THOUSAND)
TABLE 5552 BRAZIL AEROSPACE & DEFENSE INDUSTRY IN INDIUM MARKET, BY TYPE, 2018-2033 (USD THOUSAND)
TABLE 5553 BRAZIL INFRARED IMAGING SYSTEMS IN INDIUM MARKET, BY PURITY GRADE, 2018-2033 (USD THOUSAND)
TABLE 5554 BRAZIL RADAR & RF COMPONENTS IN INDIUM MARKET, BY PURITY GRADE, 2018-2033 (USD THOUSAND)
TABLE 5555 BRAZIL SATELLITE COMMUNICATION IN INDIUM MARKET, BY PURITY GRADE, 2018-2033 (USD THOUSAND)
TABLE 5556 BRAZIL MILITARY OPTOELECTRONICS IN INDIUM MARKET, BY PURITY GRADE, 2018-2033 (USD THOUSAND)
TABLE 5557 BRAZIL AVIONICS DISPLAYS IN INDIUM MARKET, BY PURITY GRADE, 2018-2033 (USD THOUSAND)
TABLE 5558 BRAZIL SPACECRAFT SOLAR PANELS IN INDIUM MARKET, BY PURITY GRADE, 2018-2033 (USD THOUSAND)
TABLE 5559 BRAZIL THERMAL MATERIALS IN INDIUM MARKET, BY PURITY GRADE, 2018-2033 (USD THOUSAND)
TABLE 5560 BRAZIL CRYOGENIC MATERIALS IN INDIUM MARKET, BY PURITY GRADE, 2018-2033 (USD THOUSAND)
TABLE 5561 BRAZIL MEDICAL DEVICE INDUSTRY IN INDIUM MARKET, BY TYPE, 2018-2033 (USD THOUSAND)
TABLE 5562 BRAZIL MEDICAL IMAGING SENSORS IN INDIUM MARKET, BY PURITY GRADE, 2018-2033 (USD THOUSAND)
TABLE 5563 BRAZIL DIAGNOSTIC EQUIPMENT DISPLAYS IN INDIUM MARKET, BY PURITY GRADE, 2018-2033 (USD THOUSAND)
TABLE 5564 BRAZIL ADVANCED DIAGNOSTIC INSTRUMENTS IN INDIUM MARKET, BY PURITY GRADE, 2018-2033 (USD THOUSAND)
TABLE 5565 BRAZIL LASER SURGICAL EQUIPMENT IN INDIUM MARKET, BY PURITY GRADE, 2018-2033 (USD THOUSAND)
TABLE 5566 BRAZIL BIOMEDICAL OPTICAL DEVICES IN INDIUM MARKET, BY PURITY GRADE, 2018-2033 (USD THOUSAND)
TABLE 5567 BRAZIL RADIATION DETECTION EQUIPMENT IN INDIUM MARKET, BY PURITY GRADE, 2018-2033 (USD THOUSAND)
TABLE 5568 BRAZIL INFRARED MEDICAL SENSORS IN INDIUM MARKET, BY PURITY GRADE, 2018-2033 (USD THOUSAND)
TABLE 5569 BRAZIL PHOTOTHERAPY DEVICES IN INDIUM MARKET, BY PURITY GRADE, 2018-2033 (USD THOUSAND)
TABLE 5570 BRAZIL INDUSTRIAL EQUIPMENT MANUFACTURING IN INDIUM MARKET, BY TYPE, 2018-2033 (USD THOUSAND)
TABLE 5571 BRAZIL INDUSTRIAL SENSORS IN INDIUM MARKET, BY PURITY GRADE, 2018-2033 (USD THOUSAND)
TABLE 5572 BRAZIL VACUUM DEPOSITION COATINGS IN INDIUM MARKET, BY PURITY GRADE, 2018-2033 (USD THOUSAND)
TABLE 5573 BRAZIL PRECISION OPTICAL COMPONENTS IN INDIUM MARKET, BY PURITY GRADE, 2018-2033 (USD THOUSAND)
TABLE 5574 BRAZIL THERMAL INTERFACE MATERIALS IN INDIUM MARKET, BY PURITY GRADE, 2018-2033 (USD THOUSAND)
TABLE 5575 BRAZIL INDUSTRIAL LASER SYSTEMS IN INDIUM MARKET, BY PURITY GRADE, 2018-2033 (USD THOUSAND)
TABLE 5576 BRAZIL INDUSTRIAL INFRARED DETECTORS IN INDIUM MARKET, BY PURITY GRADE, 2018-2033 (USD THOUSAND)
TABLE 5577 BRAZIL PRECISION MEASUREMENT EQUIPMENT IN INDIUM MARKET, BY PURITY GRADE, 2018-2033 (USD THOUSAND)
TABLE 5578 BRAZIL SPECIALTY ELECTRONIC COMPONENTS IN INDIUM MARKET, BY PURITY GRADE, 2018-2033 (USD THOUSAND)
TABLE 5579 BRAZIL OTHERS IN INDIUM MARKET, BY TYPE, 2018-2033 (USD THOUSAND)
TABLE 5580 BRAZIL ADVANCED MATERIALS MANUFACTURING IN INDIUM MARKET, BY PURITY GRADE, 2018-2033 (USD THOUSAND)
TABLE 5581 BRAZIL SPECIALTY ALLOY PRODUCTION IN INDIUM MARKET, BY PURITY GRADE, 2018-2033 (USD THOUSAND)
TABLE 5582 BRAZIL THERMAL MANAGEMENT MATERIALS IN INDIUM MARKET, BY PURITY GRADE, 2018-2033 (USD THOUSAND)
TABLE 5583 BRAZIL PRECISION SCIENTIFIC INSTRUMENTS IN INDIUM MARKET, BY PURITY GRADE, 2018-2033 (USD THOUSAND)
TABLE 5584 BRAZIL RESEARCH INSTITUTES & UNIVERSITIES IN INDIUM MARKET, BY PURITY GRADE, 2018-2033 (USD THOUSAND)
TABLE 5585 BRAZIL NUCLEAR INDUSTRY APPLICATIONS IN INDIUM MARKET, BY PURITY GRADE, 2018-2033 (USD THOUSAND)
TABLE 5586 BRAZIL SPECIALTY CHEMICAL PRODUCTION IN INDIUM MARKET, BY PURITY GRADE, 2018-2033 (USD THOUSAND)
TABLE 5587 BRAZIL DEFENSE RESEARCH LABORATORIES IN INDIUM MARKET, BY PURITY GRADE, 2018-2033 (USD THOUSAND)
TABLE 5588 BRAZIL CRYOGENIC EQUIPMENT MANUFACTURING IN INDIUM MARKET, BY PURITY GRADE, 2018-2033 (USD THOUSAND)
TABLE 5589 PERU INDIUM MARKET, BY PRODUCT TYPE, 2018-2033 (USD THOUSAND)
TABLE 5590 PERU INGOTS IN INDIUM MARKET, BY TYPE, 2018-2033 (USD THOUSAND)
TABLE 5591 PERU INDIUM MARKET, BY MATERIAL COMPOSITION, 2018-2033 (USD THOUSAND)
TABLE 5592 PERU INDIUM ALLOYS IN INDIUM MARKET, BY TYPE, 2018-2033 (USD THOUSAND)
TABLE 5593 PERU INDIUM COMPOUNDS IN INDIUM MARKET, BY TYPE, 2018-2033 (USD THOUSAND)
TABLE 5594 PERU INDIUM MARKET, BY PURITY GRADE, 2018-2033 (USD THOUSAND)
TABLE 5595 PERU INDIUM MARKET, BY EXTRACTION SOURCE, 2018-2033 (USD THOUSAND)
TABLE 5596 PERU PRIMARY PRODUCTION IN INDIUM MARKET, BY TYPE, 2018-2033 (USD THOUSAND)
TABLE 5597 PERU SECONDARY PRODUCTION IN INDIUM MARKET, BY TYPE, 2018-2033 (USD THOUSAND)
TABLE 5598 PERU INDIUM MARKET, BY DISTRIBUTION CHANNEL, 2018-2033 (USD THOUSAND)
TABLE 5599 PERU INDIUM MARKET, BY TECHNOLOGY PLATFORM, 2018-2033 (USD THOUSAND)
TABLE 5600 PERU INDIUM MARKET, BY END-USER INDUSTRY, 2018-2033 (USD THOUSAND)
TABLE 5601 PERU CONSUMER ELECTRONICS INDUSTRY IN INDIUM MARKET, BY TYPE, 2018-2033 (USD THOUSAND)
TABLE 5602 PERU FLAT PANEL DISPLAYS (LCD/OLED/LED) IN INDIUM MARKET, BY PURITY GRADE, 2018-2033 (USD THOUSAND)
TABLE 5603 PERU TRANSPARENT CONDUCTIVE COATINGS (ITO) IN INDIUM MARKET, BY PURITY GRADE, 2018-2033 (USD THOUSAND)
TABLE 5604 PERU TOUCHSCREEN DISPLAYS IN INDIUM MARKET, BY PURITY GRADE, 2018-2033 (USD THOUSAND)
TABLE 5605 PERU FLEXIBLE DISPLAYS & ELECTRONICS IN INDIUM MARKET, BY PURITY GRADE, 2018-2033 (USD THOUSAND)
TABLE 5606 PERU WEARABLE ELECTRONICS DEVICES IN INDIUM MARKET, BY PURITY GRADE, 2018-2033 (USD THOUSAND)
TABLE 5607 PERU CAMERA & OPTICAL SENSORS IN INDIUM MARKET, BY PURITY GRADE, 2018-2033 (USD THOUSAND)
TABLE 5608 PERU MINI-LED BACKLIGHTING IN INDIUM MARKET, BY PURITY GRADE, 2018-2033 (USD THOUSAND)
TABLE 5609 PERU MICRO-LED DISPLAYS IN INDIUM MARKET, BY PURITY GRADE, 2018-2033 (USD THOUSAND)
TABLE 5610 PERU DISPLAY PANEL INDUSTRY IN INDIUM MARKET, BY TYPE, 2018-2033 (USD THOUSAND)
TABLE 5611 PERU LCD PANEL MANUFACTURING IN INDIUM MARKET, BY PURITY GRADE, 2018-2033 (USD THOUSAND)
TABLE 5612 PERU OLED PANEL MANUFACTURING IN INDIUM MARKET, BY PURITY GRADE, 2018-2033 (USD THOUSAND)
TABLE 5613 PERU DISPLAY PANEL MANUFACTURING IN INDIUM MARKET, BY PURITY GRADE, 2018-2033 (USD THOUSAND)
TABLE 5614 PERU TOUCH PANEL SENSORS IN INDIUM MARKET, BY PURITY GRADE, 2018-2033 (USD THOUSAND)
TABLE 5615 PERU TRANSPARENT CONDUCTIVE FILMS IN INDIUM MARKET, BY PURITY GRADE, 2018-2033 (USD THOUSAND)
TABLE 5616 PERU FLEXIBLE & FOLDABLE DISPLAYS IN INDIUM MARKET, BY PURITY GRADE, 2018-2033 (USD THOUSAND)
TABLE 5617 PERU AR/VR DISPLAYS IN INDIUM MARKET, BY PURITY GRADE, 2018-2033 (USD THOUSAND)
TABLE 5618 PERU MICRODISPLAY DEVICES IN INDIUM MARKET, BY PURITY GRADE, 2018-2033 (USD THOUSAND)
TABLE 5619 PERU BACKPLANE COATINGS IN INDIUM MARKET, BY PURITY GRADE, 2018-2033 (USD THOUSAND)
TABLE 5620 PERU SEMICONDUCTOR INDUSTRY IN INDIUM MARKET, BY TYPE, 2018-2033 (USD THOUSAND)
TABLE 5621 PERU III-V COMPOUND SEMICONDUCTORS IN INDIUM MARKET, BY PURITY GRADE, 2018-2033 (USD THOUSAND)
TABLE 5622 PERU HIGH-FREQUENCY RF COMPONENTS IN INDIUM MARKET, BY PURITY GRADE, 2018-2033 (USD THOUSAND)
TABLE 5623 PERU SEMICONDUCTOR SUBSTRATES & EPITAXY IN INDIUM MARKET, BY PURITY GRADE, 2018-2033 (USD THOUSAND)
TABLE 5624 PERU LASER DIODES IN INDIUM MARKET, BY PURITY GRADE, 2018-2033 (USD THOUSAND)
TABLE 5625 PERU PHOTODETECTORS IN INDIUM MARKET, BY PURITY GRADE, 2018-2033 (USD THOUSAND)
TABLE 5626 PERU HIGH-SPEED OPTOELECTRONICS IN INDIUM MARKET, BY PURITY GRADE, 2018-2033 (USD THOUSAND)
TABLE 5627 PERU INFRARED DETECTORS IN INDIUM MARKET, BY PURITY GRADE, 2018-2033 (USD THOUSAND)
TABLE 5628 PERU INTEGRATED PHOTONIC CIRCUITS IN INDIUM MARKET, BY PURITY GRADE, 2018-2033 (USD THOUSAND)
TABLE 5629 PERU SOLAR PHOTOVOLTAIC INDUSTRY IN INDIUM MARKET, BY TYPE, 2018-2033 (USD THOUSAND)
TABLE 5630 PERU CIGS THIN-FILM SOLAR CELLS IN INDIUM MARKET, BY PURITY GRADE, 2018-2033 (USD THOUSAND)
TABLE 5631 PERUHIGH-EFFICIENCY MODULES IN INDIUM MARKET, BY PURITY GRADE, 2018-2033 (USD THOUSAND)
TABLE 5632 PERU THIN-FILM COATINGS IN INDIUM MARKET, BY PURITY GRADE, 2018-2033 (USD THOUSAND)
TABLE 5633 PERU TRANSPARENT ELECTRODES IN INDIUM MARKET, BY PURITY GRADE, 2018-2033 (USD THOUSAND)
TABLE 5634 PERU BIPV IN INDIUM MARKET, BY PURITY GRADE, 2018-2033 (USD THOUSAND)
TABLE 5635 PERU FLEXIBLE SOLAR PANELS IN INDIUM MARKET, BY PURITY GRADE, 2018-2033 (USD THOUSAND)
TABLE 5636 PERU PORTABLE SOLAR SYSTEMS IN INDIUM MARKET, BY PURITY GRADE, 2018-2033 (USD THOUSAND)
TABLE 5637 PERU CONCENTRATED PV IN INDIUM MARKET, BY PURITY GRADE, 2018-2033 (USD THOUSAND)
TABLE 5638 PERU AUTOMOTIVE INDUSTRY IN INDIUM MARKET, BY TYPE, 2018-2033 (USD THOUSAND)
TABLE 5639 PERU AUTOMOTIVE DISPLAY PANELS IN INDIUM MARKET, BY PURITY GRADE, 2018-2033 (USD THOUSAND)
TABLE 5640 PERUADAS SENSORS IN INDIUM MARKET, BY PURITY GRADE, 2018-2033 (USD THOUSAND)
TABLE 5641 PERU VEHICLE CAMERA MODULES IN INDIUM MARKET, BY PURITY GRADE, 2018-2033 (USD THOUSAND)
TABLE 5642 PERU AUTOMOTIVE OPTOELECTRONICS IN INDIUM MARKET, BY PURITY GRADE, 2018-2033 (USD THOUSAND)
TABLE 5643 PERU POWER ELECTRONICS IN INDIUM MARKET, BY PURITY GRADE, 2018-2033 (USD THOUSAND)
TABLE 5644 PERU TOUCHSCREEN INTERFACES IN INDIUM MARKET, BY PURITY GRADE, 2018-2033 (USD THOUSAND)
TABLE 5645 PERU INFRARED SENSORS IN INDIUM MARKET, BY PURITY GRADE, 2018-2033 (USD THOUSAND)
TABLE 5646 PERU SMART LIGHTING IN INDIUM MARKET, BY PURITY GRADE, 2018-2033 (USD THOUSAND)
TABLE 5647 PERU TELECOMMUNICATION EQUIPMENT INDUSTRY IN INDIUM MARKET, BY TYPE, 2018-2033 (USD THOUSAND)
TABLE 5648 PERU OPTICAL TRANSCEIVERS IN INDIUM MARKET, BY PURITY GRADE, 2018-2033 (USD THOUSAND)
TABLE 5649 PERU RF POWER AMPLIFIERS IN INDIUM MARKET, BY PURITY GRADE, 2018-2033 (USD THOUSAND)
TABLE 5650 PERU HIGH-FREQUENCY COMMUNICATION CHIPS IN INDIUM MARKET, BY PURITY GRADE, 2018-2033 (USD THOUSAND)
TABLE 5651 PERU FIBER-OPTIC COMMUNICATION LASERS IN INDIUM MARKET, BY PURITY GRADE, 2018-2033 (USD THOUSAND)
TABLE 5652 PERU PHOTODETECTORS FOR OPTICAL NETWORKS IN INDIUM MARKET, BY PURITY GRADE, 2018-2033 (USD THOUSAND)
TABLE 5653 PERU 5G INFRASTRUCTURE COMPONENTS IN INDIUM MARKET, BY PURITY GRADE, 2018-2033 (USD THOUSAND)
TABLE 5654 PERU OPTICAL NETWORK SWITCHING DEVICES IN INDIUM MARKET, BY PURITY GRADE, 2018-2033 (USD THOUSAND)
TABLE 5655 PERU SATELLITE COMMUNICATION MODULES IN INDIUM MARKET, BY PURITY GRADE, 2018-2033 (USD THOUSAND)
TABLE 5656 PERU OPTICAL & PHOTONICS INDUSTRY IN INDIUM MARKET, BY TYPE, 2018-2033 (USD THOUSAND)
TABLE 5657 PERU OPTICAL COATINGS IN INDIUM MARKET, BY PURITY GRADE, 2018-2033 (USD THOUSAND)
TABLE 5658 PERU FIBER OPTIC COMPONENTS IN INDIUM MARKET, BY PURITY GRADE, 2018-2033 (USD THOUSAND)
TABLE 5659 PERU LASER COMPONENTS IN INDIUM MARKET, BY PURITY GRADE, 2018-2033 (USD THOUSAND)
TABLE 5660 PERU OPTICAL SENSORS IN INDIUM MARKET, BY PURITY GRADE, 2018-2033 (USD THOUSAND)
TABLE 5661 PERU INFRARED OPTICS IN INDIUM MARKET, BY PURITY GRADE, 2018-2033 (USD THOUSAND)
TABLE 5662 PERU PICS IN INDIUM MARKET, BY PURITY GRADE, 2018-2033 (USD THOUSAND)
TABLE 5663 PERU MIRRORS IN INDIUM MARKET, BY PURITY GRADE, 2018-2033 (USD THOUSAND)
TABLE 5664 PERU SPECTROSCOPY IN INDIUM MARKET, BY PURITY GRADE, 2018-2033 (USD THOUSAND)
TABLE 5665 PERU AEROSPACE & DEFENSE INDUSTRY IN INDIUM MARKET, BY TYPE, 2018-2033 (USD THOUSAND)
TABLE 5666 PERU INFRARED IMAGING SYSTEMS IN INDIUM MARKET, BY PURITY GRADE, 2018-2033 (USD THOUSAND)
TABLE 5667 PERU RADAR & RF COMPONENTS IN INDIUM MARKET, BY PURITY GRADE, 2018-2033 (USD THOUSAND)
TABLE 5668 PERU SATELLITE COMMUNICATION IN INDIUM MARKET, BY PURITY GRADE, 2018-2033 (USD THOUSAND)
TABLE 5669 PERU MILITARY OPTOELECTRONICS IN INDIUM MARKET, BY PURITY GRADE, 2018-2033 (USD THOUSAND)
TABLE 5670 PERU AVIONICS DISPLAYS IN INDIUM MARKET, BY PURITY GRADE, 2018-2033 (USD THOUSAND)
TABLE 5671 PERU SPACECRAFT SOLAR PANELS IN INDIUM MARKET, BY PURITY GRADE, 2018-2033 (USD THOUSAND)
TABLE 5672 PERU THERMAL MATERIALS IN INDIUM MARKET, BY PURITY GRADE, 2018-2033 (USD THOUSAND)
TABLE 5673 PERU CRYOGENIC MATERIALS IN INDIUM MARKET, BY PURITY GRADE, 2018-2033 (USD THOUSAND)
TABLE 5674 PERU MEDICAL DEVICE INDUSTRY IN INDIUM MARKET, BY TYPE, 2018-2033 (USD THOUSAND)
TABLE 5675 PERU MEDICAL IMAGING SENSORS IN INDIUM MARKET, BY PURITY GRADE, 2018-2033 (USD THOUSAND)
TABLE 5676 PERU DIAGNOSTIC EQUIPMENT DISPLAYS IN INDIUM MARKET, BY PURITY GRADE, 2018-2033 (USD THOUSAND)
TABLE 5677 PERU ADVANCED DIAGNOSTIC INSTRUMENTS IN INDIUM MARKET, BY PURITY GRADE, 2018-2033 (USD THOUSAND)
TABLE 5678 PERU LASER SURGICAL EQUIPMENT IN INDIUM MARKET, BY PURITY GRADE, 2018-2033 (USD THOUSAND)
TABLE 5679 PERU BIOMEDICAL OPTICAL DEVICES IN INDIUM MARKET, BY PURITY GRADE, 2018-2033 (USD THOUSAND)
TABLE 5680 PERU RADIATION DETECTION EQUIPMENT IN INDIUM MARKET, BY PURITY GRADE, 2018-2033 (USD THOUSAND)
TABLE 5681 PERU INFRARED MEDICAL SENSORS IN INDIUM MARKET, BY PURITY GRADE, 2018-2033 (USD THOUSAND)
TABLE 5682 PERU PHOTOTHERAPY DEVICES IN INDIUM MARKET, BY PURITY GRADE, 2018-2033 (USD THOUSAND)
TABLE 5683 PERU INDUSTRIAL EQUIPMENT MANUFACTURING IN INDIUM MARKET, BY TYPE, 2018-2033 (USD THOUSAND)
TABLE 5684 PERU INDUSTRIAL SENSORS IN INDIUM MARKET, BY PURITY GRADE, 2018-2033 (USD THOUSAND)
TABLE 5685 PERU VACUUM DEPOSITION COATINGS IN INDIUM MARKET, BY PURITY GRADE, 2018-2033 (USD THOUSAND)
TABLE 5686 PERU PRECISION OPTICAL COMPONENTS IN INDIUM MARKET, BY PURITY GRADE, 2018-2033 (USD THOUSAND)
TABLE 5687 PERU THERMAL INTERFACE MATERIALS IN INDIUM MARKET, BY PURITY GRADE, 2018-2033 (USD THOUSAND)
TABLE 5688 PERU INDUSTRIAL LASER SYSTEMS IN INDIUM MARKET, BY PURITY GRADE, 2018-2033 (USD THOUSAND)
TABLE 5689 PERU INDUSTRIAL INFRARED DETECTORS IN INDIUM MARKET, BY PURITY GRADE, 2018-2033 (USD THOUSAND)
TABLE 5690 PERU PRECISION MEASUREMENT EQUIPMENT IN INDIUM MARKET, BY PURITY GRADE, 2018-2033 (USD THOUSAND)
TABLE 5691 PERU SPECIALTY ELECTRONIC COMPONENTS IN INDIUM MARKET, BY PURITY GRADE, 2018-2033 (USD THOUSAND)
TABLE 5692 PERU OTHERS IN INDIUM MARKET, BY TYPE, 2018-2033 (USD THOUSAND)
TABLE 5693 PERU ADVANCED MATERIALS MANUFACTURING IN INDIUM MARKET, BY PURITY GRADE, 2018-2033 (USD THOUSAND)
TABLE 5694 PERU SPECIALTY ALLOY PRODUCTION IN INDIUM MARKET, BY PURITY GRADE, 2018-2033 (USD THOUSAND)
TABLE 5695 PERU THERMAL MANAGEMENT MATERIALS IN INDIUM MARKET, BY PURITY GRADE, 2018-2033 (USD THOUSAND)
TABLE 5696 PERU PRECISION SCIENTIFIC INSTRUMENTS IN INDIUM MARKET, BY PURITY GRADE, 2018-2033 (USD THOUSAND)
TABLE 5697 PERU RESEARCH INSTITUTES & UNIVERSITIES IN INDIUM MARKET, BY PURITY GRADE, 2018-2033 (USD THOUSAND)
TABLE 5698 PERU NUCLEAR INDUSTRY APPLICATIONS IN INDIUM MARKET, BY PURITY GRADE, 2018-2033 (USD THOUSAND)
TABLE 5699 PERU SPECIALTY CHEMICAL PRODUCTION IN INDIUM MARKET, BY PURITY GRADE, 2018-2033 (USD THOUSAND)
TABLE 5700 PERU DEFENSE RESEARCH LABORATORIES IN INDIUM MARKET, BY PURITY GRADE, 2018-2033 (USD THOUSAND)
TABLE 5701 PERU CRYOGENIC EQUIPMENT MANUFACTURING IN INDIUM MARKET, BY PURITY GRADE, 2018-2033 (USD THOUSAND)
TABLE 5702 CHILE INDIUM MARKET, BY PRODUCT TYPE, 2018-2033 (USD THOUSAND)
TABLE 5703 CHILE INGOTS IN INDIUM MARKET, BY TYPE, 2018-2033 (USD THOUSAND)
TABLE 5704 CHILE INDIUM MARKET, BY MATERIAL COMPOSITION, 2018-2033 (USD THOUSAND)
TABLE 5705 CHILE INDIUM ALLOYS IN INDIUM MARKET, BY TYPE, 2018-2033 (USD THOUSAND)
TABLE 5706 CHILE INDIUM COMPOUNDS IN INDIUM MARKET, BY TYPE, 2018-2033 (USD THOUSAND)
TABLE 5707 CHILE INDIUM MARKET, BY PURITY GRADE, 2018-2033 (USD THOUSAND)
TABLE 5708 CHILE INDIUM MARKET, BY EXTRACTION SOURCE, 2018-2033 (USD THOUSAND)
TABLE 5709 CHILE PRIMARY PRODUCTION IN INDIUM MARKET, BY TYPE, 2018-2033 (USD THOUSAND)
TABLE 5710 CHILE SECONDARY PRODUCTION IN INDIUM MARKET, BY TYPE, 2018-2033 (USD THOUSAND)
TABLE 5711 CHILE INDIUM MARKET, BY DISTRIBUTION CHANNEL, 2018-2033 (USD THOUSAND)
TABLE 5712 CHILE INDIUM MARKET, BY TECHNOLOGY PLATFORM, 2018-2033 (USD THOUSAND)
TABLE 5713 CHILE INDIUM MARKET, BY END-USER INDUSTRY, 2018-2033 (USD THOUSAND)
TABLE 5714 CHILE CONSUMER ELECTRONICS INDUSTRY IN INDIUM MARKET, BY TYPE, 2018-2033 (USD THOUSAND)
TABLE 5715 CHILE FLAT PANEL DISPLAYS (LCD/OLED/LED) IN INDIUM MARKET, BY PURITY GRADE, 2018-2033 (USD THOUSAND)
TABLE 5716 CHILE TRANSPARENT CONDUCTIVE COATINGS (ITO) IN INDIUM MARKET, BY PURITY GRADE, 2018-2033 (USD THOUSAND)
TABLE 5717 CHILE TOUCHSCREEN DISPLAYS IN INDIUM MARKET, BY PURITY GRADE, 2018-2033 (USD THOUSAND)
TABLE 5718 CHILE FLEXIBLE DISPLAYS & ELECTRONICS IN INDIUM MARKET, BY PURITY GRADE, 2018-2033 (USD THOUSAND)
TABLE 5719 CHILE WEARABLE ELECTRONICS DEVICES IN INDIUM MARKET, BY PURITY GRADE, 2018-2033 (USD THOUSAND)
TABLE 5720 CHILE CAMERA & OPTICAL SENSORS IN INDIUM MARKET, BY PURITY GRADE, 2018-2033 (USD THOUSAND)
TABLE 5721 CHILE MINI-LED BACKLIGHTING IN INDIUM MARKET, BY PURITY GRADE, 2018-2033 (USD THOUSAND)
TABLE 5722 CHILE MICRO-LED DISPLAYS IN INDIUM MARKET, BY PURITY GRADE, 2018-2033 (USD THOUSAND)
TABLE 5723 CHILE DISPLAY PANEL INDUSTRY IN INDIUM MARKET, BY TYPE, 2018-2033 (USD THOUSAND)
TABLE 5724 CHILE LCD PANEL MANUFACTURING IN INDIUM MARKET, BY PURITY GRADE, 2018-2033 (USD THOUSAND)
TABLE 5725 CHILE OLED PANEL MANUFACTURING IN INDIUM MARKET, BY PURITY GRADE, 2018-2033 (USD THOUSAND)
TABLE 5726 CHILE DISPLAY PANEL MANUFACTURING IN INDIUM MARKET, BY PURITY GRADE, 2018-2033 (USD THOUSAND)
TABLE 5727 CHILE TOUCH PANEL SENSORS IN INDIUM MARKET, BY PURITY GRADE, 2018-2033 (USD THOUSAND)
TABLE 5728 CHILE TRANSPARENT CONDUCTIVE FILMS IN INDIUM MARKET, BY PURITY GRADE, 2018-2033 (USD THOUSAND)
TABLE 5729 CHILE FLEXIBLE & FOLDABLE DISPLAYS IN INDIUM MARKET, BY PURITY GRADE, 2018-2033 (USD THOUSAND)
TABLE 5730 CHILE AR/VR DISPLAYS IN INDIUM MARKET, BY PURITY GRADE, 2018-2033 (USD THOUSAND)
TABLE 5731 CHILE MICRODISPLAY DEVICES IN INDIUM MARKET, BY PURITY GRADE, 2018-2033 (USD THOUSAND)
TABLE 5732 CHILE BACKPLANE COATINGS IN INDIUM MARKET, BY PURITY GRADE, 2018-2033 (USD THOUSAND)
TABLE 5733 CHILE SEMICONDUCTOR INDUSTRY IN INDIUM MARKET, BY TYPE, 2018-2033 (USD THOUSAND)
TABLE 5734 CHILE III-V COMPOUND SEMICONDUCTORS IN INDIUM MARKET, BY PURITY GRADE, 2018-2033 (USD THOUSAND)
TABLE 5735 CHILE HIGH-FREQUENCY RF COMPONENTS IN INDIUM MARKET, BY PURITY GRADE, 2018-2033 (USD THOUSAND)
TABLE 5736 CHILE SEMICONDUCTOR SUBSTRATES & EPITAXY IN INDIUM MARKET, BY PURITY GRADE, 2018-2033 (USD THOUSAND)
TABLE 5737 CHILE LASER DIODES IN INDIUM MARKET, BY PURITY GRADE, 2018-2033 (USD THOUSAND)
TABLE 5738 CHILE PHOTODETECTORS IN INDIUM MARKET, BY PURITY GRADE, 2018-2033 (USD THOUSAND)
TABLE 5739 CHILE HIGH-SPEED OPTOELECTRONICS IN INDIUM MARKET, BY PURITY GRADE, 2018-2033 (USD THOUSAND)
TABLE 5740 CHILE INFRARED DETECTORS IN INDIUM MARKET, BY PURITY GRADE, 2018-2033 (USD THOUSAND)
TABLE 5741 CHILE INTEGRATED PHOTONIC CIRCUITS IN INDIUM MARKET, BY PURITY GRADE, 2018-2033 (USD THOUSAND)
TABLE 5742 CHILE SOLAR PHOTOVOLTAIC INDUSTRY IN INDIUM MARKET, BY TYPE, 2018-2033 (USD THOUSAND)
TABLE 5743 CHILE CIGS THIN-FILM SOLAR CELLS IN INDIUM MARKET, BY PURITY GRADE, 2018-2033 (USD THOUSAND)
TABLE 5744 CHILEHIGH-EFFICIENCY MODULES IN INDIUM MARKET, BY PURITY GRADE, 2018-2033 (USD THOUSAND)
TABLE 5745 CHILE THIN-FILM COATINGS IN INDIUM MARKET, BY PURITY GRADE, 2018-2033 (USD THOUSAND)
TABLE 5746 CHILE TRANSPARENT ELECTRODES IN INDIUM MARKET, BY PURITY GRADE, 2018-2033 (USD THOUSAND)
TABLE 5747 CHILE BIPV IN INDIUM MARKET, BY PURITY GRADE, 2018-2033 (USD THOUSAND)
TABLE 5748 CHILE FLEXIBLE SOLAR PANELS IN INDIUM MARKET, BY PURITY GRADE, 2018-2033 (USD THOUSAND)
TABLE 5749 CHILE PORTABLE SOLAR SYSTEMS IN INDIUM MARKET, BY PURITY GRADE, 2018-2033 (USD THOUSAND)
TABLE 5750 CHILE CONCENTRATED PV IN INDIUM MARKET, BY PURITY GRADE, 2018-2033 (USD THOUSAND)
TABLE 5751 CHILE AUTOMOTIVE INDUSTRY IN INDIUM MARKET, BY TYPE, 2018-2033 (USD THOUSAND)
TABLE 5752 CHILE AUTOMOTIVE DISPLAY PANELS IN INDIUM MARKET, BY PURITY GRADE, 2018-2033 (USD THOUSAND)
TABLE 5753 CHILEADAS SENSORS IN INDIUM MARKET, BY PURITY GRADE, 2018-2033 (USD THOUSAND)
TABLE 5754 CHILE VEHICLE CAMERA MODULES IN INDIUM MARKET, BY PURITY GRADE, 2018-2033 (USD THOUSAND)
TABLE 5755 CHILE AUTOMOTIVE OPTOELECTRONICS IN INDIUM MARKET, BY PURITY GRADE, 2018-2033 (USD THOUSAND)
TABLE 5756 CHILE POWER ELECTRONICS IN INDIUM MARKET, BY PURITY GRADE, 2018-2033 (USD THOUSAND)
TABLE 5757 CHILE TOUCHSCREEN INTERFACES IN INDIUM MARKET, BY PURITY GRADE, 2018-2033 (USD THOUSAND)
TABLE 5758 CHILE INFRARED SENSORS IN INDIUM MARKET, BY PURITY GRADE, 2018-2033 (USD THOUSAND)
TABLE 5759 CHILE SMART LIGHTING IN INDIUM MARKET, BY PURITY GRADE, 2018-2033 (USD THOUSAND)
TABLE 5760 CHILE TELECOMMUNICATION EQUIPMENT INDUSTRY IN INDIUM MARKET, BY TYPE, 2018-2033 (USD THOUSAND)
TABLE 5761 CHILE OPTICAL TRANSCEIVERS IN INDIUM MARKET, BY PURITY GRADE, 2018-2033 (USD THOUSAND)
TABLE 5762 CHILE RF POWER AMPLIFIERS IN INDIUM MARKET, BY PURITY GRADE, 2018-2033 (USD THOUSAND)
TABLE 5763 CHILE HIGH-FREQUENCY COMMUNICATION CHIPS IN INDIUM MARKET, BY PURITY GRADE, 2018-2033 (USD THOUSAND)
TABLE 5764 CHILE FIBER-OPTIC COMMUNICATION LASERS IN INDIUM MARKET, BY PURITY GRADE, 2018-2033 (USD THOUSAND)
TABLE 5765 CHILE PHOTODETECTORS FOR OPTICAL NETWORKS IN INDIUM MARKET, BY PURITY GRADE, 2018-2033 (USD THOUSAND)
TABLE 5766 CHILE 5G INFRASTRUCTURE COMPONENTS IN INDIUM MARKET, BY PURITY GRADE, 2018-2033 (USD THOUSAND)
TABLE 5767 CHILE OPTICAL NETWORK SWITCHING DEVICES IN INDIUM MARKET, BY PURITY GRADE, 2018-2033 (USD THOUSAND)
TABLE 5768 CHILE SATELLITE COMMUNICATION MODULES IN INDIUM MARKET, BY PURITY GRADE, 2018-2033 (USD THOUSAND)
TABLE 5769 CHILE OPTICAL & PHOTONICS INDUSTRY IN INDIUM MARKET, BY TYPE, 2018-2033 (USD THOUSAND)
TABLE 5770 CHILE OPTICAL COATINGS IN INDIUM MARKET, BY PURITY GRADE, 2018-2033 (USD THOUSAND)
TABLE 5771 CHILE FIBER OPTIC COMPONENTS IN INDIUM MARKET, BY PURITY GRADE, 2018-2033 (USD THOUSAND)
TABLE 5772 CHILE LASER COMPONENTS IN INDIUM MARKET, BY PURITY GRADE, 2018-2033 (USD THOUSAND)
TABLE 5773 CHILE OPTICAL SENSORS IN INDIUM MARKET, BY PURITY GRADE, 2018-2033 (USD THOUSAND)
TABLE 5774 CHILE INFRARED OPTICS IN INDIUM MARKET, BY PURITY GRADE, 2018-2033 (USD THOUSAND)
TABLE 5775 CHILE PICS IN INDIUM MARKET, BY PURITY GRADE, 2018-2033 (USD THOUSAND)
TABLE 5776 CHILE MIRRORS IN INDIUM MARKET, BY PURITY GRADE, 2018-2033 (USD THOUSAND)
TABLE 5777 CHILE SPECTROSCOPY IN INDIUM MARKET, BY PURITY GRADE, 2018-2033 (USD THOUSAND)
TABLE 5778 CHILE AEROSPACE & DEFENSE INDUSTRY IN INDIUM MARKET, BY TYPE, 2018-2033 (USD THOUSAND)
TABLE 5779 CHILE INFRARED IMAGING SYSTEMS IN INDIUM MARKET, BY PURITY GRADE, 2018-2033 (USD THOUSAND)
TABLE 5780 CHILE RADAR & RF COMPONENTS IN INDIUM MARKET, BY PURITY GRADE, 2018-2033 (USD THOUSAND)
TABLE 5781 CHILE SATELLITE COMMUNICATION IN INDIUM MARKET, BY PURITY GRADE, 2018-2033 (USD THOUSAND)
TABLE 5782 CHILE MILITARY OPTOELECTRONICS IN INDIUM MARKET, BY PURITY GRADE, 2018-2033 (USD THOUSAND)
TABLE 5783 CHILE AVIONICS DISPLAYS IN INDIUM MARKET, BY PURITY GRADE, 2018-2033 (USD THOUSAND)
TABLE 5784 CHILE SPACECRAFT SOLAR PANELS IN INDIUM MARKET, BY PURITY GRADE, 2018-2033 (USD THOUSAND)
TABLE 5785 CHILE THERMAL MATERIALS IN INDIUM MARKET, BY PURITY GRADE, 2018-2033 (USD THOUSAND)
TABLE 5786 CHILE CRYOGENIC MATERIALS IN INDIUM MARKET, BY PURITY GRADE, 2018-2033 (USD THOUSAND)
TABLE 5787 CHILE MEDICAL DEVICE INDUSTRY IN INDIUM MARKET, BY TYPE, 2018-2033 (USD THOUSAND)
TABLE 5788 CHILE MEDICAL IMAGING SENSORS IN INDIUM MARKET, BY PURITY GRADE, 2018-2033 (USD THOUSAND)
TABLE 5789 CHILE DIAGNOSTIC EQUIPMENT DISPLAYS IN INDIUM MARKET, BY PURITY GRADE, 2018-2033 (USD THOUSAND)
TABLE 5790 CHILE ADVANCED DIAGNOSTIC INSTRUMENTS IN INDIUM MARKET, BY PURITY GRADE, 2018-2033 (USD THOUSAND)
TABLE 5791 CHILE LASER SURGICAL EQUIPMENT IN INDIUM MARKET, BY PURITY GRADE, 2018-2033 (USD THOUSAND)
TABLE 5792 CHILE BIOMEDICAL OPTICAL DEVICES IN INDIUM MARKET, BY PURITY GRADE, 2018-2033 (USD THOUSAND)
TABLE 5793 CHILE RADIATION DETECTION EQUIPMENT IN INDIUM MARKET, BY PURITY GRADE, 2018-2033 (USD THOUSAND)
TABLE 5794 CHILE INFRARED MEDICAL SENSORS IN INDIUM MARKET, BY PURITY GRADE, 2018-2033 (USD THOUSAND)
TABLE 5795 CHILE PHOTOTHERAPY DEVICES IN INDIUM MARKET, BY PURITY GRADE, 2018-2033 (USD THOUSAND)
TABLE 5796 CHILE INDUSTRIAL EQUIPMENT MANUFACTURING IN INDIUM MARKET, BY TYPE, 2018-2033 (USD THOUSAND)
TABLE 5797 CHILE INDUSTRIAL SENSORS IN INDIUM MARKET, BY PURITY GRADE, 2018-2033 (USD THOUSAND)
TABLE 5798 CHILE VACUUM DEPOSITION COATINGS IN INDIUM MARKET, BY PURITY GRADE, 2018-2033 (USD THOUSAND)
TABLE 5799 CHILE PRECISION OPTICAL COMPONENTS IN INDIUM MARKET, BY PURITY GRADE, 2018-2033 (USD THOUSAND)
TABLE 5800 CHILE THERMAL INTERFACE MATERIALS IN INDIUM MARKET, BY PURITY GRADE, 2018-2033 (USD THOUSAND)
TABLE 5801 CHILE INDUSTRIAL LASER SYSTEMS IN INDIUM MARKET, BY PURITY GRADE, 2018-2033 (USD THOUSAND)
TABLE 5802 CHILE INDUSTRIAL INFRARED DETECTORS IN INDIUM MARKET, BY PURITY GRADE, 2018-2033 (USD THOUSAND)
TABLE 5803 CHILE PRECISION MEASUREMENT EQUIPMENT IN INDIUM MARKET, BY PURITY GRADE, 2018-2033 (USD THOUSAND)
TABLE 5804 CHILE SPECIALTY ELECTRONIC COMPONENTS IN INDIUM MARKET, BY PURITY GRADE, 2018-2033 (USD THOUSAND)
TABLE 5805 CHILE OTHERS IN INDIUM MARKET, BY TYPE, 2018-2033 (USD THOUSAND)
TABLE 5806 CHILE ADVANCED MATERIALS MANUFACTURING IN INDIUM MARKET, BY PURITY GRADE, 2018-2033 (USD THOUSAND)
TABLE 5807 CHILE SPECIALTY ALLOY PRODUCTION IN INDIUM MARKET, BY PURITY GRADE, 2018-2033 (USD THOUSAND)
TABLE 5808 CHILE THERMAL MANAGEMENT MATERIALS IN INDIUM MARKET, BY PURITY GRADE, 2018-2033 (USD THOUSAND)
TABLE 5809 CHILE PRECISION SCIENTIFIC INSTRUMENTS IN INDIUM MARKET, BY PURITY GRADE, 2018-2033 (USD THOUSAND)
TABLE 5810 CHILE RESEARCH INSTITUTES & UNIVERSITIES IN INDIUM MARKET, BY PURITY GRADE, 2018-2033 (USD THOUSAND)
TABLE 5811 CHILE NUCLEAR INDUSTRY APPLICATIONS IN INDIUM MARKET, BY PURITY GRADE, 2018-2033 (USD THOUSAND)
TABLE 5812 CHILE SPECIALTY CHEMICAL PRODUCTION IN INDIUM MARKET, BY PURITY GRADE, 2018-2033 (USD THOUSAND)
TABLE 5813 CHILE DEFENSE RESEARCH LABORATORIES IN INDIUM MARKET, BY PURITY GRADE, 2018-2033 (USD THOUSAND)
TABLE 5814 CHILE CRYOGENIC EQUIPMENT MANUFACTURING IN INDIUM MARKET, BY PURITY GRADE, 2018-2033 (USD THOUSAND)
TABLE 5815 ARGENTINA INDIUM MARKET, BY PRODUCT TYPE, 2018-2033 (USD THOUSAND)
TABLE 5816 ARGENTINA INGOTS IN INDIUM MARKET, BY TYPE, 2018-2033 (USD THOUSAND)
TABLE 5817 ARGENTINA INDIUM MARKET, BY MATERIAL COMPOSITION, 2018-2033 (USD THOUSAND)
TABLE 5818 ARGENTINA INDIUM ALLOYS IN INDIUM MARKET, BY TYPE, 2018-2033 (USD THOUSAND)
TABLE 5819 ARGENTINA INDIUM COMPOUNDS IN INDIUM MARKET, BY TYPE, 2018-2033 (USD THOUSAND)
TABLE 5820 ARGENTINA INDIUM MARKET, BY PURITY GRADE, 2018-2033 (USD THOUSAND)
TABLE 5821 ARGENTINA INDIUM MARKET, BY EXTRACTION SOURCE, 2018-2033 (USD THOUSAND)
TABLE 5822 ARGENTINA PRIMARY PRODUCTION IN INDIUM MARKET, BY TYPE, 2018-2033 (USD THOUSAND)
TABLE 5823 ARGENTINA SECONDARY PRODUCTION IN INDIUM MARKET, BY TYPE, 2018-2033 (USD THOUSAND)
TABLE 5824 ARGENTINA INDIUM MARKET, BY DISTRIBUTION CHANNEL, 2018-2033 (USD THOUSAND)
TABLE 5825 ARGENTINA INDIUM MARKET, BY TECHNOLOGY PLATFORM, 2018-2033 (USD THOUSAND)
TABLE 5826 ARGENTINA INDIUM MARKET, BY END-USER INDUSTRY, 2018-2033 (USD THOUSAND)
TABLE 5827 ARGENTINA CONSUMER ELECTRONICS INDUSTRY IN INDIUM MARKET, BY TYPE, 2018-2033 (USD THOUSAND)
TABLE 5828 ARGENTINA FLAT PANEL DISPLAYS (LCD/OLED/LED) IN INDIUM MARKET, BY PURITY GRADE, 2018-2033 (USD THOUSAND)
TABLE 5829 ARGENTINA TRANSPARENT CONDUCTIVE COATINGS (ITO) IN INDIUM MARKET, BY PURITY GRADE, 2018-2033 (USD THOUSAND)
TABLE 5830 ARGENTINA TOUCHSCREEN DISPLAYS IN INDIUM MARKET, BY PURITY GRADE, 2018-2033 (USD THOUSAND)
TABLE 5831 ARGENTINA FLEXIBLE DISPLAYS & ELECTRONICS IN INDIUM MARKET, BY PURITY GRADE, 2018-2033 (USD THOUSAND)
TABLE 5832 ARGENTINA WEARABLE ELECTRONICS DEVICES IN INDIUM MARKET, BY PURITY GRADE, 2018-2033 (USD THOUSAND)
TABLE 5833 ARGENTINA CAMERA & OPTICAL SENSORS IN INDIUM MARKET, BY PURITY GRADE, 2018-2033 (USD THOUSAND)
TABLE 5834 ARGENTINA MINI-LED BACKLIGHTING IN INDIUM MARKET, BY PURITY GRADE, 2018-2033 (USD THOUSAND)
TABLE 5835 ARGENTINA MICRO-LED DISPLAYS IN INDIUM MARKET, BY PURITY GRADE, 2018-2033 (USD THOUSAND)
TABLE 5836 ARGENTINA DISPLAY PANEL INDUSTRY IN INDIUM MARKET, BY TYPE, 2018-2033 (USD THOUSAND)
TABLE 5837 ARGENTINA LCD PANEL MANUFACTURING IN INDIUM MARKET, BY PURITY GRADE, 2018-2033 (USD THOUSAND)
TABLE 5838 ARGENTINA OLED PANEL MANUFACTURING IN INDIUM MARKET, BY PURITY GRADE, 2018-2033 (USD THOUSAND)
TABLE 5839 ARGENTINA DISPLAY PANEL MANUFACTURING IN INDIUM MARKET, BY PURITY GRADE, 2018-2033 (USD THOUSAND)
TABLE 5840 ARGENTINA TOUCH PANEL SENSORS IN INDIUM MARKET, BY PURITY GRADE, 2018-2033 (USD THOUSAND)
TABLE 5841 ARGENTINA TRANSPARENT CONDUCTIVE FILMS IN INDIUM MARKET, BY PURITY GRADE, 2018-2033 (USD THOUSAND)
TABLE 5842 ARGENTINA FLEXIBLE & FOLDABLE DISPLAYS IN INDIUM MARKET, BY PURITY GRADE, 2018-2033 (USD THOUSAND)
TABLE 5843 ARGENTINA AR/VR DISPLAYS IN INDIUM MARKET, BY PURITY GRADE, 2018-2033 (USD THOUSAND)
TABLE 5844 ARGENTINA MICRODISPLAY DEVICES IN INDIUM MARKET, BY PURITY GRADE, 2018-2033 (USD THOUSAND)
TABLE 5845 ARGENTINA BACKPLANE COATINGS IN INDIUM MARKET, BY PURITY GRADE, 2018-2033 (USD THOUSAND)
TABLE 5846 ARGENTINA SEMICONDUCTOR INDUSTRY IN INDIUM MARKET, BY TYPE, 2018-2033 (USD THOUSAND)
TABLE 5847 ARGENTINA III-V COMPOUND SEMICONDUCTORS IN INDIUM MARKET, BY PURITY GRADE, 2018-2033 (USD THOUSAND)
TABLE 5848 ARGENTINA HIGH-FREQUENCY RF COMPONENTS IN INDIUM MARKET, BY PURITY GRADE, 2018-2033 (USD THOUSAND)
TABLE 5849 ARGENTINA SEMICONDUCTOR SUBSTRATES & EPITAXY IN INDIUM MARKET, BY PURITY GRADE, 2018-2033 (USD THOUSAND)
TABLE 5850 ARGENTINA LASER DIODES IN INDIUM MARKET, BY PURITY GRADE, 2018-2033 (USD THOUSAND)
TABLE 5851 ARGENTINA PHOTODETECTORS IN INDIUM MARKET, BY PURITY GRADE, 2018-2033 (USD THOUSAND)
TABLE 5852 ARGENTINA HIGH-SPEED OPTOELECTRONICS IN INDIUM MARKET, BY PURITY GRADE, 2018-2033 (USD THOUSAND)
TABLE 5853 ARGENTINA INFRARED DETECTORS IN INDIUM MARKET, BY PURITY GRADE, 2018-2033 (USD THOUSAND)
TABLE 5854 ARGENTINA INTEGRATED PHOTONIC CIRCUITS IN INDIUM MARKET, BY PURITY GRADE, 2018-2033 (USD THOUSAND)
TABLE 5855 ARGENTINA SOLAR PHOTOVOLTAIC INDUSTRY IN INDIUM MARKET, BY TYPE, 2018-2033 (USD THOUSAND)
TABLE 5856 ARGENTINA CIGS THIN-FILM SOLAR CELLS IN INDIUM MARKET, BY PURITY GRADE, 2018-2033 (USD THOUSAND)
TABLE 5857 ARGENTINAHIGH-EFFICIENCY MODULES IN INDIUM MARKET, BY PURITY GRADE, 2018-2033 (USD THOUSAND)
TABLE 5858 ARGENTINA THIN-FILM COATINGS IN INDIUM MARKET, BY PURITY GRADE, 2018-2033 (USD THOUSAND)
TABLE 5859 ARGENTINA TRANSPARENT ELECTRODES IN INDIUM MARKET, BY PURITY GRADE, 2018-2033 (USD THOUSAND)
TABLE 5860 ARGENTINA BIPV IN INDIUM MARKET, BY PURITY GRADE, 2018-2033 (USD THOUSAND)
TABLE 5861 ARGENTINA FLEXIBLE SOLAR PANELS IN INDIUM MARKET, BY PURITY GRADE, 2018-2033 (USD THOUSAND)
TABLE 5862 ARGENTINA PORTABLE SOLAR SYSTEMS IN INDIUM MARKET, BY PURITY GRADE, 2018-2033 (USD THOUSAND)
TABLE 5863 ARGENTINA CONCENTRATED PV IN INDIUM MARKET, BY PURITY GRADE, 2018-2033 (USD THOUSAND)
TABLE 5864 ARGENTINA AUTOMOTIVE INDUSTRY IN INDIUM MARKET, BY TYPE, 2018-2033 (USD THOUSAND)
TABLE 5865 ARGENTINA AUTOMOTIVE DISPLAY PANELS IN INDIUM MARKET, BY PURITY GRADE, 2018-2033 (USD THOUSAND)
TABLE 5866 ARGENTINAADAS SENSORS IN INDIUM MARKET, BY PURITY GRADE, 2018-2033 (USD THOUSAND)
TABLE 5867 ARGENTINA VEHICLE CAMERA MODULES IN INDIUM MARKET, BY PURITY GRADE, 2018-2033 (USD THOUSAND)
TABLE 5868 ARGENTINA AUTOMOTIVE OPTOELECTRONICS IN INDIUM MARKET, BY PURITY GRADE, 2018-2033 (USD THOUSAND)
TABLE 5869 ARGENTINA POWER ELECTRONICS IN INDIUM MARKET, BY PURITY GRADE, 2018-2033 (USD THOUSAND)
TABLE 5870 ARGENTINA TOUCHSCREEN INTERFACES IN INDIUM MARKET, BY PURITY GRADE, 2018-2033 (USD THOUSAND)
TABLE 5871 ARGENTINA INFRARED SENSORS IN INDIUM MARKET, BY PURITY GRADE, 2018-2033 (USD THOUSAND)
TABLE 5872 ARGENTINA SMART LIGHTING IN INDIUM MARKET, BY PURITY GRADE, 2018-2033 (USD THOUSAND)
TABLE 5873 ARGENTINA TELECOMMUNICATION EQUIPMENT INDUSTRY IN INDIUM MARKET, BY TYPE, 2018-2033 (USD THOUSAND)
TABLE 5874 ARGENTINA OPTICAL TRANSCEIVERS IN INDIUM MARKET, BY PURITY GRADE, 2018-2033 (USD THOUSAND)
TABLE 5875 ARGENTINA RF POWER AMPLIFIERS IN INDIUM MARKET, BY PURITY GRADE, 2018-2033 (USD THOUSAND)
TABLE 5876 ARGENTINA HIGH-FREQUENCY COMMUNICATION CHIPS IN INDIUM MARKET, BY PURITY GRADE, 2018-2033 (USD THOUSAND)
TABLE 5877 ARGENTINA FIBER-OPTIC COMMUNICATION LASERS IN INDIUM MARKET, BY PURITY GRADE, 2018-2033 (USD THOUSAND)
TABLE 5878 ARGENTINA PHOTODETECTORS FOR OPTICAL NETWORKS IN INDIUM MARKET, BY PURITY GRADE, 2018-2033 (USD THOUSAND)
TABLE 5879 ARGENTINA 5G INFRASTRUCTURE COMPONENTS IN INDIUM MARKET, BY PURITY GRADE, 2018-2033 (USD THOUSAND)
TABLE 5880 ARGENTINA OPTICAL NETWORK SWITCHING DEVICES IN INDIUM MARKET, BY PURITY GRADE, 2018-2033 (USD THOUSAND)
TABLE 5881 ARGENTINA SATELLITE COMMUNICATION MODULES IN INDIUM MARKET, BY PURITY GRADE, 2018-2033 (USD THOUSAND)
TABLE 5882 ARGENTINA OPTICAL & PHOTONICS INDUSTRY IN INDIUM MARKET, BY TYPE, 2018-2033 (USD THOUSAND)
TABLE 5883 ARGENTINA OPTICAL COATINGS IN INDIUM MARKET, BY PURITY GRADE, 2018-2033 (USD THOUSAND)
TABLE 5884 ARGENTINA FIBER OPTIC COMPONENTS IN INDIUM MARKET, BY PURITY GRADE, 2018-2033 (USD THOUSAND)
TABLE 5885 ARGENTINA LASER COMPONENTS IN INDIUM MARKET, BY PURITY GRADE, 2018-2033 (USD THOUSAND)
TABLE 5886 ARGENTINA OPTICAL SENSORS IN INDIUM MARKET, BY PURITY GRADE, 2018-2033 (USD THOUSAND)
TABLE 5887 ARGENTINA INFRARED OPTICS IN INDIUM MARKET, BY PURITY GRADE, 2018-2033 (USD THOUSAND)
TABLE 5888 ARGENTINA PICS IN INDIUM MARKET, BY PURITY GRADE, 2018-2033 (USD THOUSAND)
TABLE 5889 ARGENTINA MIRRORS IN INDIUM MARKET, BY PURITY GRADE, 2018-2033 (USD THOUSAND)
TABLE 5890 ARGENTINA SPECTROSCOPY IN INDIUM MARKET, BY PURITY GRADE, 2018-2033 (USD THOUSAND)
TABLE 5891 ARGENTINA AEROSPACE & DEFENSE INDUSTRY IN INDIUM MARKET, BY TYPE, 2018-2033 (USD THOUSAND)
TABLE 5892 ARGENTINA INFRARED IMAGING SYSTEMS IN INDIUM MARKET, BY PURITY GRADE, 2018-2033 (USD THOUSAND)
TABLE 5893 ARGENTINA RADAR & RF COMPONENTS IN INDIUM MARKET, BY PURITY GRADE, 2018-2033 (USD THOUSAND)
TABLE 5894 ARGENTINA SATELLITE COMMUNICATION IN INDIUM MARKET, BY PURITY GRADE, 2018-2033 (USD THOUSAND)
TABLE 5895 ARGENTINA MILITARY OPTOELECTRONICS IN INDIUM MARKET, BY PURITY GRADE, 2018-2033 (USD THOUSAND)
TABLE 5896 ARGENTINA AVIONICS DISPLAYS IN INDIUM MARKET, BY PURITY GRADE, 2018-2033 (USD THOUSAND)
TABLE 5897 ARGENTINA SPACECRAFT SOLAR PANELS IN INDIUM MARKET, BY PURITY GRADE, 2018-2033 (USD THOUSAND)
TABLE 5898 ARGENTINA THERMAL MATERIALS IN INDIUM MARKET, BY PURITY GRADE, 2018-2033 (USD THOUSAND)
TABLE 5899 ARGENTINA CRYOGENIC MATERIALS IN INDIUM MARKET, BY PURITY GRADE, 2018-2033 (USD THOUSAND)
TABLE 5900 ARGENTINA MEDICAL DEVICE INDUSTRY IN INDIUM MARKET, BY TYPE, 2018-2033 (USD THOUSAND)
TABLE 5901 ARGENTINA MEDICAL IMAGING SENSORS IN INDIUM MARKET, BY PURITY GRADE, 2018-2033 (USD THOUSAND)
TABLE 5902 ARGENTINA DIAGNOSTIC EQUIPMENT DISPLAYS IN INDIUM MARKET, BY PURITY GRADE, 2018-2033 (USD THOUSAND)
TABLE 5903 ARGENTINA ADVANCED DIAGNOSTIC INSTRUMENTS IN INDIUM MARKET, BY PURITY GRADE, 2018-2033 (USD THOUSAND)
TABLE 5904 ARGENTINA LASER SURGICAL EQUIPMENT IN INDIUM MARKET, BY PURITY GRADE, 2018-2033 (USD THOUSAND)
TABLE 5905 ARGENTINA BIOMEDICAL OPTICAL DEVICES IN INDIUM MARKET, BY PURITY GRADE, 2018-2033 (USD THOUSAND)
TABLE 5906 ARGENTINA RADIATION DETECTION EQUIPMENT IN INDIUM MARKET, BY PURITY GRADE, 2018-2033 (USD THOUSAND)
TABLE 5907 ARGENTINA INFRARED MEDICAL SENSORS IN INDIUM MARKET, BY PURITY GRADE, 2018-2033 (USD THOUSAND)
TABLE 5908 ARGENTINA PHOTOTHERAPY DEVICES IN INDIUM MARKET, BY PURITY GRADE, 2018-2033 (USD THOUSAND)
TABLE 5909 ARGENTINA INDUSTRIAL EQUIPMENT MANUFACTURING IN INDIUM MARKET, BY TYPE, 2018-2033 (USD THOUSAND)
TABLE 5910 ARGENTINA INDUSTRIAL SENSORS IN INDIUM MARKET, BY PURITY GRADE, 2018-2033 (USD THOUSAND)
TABLE 5911 ARGENTINA VACUUM DEPOSITION COATINGS IN INDIUM MARKET, BY PURITY GRADE, 2018-2033 (USD THOUSAND)
TABLE 5912 ARGENTINA PRECISION OPTICAL COMPONENTS IN INDIUM MARKET, BY PURITY GRADE, 2018-2033 (USD THOUSAND)
TABLE 5913 ARGENTINA THERMAL INTERFACE MATERIALS IN INDIUM MARKET, BY PURITY GRADE, 2018-2033 (USD THOUSAND)
TABLE 5914 ARGENTINA INDUSTRIAL LASER SYSTEMS IN INDIUM MARKET, BY PURITY GRADE, 2018-2033 (USD THOUSAND)
TABLE 5915 ARGENTINA INDUSTRIAL INFRARED DETECTORS IN INDIUM MARKET, BY PURITY GRADE, 2018-2033 (USD THOUSAND)
TABLE 5916 ARGENTINA PRECISION MEASUREMENT EQUIPMENT IN INDIUM MARKET, BY PURITY GRADE, 2018-2033 (USD THOUSAND)
TABLE 5917 ARGENTINA SPECIALTY ELECTRONIC COMPONENTS IN INDIUM MARKET, BY PURITY GRADE, 2018-2033 (USD THOUSAND)
TABLE 5918 ARGENTINA OTHERS IN INDIUM MARKET, BY TYPE, 2018-2033 (USD THOUSAND)
TABLE 5919 ARGENTINA ADVANCED MATERIALS MANUFACTURING IN INDIUM MARKET, BY PURITY GRADE, 2018-2033 (USD THOUSAND)
TABLE 5920 ARGENTINA SPECIALTY ALLOY PRODUCTION IN INDIUM MARKET, BY PURITY GRADE, 2018-2033 (USD THOUSAND)
TABLE 5921 ARGENTINA THERMAL MANAGEMENT MATERIALS IN INDIUM MARKET, BY PURITY GRADE, 2018-2033 (USD THOUSAND)
TABLE 5922 ARGENTINA PRECISION SCIENTIFIC INSTRUMENTS IN INDIUM MARKET, BY PURITY GRADE, 2018-2033 (USD THOUSAND)
TABLE 5923 ARGENTINA RESEARCH INSTITUTES & UNIVERSITIES IN INDIUM MARKET, BY PURITY GRADE, 2018-2033 (USD THOUSAND)
TABLE 5924 ARGENTINA NUCLEAR INDUSTRY APPLICATIONS IN INDIUM MARKET, BY PURITY GRADE, 2018-2033 (USD THOUSAND)
TABLE 5925 ARGENTINA SPECIALTY CHEMICAL PRODUCTION IN INDIUM MARKET, BY PURITY GRADE, 2018-2033 (USD THOUSAND)
TABLE 5926 ARGENTINA DEFENSE RESEARCH LABORATORIES IN INDIUM MARKET, BY PURITY GRADE, 2018-2033 (USD THOUSAND)
TABLE 5927 ARGENTINA CRYOGENIC EQUIPMENT MANUFACTURING IN INDIUM MARKET, BY PURITY GRADE, 2018-2033 (USD THOUSAND)
TABLE 5928 COLOMBIA INDIUM MARKET, BY PRODUCT TYPE, 2018-2033 (USD THOUSAND)
TABLE 5929 COLOMBIA INGOTS IN INDIUM MARKET, BY TYPE, 2018-2033 (USD THOUSAND)
TABLE 5930 COLOMBIA INDIUM MARKET, BY MATERIAL COMPOSITION, 2018-2033 (USD THOUSAND)
TABLE 5931 COLOMBIA INDIUM ALLOYS IN INDIUM MARKET, BY TYPE, 2018-2033 (USD THOUSAND)
TABLE 5932 COLOMBIA INDIUM COMPOUNDS IN INDIUM MARKET, BY TYPE, 2018-2033 (USD THOUSAND)
TABLE 5933 COLOMBIA INDIUM MARKET, BY PURITY GRADE, 2018-2033 (USD THOUSAND)
TABLE 5934 COLOMBIA INDIUM MARKET, BY EXTRACTION SOURCE, 2018-2033 (USD THOUSAND)
TABLE 5935 COLOMBIA PRIMARY PRODUCTION IN INDIUM MARKET, BY TYPE, 2018-2033 (USD THOUSAND)
TABLE 5936 COLOMBIA SECONDARY PRODUCTION IN INDIUM MARKET, BY TYPE, 2018-2033 (USD THOUSAND)
TABLE 5937 COLOMBIA INDIUM MARKET, BY DISTRIBUTION CHANNEL, 2018-2033 (USD THOUSAND)
TABLE 5938 COLOMBIA INDIUM MARKET, BY TECHNOLOGY PLATFORM, 2018-2033 (USD THOUSAND)
TABLE 5939 COLOMBIA INDIUM MARKET, BY END-USER INDUSTRY, 2018-2033 (USD THOUSAND)
TABLE 5940 COLOMBIA CONSUMER ELECTRONICS INDUSTRY IN INDIUM MARKET, BY TYPE, 2018-2033 (USD THOUSAND)
TABLE 5941 COLOMBIA FLAT PANEL DISPLAYS (LCD/OLED/LED) IN INDIUM MARKET, BY PURITY GRADE, 2018-2033 (USD THOUSAND)
TABLE 5942 COLOMBIA TRANSPARENT CONDUCTIVE COATINGS (ITO) IN INDIUM MARKET, BY PURITY GRADE, 2018-2033 (USD THOUSAND)
TABLE 5943 COLOMBIA TOUCHSCREEN DISPLAYS IN INDIUM MARKET, BY PURITY GRADE, 2018-2033 (USD THOUSAND)
TABLE 5944 COLOMBIA FLEXIBLE DISPLAYS & ELECTRONICS IN INDIUM MARKET, BY PURITY GRADE, 2018-2033 (USD THOUSAND)
TABLE 5945 COLOMBIA WEARABLE ELECTRONICS DEVICES IN INDIUM MARKET, BY PURITY GRADE, 2018-2033 (USD THOUSAND)
TABLE 5946 COLOMBIA CAMERA & OPTICAL SENSORS IN INDIUM MARKET, BY PURITY GRADE, 2018-2033 (USD THOUSAND)
TABLE 5947 COLOMBIA MINI-LED BACKLIGHTING IN INDIUM MARKET, BY PURITY GRADE, 2018-2033 (USD THOUSAND)
TABLE 5948 COLOMBIA MICRO-LED DISPLAYS IN INDIUM MARKET, BY PURITY GRADE, 2018-2033 (USD THOUSAND)
TABLE 5949 COLOMBIA DISPLAY PANEL INDUSTRY IN INDIUM MARKET, BY TYPE, 2018-2033 (USD THOUSAND)
TABLE 5950 COLOMBIA LCD PANEL MANUFACTURING IN INDIUM MARKET, BY PURITY GRADE, 2018-2033 (USD THOUSAND)
TABLE 5951 COLOMBIA OLED PANEL MANUFACTURING IN INDIUM MARKET, BY PURITY GRADE, 2018-2033 (USD THOUSAND)
TABLE 5952 COLOMBIA DISPLAY PANEL MANUFACTURING IN INDIUM MARKET, BY PURITY GRADE, 2018-2033 (USD THOUSAND)
TABLE 5953 COLOMBIA TOUCH PANEL SENSORS IN INDIUM MARKET, BY PURITY GRADE, 2018-2033 (USD THOUSAND)
TABLE 5954 COLOMBIA TRANSPARENT CONDUCTIVE FILMS IN INDIUM MARKET, BY PURITY GRADE, 2018-2033 (USD THOUSAND)
TABLE 5955 COLOMBIA FLEXIBLE & FOLDABLE DISPLAYS IN INDIUM MARKET, BY PURITY GRADE, 2018-2033 (USD THOUSAND)
TABLE 5956 COLOMBIA AR/VR DISPLAYS IN INDIUM MARKET, BY PURITY GRADE, 2018-2033 (USD THOUSAND)
TABLE 5957 COLOMBIA MICRODISPLAY DEVICES IN INDIUM MARKET, BY PURITY GRADE, 2018-2033 (USD THOUSAND)
TABLE 5958 COLOMBIA BACKPLANE COATINGS IN INDIUM MARKET, BY PURITY GRADE, 2018-2033 (USD THOUSAND)
TABLE 5959 COLOMBIA SEMICONDUCTOR INDUSTRY IN INDIUM MARKET, BY TYPE, 2018-2033 (USD THOUSAND)
TABLE 5960 COLOMBIA III-V COMPOUND SEMICONDUCTORS IN INDIUM MARKET, BY PURITY GRADE, 2018-2033 (USD THOUSAND)
TABLE 5961 COLOMBIA HIGH-FREQUENCY RF COMPONENTS IN INDIUM MARKET, BY PURITY GRADE, 2018-2033 (USD THOUSAND)
TABLE 5962 COLOMBIA SEMICONDUCTOR SUBSTRATES & EPITAXY IN INDIUM MARKET, BY PURITY GRADE, 2018-2033 (USD THOUSAND)
TABLE 5963 COLOMBIA LASER DIODES IN INDIUM MARKET, BY PURITY GRADE, 2018-2033 (USD THOUSAND)
TABLE 5964 COLOMBIA PHOTODETECTORS IN INDIUM MARKET, BY PURITY GRADE, 2018-2033 (USD THOUSAND)
TABLE 5965 COLOMBIA HIGH-SPEED OPTOELECTRONICS IN INDIUM MARKET, BY PURITY GRADE, 2018-2033 (USD THOUSAND)
TABLE 5966 COLOMBIA INFRARED DETECTORS IN INDIUM MARKET, BY PURITY GRADE, 2018-2033 (USD THOUSAND)
TABLE 5967 COLOMBIA INTEGRATED PHOTONIC CIRCUITS IN INDIUM MARKET, BY PURITY GRADE, 2018-2033 (USD THOUSAND)
TABLE 5968 COLOMBIA SOLAR PHOTOVOLTAIC INDUSTRY IN INDIUM MARKET, BY TYPE, 2018-2033 (USD THOUSAND)
TABLE 5969 COLOMBIA CIGS THIN-FILM SOLAR CELLS IN INDIUM MARKET, BY PURITY GRADE, 2018-2033 (USD THOUSAND)
TABLE 5970 COLOMBIAHIGH-EFFICIENCY MODULES IN INDIUM MARKET, BY PURITY GRADE, 2018-2033 (USD THOUSAND)
TABLE 5971 COLOMBIA THIN-FILM COATINGS IN INDIUM MARKET, BY PURITY GRADE, 2018-2033 (USD THOUSAND)
TABLE 5972 COLOMBIA TRANSPARENT ELECTRODES IN INDIUM MARKET, BY PURITY GRADE, 2018-2033 (USD THOUSAND)
TABLE 5973 COLOMBIA BIPV IN INDIUM MARKET, BY PURITY GRADE, 2018-2033 (USD THOUSAND)
TABLE 5974 COLOMBIA FLEXIBLE SOLAR PANELS IN INDIUM MARKET, BY PURITY GRADE, 2018-2033 (USD THOUSAND)
TABLE 5975 COLOMBIA PORTABLE SOLAR SYSTEMS IN INDIUM MARKET, BY PURITY GRADE, 2018-2033 (USD THOUSAND)
TABLE 5976 COLOMBIA CONCENTRATED PV IN INDIUM MARKET, BY PURITY GRADE, 2018-2033 (USD THOUSAND)
TABLE 5977 COLOMBIA AUTOMOTIVE INDUSTRY IN INDIUM MARKET, BY TYPE, 2018-2033 (USD THOUSAND)
TABLE 5978 COLOMBIA AUTOMOTIVE DISPLAY PANELS IN INDIUM MARKET, BY PURITY GRADE, 2018-2033 (USD THOUSAND)
TABLE 5979 COLOMBIAADAS SENSORS IN INDIUM MARKET, BY PURITY GRADE, 2018-2033 (USD THOUSAND)
TABLE 5980 COLOMBIA VEHICLE CAMERA MODULES IN INDIUM MARKET, BY PURITY GRADE, 2018-2033 (USD THOUSAND)
TABLE 5981 COLOMBIA AUTOMOTIVE OPTOELECTRONICS IN INDIUM MARKET, BY PURITY GRADE, 2018-2033 (USD THOUSAND)
TABLE 5982 COLOMBIA POWER ELECTRONICS IN INDIUM MARKET, BY PURITY GRADE, 2018-2033 (USD THOUSAND)
TABLE 5983 COLOMBIA TOUCHSCREEN INTERFACES IN INDIUM MARKET, BY PURITY GRADE, 2018-2033 (USD THOUSAND)
TABLE 5984 COLOMBIA INFRARED SENSORS IN INDIUM MARKET, BY PURITY GRADE, 2018-2033 (USD THOUSAND)
TABLE 5985 COLOMBIA SMART LIGHTING IN INDIUM MARKET, BY PURITY GRADE, 2018-2033 (USD THOUSAND)
TABLE 5986 COLOMBIA TELECOMMUNICATION EQUIPMENT INDUSTRY IN INDIUM MARKET, BY TYPE, 2018-2033 (USD THOUSAND)
TABLE 5987 COLOMBIA OPTICAL TRANSCEIVERS IN INDIUM MARKET, BY PURITY GRADE, 2018-2033 (USD THOUSAND)
TABLE 5988 COLOMBIA RF POWER AMPLIFIERS IN INDIUM MARKET, BY PURITY GRADE, 2018-2033 (USD THOUSAND)
TABLE 5989 COLOMBIA HIGH-FREQUENCY COMMUNICATION CHIPS IN INDIUM MARKET, BY PURITY GRADE, 2018-2033 (USD THOUSAND)
TABLE 5990 COLOMBIA FIBER-OPTIC COMMUNICATION LASERS IN INDIUM MARKET, BY PURITY GRADE, 2018-2033 (USD THOUSAND)
TABLE 5991 COLOMBIA PHOTODETECTORS FOR OPTICAL NETWORKS IN INDIUM MARKET, BY PURITY GRADE, 2018-2033 (USD THOUSAND)
TABLE 5992 COLOMBIA 5G INFRASTRUCTURE COMPONENTS IN INDIUM MARKET, BY PURITY GRADE, 2018-2033 (USD THOUSAND)
TABLE 5993 COLOMBIA OPTICAL NETWORK SWITCHING DEVICES IN INDIUM MARKET, BY PURITY GRADE, 2018-2033 (USD THOUSAND)
TABLE 5994 COLOMBIA SATELLITE COMMUNICATION MODULES IN INDIUM MARKET, BY PURITY GRADE, 2018-2033 (USD THOUSAND)
TABLE 5995 COLOMBIA OPTICAL & PHOTONICS INDUSTRY IN INDIUM MARKET, BY TYPE, 2018-2033 (USD THOUSAND)
TABLE 5996 COLOMBIA OPTICAL COATINGS IN INDIUM MARKET, BY PURITY GRADE, 2018-2033 (USD THOUSAND)
TABLE 5997 COLOMBIA FIBER OPTIC COMPONENTS IN INDIUM MARKET, BY PURITY GRADE, 2018-2033 (USD THOUSAND)
TABLE 5998 COLOMBIA LASER COMPONENTS IN INDIUM MARKET, BY PURITY GRADE, 2018-2033 (USD THOUSAND)
TABLE 5999 COLOMBIA OPTICAL SENSORS IN INDIUM MARKET, BY PURITY GRADE, 2018-2033 (USD THOUSAND)
TABLE 6000 COLOMBIA INFRARED OPTICS IN INDIUM MARKET, BY PURITY GRADE, 2018-2033 (USD THOUSAND)
TABLE 6001 COLOMBIA PICS IN INDIUM MARKET, BY PURITY GRADE, 2018-2033 (USD THOUSAND)
TABLE 6002 COLOMBIA MIRRORS IN INDIUM MARKET, BY PURITY GRADE, 2018-2033 (USD THOUSAND)
TABLE 6003 COLOMBIA SPECTROSCOPY IN INDIUM MARKET, BY PURITY GRADE, 2018-2033 (USD THOUSAND)
TABLE 6004 COLOMBIA AEROSPACE & DEFENSE INDUSTRY IN INDIUM MARKET, BY TYPE, 2018-2033 (USD THOUSAND)
TABLE 6005 COLOMBIA INFRARED IMAGING SYSTEMS IN INDIUM MARKET, BY PURITY GRADE, 2018-2033 (USD THOUSAND)
TABLE 6006 COLOMBIA RADAR & RF COMPONENTS IN INDIUM MARKET, BY PURITY GRADE, 2018-2033 (USD THOUSAND)
TABLE 6007 COLOMBIA SATELLITE COMMUNICATION IN INDIUM MARKET, BY PURITY GRADE, 2018-2033 (USD THOUSAND)
TABLE 6008 COLOMBIA MILITARY OPTOELECTRONICS IN INDIUM MARKET, BY PURITY GRADE, 2018-2033 (USD THOUSAND)
TABLE 6009 COLOMBIA AVIONICS DISPLAYS IN INDIUM MARKET, BY PURITY GRADE, 2018-2033 (USD THOUSAND)
TABLE 6010 COLOMBIA SPACECRAFT SOLAR PANELS IN INDIUM MARKET, BY PURITY GRADE, 2018-2033 (USD THOUSAND)
TABLE 6011 COLOMBIA THERMAL MATERIALS IN INDIUM MARKET, BY PURITY GRADE, 2018-2033 (USD THOUSAND)
TABLE 6012 COLOMBIA CRYOGENIC MATERIALS IN INDIUM MARKET, BY PURITY GRADE, 2018-2033 (USD THOUSAND)
TABLE 6013 COLOMBIA MEDICAL DEVICE INDUSTRY IN INDIUM MARKET, BY TYPE, 2018-2033 (USD THOUSAND)
TABLE 6014 COLOMBIA MEDICAL IMAGING SENSORS IN INDIUM MARKET, BY PURITY GRADE, 2018-2033 (USD THOUSAND)
TABLE 6015 COLOMBIA DIAGNOSTIC EQUIPMENT DISPLAYS IN INDIUM MARKET, BY PURITY GRADE, 2018-2033 (USD THOUSAND)
TABLE 6016 COLOMBIA ADVANCED DIAGNOSTIC INSTRUMENTS IN INDIUM MARKET, BY PURITY GRADE, 2018-2033 (USD THOUSAND)
TABLE 6017 COLOMBIA LASER SURGICAL EQUIPMENT IN INDIUM MARKET, BY PURITY GRADE, 2018-2033 (USD THOUSAND)
TABLE 6018 COLOMBIA BIOMEDICAL OPTICAL DEVICES IN INDIUM MARKET, BY PURITY GRADE, 2018-2033 (USD THOUSAND)
TABLE 6019 COLOMBIA RADIATION DETECTION EQUIPMENT IN INDIUM MARKET, BY PURITY GRADE, 2018-2033 (USD THOUSAND)
TABLE 6020 COLOMBIA INFRARED MEDICAL SENSORS IN INDIUM MARKET, BY PURITY GRADE, 2018-2033 (USD THOUSAND)
TABLE 6021 COLOMBIA PHOTOTHERAPY DEVICES IN INDIUM MARKET, BY PURITY GRADE, 2018-2033 (USD THOUSAND)
TABLE 6022 COLOMBIA INDUSTRIAL EQUIPMENT MANUFACTURING IN INDIUM MARKET, BY TYPE, 2018-2033 (USD THOUSAND)
TABLE 6023 COLOMBIA INDUSTRIAL SENSORS IN INDIUM MARKET, BY PURITY GRADE, 2018-2033 (USD THOUSAND)
TABLE 6024 COLOMBIA VACUUM DEPOSITION COATINGS IN INDIUM MARKET, BY PURITY GRADE, 2018-2033 (USD THOUSAND)
TABLE 6025 COLOMBIA PRECISION OPTICAL COMPONENTS IN INDIUM MARKET, BY PURITY GRADE, 2018-2033 (USD THOUSAND)
TABLE 6026 COLOMBIA THERMAL INTERFACE MATERIALS IN INDIUM MARKET, BY PURITY GRADE, 2018-2033 (USD THOUSAND)
TABLE 6027 COLOMBIA INDUSTRIAL LASER SYSTEMS IN INDIUM MARKET, BY PURITY GRADE, 2018-2033 (USD THOUSAND)
TABLE 6028 COLOMBIA INDUSTRIAL INFRARED DETECTORS IN INDIUM MARKET, BY PURITY GRADE, 2018-2033 (USD THOUSAND)
TABLE 6029 COLOMBIA PRECISION MEASUREMENT EQUIPMENT IN INDIUM MARKET, BY PURITY GRADE, 2018-2033 (USD THOUSAND)
TABLE 6030 COLOMBIA SPECIALTY ELECTRONIC COMPONENTS IN INDIUM MARKET, BY PURITY GRADE, 2018-2033 (USD THOUSAND)
TABLE 6031 COLOMBIA OTHERS IN INDIUM MARKET, BY TYPE, 2018-2033 (USD THOUSAND)
TABLE 6032 COLOMBIA ADVANCED MATERIALS MANUFACTURING IN INDIUM MARKET, BY PURITY GRADE, 2018-2033 (USD THOUSAND)
TABLE 6033 COLOMBIA SPECIALTY ALLOY PRODUCTION IN INDIUM MARKET, BY PURITY GRADE, 2018-2033 (USD THOUSAND)
TABLE 6034 COLOMBIA THERMAL MANAGEMENT MATERIALS IN INDIUM MARKET, BY PURITY GRADE, 2018-2033 (USD THOUSAND)
TABLE 6035 COLOMBIA PRECISION SCIENTIFIC INSTRUMENTS IN INDIUM MARKET, BY PURITY GRADE, 2018-2033 (USD THOUSAND)
TABLE 6036 COLOMBIA RESEARCH INSTITUTES & UNIVERSITIES IN INDIUM MARKET, BY PURITY GRADE, 2018-2033 (USD THOUSAND)
TABLE 6037 COLOMBIA NUCLEAR INDUSTRY APPLICATIONS IN INDIUM MARKET, BY PURITY GRADE, 2018-2033 (USD THOUSAND)
TABLE 6038 COLOMBIA SPECIALTY CHEMICAL PRODUCTION IN INDIUM MARKET, BY PURITY GRADE, 2018-2033 (USD THOUSAND)
TABLE 6039 COLOMBIA DEFENSE RESEARCH LABORATORIES IN INDIUM MARKET, BY PURITY GRADE, 2018-2033 (USD THOUSAND)
TABLE 6040 COLOMBIA CRYOGENIC EQUIPMENT MANUFACTURING IN INDIUM MARKET, BY PURITY GRADE, 2018-2033 (USD THOUSAND)
TABLE 6041 BOLIVIA
TABLE 6042 BOLIVIA INDIUM MARKET, BY PRODUCT TYPE, 2018-2033 (USD THOUSAND)
TABLE 6043 BOLIVIA INGOTS IN INDIUM MARKET, BY TYPE, 2018-2033 (USD THOUSAND)
TABLE 6044 BOLIVIA INDIUM MARKET, BY MATERIAL COMPOSITION, 2018-2033 (USD THOUSAND)
TABLE 6045 BOLIVIA INDIUM ALLOYS IN INDIUM MARKET, BY TYPE, 2018-2033 (USD THOUSAND)
TABLE 6046 BOLIVIA INDIUM COMPOUNDS IN INDIUM MARKET, BY TYPE, 2018-2033 (USD THOUSAND)
TABLE 6047 BOLIVIA INDIUM MARKET, BY PURITY GRADE, 2018-2033 (USD THOUSAND)
TABLE 6048 BOLIVIA INDIUM MARKET, BY EXTRACTION SOURCE, 2018-2033 (USD THOUSAND)
TABLE 6049 BOLIVIA PRIMARY PRODUCTION IN INDIUM MARKET, BY TYPE, 2018-2033 (USD THOUSAND)
TABLE 6050 BOLIVIA SECONDARY PRODUCTION IN INDIUM MARKET, BY TYPE, 2018-2033 (USD THOUSAND)
TABLE 6051 BOLIVIA INDIUM MARKET, BY DISTRIBUTION CHANNEL, 2018-2033 (USD THOUSAND)
TABLE 6052 BOLIVIA INDIUM MARKET, BY TECHNOLOGY PLATFORM, 2018-2033 (USD THOUSAND)
TABLE 6053 BOLIVIA INDIUM MARKET, BY END-USER INDUSTRY, 2018-2033 (USD THOUSAND)
TABLE 6054 BOLIVIA CONSUMER ELECTRONICS INDUSTRY IN INDIUM MARKET, BY TYPE, 2018-2033 (USD THOUSAND)
TABLE 6055 BOLIVIA FLAT PANEL DISPLAYS (LCD/OLED/LED) IN INDIUM MARKET, BY PURITY GRADE, 2018-2033 (USD THOUSAND)
TABLE 6056 BOLIVIA TRANSPARENT CONDUCTIVE COATINGS (ITO) IN INDIUM MARKET, BY PURITY GRADE, 2018-2033 (USD THOUSAND)
TABLE 6057 BOLIVIA TOUCHSCREEN DISPLAYS IN INDIUM MARKET, BY PURITY GRADE, 2018-2033 (USD THOUSAND)
TABLE 6058 BOLIVIA FLEXIBLE DISPLAYS & ELECTRONICS IN INDIUM MARKET, BY PURITY GRADE, 2018-2033 (USD THOUSAND)
TABLE 6059 BOLIVIA WEARABLE ELECTRONICS DEVICES IN INDIUM MARKET, BY PURITY GRADE, 2018-2033 (USD THOUSAND)
TABLE 6060 BOLIVIA CAMERA & OPTICAL SENSORS IN INDIUM MARKET, BY PURITY GRADE, 2018-2033 (USD THOUSAND)
TABLE 6061 BOLIVIA MINI-LED BACKLIGHTING IN INDIUM MARKET, BY PURITY GRADE, 2018-2033 (USD THOUSAND)
TABLE 6062 BOLIVIA MICRO-LED DISPLAYS IN INDIUM MARKET, BY PURITY GRADE, 2018-2033 (USD THOUSAND)
TABLE 6063 BOLIVIA DISPLAY PANEL INDUSTRY IN INDIUM MARKET, BY TYPE, 2018-2033 (USD THOUSAND)
TABLE 6064 BOLIVIA LCD PANEL MANUFACTURING IN INDIUM MARKET, BY PURITY GRADE, 2018-2033 (USD THOUSAND)
TABLE 6065 BOLIVIA OLED PANEL MANUFACTURING IN INDIUM MARKET, BY PURITY GRADE, 2018-2033 (USD THOUSAND)
TABLE 6066 BOLIVIA DISPLAY PANEL MANUFACTURING IN INDIUM MARKET, BY PURITY GRADE, 2018-2033 (USD THOUSAND)
TABLE 6067 BOLIVIA TOUCH PANEL SENSORS IN INDIUM MARKET, BY PURITY GRADE, 2018-2033 (USD THOUSAND)
TABLE 6068 BOLIVIA TRANSPARENT CONDUCTIVE FILMS IN INDIUM MARKET, BY PURITY GRADE, 2018-2033 (USD THOUSAND)
TABLE 6069 BOLIVIA FLEXIBLE & FOLDABLE DISPLAYS IN INDIUM MARKET, BY PURITY GRADE, 2018-2033 (USD THOUSAND)
TABLE 6070 BOLIVIA AR/VR DISPLAYS IN INDIUM MARKET, BY PURITY GRADE, 2018-2033 (USD THOUSAND)
TABLE 6071 BOLIVIA MICRODISPLAY DEVICES IN INDIUM MARKET, BY PURITY GRADE, 2018-2033 (USD THOUSAND)
TABLE 6072 BOLIVIA BACKPLANE COATINGS IN INDIUM MARKET, BY PURITY GRADE, 2018-2033 (USD THOUSAND)
TABLE 6073 BOLIVIA SEMICONDUCTOR INDUSTRY IN INDIUM MARKET, BY TYPE, 2018-2033 (USD THOUSAND)
TABLE 6074 BOLIVIA III-V COMPOUND SEMICONDUCTORS IN INDIUM MARKET, BY PURITY GRADE, 2018-2033 (USD THOUSAND)
TABLE 6075 BOLIVIA HIGH-FREQUENCY RF COMPONENTS IN INDIUM MARKET, BY PURITY GRADE, 2018-2033 (USD THOUSAND)
TABLE 6076 BOLIVIA SEMICONDUCTOR SUBSTRATES & EPITAXY IN INDIUM MARKET, BY PURITY GRADE, 2018-2033 (USD THOUSAND)
TABLE 6077 BOLIVIA LASER DIODES IN INDIUM MARKET, BY PURITY GRADE, 2018-2033 (USD THOUSAND)
TABLE 6078 BOLIVIA PHOTODETECTORS IN INDIUM MARKET, BY PURITY GRADE, 2018-2033 (USD THOUSAND)
TABLE 6079 BOLIVIA HIGH-SPEED OPTOELECTRONICS IN INDIUM MARKET, BY PURITY GRADE, 2018-2033 (USD THOUSAND)
TABLE 6080 BOLIVIA INFRARED DETECTORS IN INDIUM MARKET, BY PURITY GRADE, 2018-2033 (USD THOUSAND)
TABLE 6081 BOLIVIA INTEGRATED PHOTONIC CIRCUITS IN INDIUM MARKET, BY PURITY GRADE, 2018-2033 (USD THOUSAND)
TABLE 6082 BOLIVIA SOLAR PHOTOVOLTAIC INDUSTRY IN INDIUM MARKET, BY TYPE, 2018-2033 (USD THOUSAND)
TABLE 6083 BOLIVIA CIGS THIN-FILM SOLAR CELLS IN INDIUM MARKET, BY PURITY GRADE, 2018-2033 (USD THOUSAND)
TABLE 6084 BOLIVIAHIGH-EFFICIENCY MODULES IN INDIUM MARKET, BY PURITY GRADE, 2018-2033 (USD THOUSAND)
TABLE 6085 BOLIVIA THIN-FILM COATINGS IN INDIUM MARKET, BY PURITY GRADE, 2018-2033 (USD THOUSAND)
TABLE 6086 BOLIVIA TRANSPARENT ELECTRODES IN INDIUM MARKET, BY PURITY GRADE, 2018-2033 (USD THOUSAND)
TABLE 6087 BOLIVIA BIPV IN INDIUM MARKET, BY PURITY GRADE, 2018-2033 (USD THOUSAND)
TABLE 6088 BOLIVIA FLEXIBLE SOLAR PANELS IN INDIUM MARKET, BY PURITY GRADE, 2018-2033 (USD THOUSAND)
TABLE 6089 BOLIVIA PORTABLE SOLAR SYSTEMS IN INDIUM MARKET, BY PURITY GRADE, 2018-2033 (USD THOUSAND)
TABLE 6090 BOLIVIA CONCENTRATED PV IN INDIUM MARKET, BY PURITY GRADE, 2018-2033 (USD THOUSAND)
TABLE 6091 BOLIVIA AUTOMOTIVE INDUSTRY IN INDIUM MARKET, BY TYPE, 2018-2033 (USD THOUSAND)
TABLE 6092 BOLIVIA AUTOMOTIVE DISPLAY PANELS IN INDIUM MARKET, BY PURITY GRADE, 2018-2033 (USD THOUSAND)
TABLE 6093 BOLIVIAADAS SENSORS IN INDIUM MARKET, BY PURITY GRADE, 2018-2033 (USD THOUSAND)
TABLE 6094 BOLIVIA VEHICLE CAMERA MODULES IN INDIUM MARKET, BY PURITY GRADE, 2018-2033 (USD THOUSAND)
TABLE 6095 BOLIVIA AUTOMOTIVE OPTOELECTRONICS IN INDIUM MARKET, BY PURITY GRADE, 2018-2033 (USD THOUSAND)
TABLE 6096 BOLIVIA POWER ELECTRONICS IN INDIUM MARKET, BY PURITY GRADE, 2018-2033 (USD THOUSAND)
TABLE 6097 BOLIVIA TOUCHSCREEN INTERFACES IN INDIUM MARKET, BY PURITY GRADE, 2018-2033 (USD THOUSAND)
TABLE 6098 BOLIVIA INFRARED SENSORS IN INDIUM MARKET, BY PURITY GRADE, 2018-2033 (USD THOUSAND)
TABLE 6099 BOLIVIA SMART LIGHTING IN INDIUM MARKET, BY PURITY GRADE, 2018-2033 (USD THOUSAND)
TABLE 6100 BOLIVIA TELECOMMUNICATION EQUIPMENT INDUSTRY IN INDIUM MARKET, BY TYPE, 2018-2033 (USD THOUSAND)
TABLE 6101 BOLIVIA OPTICAL TRANSCEIVERS IN INDIUM MARKET, BY PURITY GRADE, 2018-2033 (USD THOUSAND)
TABLE 6102 BOLIVIA RF POWER AMPLIFIERS IN INDIUM MARKET, BY PURITY GRADE, 2018-2033 (USD THOUSAND)
TABLE 6103 BOLIVIA HIGH-FREQUENCY COMMUNICATION CHIPS IN INDIUM MARKET, BY PURITY GRADE, 2018-2033 (USD THOUSAND)
TABLE 6104 BOLIVIA FIBER-OPTIC COMMUNICATION LASERS IN INDIUM MARKET, BY PURITY GRADE, 2018-2033 (USD THOUSAND)
TABLE 6105 BOLIVIA PHOTODETECTORS FOR OPTICAL NETWORKS IN INDIUM MARKET, BY PURITY GRADE, 2018-2033 (USD THOUSAND)
TABLE 6106 BOLIVIA 5G INFRASTRUCTURE COMPONENTS IN INDIUM MARKET, BY PURITY GRADE, 2018-2033 (USD THOUSAND)
TABLE 6107 BOLIVIA OPTICAL NETWORK SWITCHING DEVICES IN INDIUM MARKET, BY PURITY GRADE, 2018-2033 (USD THOUSAND)
TABLE 6108 BOLIVIA SATELLITE COMMUNICATION MODULES IN INDIUM MARKET, BY PURITY GRADE, 2018-2033 (USD THOUSAND)
TABLE 6109 BOLIVIA OPTICAL & PHOTONICS INDUSTRY IN INDIUM MARKET, BY TYPE, 2018-2033 (USD THOUSAND)
TABLE 6110 BOLIVIA OPTICAL COATINGS IN INDIUM MARKET, BY PURITY GRADE, 2018-2033 (USD THOUSAND)
TABLE 6111 BOLIVIA FIBER OPTIC COMPONENTS IN INDIUM MARKET, BY PURITY GRADE, 2018-2033 (USD THOUSAND)
TABLE 6112 BOLIVIA LASER COMPONENTS IN INDIUM MARKET, BY PURITY GRADE, 2018-2033 (USD THOUSAND)
TABLE 6113 BOLIVIA OPTICAL SENSORS IN INDIUM MARKET, BY PURITY GRADE, 2018-2033 (USD THOUSAND)
TABLE 6114 BOLIVIA INFRARED OPTICS IN INDIUM MARKET, BY PURITY GRADE, 2018-2033 (USD THOUSAND)
TABLE 6115 BOLIVIA PICS IN INDIUM MARKET, BY PURITY GRADE, 2018-2033 (USD THOUSAND)
TABLE 6116 BOLIVIA MIRRORS IN INDIUM MARKET, BY PURITY GRADE, 2018-2033 (USD THOUSAND)
TABLE 6117 BOLIVIA SPECTROSCOPY IN INDIUM MARKET, BY PURITY GRADE, 2018-2033 (USD THOUSAND)
TABLE 6118 BOLIVIA AEROSPACE & DEFENSE INDUSTRY IN INDIUM MARKET, BY TYPE, 2018-2033 (USD THOUSAND)
TABLE 6119 BOLIVIA INFRARED IMAGING SYSTEMS IN INDIUM MARKET, BY PURITY GRADE, 2018-2033 (USD THOUSAND)
TABLE 6120 BOLIVIA RADAR & RF COMPONENTS IN INDIUM MARKET, BY PURITY GRADE, 2018-2033 (USD THOUSAND)
TABLE 6121 BOLIVIA SATELLITE COMMUNICATION IN INDIUM MARKET, BY PURITY GRADE, 2018-2033 (USD THOUSAND)
TABLE 6122 BOLIVIA MILITARY OPTOELECTRONICS IN INDIUM MARKET, BY PURITY GRADE, 2018-2033 (USD THOUSAND)
TABLE 6123 BOLIVIA AVIONICS DISPLAYS IN INDIUM MARKET, BY PURITY GRADE, 2018-2033 (USD THOUSAND)
TABLE 6124 BOLIVIA SPACECRAFT SOLAR PANELS IN INDIUM MARKET, BY PURITY GRADE, 2018-2033 (USD THOUSAND)
TABLE 6125 BOLIVIA THERMAL MATERIALS IN INDIUM MARKET, BY PURITY GRADE, 2018-2033 (USD THOUSAND)
TABLE 6126 BOLIVIA CRYOGENIC MATERIALS IN INDIUM MARKET, BY PURITY GRADE, 2018-2033 (USD THOUSAND)
TABLE 6127 BOLIVIA MEDICAL DEVICE INDUSTRY IN INDIUM MARKET, BY TYPE, 2018-2033 (USD THOUSAND)
TABLE 6128 BOLIVIA MEDICAL IMAGING SENSORS IN INDIUM MARKET, BY PURITY GRADE, 2018-2033 (USD THOUSAND)
TABLE 6129 BOLIVIA DIAGNOSTIC EQUIPMENT DISPLAYS IN INDIUM MARKET, BY PURITY GRADE, 2018-2033 (USD THOUSAND)
TABLE 6130 BOLIVIA ADVANCED DIAGNOSTIC INSTRUMENTS IN INDIUM MARKET, BY PURITY GRADE, 2018-2033 (USD THOUSAND)
TABLE 6131 BOLIVIA LASER SURGICAL EQUIPMENT IN INDIUM MARKET, BY PURITY GRADE, 2018-2033 (USD THOUSAND)
TABLE 6132 BOLIVIA BIOMEDICAL OPTICAL DEVICES IN INDIUM MARKET, BY PURITY GRADE, 2018-2033 (USD THOUSAND)
TABLE 6133 BOLIVIA RADIATION DETECTION EQUIPMENT IN INDIUM MARKET, BY PURITY GRADE, 2018-2033 (USD THOUSAND)
TABLE 6134 BOLIVIA INFRARED MEDICAL SENSORS IN INDIUM MARKET, BY PURITY GRADE, 2018-2033 (USD THOUSAND)
TABLE 6135 BOLIVIA PHOTOTHERAPY DEVICES IN INDIUM MARKET, BY PURITY GRADE, 2018-2033 (USD THOUSAND)
TABLE 6136 BOLIVIA INDUSTRIAL EQUIPMENT MANUFACTURING IN INDIUM MARKET, BY TYPE, 2018-2033 (USD THOUSAND)
TABLE 6137 BOLIVIA INDUSTRIAL SENSORS IN INDIUM MARKET, BY PURITY GRADE, 2018-2033 (USD THOUSAND)
TABLE 6138 BOLIVIA VACUUM DEPOSITION COATINGS IN INDIUM MARKET, BY PURITY GRADE, 2018-2033 (USD THOUSAND)
TABLE 6139 BOLIVIA PRECISION OPTICAL COMPONENTS IN INDIUM MARKET, BY PURITY GRADE, 2018-2033 (USD THOUSAND)
TABLE 6140 BOLIVIA THERMAL INTERFACE MATERIALS IN INDIUM MARKET, BY PURITY GRADE, 2018-2033 (USD THOUSAND)
TABLE 6141 BOLIVIA INDUSTRIAL LASER SYSTEMS IN INDIUM MARKET, BY PURITY GRADE, 2018-2033 (USD THOUSAND)
TABLE 6142 BOLIVIA INDUSTRIAL INFRARED DETECTORS IN INDIUM MARKET, BY PURITY GRADE, 2018-2033 (USD THOUSAND)
TABLE 6143 BOLIVIA PRECISION MEASUREMENT EQUIPMENT IN INDIUM MARKET, BY PURITY GRADE, 2018-2033 (USD THOUSAND)
TABLE 6144 BOLIVIA SPECIALTY ELECTRONIC COMPONENTS IN INDIUM MARKET, BY PURITY GRADE, 2018-2033 (USD THOUSAND)
TABLE 6145 BOLIVIA OTHERS IN INDIUM MARKET, BY TYPE, 2018-2033 (USD THOUSAND)
TABLE 6146 BOLIVIA ADVANCED MATERIALS MANUFACTURING IN INDIUM MARKET, BY PURITY GRADE, 2018-2033 (USD THOUSAND)
TABLE 6147 BOLIVIA SPECIALTY ALLOY PRODUCTION IN INDIUM MARKET, BY PURITY GRADE, 2018-2033 (USD THOUSAND)
TABLE 6148 BOLIVIA THERMAL MANAGEMENT MATERIALS IN INDIUM MARKET, BY PURITY GRADE, 2018-2033 (USD THOUSAND)
TABLE 6149 BOLIVIA PRECISION SCIENTIFIC INSTRUMENTS IN INDIUM MARKET, BY PURITY GRADE, 2018-2033 (USD THOUSAND)
TABLE 6150 BOLIVIA RESEARCH INSTITUTES & UNIVERSITIES IN INDIUM MARKET, BY PURITY GRADE, 2018-2033 (USD THOUSAND)
TABLE 6151 BOLIVIA NUCLEAR INDUSTRY APPLICATIONS IN INDIUM MARKET, BY PURITY GRADE, 2018-2033 (USD THOUSAND)
TABLE 6152 BOLIVIA SPECIALTY CHEMICAL PRODUCTION IN INDIUM MARKET, BY PURITY GRADE, 2018-2033 (USD THOUSAND)
TABLE 6153 BOLIVIA DEFENSE RESEARCH LABORATORIES IN INDIUM MARKET, BY PURITY GRADE, 2018-2033 (USD THOUSAND)
TABLE 6154 BOLIVIA CRYOGENIC EQUIPMENT MANUFACTURING IN INDIUM MARKET, BY PURITY GRADE, 2018-2033 (USD THOUSAND)
TABLE 6155 VENEZUELA INDIUM MARKET, BY PRODUCT TYPE, 2018-2033 (USD THOUSAND)
TABLE 6156 VENEZUELA INGOTS IN INDIUM MARKET, BY TYPE, 2018-2033 (USD THOUSAND)
TABLE 6157 VENEZUELA INDIUM MARKET, BY MATERIAL COMPOSITION, 2018-2033 (USD THOUSAND)
TABLE 6158 VENEZUELA INDIUM ALLOYS IN INDIUM MARKET, BY TYPE, 2018-2033 (USD THOUSAND)
TABLE 6159 VENEZUELA INDIUM COMPOUNDS IN INDIUM MARKET, BY TYPE, 2018-2033 (USD THOUSAND)
TABLE 6160 VENEZUELA INDIUM MARKET, BY PURITY GRADE, 2018-2033 (USD THOUSAND)
TABLE 6161 VENEZUELA INDIUM MARKET, BY EXTRACTION SOURCE, 2018-2033 (USD THOUSAND)
TABLE 6162 VENEZUELA PRIMARY PRODUCTION IN INDIUM MARKET, BY TYPE, 2018-2033 (USD THOUSAND)
TABLE 6163 VENEZUELA SECONDARY PRODUCTION IN INDIUM MARKET, BY TYPE, 2018-2033 (USD THOUSAND)
TABLE 6164 VENEZUELA INDIUM MARKET, BY DISTRIBUTION CHANNEL, 2018-2033 (USD THOUSAND)
TABLE 6165 VENEZUELA INDIUM MARKET, BY TECHNOLOGY PLATFORM, 2018-2033 (USD THOUSAND)
TABLE 6166 VENEZUELA INDIUM MARKET, BY END-USER INDUSTRY, 2018-2033 (USD THOUSAND)
TABLE 6167 VENEZUELA CONSUMER ELECTRONICS INDUSTRY IN INDIUM MARKET, BY TYPE, 2018-2033 (USD THOUSAND)
TABLE 6168 VENEZUELA FLAT PANEL DISPLAYS (LCD/OLED/LED) IN INDIUM MARKET, BY PURITY GRADE, 2018-2033 (USD THOUSAND)
TABLE 6169 VENEZUELA TRANSPARENT CONDUCTIVE COATINGS (ITO) IN INDIUM MARKET, BY PURITY GRADE, 2018-2033 (USD THOUSAND)
TABLE 6170 VENEZUELA TOUCHSCREEN DISPLAYS IN INDIUM MARKET, BY PURITY GRADE, 2018-2033 (USD THOUSAND)
TABLE 6171 VENEZUELA FLEXIBLE DISPLAYS & ELECTRONICS IN INDIUM MARKET, BY PURITY GRADE, 2018-2033 (USD THOUSAND)
TABLE 6172 VENEZUELA WEARABLE ELECTRONICS DEVICES IN INDIUM MARKET, BY PURITY GRADE, 2018-2033 (USD THOUSAND)
TABLE 6173 VENEZUELA CAMERA & OPTICAL SENSORS IN INDIUM MARKET, BY PURITY GRADE, 2018-2033 (USD THOUSAND)
TABLE 6174 VENEZUELA MINI-LED BACKLIGHTING IN INDIUM MARKET, BY PURITY GRADE, 2018-2033 (USD THOUSAND)
TABLE 6175 VENEZUELA MICRO-LED DISPLAYS IN INDIUM MARKET, BY PURITY GRADE, 2018-2033 (USD THOUSAND)
TABLE 6176 VENEZUELA DISPLAY PANEL INDUSTRY IN INDIUM MARKET, BY TYPE, 2018-2033 (USD THOUSAND)
TABLE 6177 VENEZUELA LCD PANEL MANUFACTURING IN INDIUM MARKET, BY PURITY GRADE, 2018-2033 (USD THOUSAND)
TABLE 6178 VENEZUELA OLED PANEL MANUFACTURING IN INDIUM MARKET, BY PURITY GRADE, 2018-2033 (USD THOUSAND)
TABLE 6179 VENEZUELA DISPLAY PANEL MANUFACTURING IN INDIUM MARKET, BY PURITY GRADE, 2018-2033 (USD THOUSAND)
TABLE 6180 VENEZUELA TOUCH PANEL SENSORS IN INDIUM MARKET, BY PURITY GRADE, 2018-2033 (USD THOUSAND)
TABLE 6181 VENEZUELA TRANSPARENT CONDUCTIVE FILMS IN INDIUM MARKET, BY PURITY GRADE, 2018-2033 (USD THOUSAND)
TABLE 6182 VENEZUELA FLEXIBLE & FOLDABLE DISPLAYS IN INDIUM MARKET, BY PURITY GRADE, 2018-2033 (USD THOUSAND)
TABLE 6183 VENEZUELA AR/VR DISPLAYS IN INDIUM MARKET, BY PURITY GRADE, 2018-2033 (USD THOUSAND)
TABLE 6184 VENEZUELA MICRODISPLAY DEVICES IN INDIUM MARKET, BY PURITY GRADE, 2018-2033 (USD THOUSAND)
TABLE 6185 VENEZUELA BACKPLANE COATINGS IN INDIUM MARKET, BY PURITY GRADE, 2018-2033 (USD THOUSAND)
TABLE 6186 VENEZUELA SEMICONDUCTOR INDUSTRY IN INDIUM MARKET, BY TYPE, 2018-2033 (USD THOUSAND)
TABLE 6187 VENEZUELA III-V COMPOUND SEMICONDUCTORS IN INDIUM MARKET, BY PURITY GRADE, 2018-2033 (USD THOUSAND)
TABLE 6188 VENEZUELA HIGH-FREQUENCY RF COMPONENTS IN INDIUM MARKET, BY PURITY GRADE, 2018-2033 (USD THOUSAND)
TABLE 6189 VENEZUELA SEMICONDUCTOR SUBSTRATES & EPITAXY IN INDIUM MARKET, BY PURITY GRADE, 2018-2033 (USD THOUSAND)
TABLE 6190 VENEZUELA LASER DIODES IN INDIUM MARKET, BY PURITY GRADE, 2018-2033 (USD THOUSAND)
TABLE 6191 VENEZUELA PHOTODETECTORS IN INDIUM MARKET, BY PURITY GRADE, 2018-2033 (USD THOUSAND)
TABLE 6192 VENEZUELA HIGH-SPEED OPTOELECTRONICS IN INDIUM MARKET, BY PURITY GRADE, 2018-2033 (USD THOUSAND)
TABLE 6193 VENEZUELA INFRARED DETECTORS IN INDIUM MARKET, BY PURITY GRADE, 2018-2033 (USD THOUSAND)
TABLE 6194 VENEZUELA INTEGRATED PHOTONIC CIRCUITS IN INDIUM MARKET, BY PURITY GRADE, 2018-2033 (USD THOUSAND)
TABLE 6195 VENEZUELA SOLAR PHOTOVOLTAIC INDUSTRY IN INDIUM MARKET, BY TYPE, 2018-2033 (USD THOUSAND)
TABLE 6196 VENEZUELA CIGS THIN-FILM SOLAR CELLS IN INDIUM MARKET, BY PURITY GRADE, 2018-2033 (USD THOUSAND)
TABLE 6197 VENEZUELAHIGH-EFFICIENCY MODULES IN INDIUM MARKET, BY PURITY GRADE, 2018-2033 (USD THOUSAND)
TABLE 6198 VENEZUELA THIN-FILM COATINGS IN INDIUM MARKET, BY PURITY GRADE, 2018-2033 (USD THOUSAND)
TABLE 6199 VENEZUELA TRANSPARENT ELECTRODES IN INDIUM MARKET, BY PURITY GRADE, 2018-2033 (USD THOUSAND)
TABLE 6200 VENEZUELA BIPV IN INDIUM MARKET, BY PURITY GRADE, 2018-2033 (USD THOUSAND)
TABLE 6201 VENEZUELA FLEXIBLE SOLAR PANELS IN INDIUM MARKET, BY PURITY GRADE, 2018-2033 (USD THOUSAND)
TABLE 6202 VENEZUELA PORTABLE SOLAR SYSTEMS IN INDIUM MARKET, BY PURITY GRADE, 2018-2033 (USD THOUSAND)
TABLE 6203 VENEZUELA CONCENTRATED PV IN INDIUM MARKET, BY PURITY GRADE, 2018-2033 (USD THOUSAND)
TABLE 6204 VENEZUELA AUTOMOTIVE INDUSTRY IN INDIUM MARKET, BY TYPE, 2018-2033 (USD THOUSAND)
TABLE 6205 VENEZUELA AUTOMOTIVE DISPLAY PANELS IN INDIUM MARKET, BY PURITY GRADE, 2018-2033 (USD THOUSAND)
TABLE 6206 VENEZUELAADAS SENSORS IN INDIUM MARKET, BY PURITY GRADE, 2018-2033 (USD THOUSAND)
TABLE 6207 VENEZUELA VEHICLE CAMERA MODULES IN INDIUM MARKET, BY PURITY GRADE, 2018-2033 (USD THOUSAND)
TABLE 6208 VENEZUELA AUTOMOTIVE OPTOELECTRONICS IN INDIUM MARKET, BY PURITY GRADE, 2018-2033 (USD THOUSAND)
TABLE 6209 VENEZUELA POWER ELECTRONICS IN INDIUM MARKET, BY PURITY GRADE, 2018-2033 (USD THOUSAND)
TABLE 6210 VENEZUELA TOUCHSCREEN INTERFACES IN INDIUM MARKET, BY PURITY GRADE, 2018-2033 (USD THOUSAND)
TABLE 6211 VENEZUELA INFRARED SENSORS IN INDIUM MARKET, BY PURITY GRADE, 2018-2033 (USD THOUSAND)
TABLE 6212 VENEZUELA SMART LIGHTING IN INDIUM MARKET, BY PURITY GRADE, 2018-2033 (USD THOUSAND)
TABLE 6213 VENEZUELA TELECOMMUNICATION EQUIPMENT INDUSTRY IN INDIUM MARKET, BY TYPE, 2018-2033 (USD THOUSAND)
TABLE 6214 VENEZUELA OPTICAL TRANSCEIVERS IN INDIUM MARKET, BY PURITY GRADE, 2018-2033 (USD THOUSAND)
TABLE 6215 VENEZUELA RF POWER AMPLIFIERS IN INDIUM MARKET, BY PURITY GRADE, 2018-2033 (USD THOUSAND)
TABLE 6216 VENEZUELA HIGH-FREQUENCY COMMUNICATION CHIPS IN INDIUM MARKET, BY PURITY GRADE, 2018-2033 (USD THOUSAND)
TABLE 6217 VENEZUELA FIBER-OPTIC COMMUNICATION LASERS IN INDIUM MARKET, BY PURITY GRADE, 2018-2033 (USD THOUSAND)
TABLE 6218 VENEZUELA PHOTODETECTORS FOR OPTICAL NETWORKS IN INDIUM MARKET, BY PURITY GRADE, 2018-2033 (USD THOUSAND)
TABLE 6219 VENEZUELA 5G INFRASTRUCTURE COMPONENTS IN INDIUM MARKET, BY PURITY GRADE, 2018-2033 (USD THOUSAND)
TABLE 6220 VENEZUELA OPTICAL NETWORK SWITCHING DEVICES IN INDIUM MARKET, BY PURITY GRADE, 2018-2033 (USD THOUSAND)
TABLE 6221 VENEZUELA SATELLITE COMMUNICATION MODULES IN INDIUM MARKET, BY PURITY GRADE, 2018-2033 (USD THOUSAND)
TABLE 6222 VENEZUELA OPTICAL & PHOTONICS INDUSTRY IN INDIUM MARKET, BY TYPE, 2018-2033 (USD THOUSAND)
TABLE 6223 VENEZUELA OPTICAL COATINGS IN INDIUM MARKET, BY PURITY GRADE, 2018-2033 (USD THOUSAND)
TABLE 6224 VENEZUELA FIBER OPTIC COMPONENTS IN INDIUM MARKET, BY PURITY GRADE, 2018-2033 (USD THOUSAND)
TABLE 6225 VENEZUELA LASER COMPONENTS IN INDIUM MARKET, BY PURITY GRADE, 2018-2033 (USD THOUSAND)
TABLE 6226 VENEZUELA OPTICAL SENSORS IN INDIUM MARKET, BY PURITY GRADE, 2018-2033 (USD THOUSAND)
TABLE 6227 VENEZUELA INFRARED OPTICS IN INDIUM MARKET, BY PURITY GRADE, 2018-2033 (USD THOUSAND)
TABLE 6228 VENEZUELA PICS IN INDIUM MARKET, BY PURITY GRADE, 2018-2033 (USD THOUSAND)
TABLE 6229 VENEZUELA MIRRORS IN INDIUM MARKET, BY PURITY GRADE, 2018-2033 (USD THOUSAND)
TABLE 6230 VENEZUELA SPECTROSCOPY IN INDIUM MARKET, BY PURITY GRADE, 2018-2033 (USD THOUSAND)
TABLE 6231 VENEZUELA AEROSPACE & DEFENSE INDUSTRY IN INDIUM MARKET, BY TYPE, 2018-2033 (USD THOUSAND)
TABLE 6232 VENEZUELA INFRARED IMAGING SYSTEMS IN INDIUM MARKET, BY PURITY GRADE, 2018-2033 (USD THOUSAND)
TABLE 6233 VENEZUELA RADAR & RF COMPONENTS IN INDIUM MARKET, BY PURITY GRADE, 2018-2033 (USD THOUSAND)
TABLE 6234 VENEZUELA SATELLITE COMMUNICATION IN INDIUM MARKET, BY PURITY GRADE, 2018-2033 (USD THOUSAND)
TABLE 6235 VENEZUELA MILITARY OPTOELECTRONICS IN INDIUM MARKET, BY PURITY GRADE, 2018-2033 (USD THOUSAND)
TABLE 6236 VENEZUELA AVIONICS DISPLAYS IN INDIUM MARKET, BY PURITY GRADE, 2018-2033 (USD THOUSAND)
TABLE 6237 VENEZUELA SPACECRAFT SOLAR PANELS IN INDIUM MARKET, BY PURITY GRADE, 2018-2033 (USD THOUSAND)
TABLE 6238 VENEZUELA THERMAL MATERIALS IN INDIUM MARKET, BY PURITY GRADE, 2018-2033 (USD THOUSAND)
TABLE 6239 VENEZUELA CRYOGENIC MATERIALS IN INDIUM MARKET, BY PURITY GRADE, 2018-2033 (USD THOUSAND)
TABLE 6240 VENEZUELA MEDICAL DEVICE INDUSTRY IN INDIUM MARKET, BY TYPE, 2018-2033 (USD THOUSAND)
TABLE 6241 VENEZUELA MEDICAL IMAGING SENSORS IN INDIUM MARKET, BY PURITY GRADE, 2018-2033 (USD THOUSAND)
TABLE 6242 VENEZUELA DIAGNOSTIC EQUIPMENT DISPLAYS IN INDIUM MARKET, BY PURITY GRADE, 2018-2033 (USD THOUSAND)
TABLE 6243 VENEZUELA ADVANCED DIAGNOSTIC INSTRUMENTS IN INDIUM MARKET, BY PURITY GRADE, 2018-2033 (USD THOUSAND)
TABLE 6244 VENEZUELA LASER SURGICAL EQUIPMENT IN INDIUM MARKET, BY PURITY GRADE, 2018-2033 (USD THOUSAND)
TABLE 6245 VENEZUELA BIOMEDICAL OPTICAL DEVICES IN INDIUM MARKET, BY PURITY GRADE, 2018-2033 (USD THOUSAND)
TABLE 6246 VENEZUELA RADIATION DETECTION EQUIPMENT IN INDIUM MARKET, BY PURITY GRADE, 2018-2033 (USD THOUSAND)
TABLE 6247 VENEZUELA INFRARED MEDICAL SENSORS IN INDIUM MARKET, BY PURITY GRADE, 2018-2033 (USD THOUSAND)
TABLE 6248 VENEZUELA PHOTOTHERAPY DEVICES IN INDIUM MARKET, BY PURITY GRADE, 2018-2033 (USD THOUSAND)
TABLE 6249 VENEZUELA INDUSTRIAL EQUIPMENT MANUFACTURING IN INDIUM MARKET, BY TYPE, 2018-2033 (USD THOUSAND)
TABLE 6250 VENEZUELA INDUSTRIAL SENSORS IN INDIUM MARKET, BY PURITY GRADE, 2018-2033 (USD THOUSAND)
TABLE 6251 VENEZUELA VACUUM DEPOSITION COATINGS IN INDIUM MARKET, BY PURITY GRADE, 2018-2033 (USD THOUSAND)
TABLE 6252 VENEZUELA PRECISION OPTICAL COMPONENTS IN INDIUM MARKET, BY PURITY GRADE, 2018-2033 (USD THOUSAND)
TABLE 6253 VENEZUELA THERMAL INTERFACE MATERIALS IN INDIUM MARKET, BY PURITY GRADE, 2018-2033 (USD THOUSAND)
TABLE 6254 VENEZUELA INDUSTRIAL LASER SYSTEMS IN INDIUM MARKET, BY PURITY GRADE, 2018-2033 (USD THOUSAND)
TABLE 6255 VENEZUELA INDUSTRIAL INFRARED DETECTORS IN INDIUM MARKET, BY PURITY GRADE, 2018-2033 (USD THOUSAND)
TABLE 6256 VENEZUELA PRECISION MEASUREMENT EQUIPMENT IN INDIUM MARKET, BY PURITY GRADE, 2018-2033 (USD THOUSAND)
TABLE 6257 VENEZUELA SPECIALTY ELECTRONIC COMPONENTS IN INDIUM MARKET, BY PURITY GRADE, 2018-2033 (USD THOUSAND)
TABLE 6258 VENEZUELA OTHERS IN INDIUM MARKET, BY TYPE, 2018-2033 (USD THOUSAND)
TABLE 6259 VENEZUELA ADVANCED MATERIALS MANUFACTURING IN INDIUM MARKET, BY PURITY GRADE, 2018-2033 (USD THOUSAND)
TABLE 6260 VENEZUELA SPECIALTY ALLOY PRODUCTION IN INDIUM MARKET, BY PURITY GRADE, 2018-2033 (USD THOUSAND)
TABLE 6261 VENEZUELA THERMAL MANAGEMENT MATERIALS IN INDIUM MARKET, BY PURITY GRADE, 2018-2033 (USD THOUSAND)
TABLE 6262 VENEZUELA PRECISION SCIENTIFIC INSTRUMENTS IN INDIUM MARKET, BY PURITY GRADE, 2018-2033 (USD THOUSAND)
TABLE 6263 VENEZUELA RESEARCH INSTITUTES & UNIVERSITIES IN INDIUM MARKET, BY PURITY GRADE, 2018-2033 (USD THOUSAND)
TABLE 6264 VENEZUELA NUCLEAR INDUSTRY APPLICATIONS IN INDIUM MARKET, BY PURITY GRADE, 2018-2033 (USD THOUSAND)
TABLE 6265 VENEZUELA SPECIALTY CHEMICAL PRODUCTION IN INDIUM MARKET, BY PURITY GRADE, 2018-2033 (USD THOUSAND)
TABLE 6266 VENEZUELA DEFENSE RESEARCH LABORATORIES IN INDIUM MARKET, BY PURITY GRADE, 2018-2033 (USD THOUSAND)
TABLE 6267 VENEZUELA CRYOGENIC EQUIPMENT MANUFACTURING IN INDIUM MARKET, BY PURITY GRADE, 2018-2033 (USD THOUSAND)
TABLE 6268 ECUADOR INDIUM MARKET, BY PRODUCT TYPE, 2018-2033 (USD THOUSAND)
TABLE 6269 ECUADOR INGOTS IN INDIUM MARKET, BY TYPE, 2018-2033 (USD THOUSAND)
TABLE 6270 ECUADOR INDIUM MARKET, BY MATERIAL COMPOSITION, 2018-2033 (USD THOUSAND)
TABLE 6271 ECUADOR INDIUM ALLOYS IN INDIUM MARKET, BY TYPE, 2018-2033 (USD THOUSAND)
TABLE 6272 ECUADOR INDIUM COMPOUNDS IN INDIUM MARKET, BY TYPE, 2018-2033 (USD THOUSAND)
TABLE 6273 ECUADOR INDIUM MARKET, BY PURITY GRADE, 2018-2033 (USD THOUSAND)
TABLE 6274 ECUADOR INDIUM MARKET, BY EXTRACTION SOURCE, 2018-2033 (USD THOUSAND)
TABLE 6275 ECUADOR PRIMARY PRODUCTION IN INDIUM MARKET, BY TYPE, 2018-2033 (USD THOUSAND)
TABLE 6276 ECUADOR SECONDARY PRODUCTION IN INDIUM MARKET, BY TYPE, 2018-2033 (USD THOUSAND)
TABLE 6277 ECUADOR INDIUM MARKET, BY DISTRIBUTION CHANNEL, 2018-2033 (USD THOUSAND)
TABLE 6278 ECUADOR INDIUM MARKET, BY TECHNOLOGY PLATFORM, 2018-2033 (USD THOUSAND)
TABLE 6279 ECUADOR INDIUM MARKET, BY END-USER INDUSTRY, 2018-2033 (USD THOUSAND)
TABLE 6280 ECUADOR CONSUMER ELECTRONICS INDUSTRY IN INDIUM MARKET, BY TYPE, 2018-2033 (USD THOUSAND)
TABLE 6281 ECUADOR FLAT PANEL DISPLAYS (LCD/OLED/LED) IN INDIUM MARKET, BY PURITY GRADE, 2018-2033 (USD THOUSAND)
TABLE 6282 ECUADOR TRANSPARENT CONDUCTIVE COATINGS (ITO) IN INDIUM MARKET, BY PURITY GRADE, 2018-2033 (USD THOUSAND)
TABLE 6283 ECUADOR TOUCHSCREEN DISPLAYS IN INDIUM MARKET, BY PURITY GRADE, 2018-2033 (USD THOUSAND)
TABLE 6284 ECUADOR FLEXIBLE DISPLAYS & ELECTRONICS IN INDIUM MARKET, BY PURITY GRADE, 2018-2033 (USD THOUSAND)
TABLE 6285 ECUADOR WEARABLE ELECTRONICS DEVICES IN INDIUM MARKET, BY PURITY GRADE, 2018-2033 (USD THOUSAND)
TABLE 6286 ECUADOR CAMERA & OPTICAL SENSORS IN INDIUM MARKET, BY PURITY GRADE, 2018-2033 (USD THOUSAND)
TABLE 6287 ECUADOR MINI-LED BACKLIGHTING IN INDIUM MARKET, BY PURITY GRADE, 2018-2033 (USD THOUSAND)
TABLE 6288 ECUADOR MICRO-LED DISPLAYS IN INDIUM MARKET, BY PURITY GRADE, 2018-2033 (USD THOUSAND)
TABLE 6289 ECUADOR DISPLAY PANEL INDUSTRY IN INDIUM MARKET, BY TYPE, 2018-2033 (USD THOUSAND)
TABLE 6290 ECUADOR LCD PANEL MANUFACTURING IN INDIUM MARKET, BY PURITY GRADE, 2018-2033 (USD THOUSAND)
TABLE 6291 ECUADOR OLED PANEL MANUFACTURING IN INDIUM MARKET, BY PURITY GRADE, 2018-2033 (USD THOUSAND)
TABLE 6292 ECUADOR DISPLAY PANEL MANUFACTURING IN INDIUM MARKET, BY PURITY GRADE, 2018-2033 (USD THOUSAND)
TABLE 6293 ECUADOR TOUCH PANEL SENSORS IN INDIUM MARKET, BY PURITY GRADE, 2018-2033 (USD THOUSAND)
TABLE 6294 ECUADOR TRANSPARENT CONDUCTIVE FILMS IN INDIUM MARKET, BY PURITY GRADE, 2018-2033 (USD THOUSAND)
TABLE 6295 ECUADOR FLEXIBLE & FOLDABLE DISPLAYS IN INDIUM MARKET, BY PURITY GRADE, 2018-2033 (USD THOUSAND)
TABLE 6296 ECUADOR AR/VR DISPLAYS IN INDIUM MARKET, BY PURITY GRADE, 2018-2033 (USD THOUSAND)
TABLE 6297 ECUADOR MICRODISPLAY DEVICES IN INDIUM MARKET, BY PURITY GRADE, 2018-2033 (USD THOUSAND)
TABLE 6298 ECUADOR BACKPLANE COATINGS IN INDIUM MARKET, BY PURITY GRADE, 2018-2033 (USD THOUSAND)
TABLE 6299 ECUADOR SEMICONDUCTOR INDUSTRY IN INDIUM MARKET, BY TYPE, 2018-2033 (USD THOUSAND)
TABLE 6300 ECUADOR III-V COMPOUND SEMICONDUCTORS IN INDIUM MARKET, BY PURITY GRADE, 2018-2033 (USD THOUSAND)
TABLE 6301 ECUADOR HIGH-FREQUENCY RF COMPONENTS IN INDIUM MARKET, BY PURITY GRADE, 2018-2033 (USD THOUSAND)
TABLE 6302 ECUADOR SEMICONDUCTOR SUBSTRATES & EPITAXY IN INDIUM MARKET, BY PURITY GRADE, 2018-2033 (USD THOUSAND)
TABLE 6303 ECUADOR LASER DIODES IN INDIUM MARKET, BY PURITY GRADE, 2018-2033 (USD THOUSAND)
TABLE 6304 ECUADOR PHOTODETECTORS IN INDIUM MARKET, BY PURITY GRADE, 2018-2033 (USD THOUSAND)
TABLE 6305 ECUADOR HIGH-SPEED OPTOELECTRONICS IN INDIUM MARKET, BY PURITY GRADE, 2018-2033 (USD THOUSAND)
TABLE 6306 ECUADOR INFRARED DETECTORS IN INDIUM MARKET, BY PURITY GRADE, 2018-2033 (USD THOUSAND)
TABLE 6307 ECUADOR INTEGRATED PHOTONIC CIRCUITS IN INDIUM MARKET, BY PURITY GRADE, 2018-2033 (USD THOUSAND)
TABLE 6308 ECUADOR SOLAR PHOTOVOLTAIC INDUSTRY IN INDIUM MARKET, BY TYPE, 2018-2033 (USD THOUSAND)
TABLE 6309 ECUADOR CIGS THIN-FILM SOLAR CELLS IN INDIUM MARKET, BY PURITY GRADE, 2018-2033 (USD THOUSAND)
TABLE 6310 ECUADORHIGH-EFFICIENCY MODULES IN INDIUM MARKET, BY PURITY GRADE, 2018-2033 (USD THOUSAND)
TABLE 6311 ECUADOR THIN-FILM COATINGS IN INDIUM MARKET, BY PURITY GRADE, 2018-2033 (USD THOUSAND)
TABLE 6312 ECUADOR TRANSPARENT ELECTRODES IN INDIUM MARKET, BY PURITY GRADE, 2018-2033 (USD THOUSAND)
TABLE 6313 ECUADOR BIPV IN INDIUM MARKET, BY PURITY GRADE, 2018-2033 (USD THOUSAND)
TABLE 6314 ECUADOR FLEXIBLE SOLAR PANELS IN INDIUM MARKET, BY PURITY GRADE, 2018-2033 (USD THOUSAND)
TABLE 6315 ECUADOR PORTABLE SOLAR SYSTEMS IN INDIUM MARKET, BY PURITY GRADE, 2018-2033 (USD THOUSAND)
TABLE 6316 ECUADOR CONCENTRATED PV IN INDIUM MARKET, BY PURITY GRADE, 2018-2033 (USD THOUSAND)
TABLE 6317 ECUADOR AUTOMOTIVE INDUSTRY IN INDIUM MARKET, BY TYPE, 2018-2033 (USD THOUSAND)
TABLE 6318 ECUADOR AUTOMOTIVE DISPLAY PANELS IN INDIUM MARKET, BY PURITY GRADE, 2018-2033 (USD THOUSAND)
TABLE 6319 ECUADORADAS SENSORS IN INDIUM MARKET, BY PURITY GRADE, 2018-2033 (USD THOUSAND)
TABLE 6320 ECUADOR VEHICLE CAMERA MODULES IN INDIUM MARKET, BY PURITY GRADE, 2018-2033 (USD THOUSAND)
TABLE 6321 ECUADOR AUTOMOTIVE OPTOELECTRONICS IN INDIUM MARKET, BY PURITY GRADE, 2018-2033 (USD THOUSAND)
TABLE 6322 ECUADOR POWER ELECTRONICS IN INDIUM MARKET, BY PURITY GRADE, 2018-2033 (USD THOUSAND)
TABLE 6323 ECUADOR TOUCHSCREEN INTERFACES IN INDIUM MARKET, BY PURITY GRADE, 2018-2033 (USD THOUSAND)
TABLE 6324 ECUADOR INFRARED SENSORS IN INDIUM MARKET, BY PURITY GRADE, 2018-2033 (USD THOUSAND)
TABLE 6325 ECUADOR SMART LIGHTING IN INDIUM MARKET, BY PURITY GRADE, 2018-2033 (USD THOUSAND)
TABLE 6326 ECUADOR TELECOMMUNICATION EQUIPMENT INDUSTRY IN INDIUM MARKET, BY TYPE, 2018-2033 (USD THOUSAND)
TABLE 6327 ECUADOR OPTICAL TRANSCEIVERS IN INDIUM MARKET, BY PURITY GRADE, 2018-2033 (USD THOUSAND)
TABLE 6328 ECUADOR RF POWER AMPLIFIERS IN INDIUM MARKET, BY PURITY GRADE, 2018-2033 (USD THOUSAND)
TABLE 6329 ECUADOR HIGH-FREQUENCY COMMUNICATION CHIPS IN INDIUM MARKET, BY PURITY GRADE, 2018-2033 (USD THOUSAND)
TABLE 6330 ECUADOR FIBER-OPTIC COMMUNICATION LASERS IN INDIUM MARKET, BY PURITY GRADE, 2018-2033 (USD THOUSAND)
TABLE 6331 ECUADOR PHOTODETECTORS FOR OPTICAL NETWORKS IN INDIUM MARKET, BY PURITY GRADE, 2018-2033 (USD THOUSAND)
TABLE 6332 ECUADOR 5G INFRASTRUCTURE COMPONENTS IN INDIUM MARKET, BY PURITY GRADE, 2018-2033 (USD THOUSAND)
TABLE 6333 ECUADOR OPTICAL NETWORK SWITCHING DEVICES IN INDIUM MARKET, BY PURITY GRADE, 2018-2033 (USD THOUSAND)
TABLE 6334 ECUADOR SATELLITE COMMUNICATION MODULES IN INDIUM MARKET, BY PURITY GRADE, 2018-2033 (USD THOUSAND)
TABLE 6335 ECUADOR OPTICAL & PHOTONICS INDUSTRY IN INDIUM MARKET, BY TYPE, 2018-2033 (USD THOUSAND)
TABLE 6336 ECUADOR OPTICAL COATINGS IN INDIUM MARKET, BY PURITY GRADE, 2018-2033 (USD THOUSAND)
TABLE 6337 ECUADOR FIBER OPTIC COMPONENTS IN INDIUM MARKET, BY PURITY GRADE, 2018-2033 (USD THOUSAND)
TABLE 6338 ECUADOR LASER COMPONENTS IN INDIUM MARKET, BY PURITY GRADE, 2018-2033 (USD THOUSAND)
TABLE 6339 ECUADOR OPTICAL SENSORS IN INDIUM MARKET, BY PURITY GRADE, 2018-2033 (USD THOUSAND)
TABLE 6340 ECUADOR INFRARED OPTICS IN INDIUM MARKET, BY PURITY GRADE, 2018-2033 (USD THOUSAND)
TABLE 6341 ECUADOR PICS IN INDIUM MARKET, BY PURITY GRADE, 2018-2033 (USD THOUSAND)
TABLE 6342 ECUADOR MIRRORS IN INDIUM MARKET, BY PURITY GRADE, 2018-2033 (USD THOUSAND)
TABLE 6343 ECUADOR SPECTROSCOPY IN INDIUM MARKET, BY PURITY GRADE, 2018-2033 (USD THOUSAND)
TABLE 6344 ECUADOR AEROSPACE & DEFENSE INDUSTRY IN INDIUM MARKET, BY TYPE, 2018-2033 (USD THOUSAND)
TABLE 6345 ECUADOR INFRARED IMAGING SYSTEMS IN INDIUM MARKET, BY PURITY GRADE, 2018-2033 (USD THOUSAND)
TABLE 6346 ECUADOR RADAR & RF COMPONENTS IN INDIUM MARKET, BY PURITY GRADE, 2018-2033 (USD THOUSAND)
TABLE 6347 ECUADOR SATELLITE COMMUNICATION IN INDIUM MARKET, BY PURITY GRADE, 2018-2033 (USD THOUSAND)
TABLE 6348 ECUADOR MILITARY OPTOELECTRONICS IN INDIUM MARKET, BY PURITY GRADE, 2018-2033 (USD THOUSAND)
TABLE 6349 ECUADOR AVIONICS DISPLAYS IN INDIUM MARKET, BY PURITY GRADE, 2018-2033 (USD THOUSAND)
TABLE 6350 ECUADOR SPACECRAFT SOLAR PANELS IN INDIUM MARKET, BY PURITY GRADE, 2018-2033 (USD THOUSAND)
TABLE 6351 ECUADOR THERMAL MATERIALS IN INDIUM MARKET, BY PURITY GRADE, 2018-2033 (USD THOUSAND)
TABLE 6352 ECUADOR CRYOGENIC MATERIALS IN INDIUM MARKET, BY PURITY GRADE, 2018-2033 (USD THOUSAND)
TABLE 6353 ECUADOR MEDICAL DEVICE INDUSTRY IN INDIUM MARKET, BY TYPE, 2018-2033 (USD THOUSAND)
TABLE 6354 ECUADOR MEDICAL IMAGING SENSORS IN INDIUM MARKET, BY PURITY GRADE, 2018-2033 (USD THOUSAND)
TABLE 6355 ECUADOR DIAGNOSTIC EQUIPMENT DISPLAYS IN INDIUM MARKET, BY PURITY GRADE, 2018-2033 (USD THOUSAND)
TABLE 6356 ECUADOR ADVANCED DIAGNOSTIC INSTRUMENTS IN INDIUM MARKET, BY PURITY GRADE, 2018-2033 (USD THOUSAND)
TABLE 6357 ECUADOR LASER SURGICAL EQUIPMENT IN INDIUM MARKET, BY PURITY GRADE, 2018-2033 (USD THOUSAND)
TABLE 6358 ECUADOR BIOMEDICAL OPTICAL DEVICES IN INDIUM MARKET, BY PURITY GRADE, 2018-2033 (USD THOUSAND)
TABLE 6359 ECUADOR RADIATION DETECTION EQUIPMENT IN INDIUM MARKET, BY PURITY GRADE, 2018-2033 (USD THOUSAND)
TABLE 6360 ECUADOR INFRARED MEDICAL SENSORS IN INDIUM MARKET, BY PURITY GRADE, 2018-2033 (USD THOUSAND)
TABLE 6361 ECUADOR PHOTOTHERAPY DEVICES IN INDIUM MARKET, BY PURITY GRADE, 2018-2033 (USD THOUSAND)
TABLE 6362 ECUADOR INDUSTRIAL EQUIPMENT MANUFACTURING IN INDIUM MARKET, BY TYPE, 2018-2033 (USD THOUSAND)
TABLE 6363 ECUADOR INDUSTRIAL SENSORS IN INDIUM MARKET, BY PURITY GRADE, 2018-2033 (USD THOUSAND)
TABLE 6364 ECUADOR VACUUM DEPOSITION COATINGS IN INDIUM MARKET, BY PURITY GRADE, 2018-2033 (USD THOUSAND)
TABLE 6365 ECUADOR PRECISION OPTICAL COMPONENTS IN INDIUM MARKET, BY PURITY GRADE, 2018-2033 (USD THOUSAND)
TABLE 6366 ECUADOR THERMAL INTERFACE MATERIALS IN INDIUM MARKET, BY PURITY GRADE, 2018-2033 (USD THOUSAND)
TABLE 6367 ECUADOR INDUSTRIAL LASER SYSTEMS IN INDIUM MARKET, BY PURITY GRADE, 2018-2033 (USD THOUSAND)
TABLE 6368 ECUADOR INDUSTRIAL INFRARED DETECTORS IN INDIUM MARKET, BY PURITY GRADE, 2018-2033 (USD THOUSAND)
TABLE 6369 ECUADOR PRECISION MEASUREMENT EQUIPMENT IN INDIUM MARKET, BY PURITY GRADE, 2018-2033 (USD THOUSAND)
TABLE 6370 ECUADOR SPECIALTY ELECTRONIC COMPONENTS IN INDIUM MARKET, BY PURITY GRADE, 2018-2033 (USD THOUSAND)
TABLE 6371 ECUADOR OTHERS IN INDIUM MARKET, BY TYPE, 2018-2033 (USD THOUSAND)
TABLE 6372 ECUADOR ADVANCED MATERIALS MANUFACTURING IN INDIUM MARKET, BY PURITY GRADE, 2018-2033 (USD THOUSAND)
TABLE 6373 ECUADOR SPECIALTY ALLOY PRODUCTION IN INDIUM MARKET, BY PURITY GRADE, 2018-2033 (USD THOUSAND)
TABLE 6374 ECUADOR THERMAL MANAGEMENT MATERIALS IN INDIUM MARKET, BY PURITY GRADE, 2018-2033 (USD THOUSAND)
TABLE 6375 ECUADOR PRECISION SCIENTIFIC INSTRUMENTS IN INDIUM MARKET, BY PURITY GRADE, 2018-2033 (USD THOUSAND)
TABLE 6376 ECUADOR RESEARCH INSTITUTES & UNIVERSITIES IN INDIUM MARKET, BY PURITY GRADE, 2018-2033 (USD THOUSAND)
TABLE 6377 ECUADOR NUCLEAR INDUSTRY APPLICATIONS IN INDIUM MARKET, BY PURITY GRADE, 2018-2033 (USD THOUSAND)
TABLE 6378 ECUADOR SPECIALTY CHEMICAL PRODUCTION IN INDIUM MARKET, BY PURITY GRADE, 2018-2033 (USD THOUSAND)
TABLE 6379 ECUADOR DEFENSE RESEARCH LABORATORIES IN INDIUM MARKET, BY PURITY GRADE, 2018-2033 (USD THOUSAND)
TABLE 6380 ECUADOR CRYOGENIC EQUIPMENT MANUFACTURING IN INDIUM MARKET, BY PURITY GRADE, 2018-2033 (USD THOUSAND)
TABLE 6381 URUGUAY INDIUM MARKET, BY PRODUCT TYPE, 2018-2033 (USD THOUSAND)
TABLE 6382 URUGUAY INGOTS IN INDIUM MARKET, BY TYPE, 2018-2033 (USD THOUSAND)
TABLE 6383 URUGUAY INDIUM MARKET, BY MATERIAL COMPOSITION, 2018-2033 (USD THOUSAND)
TABLE 6384 URUGUAY INDIUM ALLOYS IN INDIUM MARKET, BY TYPE, 2018-2033 (USD THOUSAND)
TABLE 6385 URUGUAY INDIUM COMPOUNDS IN INDIUM MARKET, BY TYPE, 2018-2033 (USD THOUSAND)
TABLE 6386 URUGUAY INDIUM MARKET, BY PURITY GRADE, 2018-2033 (USD THOUSAND)
TABLE 6387 URUGUAY INDIUM MARKET, BY EXTRACTION SOURCE, 2018-2033 (USD THOUSAND)
TABLE 6388 URUGUAY PRIMARY PRODUCTION IN INDIUM MARKET, BY TYPE, 2018-2033 (USD THOUSAND)
TABLE 6389 URUGUAY SECONDARY PRODUCTION IN INDIUM MARKET, BY TYPE, 2018-2033 (USD THOUSAND)
TABLE 6390 URUGUAY INDIUM MARKET, BY DISTRIBUTION CHANNEL, 2018-2033 (USD THOUSAND)
TABLE 6391 URUGUAY INDIUM MARKET, BY TECHNOLOGY PLATFORM, 2018-2033 (USD THOUSAND)
TABLE 6392 URUGUAY INDIUM MARKET, BY END-USER INDUSTRY, 2018-2033 (USD THOUSAND)
TABLE 6393 URUGUAY CONSUMER ELECTRONICS INDUSTRY IN INDIUM MARKET, BY TYPE, 2018-2033 (USD THOUSAND)
TABLE 6394 URUGUAY FLAT PANEL DISPLAYS (LCD/OLED/LED) IN INDIUM MARKET, BY PURITY GRADE, 2018-2033 (USD THOUSAND)
TABLE 6395 URUGUAY TRANSPARENT CONDUCTIVE COATINGS (ITO) IN INDIUM MARKET, BY PURITY GRADE, 2018-2033 (USD THOUSAND)
TABLE 6396 URUGUAY TOUCHSCREEN DISPLAYS IN INDIUM MARKET, BY PURITY GRADE, 2018-2033 (USD THOUSAND)
TABLE 6397 URUGUAY FLEXIBLE DISPLAYS & ELECTRONICS IN INDIUM MARKET, BY PURITY GRADE, 2018-2033 (USD THOUSAND)
TABLE 6398 URUGUAY WEARABLE ELECTRONICS DEVICES IN INDIUM MARKET, BY PURITY GRADE, 2018-2033 (USD THOUSAND)
TABLE 6399 URUGUAY CAMERA & OPTICAL SENSORS IN INDIUM MARKET, BY PURITY GRADE, 2018-2033 (USD THOUSAND)
TABLE 6400 URUGUAY MINI-LED BACKLIGHTING IN INDIUM MARKET, BY PURITY GRADE, 2018-2033 (USD THOUSAND)
TABLE 6401 URUGUAY MICRO-LED DISPLAYS IN INDIUM MARKET, BY PURITY GRADE, 2018-2033 (USD THOUSAND)
TABLE 6402 URUGUAY DISPLAY PANEL INDUSTRY IN INDIUM MARKET, BY TYPE, 2018-2033 (USD THOUSAND)
TABLE 6403 URUGUAY LCD PANEL MANUFACTURING IN INDIUM MARKET, BY PURITY GRADE, 2018-2033 (USD THOUSAND)
TABLE 6404 URUGUAY OLED PANEL MANUFACTURING IN INDIUM MARKET, BY PURITY GRADE, 2018-2033 (USD THOUSAND)
TABLE 6405 URUGUAY DISPLAY PANEL MANUFACTURING IN INDIUM MARKET, BY PURITY GRADE, 2018-2033 (USD THOUSAND)
TABLE 6406 URUGUAY TOUCH PANEL SENSORS IN INDIUM MARKET, BY PURITY GRADE, 2018-2033 (USD THOUSAND)
TABLE 6407 URUGUAY TRANSPARENT CONDUCTIVE FILMS IN INDIUM MARKET, BY PURITY GRADE, 2018-2033 (USD THOUSAND)
TABLE 6408 URUGUAY FLEXIBLE & FOLDABLE DISPLAYS IN INDIUM MARKET, BY PURITY GRADE, 2018-2033 (USD THOUSAND)
TABLE 6409 URUGUAY AR/VR DISPLAYS IN INDIUM MARKET, BY PURITY GRADE, 2018-2033 (USD THOUSAND)
TABLE 6410 URUGUAY MICRODISPLAY DEVICES IN INDIUM MARKET, BY PURITY GRADE, 2018-2033 (USD THOUSAND)
TABLE 6411 URUGUAY BACKPLANE COATINGS IN INDIUM MARKET, BY PURITY GRADE, 2018-2033 (USD THOUSAND)
TABLE 6412 URUGUAY SEMICONDUCTOR INDUSTRY IN INDIUM MARKET, BY TYPE, 2018-2033 (USD THOUSAND)
TABLE 6413 URUGUAY III-V COMPOUND SEMICONDUCTORS IN INDIUM MARKET, BY PURITY GRADE, 2018-2033 (USD THOUSAND)
TABLE 6414 URUGUAY HIGH-FREQUENCY RF COMPONENTS IN INDIUM MARKET, BY PURITY GRADE, 2018-2033 (USD THOUSAND)
TABLE 6415 URUGUAY SEMICONDUCTOR SUBSTRATES & EPITAXY IN INDIUM MARKET, BY PURITY GRADE, 2018-2033 (USD THOUSAND)
TABLE 6416 URUGUAY LASER DIODES IN INDIUM MARKET, BY PURITY GRADE, 2018-2033 (USD THOUSAND)
TABLE 6417 URUGUAY PHOTODETECTORS IN INDIUM MARKET, BY PURITY GRADE, 2018-2033 (USD THOUSAND)
TABLE 6418 URUGUAY HIGH-SPEED OPTOELECTRONICS IN INDIUM MARKET, BY PURITY GRADE, 2018-2033 (USD THOUSAND)
TABLE 6419 URUGUAY INFRARED DETECTORS IN INDIUM MARKET, BY PURITY GRADE, 2018-2033 (USD THOUSAND)
TABLE 6420 URUGUAY INTEGRATED PHOTONIC CIRCUITS IN INDIUM MARKET, BY PURITY GRADE, 2018-2033 (USD THOUSAND)
TABLE 6421 URUGUAY SOLAR PHOTOVOLTAIC INDUSTRY IN INDIUM MARKET, BY TYPE, 2018-2033 (USD THOUSAND)
TABLE 6422 URUGUAY CIGS THIN-FILM SOLAR CELLS IN INDIUM MARKET, BY PURITY GRADE, 2018-2033 (USD THOUSAND)
TABLE 6423 URUGUAYHIGH-EFFICIENCY MODULES IN INDIUM MARKET, BY PURITY GRADE, 2018-2033 (USD THOUSAND)
TABLE 6424 URUGUAY THIN-FILM COATINGS IN INDIUM MARKET, BY PURITY GRADE, 2018-2033 (USD THOUSAND)
TABLE 6425 URUGUAY TRANSPARENT ELECTRODES IN INDIUM MARKET, BY PURITY GRADE, 2018-2033 (USD THOUSAND)
TABLE 6426 URUGUAY BIPV IN INDIUM MARKET, BY PURITY GRADE, 2018-2033 (USD THOUSAND)
TABLE 6427 URUGUAY FLEXIBLE SOLAR PANELS IN INDIUM MARKET, BY PURITY GRADE, 2018-2033 (USD THOUSAND)
TABLE 6428 URUGUAY PORTABLE SOLAR SYSTEMS IN INDIUM MARKET, BY PURITY GRADE, 2018-2033 (USD THOUSAND)
TABLE 6429 URUGUAY CONCENTRATED PV IN INDIUM MARKET, BY PURITY GRADE, 2018-2033 (USD THOUSAND)
TABLE 6430 URUGUAY AUTOMOTIVE INDUSTRY IN INDIUM MARKET, BY TYPE, 2018-2033 (USD THOUSAND)
TABLE 6431 URUGUAY AUTOMOTIVE DISPLAY PANELS IN INDIUM MARKET, BY PURITY GRADE, 2018-2033 (USD THOUSAND)
TABLE 6432 URUGUAYADAS SENSORS IN INDIUM MARKET, BY PURITY GRADE, 2018-2033 (USD THOUSAND)
TABLE 6433 URUGUAY VEHICLE CAMERA MODULES IN INDIUM MARKET, BY PURITY GRADE, 2018-2033 (USD THOUSAND)
TABLE 6434 URUGUAY AUTOMOTIVE OPTOELECTRONICS IN INDIUM MARKET, BY PURITY GRADE, 2018-2033 (USD THOUSAND)
TABLE 6435 URUGUAY POWER ELECTRONICS IN INDIUM MARKET, BY PURITY GRADE, 2018-2033 (USD THOUSAND)
TABLE 6436 URUGUAY TOUCHSCREEN INTERFACES IN INDIUM MARKET, BY PURITY GRADE, 2018-2033 (USD THOUSAND)
TABLE 6437 URUGUAY INFRARED SENSORS IN INDIUM MARKET, BY PURITY GRADE, 2018-2033 (USD THOUSAND)
TABLE 6438 URUGUAY SMART LIGHTING IN INDIUM MARKET, BY PURITY GRADE, 2018-2033 (USD THOUSAND)
TABLE 6439 URUGUAY TELECOMMUNICATION EQUIPMENT INDUSTRY IN INDIUM MARKET, BY TYPE, 2018-2033 (USD THOUSAND)
TABLE 6440 URUGUAY OPTICAL TRANSCEIVERS IN INDIUM MARKET, BY PURITY GRADE, 2018-2033 (USD THOUSAND)
TABLE 6441 URUGUAY RF POWER AMPLIFIERS IN INDIUM MARKET, BY PURITY GRADE, 2018-2033 (USD THOUSAND)
TABLE 6442 URUGUAY HIGH-FREQUENCY COMMUNICATION CHIPS IN INDIUM MARKET, BY PURITY GRADE, 2018-2033 (USD THOUSAND)
TABLE 6443 URUGUAY FIBER-OPTIC COMMUNICATION LASERS IN INDIUM MARKET, BY PURITY GRADE, 2018-2033 (USD THOUSAND)
TABLE 6444 URUGUAY PHOTODETECTORS FOR OPTICAL NETWORKS IN INDIUM MARKET, BY PURITY GRADE, 2018-2033 (USD THOUSAND)
TABLE 6445 URUGUAY 5G INFRASTRUCTURE COMPONENTS IN INDIUM MARKET, BY PURITY GRADE, 2018-2033 (USD THOUSAND)
TABLE 6446 URUGUAY OPTICAL NETWORK SWITCHING DEVICES IN INDIUM MARKET, BY PURITY GRADE, 2018-2033 (USD THOUSAND)
TABLE 6447 URUGUAY SATELLITE COMMUNICATION MODULES IN INDIUM MARKET, BY PURITY GRADE, 2018-2033 (USD THOUSAND)
TABLE 6448 URUGUAY OPTICAL & PHOTONICS INDUSTRY IN INDIUM MARKET, BY TYPE, 2018-2033 (USD THOUSAND)
TABLE 6449 URUGUAY OPTICAL COATINGS IN INDIUM MARKET, BY PURITY GRADE, 2018-2033 (USD THOUSAND)
TABLE 6450 URUGUAY FIBER OPTIC COMPONENTS IN INDIUM MARKET, BY PURITY GRADE, 2018-2033 (USD THOUSAND)
TABLE 6451 URUGUAY LASER COMPONENTS IN INDIUM MARKET, BY PURITY GRADE, 2018-2033 (USD THOUSAND)
TABLE 6452 URUGUAY OPTICAL SENSORS IN INDIUM MARKET, BY PURITY GRADE, 2018-2033 (USD THOUSAND)
TABLE 6453 URUGUAY INFRARED OPTICS IN INDIUM MARKET, BY PURITY GRADE, 2018-2033 (USD THOUSAND)
TABLE 6454 URUGUAY PICS IN INDIUM MARKET, BY PURITY GRADE, 2018-2033 (USD THOUSAND)
TABLE 6455 URUGUAY MIRRORS IN INDIUM MARKET, BY PURITY GRADE, 2018-2033 (USD THOUSAND)
TABLE 6456 URUGUAY SPECTROSCOPY IN INDIUM MARKET, BY PURITY GRADE, 2018-2033 (USD THOUSAND)
TABLE 6457 URUGUAY AEROSPACE & DEFENSE INDUSTRY IN INDIUM MARKET, BY TYPE, 2018-2033 (USD THOUSAND)
TABLE 6458 URUGUAY INFRARED IMAGING SYSTEMS IN INDIUM MARKET, BY PURITY GRADE, 2018-2033 (USD THOUSAND)
TABLE 6459 URUGUAY RADAR & RF COMPONENTS IN INDIUM MARKET, BY PURITY GRADE, 2018-2033 (USD THOUSAND)
TABLE 6460 URUGUAY SATELLITE COMMUNICATION IN INDIUM MARKET, BY PURITY GRADE, 2018-2033 (USD THOUSAND)
TABLE 6461 URUGUAY MILITARY OPTOELECTRONICS IN INDIUM MARKET, BY PURITY GRADE, 2018-2033 (USD THOUSAND)
TABLE 6462 URUGUAY AVIONICS DISPLAYS IN INDIUM MARKET, BY PURITY GRADE, 2018-2033 (USD THOUSAND)
TABLE 6463 URUGUAY SPACECRAFT SOLAR PANELS IN INDIUM MARKET, BY PURITY GRADE, 2018-2033 (USD THOUSAND)
TABLE 6464 URUGUAY THERMAL MATERIALS IN INDIUM MARKET, BY PURITY GRADE, 2018-2033 (USD THOUSAND)
TABLE 6465 URUGUAY CRYOGENIC MATERIALS IN INDIUM MARKET, BY PURITY GRADE, 2018-2033 (USD THOUSAND)
TABLE 6466 URUGUAY MEDICAL DEVICE INDUSTRY IN INDIUM MARKET, BY TYPE, 2018-2033 (USD THOUSAND)
TABLE 6467 URUGUAY MEDICAL IMAGING SENSORS IN INDIUM MARKET, BY PURITY GRADE, 2018-2033 (USD THOUSAND)
TABLE 6468 URUGUAY DIAGNOSTIC EQUIPMENT DISPLAYS IN INDIUM MARKET, BY PURITY GRADE, 2018-2033 (USD THOUSAND)
TABLE 6469 URUGUAY ADVANCED DIAGNOSTIC INSTRUMENTS IN INDIUM MARKET, BY PURITY GRADE, 2018-2033 (USD THOUSAND)
TABLE 6470 URUGUAY LASER SURGICAL EQUIPMENT IN INDIUM MARKET, BY PURITY GRADE, 2018-2033 (USD THOUSAND)
TABLE 6471 URUGUAY BIOMEDICAL OPTICAL DEVICES IN INDIUM MARKET, BY PURITY GRADE, 2018-2033 (USD THOUSAND)
TABLE 6472 URUGUAY RADIATION DETECTION EQUIPMENT IN INDIUM MARKET, BY PURITY GRADE, 2018-2033 (USD THOUSAND)
TABLE 6473 URUGUAY INFRARED MEDICAL SENSORS IN INDIUM MARKET, BY PURITY GRADE, 2018-2033 (USD THOUSAND)
TABLE 6474 URUGUAY PHOTOTHERAPY DEVICES IN INDIUM MARKET, BY PURITY GRADE, 2018-2033 (USD THOUSAND)
TABLE 6475 URUGUAY INDUSTRIAL EQUIPMENT MANUFACTURING IN INDIUM MARKET, BY TYPE, 2018-2033 (USD THOUSAND)
TABLE 6476 URUGUAY INDUSTRIAL SENSORS IN INDIUM MARKET, BY PURITY GRADE, 2018-2033 (USD THOUSAND)
TABLE 6477 URUGUAY VACUUM DEPOSITION COATINGS IN INDIUM MARKET, BY PURITY GRADE, 2018-2033 (USD THOUSAND)
TABLE 6478 URUGUAY PRECISION OPTICAL COMPONENTS IN INDIUM MARKET, BY PURITY GRADE, 2018-2033 (USD THOUSAND)
TABLE 6479 URUGUAY THERMAL INTERFACE MATERIALS IN INDIUM MARKET, BY PURITY GRADE, 2018-2033 (USD THOUSAND)
TABLE 6480 URUGUAY INDUSTRIAL LASER SYSTEMS IN INDIUM MARKET, BY PURITY GRADE, 2018-2033 (USD THOUSAND)
TABLE 6481 URUGUAY INDUSTRIAL INFRARED DETECTORS IN INDIUM MARKET, BY PURITY GRADE, 2018-2033 (USD THOUSAND)
TABLE 6482 URUGUAY PRECISION MEASUREMENT EQUIPMENT IN INDIUM MARKET, BY PURITY GRADE, 2018-2033 (USD THOUSAND)
TABLE 6483 URUGUAY SPECIALTY ELECTRONIC COMPONENTS IN INDIUM MARKET, BY PURITY GRADE, 2018-2033 (USD THOUSAND)
TABLE 6484 URUGUAY OTHERS IN INDIUM MARKET, BY TYPE, 2018-2033 (USD THOUSAND)
TABLE 6485 URUGUAY ADVANCED MATERIALS MANUFACTURING IN INDIUM MARKET, BY PURITY GRADE, 2018-2033 (USD THOUSAND)
TABLE 6486 URUGUAY SPECIALTY ALLOY PRODUCTION IN INDIUM MARKET, BY PURITY GRADE, 2018-2033 (USD THOUSAND)
TABLE 6487 URUGUAY THERMAL MANAGEMENT MATERIALS IN INDIUM MARKET, BY PURITY GRADE, 2018-2033 (USD THOUSAND)
TABLE 6488 URUGUAY PRECISION SCIENTIFIC INSTRUMENTS IN INDIUM MARKET, BY PURITY GRADE, 2018-2033 (USD THOUSAND)
TABLE 6489 URUGUAY RESEARCH INSTITUTES & UNIVERSITIES IN INDIUM MARKET, BY PURITY GRADE, 2018-2033 (USD THOUSAND)
TABLE 6490 URUGUAY NUCLEAR INDUSTRY APPLICATIONS IN INDIUM MARKET, BY PURITY GRADE, 2018-2033 (USD THOUSAND)
TABLE 6491 URUGUAY SPECIALTY CHEMICAL PRODUCTION IN INDIUM MARKET, BY PURITY GRADE, 2018-2033 (USD THOUSAND)
TABLE 6492 URUGUAY DEFENSE RESEARCH LABORATORIES IN INDIUM MARKET, BY PURITY GRADE, 2018-2033 (USD THOUSAND)
TABLE 6493 URUGUAY CRYOGENIC EQUIPMENT MANUFACTURING IN INDIUM MARKET, BY PURITY GRADE, 2018-2033 (USD THOUSAND)
TABLE 6494 PARAGUAY INDIUM MARKET, BY PRODUCT TYPE, 2018-2033 (USD THOUSAND)
TABLE 6495 PARAGUAY INGOTS IN INDIUM MARKET, BY TYPE, 2018-2033 (USD THOUSAND)
TABLE 6496 PARAGUAY INDIUM MARKET, BY MATERIAL COMPOSITION, 2018-2033 (USD THOUSAND)
TABLE 6497 PARAGUAY INDIUM ALLOYS IN INDIUM MARKET, BY TYPE, 2018-2033 (USD THOUSAND)
TABLE 6498 PARAGUAY INDIUM COMPOUNDS IN INDIUM MARKET, BY TYPE, 2018-2033 (USD THOUSAND)
TABLE 6499 PARAGUAY INDIUM MARKET, BY PURITY GRADE, 2018-2033 (USD THOUSAND)
TABLE 6500 PARAGUAY INDIUM MARKET, BY EXTRACTION SOURCE, 2018-2033 (USD THOUSAND)
TABLE 6501 PARAGUAY PRIMARY PRODUCTION IN INDIUM MARKET, BY TYPE, 2018-2033 (USD THOUSAND)
TABLE 6502 PARAGUAY SECONDARY PRODUCTION IN INDIUM MARKET, BY TYPE, 2018-2033 (USD THOUSAND)
TABLE 6503 PARAGUAY INDIUM MARKET, BY DISTRIBUTION CHANNEL, 2018-2033 (USD THOUSAND)
TABLE 6504 PARAGUAY INDIUM MARKET, BY TECHNOLOGY PLATFORM, 2018-2033 (USD THOUSAND)
TABLE 6505 PARAGUAY INDIUM MARKET, BY END-USER INDUSTRY, 2018-2033 (USD THOUSAND)
TABLE 6506 PARAGUAY CONSUMER ELECTRONICS INDUSTRY IN INDIUM MARKET, BY TYPE, 2018-2033 (USD THOUSAND)
TABLE 6507 PARAGUAY FLAT PANEL DISPLAYS (LCD/OLED/LED) IN INDIUM MARKET, BY PURITY GRADE, 2018-2033 (USD THOUSAND)
TABLE 6508 PARAGUAY TRANSPARENT CONDUCTIVE COATINGS (ITO) IN INDIUM MARKET, BY PURITY GRADE, 2018-2033 (USD THOUSAND)
TABLE 6509 PARAGUAY TOUCHSCREEN DISPLAYS IN INDIUM MARKET, BY PURITY GRADE, 2018-2033 (USD THOUSAND)
TABLE 6510 PARAGUAY FLEXIBLE DISPLAYS & ELECTRONICS IN INDIUM MARKET, BY PURITY GRADE, 2018-2033 (USD THOUSAND)
TABLE 6511 PARAGUAY WEARABLE ELECTRONICS DEVICES IN INDIUM MARKET, BY PURITY GRADE, 2018-2033 (USD THOUSAND)
TABLE 6512 PARAGUAY CAMERA & OPTICAL SENSORS IN INDIUM MARKET, BY PURITY GRADE, 2018-2033 (USD THOUSAND)
TABLE 6513 PARAGUAY MINI-LED BACKLIGHTING IN INDIUM MARKET, BY PURITY GRADE, 2018-2033 (USD THOUSAND)
TABLE 6514 PARAGUAY MICRO-LED DISPLAYS IN INDIUM MARKET, BY PURITY GRADE, 2018-2033 (USD THOUSAND)
TABLE 6515 PARAGUAY DISPLAY PANEL INDUSTRY IN INDIUM MARKET, BY TYPE, 2018-2033 (USD THOUSAND)
TABLE 6516 PARAGUAY LCD PANEL MANUFACTURING IN INDIUM MARKET, BY PURITY GRADE, 2018-2033 (USD THOUSAND)
TABLE 6517 PARAGUAY OLED PANEL MANUFACTURING IN INDIUM MARKET, BY PURITY GRADE, 2018-2033 (USD THOUSAND)
TABLE 6518 PARAGUAY DISPLAY PANEL MANUFACTURING IN INDIUM MARKET, BY PURITY GRADE, 2018-2033 (USD THOUSAND)
TABLE 6519 PARAGUAY TOUCH PANEL SENSORS IN INDIUM MARKET, BY PURITY GRADE, 2018-2033 (USD THOUSAND)
TABLE 6520 PARAGUAY TRANSPARENT CONDUCTIVE FILMS IN INDIUM MARKET, BY PURITY GRADE, 2018-2033 (USD THOUSAND)
TABLE 6521 PARAGUAY FLEXIBLE & FOLDABLE DISPLAYS IN INDIUM MARKET, BY PURITY GRADE, 2018-2033 (USD THOUSAND)
TABLE 6522 PARAGUAY AR/VR DISPLAYS IN INDIUM MARKET, BY PURITY GRADE, 2018-2033 (USD THOUSAND)
TABLE 6523 PARAGUAY MICRODISPLAY DEVICES IN INDIUM MARKET, BY PURITY GRADE, 2018-2033 (USD THOUSAND)
TABLE 6524 PARAGUAY BACKPLANE COATINGS IN INDIUM MARKET, BY PURITY GRADE, 2018-2033 (USD THOUSAND)
TABLE 6525 PARAGUAY SEMICONDUCTOR INDUSTRY IN INDIUM MARKET, BY TYPE, 2018-2033 (USD THOUSAND)
TABLE 6526 PARAGUAY III-V COMPOUND SEMICONDUCTORS IN INDIUM MARKET, BY PURITY GRADE, 2018-2033 (USD THOUSAND)
TABLE 6527 PARAGUAY HIGH-FREQUENCY RF COMPONENTS IN INDIUM MARKET, BY PURITY GRADE, 2018-2033 (USD THOUSAND)
TABLE 6528 PARAGUAY SEMICONDUCTOR SUBSTRATES & EPITAXY IN INDIUM MARKET, BY PURITY GRADE, 2018-2033 (USD THOUSAND)
TABLE 6529 PARAGUAY LASER DIODES IN INDIUM MARKET, BY PURITY GRADE, 2018-2033 (USD THOUSAND)
TABLE 6530 PARAGUAY PHOTODETECTORS IN INDIUM MARKET, BY PURITY GRADE, 2018-2033 (USD THOUSAND)
TABLE 6531 PARAGUAY HIGH-SPEED OPTOELECTRONICS IN INDIUM MARKET, BY PURITY GRADE, 2018-2033 (USD THOUSAND)
TABLE 6532 PARAGUAY INFRARED DETECTORS IN INDIUM MARKET, BY PURITY GRADE, 2018-2033 (USD THOUSAND)
TABLE 6533 PARAGUAY INTEGRATED PHOTONIC CIRCUITS IN INDIUM MARKET, BY PURITY GRADE, 2018-2033 (USD THOUSAND)
TABLE 6534 PARAGUAY SOLAR PHOTOVOLTAIC INDUSTRY IN INDIUM MARKET, BY TYPE, 2018-2033 (USD THOUSAND)
TABLE 6535 PARAGUAY CIGS THIN-FILM SOLAR CELLS IN INDIUM MARKET, BY PURITY GRADE, 2018-2033 (USD THOUSAND)
TABLE 6536 PARAGUAYHIGH-EFFICIENCY MODULES IN INDIUM MARKET, BY PURITY GRADE, 2018-2033 (USD THOUSAND)
TABLE 6537 PARAGUAY THIN-FILM COATINGS IN INDIUM MARKET, BY PURITY GRADE, 2018-2033 (USD THOUSAND)
TABLE 6538 PARAGUAY TRANSPARENT ELECTRODES IN INDIUM MARKET, BY PURITY GRADE, 2018-2033 (USD THOUSAND)
TABLE 6539 PARAGUAY BIPV IN INDIUM MARKET, BY PURITY GRADE, 2018-2033 (USD THOUSAND)
TABLE 6540 PARAGUAY FLEXIBLE SOLAR PANELS IN INDIUM MARKET, BY PURITY GRADE, 2018-2033 (USD THOUSAND)
TABLE 6541 PARAGUAY PORTABLE SOLAR SYSTEMS IN INDIUM MARKET, BY PURITY GRADE, 2018-2033 (USD THOUSAND)
TABLE 6542 PARAGUAY CONCENTRATED PV IN INDIUM MARKET, BY PURITY GRADE, 2018-2033 (USD THOUSAND)
TABLE 6543 PARAGUAY AUTOMOTIVE INDUSTRY IN INDIUM MARKET, BY TYPE, 2018-2033 (USD THOUSAND)
TABLE 6544 PARAGUAY AUTOMOTIVE DISPLAY PANELS IN INDIUM MARKET, BY PURITY GRADE, 2018-2033 (USD THOUSAND)
TABLE 6545 PARAGUAYADAS SENSORS IN INDIUM MARKET, BY PURITY GRADE, 2018-2033 (USD THOUSAND)
TABLE 6546 PARAGUAY VEHICLE CAMERA MODULES IN INDIUM MARKET, BY PURITY GRADE, 2018-2033 (USD THOUSAND)
TABLE 6547 PARAGUAY AUTOMOTIVE OPTOELECTRONICS IN INDIUM MARKET, BY PURITY GRADE, 2018-2033 (USD THOUSAND)
TABLE 6548 PARAGUAY POWER ELECTRONICS IN INDIUM MARKET, BY PURITY GRADE, 2018-2033 (USD THOUSAND)
TABLE 6549 PARAGUAY TOUCHSCREEN INTERFACES IN INDIUM MARKET, BY PURITY GRADE, 2018-2033 (USD THOUSAND)
TABLE 6550 PARAGUAY INFRARED SENSORS IN INDIUM MARKET, BY PURITY GRADE, 2018-2033 (USD THOUSAND)
TABLE 6551 PARAGUAY SMART LIGHTING IN INDIUM MARKET, BY PURITY GRADE, 2018-2033 (USD THOUSAND)
TABLE 6552 PARAGUAY TELECOMMUNICATION EQUIPMENT INDUSTRY IN INDIUM MARKET, BY TYPE, 2018-2033 (USD THOUSAND)
TABLE 6553 PARAGUAY OPTICAL TRANSCEIVERS IN INDIUM MARKET, BY PURITY GRADE, 2018-2033 (USD THOUSAND)
TABLE 6554 PARAGUAY RF POWER AMPLIFIERS IN INDIUM MARKET, BY PURITY GRADE, 2018-2033 (USD THOUSAND)
TABLE 6555 PARAGUAY HIGH-FREQUENCY COMMUNICATION CHIPS IN INDIUM MARKET, BY PURITY GRADE, 2018-2033 (USD THOUSAND)
TABLE 6556 PARAGUAY FIBER-OPTIC COMMUNICATION LASERS IN INDIUM MARKET, BY PURITY GRADE, 2018-2033 (USD THOUSAND)
TABLE 6557 PARAGUAY PHOTODETECTORS FOR OPTICAL NETWORKS IN INDIUM MARKET, BY PURITY GRADE, 2018-2033 (USD THOUSAND)
TABLE 6558 PARAGUAY 5G INFRASTRUCTURE COMPONENTS IN INDIUM MARKET, BY PURITY GRADE, 2018-2033 (USD THOUSAND)
TABLE 6559 PARAGUAY OPTICAL NETWORK SWITCHING DEVICES IN INDIUM MARKET, BY PURITY GRADE, 2018-2033 (USD THOUSAND)
TABLE 6560 PARAGUAY SATELLITE COMMUNICATION MODULES IN INDIUM MARKET, BY PURITY GRADE, 2018-2033 (USD THOUSAND)
TABLE 6561 PARAGUAY OPTICAL & PHOTONICS INDUSTRY IN INDIUM MARKET, BY TYPE, 2018-2033 (USD THOUSAND)
TABLE 6562 PARAGUAY OPTICAL COATINGS IN INDIUM MARKET, BY PURITY GRADE, 2018-2033 (USD THOUSAND)
TABLE 6563 PARAGUAY FIBER OPTIC COMPONENTS IN INDIUM MARKET, BY PURITY GRADE, 2018-2033 (USD THOUSAND)
TABLE 6564 PARAGUAY LASER COMPONENTS IN INDIUM MARKET, BY PURITY GRADE, 2018-2033 (USD THOUSAND)
TABLE 6565 PARAGUAY OPTICAL SENSORS IN INDIUM MARKET, BY PURITY GRADE, 2018-2033 (USD THOUSAND)
TABLE 6566 PARAGUAY INFRARED OPTICS IN INDIUM MARKET, BY PURITY GRADE, 2018-2033 (USD THOUSAND)
TABLE 6567 PARAGUAY PICS IN INDIUM MARKET, BY PURITY GRADE, 2018-2033 (USD THOUSAND)
TABLE 6568 PARAGUAY MIRRORS IN INDIUM MARKET, BY PURITY GRADE, 2018-2033 (USD THOUSAND)
TABLE 6569 PARAGUAY SPECTROSCOPY IN INDIUM MARKET, BY PURITY GRADE, 2018-2033 (USD THOUSAND)
TABLE 6570 PARAGUAY AEROSPACE & DEFENSE INDUSTRY IN INDIUM MARKET, BY TYPE, 2018-2033 (USD THOUSAND)
TABLE 6571 PARAGUAY INFRARED IMAGING SYSTEMS IN INDIUM MARKET, BY PURITY GRADE, 2018-2033 (USD THOUSAND)
TABLE 6572 PARAGUAY RADAR & RF COMPONENTS IN INDIUM MARKET, BY PURITY GRADE, 2018-2033 (USD THOUSAND)
TABLE 6573 PARAGUAY SATELLITE COMMUNICATION IN INDIUM MARKET, BY PURITY GRADE, 2018-2033 (USD THOUSAND)
TABLE 6574 PARAGUAY MILITARY OPTOELECTRONICS IN INDIUM MARKET, BY PURITY GRADE, 2018-2033 (USD THOUSAND)
TABLE 6575 PARAGUAY AVIONICS DISPLAYS IN INDIUM MARKET, BY PURITY GRADE, 2018-2033 (USD THOUSAND)
TABLE 6576 PARAGUAY SPACECRAFT SOLAR PANELS IN INDIUM MARKET, BY PURITY GRADE, 2018-2033 (USD THOUSAND)
TABLE 6577 PARAGUAY THERMAL MATERIALS IN INDIUM MARKET, BY PURITY GRADE, 2018-2033 (USD THOUSAND)
TABLE 6578 PARAGUAY CRYOGENIC MATERIALS IN INDIUM MARKET, BY PURITY GRADE, 2018-2033 (USD THOUSAND)
TABLE 6579 PARAGUAY MEDICAL DEVICE INDUSTRY IN INDIUM MARKET, BY TYPE, 2018-2033 (USD THOUSAND)
TABLE 6580 PARAGUAY MEDICAL IMAGING SENSORS IN INDIUM MARKET, BY PURITY GRADE, 2018-2033 (USD THOUSAND)
TABLE 6581 PARAGUAY DIAGNOSTIC EQUIPMENT DISPLAYS IN INDIUM MARKET, BY PURITY GRADE, 2018-2033 (USD THOUSAND)
TABLE 6582 PARAGUAY ADVANCED DIAGNOSTIC INSTRUMENTS IN INDIUM MARKET, BY PURITY GRADE, 2018-2033 (USD THOUSAND)
TABLE 6583 PARAGUAY LASER SURGICAL EQUIPMENT IN INDIUM MARKET, BY PURITY GRADE, 2018-2033 (USD THOUSAND)
TABLE 6584 PARAGUAY BIOMEDICAL OPTICAL DEVICES IN INDIUM MARKET, BY PURITY GRADE, 2018-2033 (USD THOUSAND)
TABLE 6585 PARAGUAY RADIATION DETECTION EQUIPMENT IN INDIUM MARKET, BY PURITY GRADE, 2018-2033 (USD THOUSAND)
TABLE 6586 PARAGUAY INFRARED MEDICAL SENSORS IN INDIUM MARKET, BY PURITY GRADE, 2018-2033 (USD THOUSAND)
TABLE 6587 PARAGUAY PHOTOTHERAPY DEVICES IN INDIUM MARKET, BY PURITY GRADE, 2018-2033 (USD THOUSAND)
TABLE 6588 PARAGUAY INDUSTRIAL EQUIPMENT MANUFACTURING IN INDIUM MARKET, BY TYPE, 2018-2033 (USD THOUSAND)
TABLE 6589 PARAGUAY INDUSTRIAL SENSORS IN INDIUM MARKET, BY PURITY GRADE, 2018-2033 (USD THOUSAND)
TABLE 6590 PARAGUAY VACUUM DEPOSITION COATINGS IN INDIUM MARKET, BY PURITY GRADE, 2018-2033 (USD THOUSAND)
TABLE 6591 PARAGUAY PRECISION OPTICAL COMPONENTS IN INDIUM MARKET, BY PURITY GRADE, 2018-2033 (USD THOUSAND)
TABLE 6592 PARAGUAY THERMAL INTERFACE MATERIALS IN INDIUM MARKET, BY PURITY GRADE, 2018-2033 (USD THOUSAND)
TABLE 6593 PARAGUAY INDUSTRIAL LASER SYSTEMS IN INDIUM MARKET, BY PURITY GRADE, 2018-2033 (USD THOUSAND)
TABLE 6594 PARAGUAY INDUSTRIAL INFRARED DETECTORS IN INDIUM MARKET, BY PURITY GRADE, 2018-2033 (USD THOUSAND)
TABLE 6595 PARAGUAY PRECISION MEASUREMENT EQUIPMENT IN INDIUM MARKET, BY PURITY GRADE, 2018-2033 (USD THOUSAND)
TABLE 6596 PARAGUAY SPECIALTY ELECTRONIC COMPONENTS IN INDIUM MARKET, BY PURITY GRADE, 2018-2033 (USD THOUSAND)
TABLE 6597 PARAGUAY OTHERS IN INDIUM MARKET, BY TYPE, 2018-2033 (USD THOUSAND)
TABLE 6598 PARAGUAY ADVANCED MATERIALS MANUFACTURING IN INDIUM MARKET, BY PURITY GRADE, 2018-2033 (USD THOUSAND)
TABLE 6599 PARAGUAY SPECIALTY ALLOY PRODUCTION IN INDIUM MARKET, BY PURITY GRADE, 2018-2033 (USD THOUSAND)
TABLE 6600 PARAGUAY THERMAL MANAGEMENT MATERIALS IN INDIUM MARKET, BY PURITY GRADE, 2018-2033 (USD THOUSAND)
TABLE 6601 PARAGUAY PRECISION SCIENTIFIC INSTRUMENTS IN INDIUM MARKET, BY PURITY GRADE, 2018-2033 (USD THOUSAND)
TABLE 6602 PARAGUAY RESEARCH INSTITUTES & UNIVERSITIES IN INDIUM MARKET, BY PURITY GRADE, 2018-2033 (USD THOUSAND)
TABLE 6603 PARAGUAY NUCLEAR INDUSTRY APPLICATIONS IN INDIUM MARKET, BY PURITY GRADE, 2018-2033 (USD THOUSAND)
TABLE 6604 PARAGUAY SPECIALTY CHEMICAL PRODUCTION IN INDIUM MARKET, BY PURITY GRADE, 2018-2033 (USD THOUSAND)
TABLE 6605 PARAGUAY DEFENSE RESEARCH LABORATORIES IN INDIUM MARKET, BY PURITY GRADE, 2018-2033 (USD THOUSAND)
TABLE 6606 PARAGUAY CRYOGENIC EQUIPMENT MANUFACTURING IN INDIUM MARKET, BY PURITY GRADE, 2018-2033 (USD THOUSAND)
TABLE 6607 REST OF SOUTH AMERICA INDIUM MARKET, BY PRODUCT TYPE, 2018-2033 (USD THOUSAND)
TABLE 6608 REST OF SOUTH AMERICA INGOTS IN INDIUM MARKET, BY TYPE, 2018-2033 (USD THOUSAND)
TABLE 6609 REST OF SOUTH AMERICA INDIUM MARKET, BY MATERIAL COMPOSITION, 2018-2033 (USD THOUSAND)
TABLE 6610 REST OF SOUTH AMERICA INDIUM ALLOYS IN INDIUM MARKET, BY TYPE, 2018-2033 (USD THOUSAND)
TABLE 6611 REST OF SOUTH AMERICA INDIUM COMPOUNDS IN INDIUM MARKET, BY TYPE, 2018-2033 (USD THOUSAND)
TABLE 6612 REST OF SOUTH AMERICA INDIUM MARKET, BY PURITY GRADE, 2018-2033 (USD THOUSAND)
TABLE 6613 REST OF SOUTH AMERICA INDIUM MARKET, BY EXTRACTION SOURCE, 2018-2033 (USD THOUSAND)
TABLE 6614 REST OF SOUTH AMERICA PRIMARY PRODUCTION IN INDIUM MARKET, BY TYPE, 2018-2033 (USD THOUSAND)
TABLE 6615 REST OF SOUTH AMERICA SECONDARY PRODUCTION IN INDIUM MARKET, BY TYPE, 2018-2033 (USD THOUSAND)
TABLE 6616 REST OF SOUTH AMERICA INDIUM MARKET, BY DISTRIBUTION CHANNEL, 2018-2033 (USD THOUSAND)
TABLE 6617 REST OF SOUTH AMERICA INDIUM MARKET, BY TECHNOLOGY PLATFORM, 2018-2033 (USD THOUSAND)
TABLE 6618 REST OF SOUTH AMERICA INDIUM MARKET, BY END-USER INDUSTRY, 2018-2033 (USD THOUSAND)
TABLE 6619 REST OF SOUTH AMERICA CONSUMER ELECTRONICS INDUSTRY IN INDIUM MARKET, BY TYPE, 2018-2033 (USD THOUSAND)
TABLE 6620 REST OF SOUTH AMERICA FLAT PANEL DISPLAYS (LCD/OLED/LED) IN INDIUM MARKET, BY PURITY GRADE, 2018-2033 (USD THOUSAND)
TABLE 6621 REST OF SOUTH AMERICA TRANSPARENT CONDUCTIVE COATINGS (ITO) IN INDIUM MARKET, BY PURITY GRADE, 2018-2033 (USD THOUSAND)
TABLE 6622 REST OF SOUTH AMERICA TOUCHSCREEN DISPLAYS IN INDIUM MARKET, BY PURITY GRADE, 2018-2033 (USD THOUSAND)
TABLE 6623 REST OF SOUTH AMERICA FLEXIBLE DISPLAYS & ELECTRONICS IN INDIUM MARKET, BY PURITY GRADE, 2018-2033 (USD THOUSAND)
TABLE 6624 REST OF SOUTH AMERICA WEARABLE ELECTRONICS DEVICES IN INDIUM MARKET, BY PURITY GRADE, 2018-2033 (USD THOUSAND)
TABLE 6625 REST OF SOUTH AMERICA CAMERA & OPTICAL SENSORS IN INDIUM MARKET, BY PURITY GRADE, 2018-2033 (USD THOUSAND)
TABLE 6626 REST OF SOUTH AMERICA MINI-LED BACKLIGHTING IN INDIUM MARKET, BY PURITY GRADE, 2018-2033 (USD THOUSAND)
TABLE 6627 REST OF SOUTH AMERICA MICRO-LED DISPLAYS IN INDIUM MARKET, BY PURITY GRADE, 2018-2033 (USD THOUSAND)
TABLE 6628 REST OF SOUTH AMERICA DISPLAY PANEL INDUSTRY IN INDIUM MARKET, BY TYPE, 2018-2033 (USD THOUSAND)
TABLE 6629 REST OF SOUTH AMERICA LCD PANEL MANUFACTURING IN INDIUM MARKET, BY PURITY GRADE, 2018-2033 (USD THOUSAND)
TABLE 6630 REST OF SOUTH AMERICA OLED PANEL MANUFACTURING IN INDIUM MARKET, BY PURITY GRADE, 2018-2033 (USD THOUSAND)
TABLE 6631 REST OF SOUTH AMERICA DISPLAY PANEL MANUFACTURING IN INDIUM MARKET, BY PURITY GRADE, 2018-2033 (USD THOUSAND)
TABLE 6632 REST OF SOUTH AMERICA TOUCH PANEL SENSORS IN INDIUM MARKET, BY PURITY GRADE, 2018-2033 (USD THOUSAND)
TABLE 6633 REST OF SOUTH AMERICA TRANSPARENT CONDUCTIVE FILMS IN INDIUM MARKET, BY PURITY GRADE, 2018-2033 (USD THOUSAND)
TABLE 6634 REST OF SOUTH AMERICA FLEXIBLE & FOLDABLE DISPLAYS IN INDIUM MARKET, BY PURITY GRADE, 2018-2033 (USD THOUSAND)
TABLE 6635 REST OF SOUTH AMERICA AR/VR DISPLAYS IN INDIUM MARKET, BY PURITY GRADE, 2018-2033 (USD THOUSAND)
TABLE 6636 REST OF SOUTH AMERICA MICRODISPLAY DEVICES IN INDIUM MARKET, BY PURITY GRADE, 2018-2033 (USD THOUSAND)
TABLE 6637 REST OF SOUTH AMERICA BACKPLANE COATINGS IN INDIUM MARKET, BY PURITY GRADE, 2018-2033 (USD THOUSAND)
TABLE 6638 REST OF SOUTH AMERICA SEMICONDUCTOR INDUSTRY IN INDIUM MARKET, BY TYPE, 2018-2033 (USD THOUSAND)
TABLE 6639 REST OF SOUTH AMERICA III-V COMPOUND SEMICONDUCTORS IN INDIUM MARKET, BY PURITY GRADE, 2018-2033 (USD THOUSAND)
TABLE 6640 REST OF SOUTH AMERICA HIGH-FREQUENCY RF COMPONENTS IN INDIUM MARKET, BY PURITY GRADE, 2018-2033 (USD THOUSAND)
TABLE 6641 REST OF SOUTH AMERICA SEMICONDUCTOR SUBSTRATES & EPITAXY IN INDIUM MARKET, BY PURITY GRADE, 2018-2033 (USD THOUSAND)
TABLE 6642 REST OF SOUTH AMERICA LASER DIODES IN INDIUM MARKET, BY PURITY GRADE, 2018-2033 (USD THOUSAND)
TABLE 6643 REST OF SOUTH AMERICA PHOTODETECTORS IN INDIUM MARKET, BY PURITY GRADE, 2018-2033 (USD THOUSAND)
TABLE 6644 REST OF SOUTH AMERICA HIGH-SPEED OPTOELECTRONICS IN INDIUM MARKET, BY PURITY GRADE, 2018-2033 (USD THOUSAND)
TABLE 6645 REST OF SOUTH AMERICA INFRARED DETECTORS IN INDIUM MARKET, BY PURITY GRADE, 2018-2033 (USD THOUSAND)
TABLE 6646 REST OF SOUTH AMERICA INTEGRATED PHOTONIC CIRCUITS IN INDIUM MARKET, BY PURITY GRADE, 2018-2033 (USD THOUSAND)
TABLE 6647 REST OF SOUTH AMERICA SOLAR PHOTOVOLTAIC INDUSTRY IN INDIUM MARKET, BY TYPE, 2018-2033 (USD THOUSAND)
TABLE 6648 REST OF SOUTH AMERICA CIGS THIN-FILM SOLAR CELLS IN INDIUM MARKET, BY PURITY GRADE, 2018-2033 (USD THOUSAND)
TABLE 6649 REST OF SOUTH AMERICAHIGH-EFFICIENCY MODULES IN INDIUM MARKET, BY PURITY GRADE, 2018-2033 (USD THOUSAND)
TABLE 6650 REST OF SOUTH AMERICA THIN-FILM COATINGS IN INDIUM MARKET, BY PURITY GRADE, 2018-2033 (USD THOUSAND)
TABLE 6651 REST OF SOUTH AMERICA TRANSPARENT ELECTRODES IN INDIUM MARKET, BY PURITY GRADE, 2018-2033 (USD THOUSAND)
TABLE 6652 REST OF SOUTH AMERICA BIPV IN INDIUM MARKET, BY PURITY GRADE, 2018-2033 (USD THOUSAND)
TABLE 6653 REST OF SOUTH AMERICA FLEXIBLE SOLAR PANELS IN INDIUM MARKET, BY PURITY GRADE, 2018-2033 (USD THOUSAND)
TABLE 6654 REST OF SOUTH AMERICA PORTABLE SOLAR SYSTEMS IN INDIUM MARKET, BY PURITY GRADE, 2018-2033 (USD THOUSAND)
TABLE 6655 REST OF SOUTH AMERICA CONCENTRATED PV IN INDIUM MARKET, BY PURITY GRADE, 2018-2033 (USD THOUSAND)
TABLE 6656 REST OF SOUTH AMERICA AUTOMOTIVE INDUSTRY IN INDIUM MARKET, BY TYPE, 2018-2033 (USD THOUSAND)
TABLE 6657 REST OF SOUTH AMERICA AUTOMOTIVE DISPLAY PANELS IN INDIUM MARKET, BY PURITY GRADE, 2018-2033 (USD THOUSAND)
TABLE 6658 REST OF SOUTH AMERICAADAS SENSORS IN INDIUM MARKET, BY PURITY GRADE, 2018-2033 (USD THOUSAND)
TABLE 6659 REST OF SOUTH AMERICA VEHICLE CAMERA MODULES IN INDIUM MARKET, BY PURITY GRADE, 2018-2033 (USD THOUSAND)
TABLE 6660 REST OF SOUTH AMERICA AUTOMOTIVE OPTOELECTRONICS IN INDIUM MARKET, BY PURITY GRADE, 2018-2033 (USD THOUSAND)
TABLE 6661 REST OF SOUTH AMERICA POWER ELECTRONICS IN INDIUM MARKET, BY PURITY GRADE, 2018-2033 (USD THOUSAND)
TABLE 6662 REST OF SOUTH AMERICA TOUCHSCREEN INTERFACES IN INDIUM MARKET, BY PURITY GRADE, 2018-2033 (USD THOUSAND)
TABLE 6663 REST OF SOUTH AMERICA INFRARED SENSORS IN INDIUM MARKET, BY PURITY GRADE, 2018-2033 (USD THOUSAND)
TABLE 6664 REST OF SOUTH AMERICA SMART LIGHTING IN INDIUM MARKET, BY PURITY GRADE, 2018-2033 (USD THOUSAND)
TABLE 6665 REST OF SOUTH AMERICA TELECOMMUNICATION EQUIPMENT INDUSTRY IN INDIUM MARKET, BY TYPE, 2018-2033 (USD THOUSAND)
TABLE 6666 REST OF SOUTH AMERICA OPTICAL TRANSCEIVERS IN INDIUM MARKET, BY PURITY GRADE, 2018-2033 (USD THOUSAND)
TABLE 6667 REST OF SOUTH AMERICA RF POWER AMPLIFIERS IN INDIUM MARKET, BY PURITY GRADE, 2018-2033 (USD THOUSAND)
TABLE 6668 REST OF SOUTH AMERICA HIGH-FREQUENCY COMMUNICATION CHIPS IN INDIUM MARKET, BY PURITY GRADE, 2018-2033 (USD THOUSAND)
TABLE 6669 REST OF SOUTH AMERICA FIBER-OPTIC COMMUNICATION LASERS IN INDIUM MARKET, BY PURITY GRADE, 2018-2033 (USD THOUSAND)
TABLE 6670 REST OF SOUTH AMERICA PHOTODETECTORS FOR OPTICAL NETWORKS IN INDIUM MARKET, BY PURITY GRADE, 2018-2033 (USD THOUSAND)
TABLE 6671 REST OF SOUTH AMERICA 5G INFRASTRUCTURE COMPONENTS IN INDIUM MARKET, BY PURITY GRADE, 2018-2033 (USD THOUSAND)
TABLE 6672 REST OF SOUTH AMERICA OPTICAL NETWORK SWITCHING DEVICES IN INDIUM MARKET, BY PURITY GRADE, 2018-2033 (USD THOUSAND)
TABLE 6673 REST OF SOUTH AMERICA SATELLITE COMMUNICATION MODULES IN INDIUM MARKET, BY PURITY GRADE, 2018-2033 (USD THOUSAND)
TABLE 6674 REST OF SOUTH AMERICA OPTICAL & PHOTONICS INDUSTRY IN INDIUM MARKET, BY TYPE, 2018-2033 (USD THOUSAND)
TABLE 6675 REST OF SOUTH AMERICA OPTICAL COATINGS IN INDIUM MARKET, BY PURITY GRADE, 2018-2033 (USD THOUSAND)
TABLE 6676 REST OF SOUTH AMERICA FIBER OPTIC COMPONENTS IN INDIUM MARKET, BY PURITY GRADE, 2018-2033 (USD THOUSAND)
TABLE 6677 REST OF SOUTH AMERICA LASER COMPONENTS IN INDIUM MARKET, BY PURITY GRADE, 2018-2033 (USD THOUSAND)
TABLE 6678 REST OF SOUTH AMERICA OPTICAL SENSORS IN INDIUM MARKET, BY PURITY GRADE, 2018-2033 (USD THOUSAND)
TABLE 6679 REST OF SOUTH AMERICA INFRARED OPTICS IN INDIUM MARKET, BY PURITY GRADE, 2018-2033 (USD THOUSAND)
TABLE 6680 REST OF SOUTH AMERICA PICS IN INDIUM MARKET, BY PURITY GRADE, 2018-2033 (USD THOUSAND)
TABLE 6681 REST OF SOUTH AMERICA MIRRORS IN INDIUM MARKET, BY PURITY GRADE, 2018-2033 (USD THOUSAND)
TABLE 6682 REST OF SOUTH AMERICA SPECTROSCOPY IN INDIUM MARKET, BY PURITY GRADE, 2018-2033 (USD THOUSAND)
TABLE 6683 REST OF SOUTH AMERICA AEROSPACE & DEFENSE INDUSTRY IN INDIUM MARKET, BY TYPE, 2018-2033 (USD THOUSAND)
TABLE 6684 REST OF SOUTH AMERICA INFRARED IMAGING SYSTEMS IN INDIUM MARKET, BY PURITY GRADE, 2018-2033 (USD THOUSAND)
TABLE 6685 REST OF SOUTH AMERICA RADAR & RF COMPONENTS IN INDIUM MARKET, BY PURITY GRADE, 2018-2033 (USD THOUSAND)
TABLE 6686 REST OF SOUTH AMERICA SATELLITE COMMUNICATION IN INDIUM MARKET, BY PURITY GRADE, 2018-2033 (USD THOUSAND)
TABLE 6687 REST OF SOUTH AMERICA MILITARY OPTOELECTRONICS IN INDIUM MARKET, BY PURITY GRADE, 2018-2033 (USD THOUSAND)
TABLE 6688 REST OF SOUTH AMERICA AVIONICS DISPLAYS IN INDIUM MARKET, BY PURITY GRADE, 2018-2033 (USD THOUSAND)
TABLE 6689 REST OF SOUTH AMERICA SPACECRAFT SOLAR PANELS IN INDIUM MARKET, BY PURITY GRADE, 2018-2033 (USD THOUSAND)
TABLE 6690 REST OF SOUTH AMERICA THERMAL MATERIALS IN INDIUM MARKET, BY PURITY GRADE, 2018-2033 (USD THOUSAND)
TABLE 6691 REST OF SOUTH AMERICA CRYOGENIC MATERIALS IN INDIUM MARKET, BY PURITY GRADE, 2018-2033 (USD THOUSAND)
TABLE 6692 REST OF SOUTH AMERICA MEDICAL DEVICE INDUSTRY IN INDIUM MARKET, BY TYPE, 2018-2033 (USD THOUSAND)
TABLE 6693 REST OF SOUTH AMERICA MEDICAL IMAGING SENSORS IN INDIUM MARKET, BY PURITY GRADE, 2018-2033 (USD THOUSAND)
TABLE 6694 REST OF SOUTH AMERICA DIAGNOSTIC EQUIPMENT DISPLAYS IN INDIUM MARKET, BY PURITY GRADE, 2018-2033 (USD THOUSAND)
TABLE 6695 REST OF SOUTH AMERICA ADVANCED DIAGNOSTIC INSTRUMENTS IN INDIUM MARKET, BY PURITY GRADE, 2018-2033 (USD THOUSAND)
TABLE 6696 REST OF SOUTH AMERICA LASER SURGICAL EQUIPMENT IN INDIUM MARKET, BY PURITY GRADE, 2018-2033 (USD THOUSAND)
TABLE 6697 REST OF SOUTH AMERICA BIOMEDICAL OPTICAL DEVICES IN INDIUM MARKET, BY PURITY GRADE, 2018-2033 (USD THOUSAND)
TABLE 6698 REST OF SOUTH AMERICA RADIATION DETECTION EQUIPMENT IN INDIUM MARKET, BY PURITY GRADE, 2018-2033 (USD THOUSAND)
TABLE 6699 REST OF SOUTH AMERICA INFRARED MEDICAL SENSORS IN INDIUM MARKET, BY PURITY GRADE, 2018-2033 (USD THOUSAND)
TABLE 6700 REST OF SOUTH AMERICA PHOTOTHERAPY DEVICES IN INDIUM MARKET, BY PURITY GRADE, 2018-2033 (USD THOUSAND)
TABLE 6701 REST OF SOUTH AMERICA INDUSTRIAL EQUIPMENT MANUFACTURING IN INDIUM MARKET, BY TYPE, 2018-2033 (USD THOUSAND)
TABLE 6702 REST OF SOUTH AMERICA INDUSTRIAL SENSORS IN INDIUM MARKET, BY PURITY GRADE, 2018-2033 (USD THOUSAND)
TABLE 6703 REST OF SOUTH AMERICA VACUUM DEPOSITION COATINGS IN INDIUM MARKET, BY PURITY GRADE, 2018-2033 (USD THOUSAND)
TABLE 6704 REST OF SOUTH AMERICA PRECISION OPTICAL COMPONENTS IN INDIUM MARKET, BY PURITY GRADE, 2018-2033 (USD THOUSAND)
TABLE 6705 REST OF SOUTH AMERICA THERMAL INTERFACE MATERIALS IN INDIUM MARKET, BY PURITY GRADE, 2018-2033 (USD THOUSAND)
TABLE 6706 REST OF SOUTH AMERICA INDUSTRIAL LASER SYSTEMS IN INDIUM MARKET, BY PURITY GRADE, 2018-2033 (USD THOUSAND)
TABLE 6707 REST OF SOUTH AMERICA INDUSTRIAL INFRARED DETECTORS IN INDIUM MARKET, BY PURITY GRADE, 2018-2033 (USD THOUSAND)
TABLE 6708 REST OF SOUTH AMERICA PRECISION MEASUREMENT EQUIPMENT IN INDIUM MARKET, BY PURITY GRADE, 2018-2033 (USD THOUSAND)
TABLE 6709 REST OF SOUTH AMERICA SPECIALTY ELECTRONIC COMPONENTS IN INDIUM MARKET, BY PURITY GRADE, 2018-2033 (USD THOUSAND)
TABLE 6710 REST OF SOUTH AMERICA OTHERS IN INDIUM MARKET, BY TYPE, 2018-2033 (USD THOUSAND)
TABLE 6711 REST OF SOUTH AMERICA ADVANCED MATERIALS MANUFACTURING IN INDIUM MARKET, BY PURITY GRADE, 2018-2033 (USD THOUSAND)
TABLE 6712 REST OF SOUTH AMERICA SPECIALTY ALLOY PRODUCTION IN INDIUM MARKET, BY PURITY GRADE, 2018-2033 (USD THOUSAND)
TABLE 6713 REST OF SOUTH AMERICA THERMAL MANAGEMENT MATERIALS IN INDIUM MARKET, BY PURITY GRADE, 2018-2033 (USD THOUSAND)
TABLE 6714 REST OF SOUTH AMERICA PRECISION SCIENTIFIC INSTRUMENTS IN INDIUM MARKET, BY PURITY GRADE, 2018-2033 (USD THOUSAND)
TABLE 6715 REST OF SOUTH AMERICA RESEARCH INSTITUTES & UNIVERSITIES IN INDIUM MARKET, BY PURITY GRADE, 2018-2033 (USD THOUSAND)
TABLE 6716 REST OF SOUTH AMERICA NUCLEAR INDUSTRY APPLICATIONS IN INDIUM MARKET, BY PURITY GRADE, 2018-2033 (USD THOUSAND)
TABLE 6717 REST OF SOUTH AMERICA SPECIALTY CHEMICAL PRODUCTION IN INDIUM MARKET, BY PURITY GRADE, 2018-2033 (USD THOUSAND)
TABLE 6718 REST OF SOUTH AMERICA DEFENSE RESEARCH LABORATORIES IN INDIUM MARKET, BY PURITY GRADE, 2018-2033 (USD THOUSAND)
TABLE 6719 REST OF SOUTH AMERICA CRYOGENIC EQUIPMENT MANUFACTURING IN INDIUM MARKET, BY PURITY GRADE, 2018-2033 (USD THOUSAND)
List of Figure
FIGURE 1 GLOBAL INDIUM MARKET: SEGMENTATION
FIGURE 2 GLOBAL INDIUM MARKET: DATA TRIANGULATION
FIGURE 3 GLOBAL INDIUM MARKET: DROC ANALYSIS
FIGURE 4 GLOBAL INDIUM MARKET: GLOBAL VS REGIONAL MARKET ANALYSIS
FIGURE 5 GLOBAL INDIUM MARKET: COMPANY RESEARCH ANALYSIS
FIGURE 6 GLOBAL INDIUM MARKET: INTERVIEW DEMOGRAPHICS
FIGURE 7 GLOBAL INDIUM MARKET: DBMR MARKET POSITION GRID
FIGURE 8 GLOBAL INDIUM MARKET: VENDOR SHARE ANALYSIS
FIGURE 9 GLOBAL INDIUM MARKET: MULTIVARIVATE MODELING
FIGURE 10 GLOBAL INDIUM MARKET: PRODUCT TYPE TIMELINE CURVE
FIGURE 11 GLOBAL INDIUM MARKET: APPLICATION COVERAGE GRID
FIGURE 12 GLOBAL INDIUM MARKET: SEGMENTATION
FIGURE 13 TWELVE SEGMENTS COMPRISE THE GLOBAL INDIUM MARKET, BY PRODUCT TYPE (2025)
FIGURE 14 GLOBAL INDIUM MARKET: EXECUTIVE SUMMARY
FIGURE 15 STRATEGIC DECISIONS
FIGURE 16 ASIA-PACIFIC IS EXPECTED TO BE THE DOMINANT AND FASTEST GRWOING REGION IN THE GLOBAL INDIUM MARKET IN THE FORECAST PERIOD OF 2026 TO 2033
FIGURE 17 RISING DEMAND FROM DISPLAY TECHNOLOGIES IS EXPECTED TO DRIVE THE GLOBAL INDIUM MARKET DURING THE FORECAST PERIOD OF 2026 TO 2033.
FIGURE 18 PRODUCT SEGMENT IS EXPECTED TO ACCOUNT FOR THE LARGEST SHARE OF THE GLOBAL INDIUM MARKET IN 2026 & 2033
FIGURE 19 ASIA-PACIFIC THE FASTEST-GROWING REGION FOR THE GLOBAL INDIUM MARKET IN THE FORECAST PERIOD OF 2026 TO 2033
FIGURE 20 PRICING ANALYSIS FOR GLOBAL INDIUM MARKET (2020–2026, AVG USD/KG)
FIGURE 21 DROC ANALYSIS
FIGURE 22 TV PRODUCTION BY COUNTRY (MILLION UNITS)
FIGURE 23 GLOBAL INDIUM MARKET, BY PRODUCT TYPE, 2025
FIGURE 24 GLOBAL INDIUM MARKET, BY MATERIAL COMPOSITION, 2025
FIGURE 25 GLOBAL INDIUM MARKET, BY PURITY GRADE, 2025
FIGURE 26 GLOBAL INDIUM MARKET, BY EXTRACTION SOURCE, 2025
FIGURE 27 GLOBAL INDIUM MARKET, BY DISTRIBUTION CHANNEL, 2025
FIGURE 28 GLOBAL INDIUM MARKET, BY TECHNOLOGY PLATFORM, 2025
FIGURE 29 GLOBAL INDIUM MARKET, BY END-USER INDUSTRY, 2025
FIGURE 30 GLOBAL INDIUM MARKET: SNAPSHOT
FIGURE 31 NORTH AMERICA INDIUM MARKET: SNAPSHOT
FIGURE 32 EUROPE INDIUM MARKET SNAPSHOTS
FIGURE 33 ASIA-PACIFIC INDIUM MARKE: SNAPSHOT
FIGURE 34 MIDDLE EAST & AFRICA INDIUM MARKET: SNAPSHOT
FIGURE 35 SOUTH AMERICA INDIUM MARKET
FIGURE 36 GLOBAL INDIUM MARKET: COMPANY SHARE 2025 (%)
FIGURE 37 ASIA-PACIFC INDIUM MARKET: COMPANY SHARE 2025 (%)
FIGURE 38 NORTH AMERICA INDIUM MARKET: COMPANY SHARE 2025 (%)
FIGURE 39 EUROPE INDIUM MARKET: COMPANY SHARE 2025 (%)
Global Indium Market, Supply Chain Analysis and Ecosystem Framework
To support market growth and help clients navigate the impact of geopolitical shifts, DBMR has integrated in-depth supply chain analysis into its Global Indium Market research reports. This addition empowers clients to respond effectively to global changes affecting their industries. The supply chain analysis section includes detailed insights such as Global Indium Market consumption and production by country, price trend analysis, the impact of tariffs and geopolitical developments, and import and export trends by country and HSN code. It also highlights major suppliers with data on production capacity and company profiles, as well as key importers and exporters. In addition to research, DBMR offers specialized supply chain consulting services backed by over a decade of experience, providing solutions like supplier discovery, supplier risk assessment, price trend analysis, impact evaluation of inflation and trade route changes, and comprehensive market trend analysis.
Data collection and base year analysis are done using data collection modules with large sample sizes. The stage includes obtaining market information or related data through various sources and strategies. It includes examining and planning all the data acquired from the past in advance. It likewise envelops the examination of information inconsistencies seen across different information sources. The market data is analysed and estimated using market statistical and coherent models. Also, market share analysis and key trend analysis are the major success factors in the market report. To know more, please request an analyst call or drop down your inquiry.
The key research methodology used by DBMR research team is data triangulation which involves data mining, analysis of the impact of data variables on the market and primary (industry expert) validation. Data models include Vendor Positioning Grid, Market Time Line Analysis, Market Overview and Guide, Company Positioning Grid, Patent Analysis, Pricing Analysis, Company Market Share Analysis, Standards of Measurement, Global versus Regional and Vendor Share Analysis. To know more about the research methodology, drop in an inquiry to speak to our industry experts.
Data Bridge Market Research is a leader in advanced formative research. We take pride in servicing our existing and new customers with data and analysis that match and suits their goal. The report can be customized to include price trend analysis of target brands understanding the market for additional countries (ask for the list of countries), clinical trial results data, literature review, refurbished market and product base analysis. Market analysis of target competitors can be analyzed from technology-based analysis to market portfolio strategies. We can add as many competitors that you require data about in the format and data style you are looking for. Our team of analysts can also provide you data in crude raw excel files pivot tables (Fact book) or can assist you in creating presentations from the data sets available in the report.


