
Global Iron Ore Pellets Market
Market Size in USD Billion
 USD
70.38 Billion
USD
95.58 Billion
2024
2032
USD
70.38 Billion
USD
95.58 Billion
2024
2032
| 2025 - 2032 | |
| USD 70.38 Billion | |
| USD 95.58 Billion | |
| % | |
|
Iron Ore Pellets Market Size
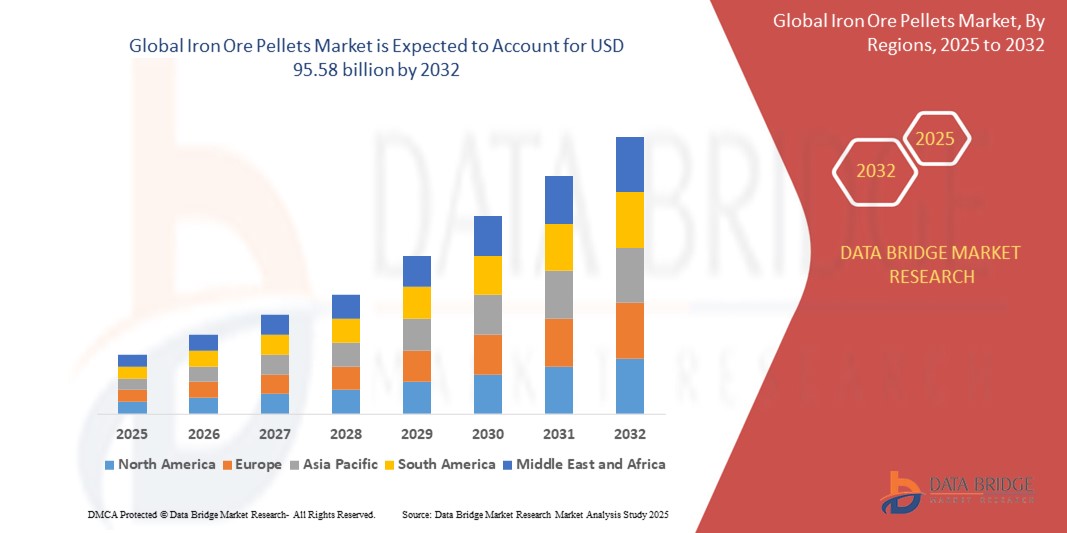
- The global iron ore pellets market was valued at USD 70.38 billion in 2024 and is expected to reach USD 95.58 billion by 2032
- During the forecast period of 2025 to 2032 the market is likely to grow at a CAGR of 3.90%, primarily driven by increasing demand for steel
- This growth is driven by factors such as rising construction and infrastructure activities
Iron Ore Pellets Market Analysis
- The iron ore pellets market is growing significantly, driven by technological advancements and innovative methods like direct reduction iron processes using hydrogen for cleaner steel production
- Companies are adopting sustainable technologies, including improved pelletizing techniques, to enhance pellet quality and competitiveness
- Artificial intelligence and machine learning are optimizing the pelletization process, resulting in higher-quality pellets and reduced waste
- The demand for iron ore pellets is booming in emerging markets, especially in Asia, where steel production is on the rise
- For instance, India's National Steel Policy aims to increase steel production, leading to higher demand for high-quality iron ore pellets to meet cleaner production processes and the iron ore pellets market is expanding rapidly due to technological advancements, sustainability efforts, and rising demand from emerging markets like Asia.
Report Scope and Iron Ore Pellets Market Segmentation
|
Attributes |
Iron Ore Pellets Key Market Insights |
|
Segments Covered |
|
|
Countries Covered |
North America
Europe
Asia-Pacific
Middle East and Africa
South America
|
|
Key Market Players |
|
|
Market Opportunities |
|
|
Value Added Data Infosets |
In addition to the insights on market scenarios such as market value, growth rate, segmentation, geographical coverage, and major players, the market reports curated by the Data Bridge Market Research also include import export analysis, production capacity overview, production consumption analysis, price trend analysis, climate change scenario, supply chain analysis, value chain analysis, raw material/consumables overview, vendor selection criteria, PESTLE Analysis, Porter Analysis, and regulatory framework. |
Iron Ore Pellets Market Trends
“Increasing Technological Advancements”
- The iron ore pellets market is driven by technological advancements that improve efficiency and sustainability in production
- A key trend is the growing adoption of direct reduction iron processes, which use hydrogen to reduce carbon emissions, enhancing steel production efficiency
- Automation and artificial intelligence are transforming the pelletization process, leading to better quality pellets and less waste
- Emerging markets, especially in Asia, are seeing increased demand for iron ore pellets due to the booming steel industry
- For instance, India’s National Steel Policy aims to raise steel production to 300 million tons by 2030, increasing the demand for high-quality pellets and the iron ore pellets market is thriving due to technological advancements, cleaner production methods, and rising demand from emerging markets.
Iron Ore Pellets Market Dynamics
Driver
“Increasing Demand for Steel”
- Increasing Demand for Steel as, steel is essential in sectors like construction, automotive, infrastructure, and manufacturing, driving the demand for iron ore pellets
- Infrastructure projects such as roads, bridges, and buildings in emerging economies, including India and China, significantly boost the demand for steel and consequently iron ore pellets
- The automotive industry’s increasing need for high-strength, lightweight steel directly contributes to the demand for iron ore pellets
- As countries modernize and industrialize, their demand for steel rises, which in turn accelerates the need for iron ore pellets
- For instance, the rise of renewable energy technologies and electric vehicles increases the need for steel, further driving the demand for iron ore pellets in these new sectors and the increasing demand for steel across various sectors, including automotive and infrastructure, is significantly driving the need for iron ore pellets
Opportunity
“Technological Advancements in Pelletizing”
- Ongoing technological advancements in pelletizing techniques offer significant growth opportunities in the iron ore pellet market
- Traditional pelletizing processes are energy-intensive, but innovations like hydrogen-based reduction and improved pelletizing technologies reduce emissions and energy consumption
- Technologies such as fluidized bed furnaces, shaft furnaces, and automation systems enhance pellet quality and increase efficiency in steel production
- Artificial intelligence and machine learning in pelletization allow real-time control, improving pellet quality and reducing waste in the production process
- Improved pellet feed preparation techniques, like fine-grinding and increased beneficiation, help optimize operations and reduce costs, promoting sustainability in the industry
Restraint/Challenge
“Environmental Regulations and Sustainability Concerns”
- The extraction of iron ore is resource-intensive, leading to significant environmental impacts like deforestation, habitat destruction, and water contamination
- Increased global awareness of climate change has led to stricter environmental regulations on mining operations, putting pressure on companies to adopt cleaner practices
- Compliance with these regulations requires substantial investments in technologies to reduce carbon emissions and improve waste management, increasing operational costs
- For instance, mining companies may need to invest in water recycling technologies and sustainable mining practices to reduce their environmental footprint
- Growing public awareness and opposition to mining activities, especially in ecologically sensitive areas, further complicates the operations of iron ore pellet producers, making it harder to balance economic and environmental objectives
Iron Ore Pellets Market Scope
The market is segmented on the basis of source, grade, technology, pelletizing process, balling technology, application, and industry.
|
Segmentation |
Sub-Segmentation |
|
By Source |
|
|
BY Grade |
|
|
By Technology |
|
|
By Pelletizing Process
|
|
|
By Balling technology |
|
|
By Application
|
|
|
By Industry |
|
Iron Ore Pellets Market Regional Analysis
“Asia-Pacific is the Dominant Region in the Iron Ore Pellets Market”
- Asia Pacific has emerged as the dominant region in the global iron ore pellets market. The region has established itself as a key player in the iron and steel industry due to its significant contribution to global steel production
- The demand for iron ore pellets remains consistently high due to the region's extensive manufacturing sector. Iron ore pellets are a crucial raw material in steel production, and their demand is closely linked to industrial growth
- The expansion of the steel industry in the region, driven by ongoing infrastructural developments and urbanization, creates a robust market for iron ore pellets
- The region benefits from rich iron ore reserves, established infrastructure, and efficient mining operations, making it a dominant force in the iron ore pellet market
- The adoption of cleaner steel production methods, including the use of iron ore pellets in blast furnaces, further solidifies the region’s dominance in the market
“North America is Projected to Register the Highest Growth Rate”
- North America is the fastest-growing region in the global iron ore pellets market.
- The growth is primarily driven by the increasing demand for steel in various sectors, including construction, automotive, and manufacturing
- North America is witnessing a shift toward more sustainable steel production processes, which rely heavily on iron ore pellets. The adoption of direct reduction iron (DRI) processes in the region is contributing to the rising demand for pellets
- Furthermore, the region is investing heavily in expanding its steel production capabilities, which is expected to further boost iron ore pellet consumption
- Ongoing infrastructure projects, along with growing industrialization, make North America a key player in the fast-growing iron ore pellet market
Iron Ore Pellets Market Share
The market competitive landscape provides details by competitor. Details included are company overview, company financials, revenue generated, market potential, investment in research and development, new market initiatives, global presence, production sites and facilities, production capacities, company strengths and weaknesses, product launch, product width and breadth, application dominance. The above data points provided are only related to the companies' focus related to market.
The Major Market Leaders Operating in the Market Are:
- Vale (Brazil)
- Mitsubishi Corporation RtM Japan Ltd (Japan)
- Cleveland-Cliffs Inc (U.S.)
- United States Steel Corporation. (U.S.)
- ARCELORMITTAL (Luxembourg)
- Metso Outotec (Finland)
- KIOCL Limited (India)
- FERREXPO PLC (Switzerland)
- JINDAL SAW LTD. (India)
- Iron Ore Company of Canada (Canada)
- LKAB Koncernkontor (Sweden)
- METALLOINVEST MC LLC (Russia)
- Bahrain Steel (Bahrain)
- SIMEC (England)
Latest Developments in Global Iron Ore Pellets Market
- In October 2023, Metso introduced a hydrogen-powered version of its Ferroflame LowNox burner for pelletizing plants. This innovation aims to reduce carbon emissions in iron ore pellet production by utilizing hydrogen, marking the first of its kind for use in travelling grate pelletizing plants
- In February 2023, Fastmarkets launched two daily indices to track the spot price of high-grade 67.5% Fe pellet feed products on a CFR China basis. These indices include a premium index and an outright price index, aimed at providing a transparent reference for pricing and settling high-grade pellet feed transactions
- In December 2022, Fastmarkets launched a new weekly indicator for DR-grade iron ore pellet premiums, designed to provide insights into market sentiment and theoretical pricing. This indicator, published every Wednesday, offers a reference for premiums in long-term contracts, with the base price tied to 65% Fe Brazil-origin fines
- In April 2022, Metso Outotec secured an order to supply a compact-sized iron ore pellet plant in India. This plant, designed to meet growing steel demand, will feature Metso's innovative pelletizing technology aimed at improving productivity and sustainability in pellet production.
- In March 2023, Vale announced plans to sell its IOCJ (Iron Ore Concentrate and Pellet Feed) as pellet feed to focus more on higher-value products. This move aims to enhance its competitiveness in the iron ore market by targeting higher-grade pellet feed products
SKU-

- Interactive Data Analysis Dashboard
- Company Analysis Dashboard for high growth potential opportunities
- Research Analyst Access for customization & queries
- Competitor Analysis with Interactive dashboard
- Latest News, Updates & Trend analysis
- Harness the Power of Benchmark Analysis for Comprehensive Competitor Tracking
Global Iron Ore Pellets Market, Supply Chain Analysis and Ecosystem Framework
To support market growth and help clients navigate the impact of geopolitical shifts, DBMR has integrated in-depth supply chain analysis into its Global Iron Ore Pellets Market research reports. This addition empowers clients to respond effectively to global changes affecting their industries. The supply chain analysis section includes detailed insights such as Global Iron Ore Pellets Market consumption and production by country, price trend analysis, the impact of tariffs and geopolitical developments, and import and export trends by country and HSN code. It also highlights major suppliers with data on production capacity and company profiles, as well as key importers and exporters. In addition to research, DBMR offers specialized supply chain consulting services backed by over a decade of experience, providing solutions like supplier discovery, supplier risk assessment, price trend analysis, impact evaluation of inflation and trade route changes, and comprehensive market trend analysis.
Data collection and base year analysis are done using data collection modules with large sample sizes. The stage includes obtaining market information or related data through various sources and strategies. It includes examining and planning all the data acquired from the past in advance. It likewise envelops the examination of information inconsistencies seen across different information sources. The market data is analysed and estimated using market statistical and coherent models. Also, market share analysis and key trend analysis are the major success factors in the market report. To know more, please request an analyst call or drop down your inquiry.
The key research methodology used by DBMR research team is data triangulation which involves data mining, analysis of the impact of data variables on the market and primary (industry expert) validation. Data models include Vendor Positioning Grid, Market Time Line Analysis, Market Overview and Guide, Company Positioning Grid, Patent Analysis, Pricing Analysis, Company Market Share Analysis, Standards of Measurement, Global versus Regional and Vendor Share Analysis. To know more about the research methodology, drop in an inquiry to speak to our industry experts.
Data Bridge Market Research is a leader in advanced formative research. We take pride in servicing our existing and new customers with data and analysis that match and suits their goal. The report can be customized to include price trend analysis of target brands understanding the market for additional countries (ask for the list of countries), clinical trial results data, literature review, refurbished market and product base analysis. Market analysis of target competitors can be analyzed from technology-based analysis to market portfolio strategies. We can add as many competitors that you require data about in the format and data style you are looking for. Our team of analysts can also provide you data in crude raw excel files pivot tables (Fact book) or can assist you in creating presentations from the data sets available in the report.


