
Global Jam Jelly And Preserves Market
Market Size in USD Billion
 USD
295.10 Billion
USD
432.69 Billion
2024
2032
USD
295.10 Billion
USD
432.69 Billion
2024
2032
| 2025 - 2032 | |
| USD 295.10 Billion | |
| USD 432.69 Billion | |
| % | |
|
Jam, Jelly and Preserve Packaging Market Size
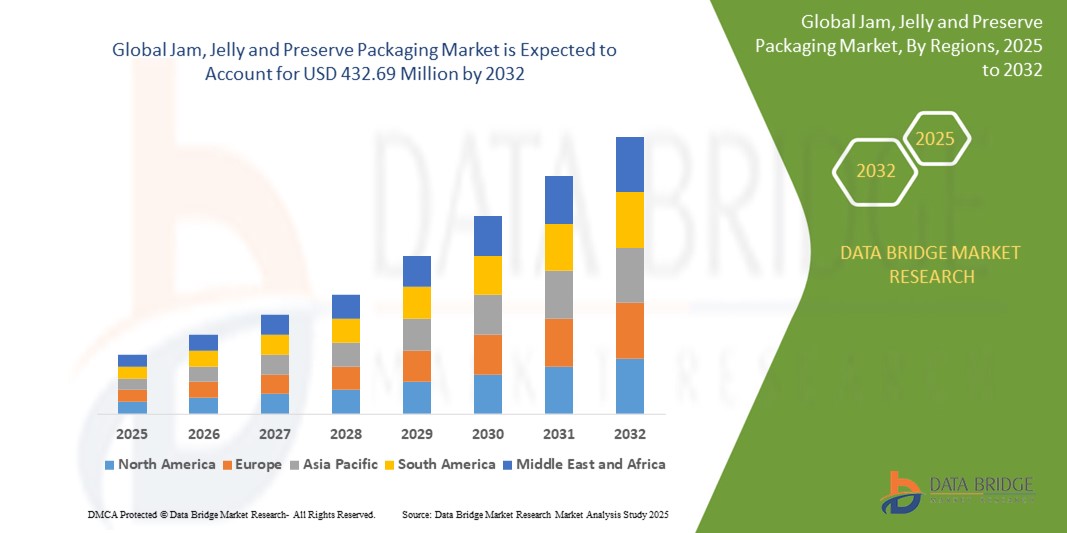
- The global jam, jelly and preserve packaging market size was valued at USD 295.1 million in 2024 and is expected to reach USD 432.69 million by 2032, at a CAGR of 4.9% during the forecast period
- This growth is driven by factors such as the rising demand for convenience foods, sustainable packaging, and premium product offerings.
Jam, Jelly and Preserve Packaging Market Analysis
- The jam, jelly, and preserve packaging market is experiencing a shift towards sustainable materials, with an increasing preference for recyclable and biodegradable options to meet environmental concerns and consumer demand for eco-friendly products
- There is a growing trend towards innovative packaging designs that enhance convenience and appeal, such as single-serve portions and resealable pouches, catering to the on-the-go consumption habits of modern consumers
- North America is expected to dominate the jam, jelly, and preserve packaging market due to a strong consumer base, premium product demand, and advanced distribution networks.
- Asia-Pacific is expected to be the fastest-growing region in the jam, jelly, and preserve packaging market during the forecast period due to rising disposable incomes, urbanization, and the adoption of Western dietary habits.
- The glass segment is expected to dominate the jam, jelly and preserve packaging market with the largest share of 50.5% in 2025 due to its ability to preserve the flavour, quality, and freshness of the product, while also being eco-friendly and recyclable, appealing to consumers who prefer sustainable packaging options. In addition, glass packaging enhances the premium perception of products, making it a preferred choice for high-end or organic brands. Its durability and ability to maintain product integrity during transport further solidify its position as the leading material for packaging preserves.
Report Scope and Jam, Jelly and Preserve Packaging Market Segmentation
|
Attributes |
Jam, Jelly and Preserve Packaging Key Market Insights |
|
Segments Covered |
|
|
Countries Covered |
North America
Europe
Asia-Pacific
Middle East and Africa
South America
|
|
Key Market Players |
|
|
Market Opportunities |
|
|
Value Added Data Infosets |
In addition to the insights on market scenarios such as market value, growth rate, segmentation, geographical coverage, and major players, the market reports curated by the Data Bridge Market Research also include import export analysis, production capacity overview, production consumption analysis, price trend analysis, climate change scenario, supply chain analysis, value chain analysis, raw material/consumables overview, vendor selection criteria, PESTLE Analysis, Porter Analysis, and regulatory framework. |
Jam, Jelly and Preserve Packaging Market Trends
“Rise of Sustainable and Eco-Friendly Packaging”
- Consumers are increasingly opting for jams, jellies, and preserves packaged in materials that are recyclable, biodegradable, or made from post-consumer waste
- Glass jars and paper-based labels are gaining popularity as eco-conscious alternatives to traditional plastic containers, with brands such as Bonne Maman adopting fully recyclable glass packaging
- Companies are adopting plant-based inks and water-based adhesives to reduce their environmental impact and appeal to green-conscious shoppers
- Reusable and refillable packaging formats are emerging in specialty food stores and farmers' markets, offering customers a sustainable way to enjoy their favorite products
- For instance, The Jammery, a Canadian preserve company, encourages customers to return empty glass jars for reuse, promoting a closed-loop packaging system that supports waste reduction and eco-friendly practices
Jam, Jelly and Preserve Packaging Market Dynamics
Driver
“Growing Consumer Shift Toward Natural and Organic Products”
- Consumers are increasingly choosing natural, organic, and clean-label food products, which is driving demand for packaging that aligns with health and wellness trends
- Brands are shifting to packaging that reflects purity and quality, such as glass jars, compostable seals, and eco-friendly labels to match the image of organic offerings
- For instance, St. Dalfour uses glass packaging and minimal labeling to emphasize the natural quality of its preserves, while Crofter’s Organic features eco-friendly labeling and clean ingredients
- Transparent packaging is becoming more popular as it allows consumers to see the product inside, reinforcing trust and ensuring authenticity
- Packaging innovations are focusing on sustainability and health-conscious messaging, helping brands appeal to eco-aware buyers and differentiate themselves in a competitive market
Opportunity
“Rise of E-Commerce and Direct-to-Consumer Channels”
- The rise of e-commerce and direct-to-consumer platforms is increasing the need for packaging that ensures product safety, convenience, and shelf appeal during delivery
- Packaging is no longer just functional but also acts as a marketing tool, offering brands a chance to create memorable unboxing experiences and connect with consumers visually
- For instance, artisanal jam brands on platforms such as Etsy use personalized labels and sturdy, eco-friendly boxes to stand out and ensure safe delivery, while companies such as Harry & David use branded gift-style packaging for online gourmet preserve sales
- Lightweight, durable packaging materials are being adopted to reduce shipping damage and cost, while maintaining aesthetic value and consumer engagement
- Subscription-based models and online specialty stores are encouraging the use of innovative formats such as single-serve packs and tamper-evident seals, which enhance convenience and build consumer trust
Restraint/Challenge
“High Cost of Sustainable Packaging Solutions”
- One of the main challenges in the jam, jelly, and preserve packaging market is the high cost of switching to sustainable alternatives such as glass, compostable plastics, and paper-based packaging
- These materials, while environmentally friendly, often require higher production, transportation, and handling expenses, which can strain smaller producers
- For instance, local preserve makers at farmers’ markets may prefer plastic jars due to cost, while larger brands such as Bonne Maman can afford to use and promote premium glass packaging
- Inconsistent recycling and composting infrastructure across regions limit the practical benefits of eco-friendly materials, reducing their overall impact
- A lack of packaging standardization and rapidly changing regulations adds complexity and cost, making it harder for smaller brands to adopt sustainable solutions at scale
Jam, Jelly and Preserve Packaging Market Scope
The market is segmented on the basis of material and channel.
|
Segmentation |
Sub-Segmentation |
|
By Material |
|
|
By Channel |
|
In 2025, the glass is projected to dominate the market with a largest share in material segment
The glass segment is expected to dominate the jam, jelly and preserve packaging market with the largest share of 50.5% in 2025 due to its ability to preserve the flavour, quality, and freshness of the product, while also being eco-friendly and recyclable, appealing to consumers who prefer sustainable packaging options. In addition, glass packaging enhances the premium perception of products, making it a preferred choice for high-end or organic brands. Its durability and ability to maintain product integrity during transport further solidify its position as the leading material for packaging preserves.
The offline is expected to account for the largest share during the forecast period in channel market
In 2025, the offline segment is expected to dominate the market with the largest market share of 35.5% due to its established presence in physical retail spaces, offering consumers the convenience of immediate purchase, the ability to examine products first-hand, and the wide availability of various jam, jelly, and preserve brands in supermarkets and hypermarkets. In addition, offline retail stores provide a personalized shopping experience and promotional opportunities, which drive higher consumer foot traffic and impulse buys. The physical presence of these stores allows brands to create strong customer connections and foster brand loyalty, ensuring continued dominance in the market.
Jam, Jelly and Preserve Packaging Market Regional Analysis
“North America Holds the Largest Share in the Jam, Jelly and Preserve Packaging Market”
- North America is projected to account for 40.5% of the global jam, jelly, and preserve packaging market
- North America commands a leading share of the global market due to mature consumption patterns and strong brand presence across the U.S. and Canada
- Consumer preferences in the region have shifted toward organic, low-sugar, and artisanal spreads, which is driving demand for high-quality, sustainable packaging
- The region benefits from a well-established retail and e-commerce infrastructure, making distribution and accessibility of packaged products highly efficient
- Major players are focusing on innovations such as biodegradable jars, flexible pouches, and single-serve packs to align with eco-conscious consumer trends
“Asia-Pacific is Projected to Register the Highest CAGR in the Jam, Jelly and Preserve Packaging Market”
- Asia-Pacific is experiencing the fastest growth rate, driven by changing dietary habits and the growing influence of Western food culture, particularly in urban areas
- Rising disposable income and a younger, health-aware population are contributing to higher demand for packaged jam, jelly, and preserves
- Rapid expansion of modern retail formats and online grocery platforms in countries such as India, China, and Indonesia is boosting market accessibility
- Local manufacturers are increasingly adopting innovative packaging formats that reflect both affordability and visual appeal to capture regional market share
Jam, Jelly and Preserve Packaging Market Share
The market competitive landscape provides details by competitor. Details included are company overview, company financials, revenue generated, market potential, investment in research and development, new market initiatives, global presence, production sites and facilities, production capacities, company strengths and weaknesses, product launch, product width and breadth, application dominance. The above data points provided are only related to the companies' focus related to market.
The Major Market Leaders Operating in the Market Are:
- Ajanta Bottle Pvt. Ltd. (India)
- Berlin Packaging LLC (U.S.)
- Bora Packaging Industries (India)
- Conagra Brands Inc. (U.S.)
- Festo SE and Co. KG (Germany)
- Futuristic Packaging Pvt. Ltd. (India)
- H.B. Fuller Co. (U.S.)
- Kanishka Technopack Industries (India)
- LD Packaging Co. Ltd. (China)
- Packaging for Retail Ltd. (U.K.)
- Packiro GmbH (Germany)
- Sanjeev Flexi Package Pvt. Ltd. (India)
- Scholle IPN Corp. (U.S.)
- SF PACKAGING CO. LTD. (China)
- Trivium Packaging B.V (Netherlands)
- TURNHERE (U.S.)
SKU-

- Interactive Data Analysis Dashboard
- Company Analysis Dashboard for high growth potential opportunities
- Research Analyst Access for customization & queries
- Competitor Analysis with Interactive dashboard
- Latest News, Updates & Trend analysis
- Harness the Power of Benchmark Analysis for Comprehensive Competitor Tracking
Table of Content
1 INTRODUCTION
1.1 OBJECTIVES OF THE STUDY
1.2 MARKET DEFINITION
1.3 OVERVIEW OF GLOBAL JAMS, JELLIES AND PRESERVES MARKET
1.4 CURRENCY AND PRICING
1.5 LIMITATION
1.6 MARKETS COVERED
2 MARKET SEGMENTATION
2.1 KEY TAKEAWAYS
2.2 ARRIVING AT THE GLOBAL JAMS, JELLIES AND PRESERVES MARKET SIZE
2.2.1 VENDOR POSITIONING GRID
2.2.2 TECHNOLOGY LIFE LINE CURVE
2.2.3 MARKET GUIDE
2.2.4 COMPANY POSITIONING GRID
2.2.5 COMAPANY MARKET SHARE ANALYSIS
2.2.6 MULTIVARIATE MODELLING
2.2.7 DEMAND AND SUPPLY-SIDE VARIABLES
2.2.8 TOP TO BOTTOM ANALYSIS
2.2.9 STANDARDS OF MEASUREMENT
2.2.10 VENDOR SHARE ANALYSIS
2.2.11 DATA POINTS FROM KEY PRIMARY INTERVIEWS
2.2.12 DATA POINTS FROM KEY SECONDARY DATABASES
2.3 GLOBAL JAMS, JELLIES AND PRESERVES MARKET: RESEARCH SNAPSHOT
2.4 ASSUMPTIONS
3 MARKET OVERVIEW
3.1 DRIVERS
3.2 RESTRAINTS
3.3 OPPORTUNITIES
3.4 CHALLENGES
4 EXECUTIVE SUMMARY
5 PREMIUM INSIGHTS
5.1 SUPPLY CHAIN ANALYSIS
5.2 FACTORS INFLUENCING PURCHASING DECISION
5.3 INDUTRY TRENDS AND FUTURE PERSPECTIVES
5.4 SHOPPING BEHAVIOUR AND DYNAMICS
5.4.1 RECOMMENDATION FROM FAMILY & FRIENDS
5.4.2 RESEARCH
5.4.3 IMPULSIVE
5.4.4 ADVERTISEMENT
5.4.4.1. TTELEVISION ADVERTISEMENT
5.4.4.2. OONLINE ADVERTISEMENT
5.4.4.3. IIN-STORE ADVERTISEMENT
5.4.4.4. OOUTDOOR ADVERTISEMENT
5.5 PRIVATE LABEL VS BRAND ANALYSIS
5.6 PROMOTIONAL ACTIVITIES
5.7 CONSUMER DISPOSABLE INCOME DYNAMICS/SPEND DYNAMICS
5.8 NEW PRODUCT LAUNCH STRATEGY
5.8.1 NUMBER OF NEW PRODUCT LAUNCH
5.8.1.1. LLINE EXTENSTION
5.8.1.2. NNEW PACKAGING
5.8.1.3. RRE-LAUNCHED
5.8.1.4. NNEW FORMULATION
5.9 CONSUMER LEVEL TRENDS
5.1 MEETING CONSUMER REQUIREMENT
6 IMPACT OF ECONOMIC SLOW DOWN ON MARKET
6.1 IMPACT ON PRICE
6.2 IMPACT ON SUPPLY CHAIN
6.3 IMPACT ON SHIPMENT
6.4 IMPACT ON COMPANY’S STRATEGIC DECISIONS
7 REGULATORY FRAMEWORK AND GUIDELINES
8 PRICING INDEX (PRICE AT B2B END & PRICES AT FOB)
9 PRODUCTION CAPACITY OF KEY MANUFACTURERES
10 BRAND OUTLOOK
10.1 COMPARATIVE BRAND ANALYSIS
10.2 PRODUCT VS BRAND OVERVIEW
11 GLOBAL JAMS, JELLIES AND PRESERVES MARKET, BY TYPE
11.1 OVERVIEW
11.2 JAMS
11.2.1 JAMS, BY FLAVOR
11.2.1.1. MIX FRUIT
11.2.1.2. SINGLE FRUIT
11.2.1.2.1. BLACKBERRY
11.2.1.2.2. BLUEBERRY
11.2.1.2.3. STRAWBERRY
11.2.1.2.4. BLACK CURRENT
11.2.1.2.5. APRICOT
11.2.1.2.6. GRAPE
11.2.1.2.7. CRANBERRY
11.2.1.2.8. RASPBERRY
11.2.1.2.9. APPLE
11.2.1.2.10. ORANGE
11.2.1.2.11. PLUMS
11.2.1.2.12. LEMON
11.2.1.2.13. PEACHES
11.2.1.2.14. PINEAPPLE
11.2.1.2.15. GUAVA
11.2.1.2.16. BANANA
11.2.1.2.17. KIWI
11.2.1.2.18. OTHERS
11.3 JELLY
11.3.1 JELLY, BY FLAVOR
11.3.1.1. MIX FRUIT
11.3.1.2. SINGLE FRUIT
11.3.1.2.1. BLACKBERRY
11.3.1.2.2. BLUEBERRY
11.3.1.2.3. STRAWBERRY
11.3.1.2.4. BLACK CURRENT
11.3.1.2.5. APRICOT
11.3.1.2.6. GRAPE
11.3.1.2.7. CRANBERRY
11.3.1.2.8. RASPBERRY
11.3.1.2.9. APPLE
11.3.1.2.10. ORANGE
11.3.1.2.11. PLUMS
11.3.1.2.12. LEMON
11.3.1.2.13. PEACHES
11.3.1.2.14. PINEAPPLE
11.3.1.2.15. GUAVA
11.3.1.2.16. BANANA
11.3.1.2.17. KIWI
11.3.1.2.18. OTHERS
11.4 PRESERVES
11.4.1 PRESERVES, BY FLAVOR
11.4.1.1. MIX FRUIT
11.4.1.2. SINGLE FRUIT
11.4.1.2.1. BLACKBERRY
11.4.1.2.2. BLUEBERRY
11.4.1.2.3. STRAWBERRY
11.4.1.2.4. BLACK CURRENT
11.4.1.2.5. APRICOT
11.4.1.2.6. GRAPE
11.4.1.2.7. CRANBERRY
11.4.1.2.8. RASPBERRY
11.4.1.2.9. APPLE
11.4.1.2.10. ORANGE
11.4.1.2.11. PLUMS
11.4.1.2.12. LEMON
11.4.1.2.13. PEACHES
11.4.1.2.14. PINEAPPLE
11.4.1.2.15. GUAVA
11.4.1.2.16. BANANA
11.4.1.2.17. KIWI
11.4.1.2.18. OTHERS
12 GLOBAL JAMS, JELLIES AND PRESERVES MARKET, BY FLAVOR
12.1 OVERVIEW
12.2 MIX FRUIT
12.3 SINGLE FRUIT
12.3.1 BLACKBERRY
12.3.2 BLUEBERRY
12.3.3 STRAWBERRY
12.3.4 BLACK CURRENT
12.3.5 APRICOT
12.3.6 GRAPE
12.3.7 CRANBERRY
12.3.8 RASPBERRY
12.3.9 APPLE
12.3.10 ORANGE
12.3.11 PLUMS
12.3.12 LEMON
12.3.13 PEACHES
12.3.14 PINEAPPLE
12.3.15 GUAVA
12.3.16 BANANA
12.3.17 KIWI
12.3.18 OTHERS
13 GLOBAL JAMS, JELLIES AND PRESERVES MARKET, BY COLORIE CONTENT
13.1 OVERVIEW
13.2 REGULAR/WITH CALORIE
13.3 LOW CAORIE
13.4 CALORIE FREE
14 GLOBAL JAMS, JELLIES AND PRESERVES MARKET, BY CATEGORY
14.1 OVERVIEW
14.2 CONVENTIONAL
14.3 ORGANIC
15 GLOBAL JAMS, JELLIES AND PRESERVES MARKET, BY NATURE
15.1 OVERVIEW
15.2 GMO
15.3 NON-GMO
16 GLOBAL JAMS, JELLIES AND PRESERVES MARKET, BY BRAND
16.1 OVERVIEW
16.2 BRANDED
16.3 PRIVATE LABEL
17 GLOBAL JAMS, JELLIES AND PRESERVES MARKET, BY END USERS
17.1 OVERVIEW
17.2 HOUSEHOLD/RETAIL
17.3 FOOD SERVICE INDUSTRY
17.3.1 FOOD SERVICE INDUSTRY, BY TYPE
17.3.1.1. HOTELS
17.3.1.2. RESTAURANTS
17.3.1.3. CAFES
17.3.1.4. CANTEENS
17.3.1.5. GHOST KITCHEN
17.3.1.6. OTEHRS
18 GLOBAL JAMS, JELLIES AND PRESERVES MARKET, BY PACKAGING TYPE
18.1 OVERVIEW
18.2 SACHETS
18.3 DIP POTS
18.4 POUCHES
18.5 JARS
18.5.1 PLASTC
18.5.2 GLASS
18.6 BOTTLES
18.6.1 PLASTC
18.6.2 GLASS
18.6.2.1. OTHERS
19 GLOBAL JAMS, JELLIES AND PRESERVES MARKET, BY DISTRIBUTION CHANNEL
19.1 OVERVIEW
19.2 STORE-BASED RETAILING
19.2.1 CCONVENIENCE STORES
19.2.2 SSUPERMARKETS/HYPERMARKETS
19.2.3 SSPECIALTY STORES
19.2.4 GGROCERY STORES
19.2.5 WWHOLESALERS
19.2.6 OOTHERS
19.3 NON-STORE RETAILING
19.3.1 EE-COMMERCE RETAILER
19.3.2 COMPANY WEBSITE
20 GLOBAL JAMS, JELLIES AND PRESERVES MARKET, COMPANY LANDSCAPE
20.1 COMPANY SHARE ANALYSIS: GLOBAL
20.2 COMPANY SHARE ANALYSIS: NORTH AMERICA
20.3 COMPANY SHARE ANALYSIS: EUROPE
20.4 COMPANY SHARE ANALYSIS: ASIA-PACIFIC
20.5 MERGERS & ACQUISITIONS
20.6 NEW PRODUCT DEVELOPMENT & APPROVALS
20.7 EXPANSIONS & PARTNERSHIP
20.8 REGULATORY CHANGES
21 GLOBAL JAMS, JELLIES AND PRESERVES MARKET, BY GEOGRAPHY
21.1 OVERVIEW (ALL SEGMENTATION PROVIDED ABOVE IS REPRESNTED IN THIS CHAPTER BY COUNTRY)
21.2 NORTH AMERICA
21.2.1 U.S.
21.2.2 CANADA
21.2.3 MEXICO
21.3 EUROPE
21.3.1 GERMANY
21.3.2 U.K.
21.3.3 ITALY
21.3.4 FRANCE
21.3.5 SPAIN
21.3.6 SWITZERLAND
21.3.7 NETHERLANDS
21.3.8 BELGIUM
21.3.9 RUSSIA
21.3.10 DENMARK
21.3.11 SWEDEN
21.3.12 POLAND
21.3.13 TURKEY
21.3.14 REST OF EUROPE
21.4 ASIA-PACIFIC
21.4.1 JAPAN
21.4.2 CHINA
21.4.3 SOUTH KOREA
21.4.4 INDIA
21.4.5 AUSTRALIA
21.4.6 SINGAPORE
21.4.7 THAILAND
21.4.8 INDONESIA
21.4.9 MALAYSIA
21.4.10 PHILIPPINES
21.4.11 NEW ZEALAND
21.4.12 VIETNAM
21.4.13 REST OF ASIA-PACIFIC
21.5 SOUTH AMERICA
21.5.1 BRAZIL
21.5.2 ARGENTINA
21.5.3 REST OF SOUTH AMERICA
21.6 MIDDLE EAST AND AFRICA
21.6.1 SOUTH AFRICA
21.6.2 UAE
21.6.3 SAUDI ARABIA
21.6.4 OMAN
21.6.5 QATAR
21.6.6 KUWAIT
21.6.7 REST OF MIDDLE EAST AND AFRICA
22 GLOBAL JAMS, JELLIES AND PRESERVES MARKET, SWOT & DBMR ANALYSIS
23 GLOBAL JAMS, JELLIES AND PRESERVES MARKET, COMPANY PROFILE
23.1 KRAFT FOODS
23.1.1 COMPANY OVERVIEW
23.1.2 REVENUE ANALYSIS
23.1.3 GEOGRAPHICAL PRESENCE
23.1.4 PRODUCT PORTFOLIO
23.1.5 RECENT DEVELOPMENTS
23.2 MURPHY ORCHARDS
23.2.1 COMPANY OVERVIEW
23.2.2 REVENUE ANALYSIS
23.2.3 GEOGRAPHICAL PRESENCE
23.2.4 PRODUCT PORTFOLIO
23.2.5 RECENT DEVELOPMENTS
23.3 BAXTER & SONS
23.3.1 COMPANY OVERVIEW
23.3.2 REVENUE ANALYSIS
23.3.3 GEOGRAPHICAL PRESENCE
23.3.4 PRODUCT PORTFOLIO
23.3.5 RECENT DEVELOPMENTS
23.4 NAKODAS
23.4.1 COMPANY OVERVIEW
23.4.2 REVENUE ANALYSIS
23.4.3 GEOGRAPHICAL PRESENCE
23.4.4 PRODUCT PORTFOLIO
23.4.5 RECENT DEVELOPMENTS
23.5 DUERR
23.5.1 COMPANY OVERVIEW
23.5.2 REVENUE ANALYSIS
23.5.3 GEOGRAPHICAL PRESENCE
23.5.4 PRODUCT PORTFOLIO
23.5.5 RECENT DEVELOPMENTS
23.6 KEWPIE CORPORATION
23.6.1 COMPANY OVERVIEW
23.6.2 REVENUE ANALYSIS
23.6.3 GEOGRAPHICAL PRESENCE
23.6.4 PRODUCT PORTFOLIO
23.6.5 RECENT DEVELOPMENTS
23.7 B&G FOODS
23.7.1 COMPANY OVERVIEW
23.7.2 REVENUE ANALYSIS
23.7.3 GEOGRAPHICAL PRESENCE
23.7.4 PRODUCT PORTFOLIO
23.7.5 RECENT DEVELOPMENTS
23.8 HEROMEA
23.8.1 COMPANY OVERVIEW
23.8.2 REVENUE ANALYSIS
23.8.3 GEOGRAPHICAL PRESENCE
23.8.4 PRODUCT PORTFOLIO
23.8.5 RECENT DEVELOPMENTS
23.9 BRISCOE’S JELLIES
23.9.1 COMPANY OVERVIEW
23.9.2 REVENUE ANALYSIS
23.9.3 GEOGRAPHICAL PRESENCE
23.9.4 PRODUCT PORTFOLIO
23.9.5 RECENT DEVELOPMENTS
23.1 BRASWELL'S
23.10.1 COMPANY OVERVIEW
23.10.2 REVENUE ANALYSIS
23.10.3 GEOGRAPHICAL PRESENCE
23.10.4 PRODUCT PORTFOLIO
23.10.5 RECENT DEVELOPMENTS
23.11 UNILEVER
23.11.1 COMPANY OVERVIEW
23.11.2 REVENUE ANALYSIS
23.11.3 PRODUCT PORTFOLIO
23.11.4 GEOGRAPHICAL PRESENCE
23.11.5 RECENT DEVELOPMENTS
23.12 THE JAM HORSE
23.12.1 COMPANY OVERVIEW
23.12.2 REVENUE ANALYSIS
23.12.3 PRODUCT PORTFOLIO
23.12.4 GEOGRAPHICAL PRESENCE
23.12.5 RECENT DEVELOPMENTS
23.13 THE NASHVILLE JAM
23.13.1 COMPANY OVERVIEW
23.13.2 REVENUE ANALYSIS
23.13.3 GEOGRAPHICAL PRESENCE
23.13.4 PRODUCT PORTFOLIO
23.13.5 RECENT DEVELOPMENTS
23.14 HAGO LIMITED
23.14.1 COMPANY OVERVIEW
23.14.2 REVENUE ANALYSIS
23.14.3 GEOGRAPHICAL PRESENCE
23.14.4 PRODUCT PORTFOLIO
23.14.5 RECENT DEVELOPMENTS
23.15 STUTE FOODS
23.15.1 COMPANY OVERVIEW
23.15.2 REVENUE ANALYSIS
23.15.3 GEOGRAPHICAL PRESENCE
23.15.4 PRODUCT PORTFOLIO
23.15.5 RECENT DEVELOPMENTS
23.16 NORFOLK PRESERVES
23.16.1 COMPANY OVERVIEW
23.16.2 REVENUE ANALYSIS
23.16.3 GEOGRAPHICAL PRESENCE
23.16.4 PRODUCT PORTFOLIO
23.16.5 RECENT DEVELOPMENTS
23.17 HARTLEY’S FRUIT
23.17.1 COMPANY OVERVIEW
23.17.2 REVENUE ANALYSIS
23.17.3 GEOGRAPHICAL PRESENCE
23.17.4 PRODUCT PORTFOLIO
23.17.5 RECENT DEVELOPMENTS
23.18 AHOTA
23.18.1 COMPANY OVERVIEW
23.18.2 REVENUE ANALYSIS
23.18.3 GEOGRAPHICAL PRESENCE
23.18.4 PRODUCT PORTFOLIO
23.18.5 RECENT DEVELOPMENTS
23.19 SOUTHRIDGE JAM CO.
23.19.1 COMPANY OVERVIEW
23.19.2 REVENUE ANALYSIS
23.19.3 GEOGRAPHICAL PRESENCE
23.19.4 PRODUCT PORTFOLIO
23.19.5 RECENT DEVELOPMENTS
23.2 BONNE MAMAN
23.20.1 COMPANY OVERVIEW
23.20.2 REVENUE ANALYSIS
23.20.3 GEOGRAPHICAL PRESENCE
23.20.4 PRODUCT PORTFOLIO
23.20.5 RECENT DEVELOPMENTS
*NOTE: THE COMPANIES PROFILED IS NOT EXHAUSTIVE LIST AND IS AS PER OUR PREVIOUS CLIENT REQUIREMENT. WE PROFILE MORE THAN 100 COMPANIES IN OUR STUDY AND HENCE THE LIST OF COMPANIES CAN BE MODIFIED OR REPLACED ON REQUEST
24 RELATED REPORTS
25 CONCLUSION
26 QUESTIONNAIRE
Global Jam Jelly And Preserves Market, Supply Chain Analysis and Ecosystem Framework
To support market growth and help clients navigate the impact of geopolitical shifts, DBMR has integrated in-depth supply chain analysis into its Global Jam Jelly And Preserves Market research reports. This addition empowers clients to respond effectively to global changes affecting their industries. The supply chain analysis section includes detailed insights such as Global Jam Jelly And Preserves Market consumption and production by country, price trend analysis, the impact of tariffs and geopolitical developments, and import and export trends by country and HSN code. It also highlights major suppliers with data on production capacity and company profiles, as well as key importers and exporters. In addition to research, DBMR offers specialized supply chain consulting services backed by over a decade of experience, providing solutions like supplier discovery, supplier risk assessment, price trend analysis, impact evaluation of inflation and trade route changes, and comprehensive market trend analysis.
Data collection and base year analysis are done using data collection modules with large sample sizes. The stage includes obtaining market information or related data through various sources and strategies. It includes examining and planning all the data acquired from the past in advance. It likewise envelops the examination of information inconsistencies seen across different information sources. The market data is analysed and estimated using market statistical and coherent models. Also, market share analysis and key trend analysis are the major success factors in the market report. To know more, please request an analyst call or drop down your inquiry.
The key research methodology used by DBMR research team is data triangulation which involves data mining, analysis of the impact of data variables on the market and primary (industry expert) validation. Data models include Vendor Positioning Grid, Market Time Line Analysis, Market Overview and Guide, Company Positioning Grid, Patent Analysis, Pricing Analysis, Company Market Share Analysis, Standards of Measurement, Global versus Regional and Vendor Share Analysis. To know more about the research methodology, drop in an inquiry to speak to our industry experts.
Data Bridge Market Research is a leader in advanced formative research. We take pride in servicing our existing and new customers with data and analysis that match and suits their goal. The report can be customized to include price trend analysis of target brands understanding the market for additional countries (ask for the list of countries), clinical trial results data, literature review, refurbished market and product base analysis. Market analysis of target competitors can be analyzed from technology-based analysis to market portfolio strategies. We can add as many competitors that you require data about in the format and data style you are looking for. Our team of analysts can also provide you data in crude raw excel files pivot tables (Fact book) or can assist you in creating presentations from the data sets available in the report.


