
Keratometer Market Analysis and Size
According to the World Health Organization's (WHO) October 2021 report, approximately 2.2 billion people worldwide have near or distance vision impairment, of which approximately 1 billion cases of vision impairment can or could have been prevented, demonstrating the high burden of cases of vision impairment worldwide and the possibility of treatment, there is a very high demand for diagnostics and therapeutics for diseases associated with vision impairment. According to an article published in February 2020 titled "The Statistics on Eye Disease in America (2022)," approximately 12 million people aged 40 and above in the United States suffer from vision impairment, with approximately a million suffering from blindness. According to the Centers for Disease Control and Prevention (CDC), 17.2 percent of Americans over the age of 40 will have a cataract in at least one eye by 2021. (about 20.5 million people). Cataracts are expected to affect over 30 million people by 2028. Cataract surgery is the most commonly recommended treatment option. As a result, the demand for effective therapeutics and diagnostics is expected to rise, driving growth in the studied market.
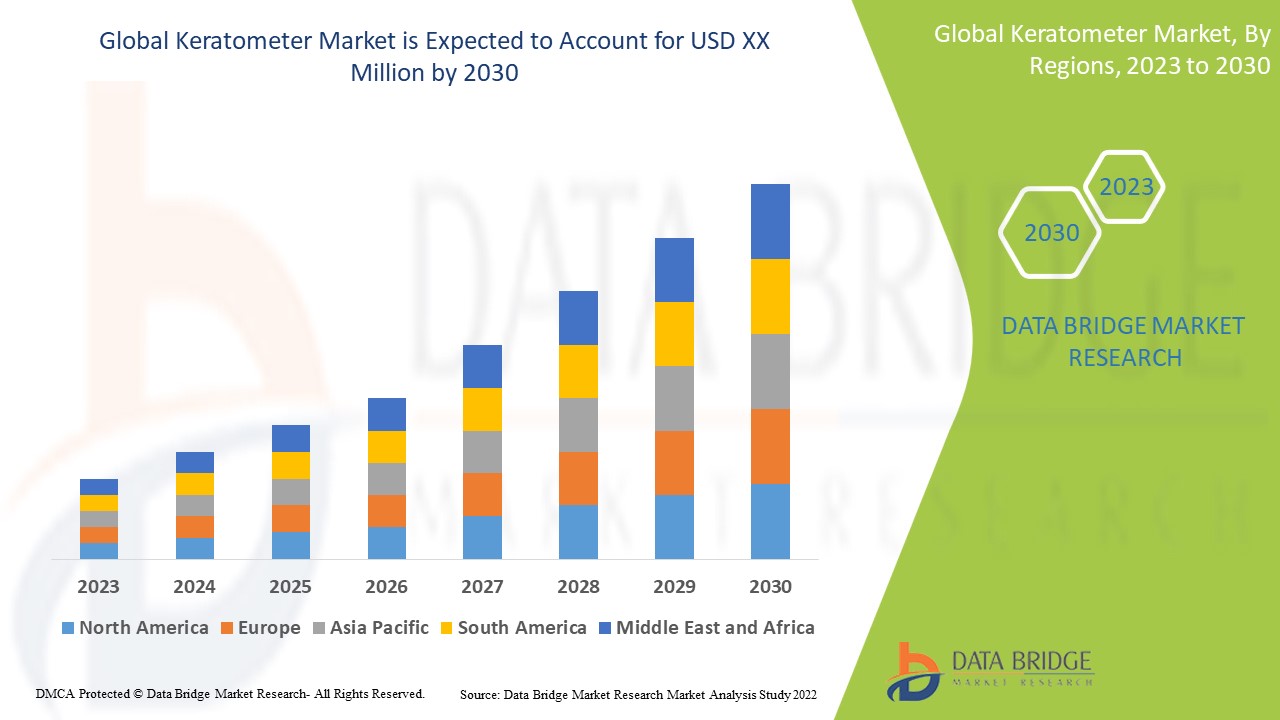
Data Bridge Market Research analyses that the keratometer market is expected to undergo a CAGR of 5% during the forecast period 2023 to 2030. In addition to the insights on market scenarios such as market value, growth rate, segmentation, geographical coverage, and major players, the market reports curated by the Data Bridge Market Research also include depth expert analysis, patient epidemiology, pipeline analysis, pricing analysis, and regulatory framework.
Keratometer Market Scope and Segmentation
|
Report Metric |
Details |
|
Forecast Period |
2023 to 2030 |
|
Base Year |
2022 |
|
Historic Years |
2021 (Customizable to 2015 - 2020) |
|
Quantitative Units |
Revenue in USD Million, Volumes in Units, Pricing in USD |
|
Segments Covered |
Position Type (Single Position Helmholtz Keratometers, Double Position Helmholtz Keratometers), Operation (Manual Keratometer, Automatic Keratometer), Application (Hospitals, Laboratories, Ophthalmic and Optometrist Offices, Others) |
|
Countries Covered |
U.S., Canada and Mexico in North America, Germany, France, U.K., Netherlands, Switzerland, Belgium, Russia, Italy, Spain, Turkey, Rest of Europe in Europe, China, Japan, India, South Korea, Singapore, Malaysia, Australia, Thailand, Indonesia, Philippines, Rest of Asia-Pacific (APAC) in the Asia-Pacific (APAC), Saudi Arabia, U.A.E, South Africa, Egypt, Israel, Rest of Middle East and Africa (MEA) as a part of Middle East and Africa (MEA), Brazil, Argentina and Rest of South America as part of South America |
|
Market Players Covered |
Carl Zeiss AG (Germany), HAAG-STREIT GROUP (Switzerland), Topcon (Japan), NIDEK CO., LTD. (Japan), Heidelberg Engineering GmbH (Japan), Escalon (U.S.), Novartis AG (Switzerland), Valent BioSciences LLC (U.S.), Canon Inc. (Japan), Essilor (France), HEINE Optotechnik GmbH & Co. KG (Germany) and Luneau Technology USA (France), Coburn Technologies Inc. (U.S.), Alcon (Switzerland), AMETEK Inc. (U.S.), Reichert Inc. (U.S.) |
|
Market Opportunities |
|
Market Definition
A keratometer, also known as an ophthalmometer, is a diagnostic tool that measures the curvature of the anterior surface of the cornea to determine the degree and axis of astigmatism. It is used in conjunction with a special contact lens holder and a special holding attachment. It does so by estimating the size of an image reflected from two paracentral locations and stabilizing the image with doubling prisms, which allows for more precise focusing. As a result, the prescription for the glasses is quite precise.
Global Keratometer Market Dynamics
Drivers
- Increase in awareness about eye care
Diagnosis of eye conditions such as refractive errors, age-related macular degeneration, cataracts, and diabetic retinopathy is aided by optometry or keratometer. This keratometer device is used to detect hyperopia (farsightedness) and myopia (nearsightedness) (nearsightedness). Improving prevention, early treatment, and access to eye care propel the market growth.
- Rising volumes of eye tests
The device, which uses infrared sensors, allows optometrists or ophthalmologists to accurately assess the refraction occurring in the eye by observing the change in the direction of light entering the eye. The device is specifically designed to assess the visual acuity of non-communicative individuals such as infants, young children, and people with disabilities. As a result, rising eye test and examination volumes and technological advancements in eye screening equipment are expected to drive market revenue growth during the forecast period.
Opportunities
- Technological advancements
Technological advancements, particularly in ophthalmic equipment, such as the use of A-scanners, which can be used without eye contact, and B-scan ultrasound, which provides detailed information about the inner eye, are key trends driving the global keratometer market.
Restraints/Challenges
- High price of keratometers
The rising cost of keratometers, as well as inaccuracies in their analysis, are two concerns that are limiting the market's growth. These factors are expected to limit its global expansion during the forecast period.
Furthermore, it only measures a small region of the cornea (2 points in the 3-4 mm zone), does not provide information about the cornea central or peripheral to these points, measures different regions for different powers, assumes the cornea is spherocylindrical and symmetric with a major and minor axis separated by 90 degrees, ignores spherical aberration, is susceptible to focusing and misalignment errors, and cannot accurately measure irregular cornea.
This keratometer market report provides details of new recent developments, trade regulations, import-export analysis, production analysis, value chain optimization, market share, impact of domestic and localized market players, analyses opportunities in terms of emerging revenue pockets, changes in market regulations, strategic market growth analysis, market size, category market growths, application niches and dominance, product approvals, product launches, geographic expansions, technological innovations in the market. To gain more info on the keratometer market contact Data Bridge Market Research for an Analyst Brief, our team will help you take an informed market decision to achieve market growth.
Global Keratometer Market Scope
The keratometer market is segmented on the basis of position type, operation, and application. The growth amongst these segments will help you analyze meagre growth segments in the industries and provide the users with a valuable market overview and market insights to help them make strategic decisions for identifying core market applications.
Position Type
- Single Position Helmholtz Keratometers
- Double Position Helmholtz Keratometers
Operation
- Manual Keratometer
- Automatic Keratometer
Application
- Hospitals
- Laboratories
- Ophthalmic
- Optometrist Offices
- Others
Keratometer Market Regional Analysis/Insights
The keratometer market is analyzed and market size insights and trends are provided by country, position type, operation, and application as referenced above.
The countries covered in the keratometer market report are U.S., Canada and Mexico in North America, Germany, France, U.K., Netherlands, Switzerland, Belgium, Russia, Italy, Spain, Turkey, Rest of Europe in Europe, China, Japan, India, South Korea, Singapore, Malaysia, Australia, Thailand, Indonesia, Philippines, Rest of Asia-Pacific (APAC) in the Asia-Pacific (APAC), Saudi Arabia, U.A.E, South Africa, Egypt, Israel, Rest of Middle East and Africa (MEA) as a part of Middle East and Africa (MEA), Brazil, Argentina and Rest of South America as part of South America.
North America dominates the keratometer market due to eye disorders which are becoming more common in the area and ophthalmology procedures and treatments are being used more frequently.
Asia-Pacific is expected to grow at the highest growth rate in the forecast period of 2023 to 2030 due to rising healthcare costs, rise in elderly people and government initiatives to raise knowledge about eye exams.
The country section of the report also provides individual market impacting factors and changes in regulation in the market domestically that impacts the current and future trends of the market. Data points like down-stream and upstream value chain analysis, technical trends and porter's five forces analysis, case studies are some of the pointers used to forecast the market scenario for individual countries. Also, the presence and availability of global brands and their challenges faced due to large or scarce competition from local and domestic brands, impact of domestic tariffs and trade routes are considered while providing forecast analysis of the country data.
Healthcare Infrastructure Growth Installed base and New Technology Penetration
The keratometer market also provides you with detailed market analysis for every country growth in healthcare expenditure for capital equipment, installed base of different kind of products for keratometer market, impact of technology using life line curves and changes in healthcare regulatory scenarios and their impact on the keratometer market. The data is available for historic period 2011-2021.
Competitive Landscape and Keratometer Market Share Analysis
The keratometer market competitive landscape provides details by competitor. Details included are company overview, company financials, revenue generated, market potential, investment in research and development, new market initiatives, global presence, production sites and facilities, production capacities, company strengths and weaknesses, product launch, product width and breadth, application dominance. The above data points provided are only related to the companies' focus related to keratometer market.
Some of the major players operating in the keratometer market are:
- Carl Zeiss AG (Germany)
- HAAG-STREIT GROUP (Switzerland)
- Topcon (Japan)
- NIDEK CO., LTD. (Japan)
- Heidelberg Engineering GmbH (Japan)
- Escalon (U.S.)
- Novartis AG (Switzerland)
- Valent BioSciences LLC (U.S.)
- Canon Inc. (Japan)
- Essilor (France)
- HEINE Optotechnik GmbH & Co. KG (Germany)
- Luneau Technology USA (France)
- Coburn Technologies Inc. (U.S.)
- Alcon (Switzerland)
- AMETEK Inc. (U.S.)
- Reichert Inc. (U.S.)
SKU-

- Interactive Data Analysis Dashboard
- Company Analysis Dashboard for high growth potential opportunities
- Research Analyst Access for customization & queries
- Competitor Analysis with Interactive dashboard
- Latest News, Updates & Trend analysis
- Harness the Power of Benchmark Analysis for Comprehensive Competitor Tracking
Table of Content
1 INTRODUCTION
1.1 OBJECTIVES OF THE STUDY
1.2 MARKET DEFINITION
1.3 OVERVIEW OF GLOBAL KERATOMETER MARKET
1.4 CURRENCY AND PRICING
1.5 LIMITATION
1.6 MARKETS COVERED
2 MARKET SEGMENTATION
2.1 KEY TAKEAWAYS
2.2 ARRIVING AT THE GLOBAL KERATOMETER MARKET SIZE
2.2.1 VENDOR POSITIONING GRID
2.2.2 TECHNOLOGY LIFE LINE CURVE
2.2.3 TRIPOD DATA VALIDATION MODEL
2.2.4 MARKET GUIDE
2.2.5 MULTIVARIATE MODELLING
2.2.6 TOP TO BOTTOM ANALYSIS
2.2.7 CHALLENGE MATRIX
2.2.8 APPLICATION COVERAGE GRID
2.2.9 STANDARDS OF MEASUREMENT
2.2.10 VENDOR SHARE ANALYSIS
2.2.11 SALES DATA VOLUME
2.2.12 DATA POINTS FROM KEY PRIMARY INTERVIEWS
2.2.13 DATA POINTS FROM KEY SECONDARY DATABASES
2.3 GLOBAL KERATOMETER MARKET : RESEARCH SNAPSHOT
2.4 ASSUMPTIONS
3 MARKET OVERVIEW
3.1 DRIVERS
3.2 RESTRAINTS
3.3 OPPORTUNITIES
3.4 CHALLENGES
4 EXECUTIVE SUMMARY
5 PREMIUM INSIGHTS
5.1 PESTEL ANALYSIS
5.2 PORTER’S 5 FORCES MODEL
5.3 STRATEGIC INITIATIVES
6 INDUSTRY INSIGHTS
7 REGULATORY FRAMEWORK
8 GLOBAL KERATOMETER MARKET , BY PRODUCT
8.1 OVERVIEW
8.2 INSTRUMENT
8.2.1 BY POSITION
8.2.1.1. SINGLE POSITION HELMHOLTZ KERATOMETERS
8.2.1.1.1. MARKET VALUE (USD MILLION)
8.2.1.1.2. MARKET VOLUME (UNITS)
8.2.1.1.3. AVERAGE SELLING PRICE (USD)
8.2.1.2. DOUBLE POSITION HELMHOLTZ KERATOMETERS
8.2.1.2.1. MARKET VALUE (USD MILLION)
8.2.1.2.2. MARKET VOLUME (UNITS)
8.2.1.2.3. AVERAGE SELLING PRICE (USD)
8.2.2 BY ALIGNMENT
8.2.2.1. 2D
8.2.2.1.1. MARKET VALUE (USD MILLION)
8.2.2.1.2. MARKET VOLUME (UNITS)
8.2.2.1.3. AVERAGE SELLING PRICE (USD)
8.2.2.2. 3D
8.2.2.2.1. MARKET VALUE (USD MILLION)
8.2.2.2.2. MARKET VOLUME (UNITS)
8.2.2.2.3. AVERAGE SELLING PRICE (USD)
8.2.3 BY CONNECTIVITY
8.2.3.1. LAN
8.2.3.1.1. MARKET VALUE (USD MILLION)
8.2.3.1.2. MARKET VOLUME (UNITS)
8.2.3.1.3. AVERAGE SELLING PRICE (USD)
8.2.3.2. WIFI
8.2.3.2.1. MARKET VALUE (USD MILLION)
8.2.3.2.2. MARKET VOLUME (UNITS)
8.2.3.2.3. AVERAGE SELLING PRICE (USD)
8.2.3.3. USB CABLE
8.2.3.3.1. MARKET VALUE (USD MILLION)
8.2.3.3.2. MARKET VOLUME (UNITS)
8.2.3.3.3. AVERAGE SELLING PRICE (USD)
8.2.3.4. OTHERS
8.2.4 BY DISPLAY SIZE
8.2.4.1. 5-6 INCH
8.2.4.1.1. MARKET VALUE (USD MILLION)
8.2.4.1.2. MARKET VOLUME (UNITS)
8.2.4.1.3. AVERAGE SELLING PRICE (USD)
8.2.4.2. 6-7.5 INCH
8.2.4.2.1. MARKET VALUE (USD MILLION)
8.2.4.2.2. MARKET VOLUME (UNITS)
8.2.4.2.3. AVERAGE SELLING PRICE (USD)
8.2.4.3. ABOVE 7.5 INCH
8.2.4.3.1. MARKET VALUE (USD MILLION)
8.2.4.3.2. MARKET VOLUME (UNITS)
8.2.4.3.3. AVERAGE SELLING PRICE (USD)
8.3 ACCESSORIES
8.3.1 MODEL EYE
8.3.1.1. MARKET VALUE (USD MILLION)
8.3.1.2. MARKET VOLUME (UNITS)
8.3.1.3. AVERAGE SELLING PRICE (USD)
8.3.2 CHIN REST PAPER
8.3.2.1. MARKET VALUE (USD MILLION)
8.3.2.2. MARKET VOLUME (UNITS)
8.3.2.3. AVERAGE SELLING PRICE (USD)
8.3.3 CHIN REST PAPER PIN
8.3.3.1. MARKET VALUE (USD MILLION)
8.3.3.2. MARKET VOLUME (UNITS)
8.3.3.3. AVERAGE SELLING PRICE (USD)
8.3.4 SPARE FUSE
8.3.4.1. MARKET VALUE (USD MILLION)
8.3.4.2. MARKET VOLUME (UNITS)
8.3.4.3. AVERAGE SELLING PRICE (USD)
8.3.5 DUST COVER
8.3.5.1. MARKET VALUE (USD MILLION)
8.3.5.2. MARKET VOLUME (UNITS)
8.3.5.3. AVERAGE SELLING PRICE (USD)
9 GLOBAL KERATOMETER MARKET , BY MODE
9.1 OVERVIEW
9.2 MANUAL
9.3 AUTOMATIC
10 GLOBAL KERATOMETER MARKET , BY TYPE
10.1 OVERVIEW
10.2 STATIONARY
10.3 PORTABLE
11 GLOBAL KERATOMETER MARKET , BY INDICATION
11.1 OVERVIEW
11.2 ASTIGMATISM ASSESSMENT
11.3 CONTACT LENS FITTING
11.4 CORNEAL SHAPE ASSESSMENT
11.5 CONTACT LENS FLEXURE ASSESSMENT
11.6 ANISOMETROPIA
11.7 REFRACTIVE ERROR ASSESSMENT
11.8 IOL POWER CALCULATION
11.9 OTHERS
12 GLOBAL KERATOMETER MARKET , BY END USER
12.1 OVERVIEW
12.2 HOSPITALS
12.3 LABORATORIES
12.4 OPHTHALMIC AND OPTOMETRIST OFFICES
12.5 OTHERS
13 GLOBAL KERATOMETER MARKET , BY DISTRIBUTION CHANNEL
13.1 OVERVIEW
13.2 DIRECT TENDER
13.3 THIRD PARTY DISTRIBUTER
13.4 OTHERS
14 GLOBAL KERATOMETER MARKET , COMPANY LANDSCAPE
14.1 COMPANY SHARE ANALYSIS: NORTH AMERICA
14.2 COMPANY SHARE ANALYSIS: EUROPE
14.3 COMPANY SHARE ANALYSIS: ASIA-PACIFIC
14.4 COMPANY SHARE ANALYSIS: MIDDLE EAST AND AFRICA
14.5 COMPANY SHARE ANALYSIS: SOUTH AMERICA
14.6 MERGERS & ACQUISITIONS
14.7 NEW PRODUCT DEVELOPMENT & APPROVALS
14.8 EXPANSIONS
14.9 REGULATORY CHANGES
14.1 PARTNERSHIP AND OTHER STRATEGIC DEVELOPMENTS
15 GLOBAL KERATOMETER MARKET , BY REGION
GLOBAL KERATOMETER MARKET , (ALL SEGMENTATION PROVIDED ABOVE IS REPRESENTED IN THIS CHAPTER BY COUNTRY)
15.1 GLOBAL
15.2 NORTH AMERICA
15.2.1 U.S
15.2.2 CANADA
15.2.3 MEXICO
15.3 EUROPE
15.3.1 GERMANY
15.3.2 FRANCE
15.3.3 U.K.
15.3.4 ITALY
15.3.5 SPAIN
15.3.6 RUSSIA
15.3.7 TURKEY
15.3.8 BELGIUM
15.3.9 DENMARK
15.3.10 NETHERLANDS
15.3.11 SWITZERLAND
15.3.12 SWEDEN
15.3.13 POLAND
15.3.14 NORWAY
15.3.15 FINLAND
15.3.16 REST OF EUROPE
15.4 ASIA-PACIFIC
15.4.1 JAPAN
15.4.2 CHINA
15.4.3 SOUTH KOREA
15.4.4 INDIA
15.4.5 AUSTRALIA
15.4.6 NEW ZEALAND
15.4.7 SINGAPORE
15.4.8 THAILAND
15.4.9 MALAYSIA
15.4.10 VIETNAM
15.4.11 TAIWAN
15.4.12 INDONESIA
15.4.13 PHILIPPINES
15.4.14 REST OF ASIA-PACIFIC
15.5 SOUTH AMERICA
15.5.1 BRAZIL
15.5.2 ARGENTINA
15.5.3 REST OF SOUTH AMERICA
15.6 MIDDLE EAST AND AFRICA
15.6.1 SOUTH AFRICA
15.6.2 SAUDI ARABIA
15.6.3 BAHRAIN
15.6.4 UAE
15.6.5 KUWAIT
15.6.6 OMAN
15.6.7 QATAR
15.6.8 EGYPT
15.6.9 ISRAEL
15.6.10 REST OF MIDDLE EAST AND AFRICA
15.7 KEY PRIMARY INSIGHTS: BY MAJOR COUNTRIES
16 GLOBAL KERATOMETER MARKET , COMPANY PROFILE
16.1 ZEISS
16.1.1 COMPANY OVERVIEW
16.1.2 REVENUE ANALYSIS
16.1.3 GEOGRAPHIC PRESENCE
16.1.4 PRODUCT PORTFOLIO
16.1.5 RECENT DEVELOPEMENTS
16.2 HAAG-STREIT GROUP
16.2.1 COMPANY OVERVIEW
16.2.2 REVENUE ANALYSIS
16.2.3 GEOGRAPHIC PRESENCE
16.2.4 PRODUCT PORTFOLIO
16.2.5 RECENT DEVELOPEMENTS
16.3 TOPCON CORPORATION
16.3.1 COMPANY OVERVIEW
16.3.2 REVENUE ANALYSIS
16.3.3 GEOGRAPHIC PRESENCE
16.3.4 PRODUCT PORTFOLIO
16.3.5 RECENT DEVELOPEMENTS
16.4 NIDEK CO., LTD.
16.4.1 COMPANY OVERVIEW
16.4.2 REVENUE ANALYSIS
16.4.3 GEOGRAPHIC PRESENCE
16.4.4 PRODUCT PORTFOLIO
16.4.5 RECENT DEVELOPEMENTS
16.5 CANON MEDICAL SYSTEM
16.5.1 COMPANY OVERVIEW
16.5.2 REVENUE ANALYSIS
16.5.3 GEOGRAPHIC PRESENCE
16.5.4 PRODUCT PORTFOLIO
16.5.5 RECENT DEVELOPEMENTS
16.6 ESSILOR LTD
16.6.1 COMPANY OVERVIEW
16.6.2 REVENUE ANALYSIS
16.6.3 GEOGRAPHIC PRESENCE
16.6.4 PRODUCT PORTFOLIO
16.6.5 RECENT DEVELOPEMENTS
16.7 HEINE OPTOTECHNIK GMBH & CO. KG
16.7.1 COMPANY OVERVIEW
16.7.2 REVENUE ANALYSIS
16.7.3 GEOGRAPHIC PRESENCE
16.7.4 PRODUCT PORTFOLIO
16.7.5 RECENT DEVELOPEMENTS
16.8 VISIONIX
16.8.1 COMPANY OVERVIEW
16.8.2 REVENUE ANALYSIS
16.8.3 GEOGRAPHIC PRESENCE
16.8.4 PRODUCT PORTFOLIO
16.8.5 RECENT DEVELOPEMENTS
16.9 COBURN TECHNOLOGIES, INC.
16.9.1 COMPANY OVERVIEW
16.9.2 REVENUE ANALYSIS
16.9.3 GEOGRAPHIC PRESENCE
16.9.4 PRODUCT PORTFOLIO
16.9.5 RECENT DEVELOPEMENTS
16.1 REICHERT, INC.
16.10.1 COMPANY OVERVIEW
16.10.2 REVENUE ANALYSIS
16.10.3 GEOGRAPHIC PRESENCE
16.10.4 PRODUCT PORTFOLIO
16.10.5 RECENT DEVELOPEMENTS
16.11 HAAG-STREIT GROUP
16.11.1 COMPANY OVERVIEW
16.11.2 REVENUE ANALYSIS
16.11.3 GEOGRAPHIC PRESENCE
16.11.4 PRODUCT PORTFOLIO
16.11.5 RECENT DEVELOPEMENTS
16.12 MAINLINE INSTRUMENTS
16.12.1 COMPANY OVERVIEW
16.12.2 REVENUE ANALYSIS
16.12.3 GEOGRAPHIC PRESENCE
16.12.4 PRODUCT PORTFOLIO
16.12.5 RECENT DEVELOPEMENTS
16.13 RIGHTON
16.13.1 COMPANY OVERVIEW
16.13.2 REVENUE ANALYSIS
16.13.3 GEOGRAPHIC PRESENCE
16.13.4 PRODUCT PORTFOLIO
16.13.5 RECENT DEVELOPEMENTS
16.14 TAKAGI SEIKO CO., LTD
16.14.1 COMPANY OVERVIEW
16.14.2 REVENUE ANALYSIS
16.14.3 GEOGRAPHIC PRESENCE
16.14.4 PRODUCT PORTFOLIO
16.14.5 RECENT DEVELOPEMENTS
16.15 TOMEY
16.15.1 COMPANY OVERVIEW
16.15.2 REVENUE ANALYSIS
16.15.3 GEOGRAPHIC PRESENCE
16.15.4 PRODUCT PORTFOLIO
16.15.5 RECENT DEVELOPEMENTS
16.16 POTEC
16.16.1 COMPANY OVERVIEW
16.16.2 REVENUE ANALYSIS
16.16.3 GEOGRAPHIC PRESENCE
16.16.4 PRODUCT PORTFOLIO
16.16.5 RECENT DEVELOPEMENTS
16.17 US OPHTHALMIC
16.17.1 COMPANY OVERVIEW
16.17.2 REVENUE ANALYSIS
16.17.3 GEOGRAPHIC PRESENCE
16.17.4 PRODUCT PORTFOLIO
16.17.5 RECENT DEVELOPEMENTS
NOTE: THE COMPANIES PROFILED IS NOT EXHAUSTIVE LIST AND IS AS PER OUR PREVIOUS CLIENT REQUIREMENT. WE PROFILE MORE THAN 100 COMPANIES IN OUR STUDY AND HENCE THE LIST OF COMPANIES CAN BE MODIFIED OR REPLACED ON REQUEST
17 RELATED REPORTS
18 CONCLUSION
19 QUESTIONNAIRE
20 ABOUT DATA BRIDGE MARKET RESEARCH
Data collection and base year analysis are done using data collection modules with large sample sizes. The stage includes obtaining market information or related data through various sources and strategies. It includes examining and planning all the data acquired from the past in advance. It likewise envelops the examination of information inconsistencies seen across different information sources. The market data is analysed and estimated using market statistical and coherent models. Also, market share analysis and key trend analysis are the major success factors in the market report. To know more, please request an analyst call or drop down your inquiry.
The key research methodology used by DBMR research team is data triangulation which involves data mining, analysis of the impact of data variables on the market and primary (industry expert) validation. Data models include Vendor Positioning Grid, Market Time Line Analysis, Market Overview and Guide, Company Positioning Grid, Patent Analysis, Pricing Analysis, Company Market Share Analysis, Standards of Measurement, Global versus Regional and Vendor Share Analysis. To know more about the research methodology, drop in an inquiry to speak to our industry experts.
Data Bridge Market Research is a leader in advanced formative research. We take pride in servicing our existing and new customers with data and analysis that match and suits their goal. The report can be customized to include price trend analysis of target brands understanding the market for additional countries (ask for the list of countries), clinical trial results data, literature review, refurbished market and product base analysis. Market analysis of target competitors can be analyzed from technology-based analysis to market portfolio strategies. We can add as many competitors that you require data about in the format and data style you are looking for. Our team of analysts can also provide you data in crude raw excel files pivot tables (Fact book) or can assist you in creating presentations from the data sets available in the report.


