
Global Lactose Free Products Market
Market Size in USD Billion
 USD
16.59 Billion
USD
31.87 Billion
2025
2033
USD
16.59 Billion
USD
31.87 Billion
2025
2033
| 2026 - 2033 | |
| USD 16.59 Billion | |
| USD 31.87 Billion | |
| % | |
|
Lactose-Free Products Market Size
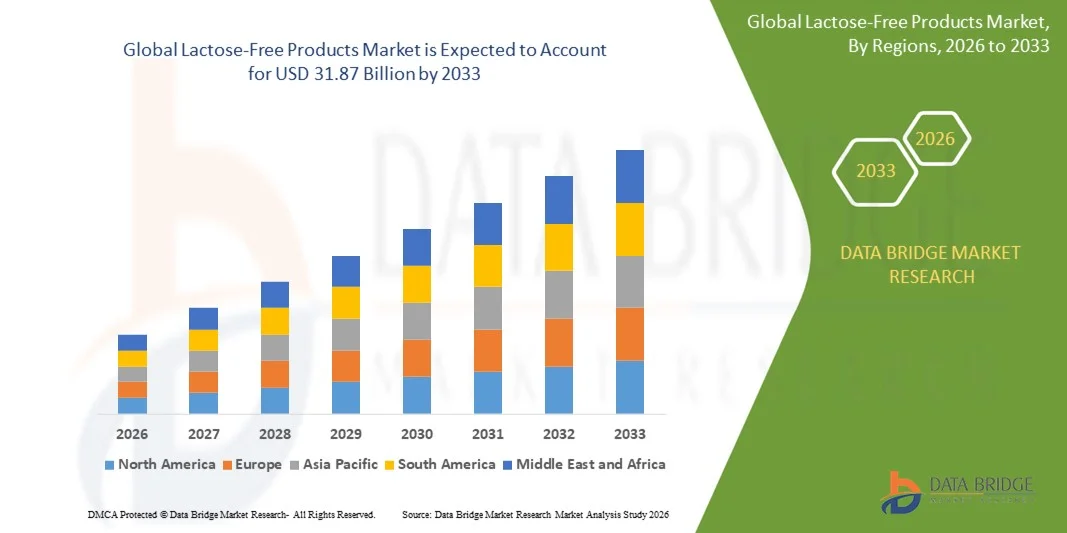
- The global lactose-free products market size was valued at USD 16.59 billion in 2025 and is expected to reach USD 31.87 billion by 2033, at a CAGR of 8.50% during the forecast period
- The market growth is largely fuelled by the rising prevalence of lactose intolerance, increasing health-conscious consumer behavior, and growing awareness of digestive wellness
- Increasing product innovation, expansion of lactose-free dairy and non-dairy alternatives, and rising adoption of plant-based diets are further supporting market growth
Lactose-Free Products Market Analysis
- The market is witnessing rapid innovation in lactose-free dairy alternatives, functional beverages, and fortified products, enhancing product variety and consumer choice
- Growing consumer preference for clean-label, natural, and fortified lactose-free options is driving R&D investments and product launches by major players
- North America dominated the lactose-free products market with the largest revenue share of 32.45% in 2025, driven by rising awareness of lactose intolerance, increasing demand for plant-based alternatives, and health-conscious consumer trends
- Asia-Pacific region is expected to witness the highest growth rate in the global lactose-free products market, driven by urbanization, rising health consciousness, government initiatives promoting nutritional awareness, and the increasing penetration of modern retail and e-commerce channels
- The milk segment held the largest market revenue share in 2025, driven by its wide acceptance as a staple dairy alternative and increasing consumer awareness regarding lactose intolerance. Milk-based lactose-free products offer ease of use in daily diets, nutritional benefits, and versatility in various culinary applications, making them highly preferred by health-conscious consumers
Report Scope and Lactose-Free Products Market Segmentation
|
Attributes |
Lactose-Free Products Key Market Insights |
|
Segments Covered |
|
|
Countries Covered |
North America
Europe
Asia-Pacific
Middle East and Africa
South America
|
|
Key Market Players |
|
|
Market Opportunities |
|
|
Value Added Data Infosets |
In addition to the insights on market scenarios such as market value, growth rate, segmentation, geographical coverage, and major players, the market reports curated by the Data Bridge Market Research also include in-depth expert analysis, pricing analysis, brand share analysis, consumer survey, demography analysis, supply chain analysis, value chain analysis, raw material/consumables overview, vendor selection criteria, PESTLE Analysis, Porter Analysis, and regulatory framework. |
Lactose-Free Products Market Trends
Rise of Plant-Based and Lactose-Free Product Adoption
- The increasing consumer shift toward lactose-free and plant-based dairy alternatives is transforming the dairy and food industry by offering products suitable for lactose-intolerant and health-conscious individuals. These products enable wider dietary inclusion while supporting digestive health, reducing gastrointestinal discomfort, and promoting overall wellness. The trend is further supported by growing awareness of sustainable and ethical food choices, driving broader adoption across global markets
- The growing popularity of ready-to-drink beverages, yogurts, and dairy alternatives is accelerating the development and adoption of lactose-free options. This trend is particularly strong in regions with high awareness of food intolerances and wellness-focused lifestyles, as consumers actively seek convenient, on-the-go solutions. Product innovation is also encouraging premium positioning, driving higher consumer engagement and brand loyalty
- Manufacturers are innovating with fortified and functional lactose-free products that include probiotics, vitamins, and proteins, enhancing nutritional benefits and consumer appeal. Such innovations help brands capture premium segments, differentiate products in a competitive market, and respond to increasing consumer demand for functional nutrition. These developments are also enabling expansion into niche markets such as infant nutrition and sports nutrition
- For instance, in 2023, several North American and European dairy companies launched lactose-free yogurt lines enriched with probiotics, resulting in increased adoption among health-conscious consumers and improved product visibility in retail. These launches contributed to higher sales volumes and encouraged competitors to invest in similar functional formulations. Consumer feedback has further driven continuous innovation in flavor and texture improvements
- While lactose-free products are gaining traction, their sustained growth depends on continuous product innovation, consumer education, and cost-efficient production technologies to ensure affordability and accessibility. Companies are also focusing on scaling production, expanding distribution networks, and integrating sustainable sourcing practices to support long-term market expansion and profitability
Lactose-Free Products Market Dynamics
Driver
Rising Prevalence of Lactose Intolerance and Health-Conscious Diets
- The increasing global prevalence of lactose intolerance is prompting consumers to seek dairy alternatives that support digestive comfort and nutritional needs. This is driving both demand and product innovation in the lactose-free segment. The rise in personalized nutrition trends is also fueling interest in targeted lactose-free offerings tailored to specific age groups and dietary requirements
- Growing awareness of health and wellness, combined with changing dietary preferences, is encouraging the consumption of plant-based and fortified lactose-free products. Consumers are actively choosing products that promote gut health, weight management, and overall wellness. Social media and influencer campaigns have further amplified consumer interest, increasing adoption in urban and semi-urban populations
- Retail expansion, including supermarkets, convenience stores, and e-commerce platforms, is facilitating greater access to lactose-free products, boosting adoption across urban and semi-urban regions. Online subscription services and direct-to-consumer sales are also helping smaller brands reach wider audiences, strengthening overall market penetration. Partnerships with major retailers are expanding shelf space and visibility
- For instance, in 2023, European and North American markets reported a significant increase in lactose-free milk and yogurt sales, driven by health-conscious millennials and the growing demand for functional beverages. These trends are encouraging multinational players to expand product lines and invest in marketing campaigns targeting lifestyle-conscious consumers. Government initiatives promoting nutrition awareness are also supporting market growth
- While demand is strong, continued marketing efforts, product diversification, and awareness campaigns are essential to maintain market growth and consumer trust. Companies must focus on continuous education about lactose intolerance, functional benefits, and product quality to drive repeat purchase and long-term adoption
Restraint/Challenge
High Cost of Ingredients and Limited Product Awareness in Emerging Markets
- The higher cost of lactose-free ingredients, including lactase-treated milk and plant-based alternatives, makes these products more expensive than conventional dairy, limiting affordability in price-sensitive regions. This price disparity affects purchasing decisions, particularly among middle- and lower-income consumers. Efforts to reduce production costs through technological improvements and economies of scale are critical for wider adoption
- In emerging markets, limited consumer awareness about lactose intolerance and lactose-free options restricts adoption, with many consumers continuing to purchase traditional dairy products. Cultural dietary habits and limited nutrition education further reduce the perceived need for lactose-free alternatives. Market penetration in these regions requires strong awareness campaigns, sampling programs, and retailer engagement
- Supply chain challenges, such as maintaining product stability and quality during transport and storage, further constrain market expansion, especially for perishable lactose-free products. Cold chain logistics, shelf-life limitations, and inadequate infrastructure can result in product spoilage or reduced efficacy, affecting brand reputation. Investment in robust distribution networks and advanced packaging solutions is essential
- For instance, in 2023, several African and Southeast Asian regions reported slow adoption of lactose-free milk due to higher prices and limited distribution channels. Regional startups and multinational companies are gradually addressing these gaps through local production and strategic partnerships. Consumer education and promotional campaigns remain pivotal in driving awareness and trial
- While product innovation continues, reducing costs, increasing distribution networks, and educating consumers will be crucial for widespread acceptance and long-term growth of the lactose-free products market. Companies must also focus on sustainable sourcing, eco-friendly packaging, and functional ingredient fortification to enhance product appeal and strengthen market positioning
Lactose-Free Products Market Scope
The global lactose-free products market is segmented on the basis of type, form, category, and distribution channel
- By Type
On the basis of type, the lactose-free products market is segmented into milk, yogurt, cheese, ice-cream, confectionery products, and others. The milk segment held the largest market revenue share in 2025, driven by its wide acceptance as a staple dairy alternative and increasing consumer awareness regarding lactose intolerance. Milk-based lactose-free products offer ease of use in daily diets, nutritional benefits, and versatility in various culinary applications, making them highly preferred by health-conscious consumers.
The yogurt segment is expected to witness the fastest growth rate from 2026 to 2033, fueled by rising demand for probiotic-enriched and fortified lactose-free yogurts. These products support digestive health, provide functional nutrition, and cater to growing preferences for convenient, ready-to-eat dairy alternatives.
- By Form
On the basis of form, the lactose-free products market is segmented into lactose-free products, no added sugar/reduced sugar claims, and reduced lactose products. The lactose-free products segment held the largest market revenue share in 2025, due to the rising preference for complete dairy-intolerant-friendly options that can be easily incorporated into daily diets.
The no added sugar/reduced sugar products segment is expected to witness the fastest growth rate from 2026 to 2033, driven by increasing health-consciousness among consumers and demand for low-calorie, sugar-controlled alternatives.
- By Category
On the basis of category, the lactose-free products market is segmented into organic and inorganic products. The inorganic segment held the largest market revenue share in 2025, attributed to its wide availability, affordability, and ease of production across regions.
The organic segment is expected to witness the fastest growth rate from 2026 to 2033, fueled by rising consumer preference for natural, clean-label, and sustainably produced lactose-free alternatives.
- By Distribution Channel
On the basis of distribution channel, the lactose-free products market is segmented into hypermarket/supermarket, convenience store, pharmacies/drugstore, and online. Hypermarkets and supermarkets held the largest market revenue share in 2025, driven by extensive product variety, easy accessibility, and high consumer trust in organized retail outlets.
The online segment is expected to witness the fastest growth rate from 2026 to 2033, driven by growing e-commerce adoption, home delivery convenience, and rising demand for specialty lactose-free products among tech-savvy consumers.
Lactose-Free Products Market Regional Analysis
- North America dominated the lactose-free products market with the largest revenue share of 32.45% in 2025, driven by rising awareness of lactose intolerance, increasing demand for plant-based alternatives, and health-conscious consumer trends
- Consumers in the region highly value the digestive benefits, nutritional advantages, and functional formulations offered by lactose-free products, including fortified milk, yogurts, and dairy alternatives
- This widespread adoption is further supported by high disposable incomes, strong retail penetration, and the growing preference for convenient, ready-to-consume products, establishing lactose-free options as a preferred choice for both adults and children
U.S. Lactose-Free Products Market Insight
The U.S. lactose-free products market captured the largest revenue share in 2025 within North America, fueled by the increasing prevalence of lactose intolerance and the expanding health and wellness trend. Consumers are actively seeking dairy alternatives that provide gut-friendly nutrients and functional benefits. The growing demand for fortified and plant-based lactose-free milk, yogurt, and cheese, combined with strong distribution through supermarkets, e-commerce platforms, and specialty stores, is further propelling market growth. Moreover, innovation in flavors, fortification, and convenience products is significantly contributing to expansion.
Europe Lactose-Free Products Market Insight
The Europe lactose-free products market is expected to witness the fastest growth rate from 2026 to 2033, primarily driven by rising health awareness, dietary restrictions, and regulatory support for functional foods. Increasing urbanization and disposable income levels are fostering the adoption of lactose-free dairy and alternatives. European consumers are attracted to the nutritional benefits, digestive comfort, and versatile applications offered by these products, resulting in strong growth across milk, yogurt, and dairy-free alternatives.
U.K. Lactose-Free Products Market Insight
The U.K. lactose-free products market is expected to witness the fastest growth rate from 2026 to 2033, driven by increasing health consciousness and a shift toward functional and plant-based dairy alternatives. Concerns about lactose intolerance, digestive health, and sugar intake are motivating both individuals and families to adopt lactose-free options. The U.K.’s robust retail and e-commerce infrastructure, combined with strong marketing campaigns by dairy brands, is expected to continue stimulating market expansion.
Germany Lactose-Free Products Market Insight
The Germany lactose-free products market is expected to witness the fastest growth rate from 2026 to 2033, fueled by rising awareness of lactose intolerance, functional nutrition, and dietary inclusivity. Germany’s developed retail network, emphasis on health-focused diets, and innovative product launches support the adoption of fortified milk, yogurt, and dairy alternatives. Integration of lactose-free products into mainstream retail, alongside increasing consumer interest in organic and plant-based options, is boosting market growth.
Asia-Pacific Lactose-Free Products Market Insight
The Asia-Pacific lactose-free products market is expected to witness the fastest growth rate from 2026 to 2033, driven by urbanization, rising disposable incomes, and increasing consumer awareness of digestive health. Countries such as China, Japan, and India are witnessing a surge in demand for plant-based and fortified dairy alternatives. Government initiatives promoting nutritional awareness, along with expansion of retail and e-commerce channels, are facilitating wider product availability and affordability.
Japan Lactose-Free Products Market Insight
The Japan lactose-free products market is expected to witness the fastest growth rate from 2026 to 2033 due to high health consciousness, aging population, and preference for functional nutrition. Consumers are seeking lactose-free milk, yogurt, and fortified products that support digestive comfort and overall wellness. The integration of these products with convenience-oriented offerings, such as ready-to-drink beverages and fortified yogurts, is further driving market expansion.
China Lactose-Free Products Market Insight
The China lactose-free products market accounted for the largest revenue share in Asia-Pacific in 2025, attributed to rising lactose intolerance awareness, urbanization, and increasing health-focused diets. China is emerging as a significant market for both dairy and plant-based lactose-free products, including milk, yogurt, and cheese alternatives. Expanding retail and e-commerce networks, coupled with product affordability and domestic manufacturing, are key factors propelling market growth in China.
Lactose-Free Products Market Share
The Lactose-Free Products industry is primarily led by well-established companies, including:
- The Coca-Cola Company (U.S.)
- Nestlé (Switzerland)
- Danone S.A. (France)
- Valio Ltd (Finland)
- GENERAL MILLS INC. (U.S.)
- LALA U.S., Inc. (U.S.)
- Dairy Farmers of America, Inc. (U.S.)
- SHAMROCK FARMS (U.S.)
- Lactalis American Group, Inc. (U.S.)
- Arla Foods amba (Denmark)
- Crowley Food LLC (U.S.)
- Lifeway Foods, Inc. (U.S.)
- PRAIRIE FARMS DAIRY (U.S.)
- SmithFoods Inc. (U.S.)
- Agropur cooperative (Canada)
- Agri-Mark (U.S.)
- Organic Valley (U.S.)
- McNeil Nutritionals, LLC (U.S.)
- Johnson & Johnson Services, Inc. (U.S.)
- Saputo (Canada)
SKU-

- Interactive Data Analysis Dashboard
- Company Analysis Dashboard for high growth potential opportunities
- Research Analyst Access for customization & queries
- Competitor Analysis with Interactive dashboard
- Latest News, Updates & Trend analysis
- Harness the Power of Benchmark Analysis for Comprehensive Competitor Tracking
Global Lactose Free Products Market, Supply Chain Analysis and Ecosystem Framework
To support market growth and help clients navigate the impact of geopolitical shifts, DBMR has integrated in-depth supply chain analysis into its Global Lactose Free Products Market research reports. This addition empowers clients to respond effectively to global changes affecting their industries. The supply chain analysis section includes detailed insights such as Global Lactose Free Products Market consumption and production by country, price trend analysis, the impact of tariffs and geopolitical developments, and import and export trends by country and HSN code. It also highlights major suppliers with data on production capacity and company profiles, as well as key importers and exporters. In addition to research, DBMR offers specialized supply chain consulting services backed by over a decade of experience, providing solutions like supplier discovery, supplier risk assessment, price trend analysis, impact evaluation of inflation and trade route changes, and comprehensive market trend analysis.
Data collection and base year analysis are done using data collection modules with large sample sizes. The stage includes obtaining market information or related data through various sources and strategies. It includes examining and planning all the data acquired from the past in advance. It likewise envelops the examination of information inconsistencies seen across different information sources. The market data is analysed and estimated using market statistical and coherent models. Also, market share analysis and key trend analysis are the major success factors in the market report. To know more, please request an analyst call or drop down your inquiry.
The key research methodology used by DBMR research team is data triangulation which involves data mining, analysis of the impact of data variables on the market and primary (industry expert) validation. Data models include Vendor Positioning Grid, Market Time Line Analysis, Market Overview and Guide, Company Positioning Grid, Patent Analysis, Pricing Analysis, Company Market Share Analysis, Standards of Measurement, Global versus Regional and Vendor Share Analysis. To know more about the research methodology, drop in an inquiry to speak to our industry experts.
Data Bridge Market Research is a leader in advanced formative research. We take pride in servicing our existing and new customers with data and analysis that match and suits their goal. The report can be customized to include price trend analysis of target brands understanding the market for additional countries (ask for the list of countries), clinical trial results data, literature review, refurbished market and product base analysis. Market analysis of target competitors can be analyzed from technology-based analysis to market portfolio strategies. We can add as many competitors that you require data about in the format and data style you are looking for. Our team of analysts can also provide you data in crude raw excel files pivot tables (Fact book) or can assist you in creating presentations from the data sets available in the report.


