
Global Liquid Fertilizers Market
Market Size in USD Billion
 USD
3.05 Billion
USD
4.12 Billion
2025
2033
USD
3.05 Billion
USD
4.12 Billion
2025
2033
| 2026 - 2033 | |
| USD 3.05 Billion | |
| USD 4.12 Billion | |
| % | |
|
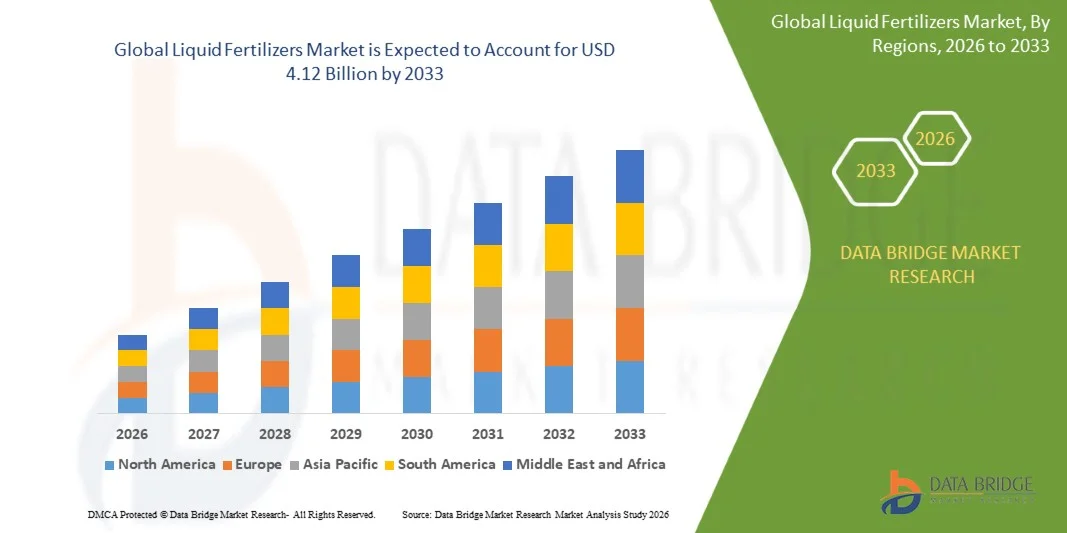
What is the Liquid Fertilizers Market Size and Growth Rate?
- As per Data Bridge Market Research analysis, the liquid fertilizers market was valued at USD 3.05 billion in 2025 and is projected to reach USD 4.12 billion by 2033, growing at a CAGR of 3.85% from 2026 to 2033.
- The market is experiencing consistent growth driven by increasing demand for high-efficiency fertilizers, adoption of precision farming practices, rising focus on sustainable agricultural solutions, and the need for improved nutrient-use efficiency to enhance crop productivity. Liquid fertilizers provide advantages such as ease of application, uniform nutrient distribution, and compatibility with fertigation and foliar application systems
- The growing global emphasis on food security, agricultural productivity, and sustainable farming practices, combined with increasing adoption of precision agriculture technologies, is encouraging farmers and agricultural organizations to shift toward liquid fertilizer solutions. The compatibility of liquid fertilizers with modern irrigation systems, including fertigation, enables precise nutrient delivery, reduces fertilizer wastage, and supports efficient crop management across cereals, fruits, vegetables, and specialty crops.
Market Size & Forecast
- Global Market Value (2025): USD 3.05 Billion
- Expected Market Value (2033): USD 4.12 Billion
- Forecast CAGR (2026–2033): 3.85%
- Leading Region in 2025: Asia Pacific
- Fastest Growing Region: North America
What are the Major Takeaways of the Liquid Fertilizers Market?
- Asia-Pacific dominated the liquid fertilizers market with the largest revenue share of 41.0% in 2025, supported by expanding agricultural activities, increasing fertilizer consumption, rising adoption of modern farming techniques, and strong demand from major agricultural economies such as China and India.
- North America is expected to be the fastest-growing region at a CAGR of 5.1% from 2026 to 2033, fueled by increasing adoption of precision agriculture, growing demand for efficient nutrient management solutions, and rising use of liquid fertilizers in large-scale farming operations across the U.S. and Canada.
- The synthetic segment led the market with a 80% share in 2025, driven by their widespread availability, high nutrient concentration, and extensive adoption across commercial agricultural operations.
- Organic are the fastest-growing category type, projected to register a CAGR of 6.5%, reflecting the surge in demand for sustainable farming practices and environmentally friendly agricultural inputs.
- The nitrogen segment dominated the type category with a 50% revenue share in 2025, led by the essential role of nitrogen in plant growth, chlorophyll formation, and crop productivity enhancement.
- Cereals & grains accounted for 35% of the market share in 2025, preferred by extensive cultivation areas and high fertilizer requirements for major crops such as wheat, rice, and corn
- The foliar segment is the fastest-growing mode of application category, with a CAGR of 5.8%, driven by the increasing demand for rapid nutrient correction and improved crop performance.
Report Scope and Liquid Fertilizers Market Segmentation
|
Attributes |
Liquid Fertilizers Key Market Insights |
|
Segments Covered |
|
|
Countries Covered |
North America
Europe
Asia-Pacific
Middle East and Africa
South America
|
|
Key Market Players |
|
|
Market Opportunities |
|
|
Value Added Data Infosets |
In addition to the insights on market scenarios such as market value, growth rate, segmentation, geographical coverage, and major players, the market reports curated by the Data Bridge Market Research also include import export analysis, production capacity overview, production consumption analysis, price trend analysis, climate change scenario, supply chain analysis, value chain analysis, raw material/consumables overview, vendor selection criteria, PESTLE Analysis, Porter Analysis, and regulatory framework. |
What is the Key Trend in the Liquid Fertilizers Market?
- Precision agriculture and fertigation practices are increasingly driving the adoption of liquid fertilizers to improve nutrient-use efficiency, enable targeted application, and enhance crop productivity through controlled nutrient management.
- For instance, in July 2025, Netafim marked its 60th year of precision irrigation innovation, highlighting its global deployment of drip irrigation and fertigation solutions across 110 countries to help farmers improve yields, optimize resource use, and reduce environmental impact.
- Advanced irrigation technologies allow farmers to apply liquid fertilizers directly to plant roots, reducing nutrient losses and supporting sustainable agricultural production.
- Farmers and agricultural enterprises are increasingly adopting specialty liquid fertilizers, including micronutrient and biological formulations, to improve soil health and address specific crop nutrient requirements.
- For instance, in June 2024, Yara International highlighted the expansion of its digital farming solutions, supporting farmers across more than 60 countries and 22.8 million hectares with data-driven crop nutrition management, precision farming tools, and improved nutrient-use efficiency.
- As agricultural producers continue prioritizing sustainable farming, resource efficiency, and higher crop yields, the adoption of liquid fertilizer solutions is expected to accelerate, reinforcing precision nutrient management as a core component of modern agriculture.
What are the Key Drivers of the Liquid Fertilizers Market?
- The rising global demand for food production and increasing emphasis on agricultural productivity have significantly increased demand for liquid fertilizers that improve nutrient availability and enhance crop yield performance.
- For instance, in November 2024, the Food and Agriculture Organization (FAO) released its Statistical Yearbook 2024, highlighting the importance of sustainable agricultural practices, improved resource management, and innovation in agrifood systems to address global food security challenges.
- Agricultural producers, fertilizer manufacturers, and governments are integrating efficient nutrient delivery systems to reduce fertilizer wastage, improve resource utilization, and support sustainable farming practices.
- For instance, in January 2025, the U.S. Department of Agriculture (USDA) highlighted precision agriculture and nutrient management practices through its Economic Research Service (ERS), emphasizing the adoption of technologies and best management practices to improve nutrient-use efficiency, reduce environmental losses, and enhance farm productivity.
- With agriculture increasingly focusing on higher productivity, sustainable inputs, and efficient fertilizer application methods, liquid fertilizers will remain essential for improving crop nutrition and supporting future food security requirements.
Which Factors are Challenging the Growth of the Next Generation Tobacco Products Market?
- Liquid fertilizers require specialized storage facilities, transportation infrastructure, and application equipment, increasing operational costs compared with conventional granular fertilizer products.
- These infrastructure requirements limit adoption among small-scale farmers and agricultural producers in developing regions where access to advanced farming systems remains limited.
- For instance, in July 2024, the International Fertilizer Association (IFA) reported that fertilizer accessibility challenges, including infrastructure limitations and affordability issues, continue affecting fertilizer adoption in several developing agricultural markets.
- The requirement for additional investment in storage tanks, fertigation systems, and application technologies creates barriers for farmers operating in cost-sensitive regions.
- For instance, in June 2023, the World Bank emphasized that improving access to agricultural finance, infrastructure, and technology is essential for enabling smallholder farmers to adopt climate-smart and productivity-enhancing agricultural solutions.
- The high infrastructure and investment requirements associated with liquid fertilizer application continue to restrict widespread adoption, particularly among small and medium-sized farms, limiting market expansion in emerging agricultural regions.
How is the Liquid Fertilizers Market Segmented?
The liquid fertilizers market is segmented on the basis of category, type, crop type, mode of application, and component.
- By Category
On the basis of category, the liquid fertilizers market is segmented into organic and synthetic. The synthetic liquid fertilizers segment dominated the market with 80% revenue share in 2025, owing to their widespread availability, high nutrient concentration, and extensive adoption across commercial agricultural operations. Synthetic formulations such as urea ammonium nitrate (UAN), potassium nitrate, and ammonium-based fertilizers provide rapid nutrient availability and predictable crop responses. These fertilizers are widely preferred for large-scale farming due to their consistent composition and compatibility with precision agriculture systems. Increasing demand for higher crop yields and efficient nutrient management is supporting their adoption globally. The segment benefits from established manufacturing infrastructure and strong distribution networks across major agricultural regions. However, increasing environmental concerns regarding chemical fertilizer usage are encouraging the development of sustainable alternatives.
The organic liquid fertilizers segment is projected to register the fastest growth with a CAGR of 6.5% during the forecast period, driven by increasing demand for sustainable farming practices and environmentally friendly agricultural inputs. Organic liquid fertilizers improve soil health by enhancing microbial activity and nutrient availability. Growing consumer preference for organic food products is encouraging farmers to adopt biological and natural fertilizer solutions. Government initiatives promoting sustainable agriculture and reduced chemical dependency are further supporting segment expansion. Increasing awareness regarding long-term soil fertility management is accelerating adoption among small and medium-scale farmers. Advancements in biofertilizer formulations and microbial-based nutrient solutions are expected to create new growth opportunities.
- By Type
On the basis of type, the liquid fertilizers market is segmented into nitrogen, potassium, phosphate, and others. The nitrogen segment dominated the market with 50% revenue share in 2025, supported by the essential role of nitrogen in plant growth, chlorophyll formation, and crop productivity enhancement. Nitrogen-based liquid fertilizers such as urea ammonium nitrate (UAN) are extensively used in cereal crops, oilseeds, and commercial farming applications. Their ability to provide rapid nitrogen availability makes them highly effective for improving crop yield and quality. Increasing global demand for food production is driving the consumption of nitrogen fertilizers across agricultural regions. Precision application technologies such as fertigation and foliar spraying are further improving nitrogen-use efficiency. However, concerns regarding nitrogen runoff and environmental impact are encouraging the adoption of advanced nitrogen management practices.
The potassium segment is expected to witness the fastest growth with a CAGR of 5.5% during the forecast period, driven by increasing awareness regarding potassium’s role in improving crop resistance, quality, and stress tolerance. Potassium liquid fertilizers enhance plant water regulation, disease resistance, and overall crop performance under changing climatic conditions. Rising adoption in fruits, vegetables, and specialty crops is supporting segment expansion. Increasing demand for high-quality agricultural products is encouraging farmers to use potassium-based nutrient solutions. The growing emphasis on balanced fertilization practices is further increasing potassium fertilizer adoption. Advancements in precision agriculture are enabling more efficient potassium application, supporting future market growth.
- By Crop Type
On the basis of crop type, the liquid fertilizers market is segmented into cereals & grains, fruits & vegetables, oilseeds & pulses, and others. The cereals & grains segment dominated the market with 35% revenue share in 2025, owing to extensive cultivation areas and high fertilizer requirements for major crops such as wheat, rice, and corn. Liquid fertilizers are widely used in cereal production to improve nutrient availability, enhance crop productivity, and support intensive farming practices. Growing global food demand and increasing efforts to improve grain production are driving fertilizer consumption in this segment. Large-scale cereal farming operations are increasingly adopting fertigation and foliar application methods for efficient nutrient delivery. Government initiatives focused on food security are further supporting fertilizer demand for cereal crops. The segment continues to benefit from rising agricultural productivity requirements worldwide.
The fruits & vegetables segment is projected to register the fastest growth with a CAGR of 6.0% during the forecast period, driven by increasing demand for high-value crops and improved quality standards in horticultural production. Liquid fertilizers are widely adopted in fruit and vegetable cultivation due to their ability to provide precise nutrient application and improve crop quality. The expansion of protected cultivation, greenhouse farming, and drip irrigation systems is accelerating adoption in this segment. Rising consumer demand for fresh and nutrient-rich produce is encouraging farmers to enhance productivity through advanced fertilization methods. Specialty liquid fertilizers are increasingly used to address crop-specific nutritional requirements. Growing investments in horticulture and export-oriented agriculture are expected to create further growth opportunities.
- By Mode of Application
On the basis of mode of application, the liquid fertilizers market is segmented into soil, foliar, fertigation, and others. The fertigation segment dominated the market with 40% revenue share in 2025, owing to increasing adoption of drip irrigation systems and precision farming technologies. Fertigation enables direct delivery of nutrients through irrigation water, improving nutrient absorption and reducing fertilizer wastage. Farmers are increasingly adopting this method due to its efficiency in water and nutrient management. The technique is widely used in high-value crops, greenhouse cultivation, and commercial agricultural operations. Growing water scarcity concerns are encouraging the adoption of efficient irrigation-based fertilizer application methods. Continuous advancements in precision agriculture technologies are further strengthening fertigation adoption globally.
The foliar application segment is expected to witness the fastest growth with a CAGR of 5.8% during the forecast period, driven by increasing demand for rapid nutrient correction and improved crop performance. Foliar fertilizers allow direct nutrient absorption through plant leaves, providing quick response during critical growth stages. This method is gaining popularity in horticultural crops, specialty crops, and high-value agricultural production. Increasing awareness regarding micronutrient deficiencies is encouraging farmers to adopt foliar nutrient solutions. Advancements in liquid fertilizer formulations are improving absorption efficiency and application effectiveness. Growing adoption of precision spraying technologies is expected to further accelerate segment growth.
- By Component
On the basis of component, the liquid fertilizers market is segmented into calcium ammonium nitrate, urea ammonium nitrate, potassium nitrate, phosphorous pentoxide, and others. The urea ammonium nitrate (UAN) segment dominated the market with 30% revenue share in 2025, due to its high nitrogen content, ease of application, and compatibility with modern farming systems. UAN is widely used in large-scale agricultural operations because it provides both immediate and sustained nitrogen availability to crops. Its liquid form enables efficient transportation, storage, and application through spraying and fertigation systems. Increasing demand for nitrogen fertilizers in cereal and grain production is supporting segment growth. Farmers prefer UAN due to its uniform nutrient distribution and operational efficiency. However, environmental concerns related to nitrogen losses are encouraging improved application management practices.
The potassium nitrate segment is projected to grow at a CAGR of 6.2% during the forecast period, driven by increasing demand for balanced crop nutrition and specialty fertilizer solutions. Potassium nitrate provides both potassium and nitrogen, supporting improved crop quality, yield enhancement, and stress tolerance. It is widely used in fruits, vegetables, and high-value crops requiring precise nutrient management. Growing adoption of greenhouse farming and controlled-environment agriculture is increasing demand for potassium nitrate formulations. Rising focus on premium crop quality and export-oriented agriculture is further supporting adoption. Technological advancements in fertigation systems are expected to create additional growth opportunities for potassium nitrate-based liquid fertilizers.
Which Region Holds the Largest Share of the Liquid Fertilizers Market?
- Asia-Pacific dominated the liquid fertilizers market with the largest revenue share of 41.0% in 2025, supported by expanding agricultural activities, increasing fertilizer consumption, rising adoption of modern farming techniques, and strong demand from major agricultural economies such as China and India.
- The region also benefits from increasing adoption of precision agriculture, government initiatives supporting agricultural productivity, and rising demand for efficient nutrient management solutions. Growing investments in irrigation infrastructure, fertigation systems, and sustainable farming practices continue to strengthen Asia-Pacific’s leadership position in the global liquid fertilizers market.
Japan Liquid Fertilizers Market Insight
The Japan liquid fertilizers market is witnessing consistent growth due to increasing adoption of precision agriculture, controlled-environment farming, and advanced crop nutrition technologies. Agricultural producers and technology providers are increasingly focusing on efficient fertilizer application methods to improve productivity while reducing environmental impact. Moreover, the country’s aging farming workforce and emphasis on smart agriculture solutions are supporting demand for automated nutrient management systems. The Japanese Ministry of Agriculture, Forestry and Fisheries (MAFF) is promoting smart agriculture technologies, including data-driven farming and efficient input management, to improve agricultural productivity.
China Liquid Fertilizers Market Insight
The China liquid fertilizers market is growing rapidly, driven by increasing agricultural modernization, rising crop productivity requirements, and government initiatives promoting fertilizer-use efficiency. Growing adoption of precision farming, fertigation systems, and balanced nutrient management practices is significantly boosting liquid fertilizer demand. In addition, China’s focus on reducing excessive fertilizer application and improving sustainable agricultural production is encouraging farmers to adopt advanced fertilizer solutions. According to China’s Ministry of Agriculture and Rural Affairs, the country continues promoting scientific fertilization practices and fertilizer-use efficiency improvements through its fertilizer reduction and efficiency enhancement initiatives.
North America Liquid Fertilizers Market Insight
The North America liquid fertilizers market remains a major contributor to global revenue, driven by advanced agricultural infrastructure, high adoption of precision farming technologies, and strong demand for efficient nutrient management solutions. The widespread use of liquid fertilizers in large-scale crop production, including cereals, oilseeds, and specialty crops, is supporting market expansion across the region. Increasing investments in sustainable agriculture, precision application systems, and digital farming technologies continue to enhance liquid fertilizer adoption throughout North America. According to the International Fertilizer Association (IFA), North America remains one of the significant fertilizer-consuming regions, with increasing focus on nutrient-use efficiency and sustainable fertilizer management.
U.S. Liquid Fertilizers Market Insight
The U.S. liquid fertilizers market is witnessing steady growth due to increasing adoption of precision agriculture, rising demand for efficient nutrient management solutions, and expanding use of advanced fertilizer application technologies. The country’s large-scale agricultural operations, strong farming infrastructure, and increasing focus on improving fertilizer-use efficiency are driving demand for liquid fertilizer solutions across corn, soybean, and specialty crop production. In addition, growing adoption of fertigation and sustainable nutrient management practices is accelerating liquid fertilizer usage among farmers. According to the U.S. Department of Agriculture (USDA), precision agriculture technologies and nutrient management practices are increasingly being adopted to improve input efficiency and farm productivity.
U.K. Liquid Fertilizers Market Insight
The U.K. liquid fertilizers market is experiencing steady growth, supported by increasing adoption of precision farming practices, sustainable agriculture initiatives, and demand for efficient crop nutrition solutions. Farmers are increasingly using liquid fertilizer systems due to their ability to provide accurate nutrient application and reduce input losses. Furthermore, government-supported sustainable farming programs and environmental regulations are encouraging improved nutrient management practices across agricultural operations. The U.K. Agriculture Act and Environmental Land Management schemes emphasize sustainable farming practices, including improved resource efficiency and environmental protection.
Which are the Top Companies in Liquid Fertilizers Market?
The liquid fertilizers industry is primarily led by well-established companies, including:
- Nutrien Ltd. (Canada)
- Yara International ASA (Norway)
- The Mosaic Company (U.S.)
- CF Industries Holdings, Inc. (U.S.)
- ICL Group Ltd. (Israel)
- K+S Aktiengesellschaft (Germany)
- EuroChem Group (Switzerland)
- OCP S.A. (Morocco)
- OCI Global (Netherlands)
- Coromandel International Ltd (India)
- Indian Farmers Fertiliser Cooperative Limited (IFFCO) (India)
- Haifa Negev technologies LTD (Israel)
- SQM (Chile)
- Compass Minerals (U.S.)
- Tessenderlo Group (Belgium)
- DFPCL (India)
- Zuari Agro Chemicals LTD (India)
- Gujarat State Fertilizers & Chemicals Limited (India)
What are Latest Developments in Liquid Fertilizers Market?
- In January 2025, ICL Growing Solutions announced the expansion of its liquid fertilizer portfolio with the introduction of advanced water-soluble fertilizer solutions designed for efficient crop nutrition through fertigation and foliar applications. The company’s liquid formulations, including specialty nutrient products, are aimed at improving nutrient-use efficiency, supporting precision agriculture practices, and helping growers achieve higher productivity with optimized fertilizer application. This development highlights the increasing industry focus on liquid nutrient solutions that provide flexibility, efficiency, and sustainable crop management
- In September 2023, the Indian Council of Agricultural Research (ICAR) and Bayer signed a Memorandum of Understanding to develop resource-efficient and climate-resilient agricultural solutions, including precision agriculture practices and improved agri-input management. The collaboration focused on supporting farmers through technology transfer, agronomic advisory services, and sustainable farming approaches. This partnership reflects the increasing integration of advanced agricultural technologies and efficient nutrient management solutions to improve productivity and sustainability
- In July 2023, the Indian Council of Agricultural Research (ICAR) announced the development of advanced liquid bio-fertilizer technologies, including improved microbial formulations with higher shelf life and crop-specific biofertilizer strains. These liquid biofertilizer technologies were developed to provide environmentally friendly alternatives to conventional fertilizers by improving nutrient availability and supporting soil health. The development reflects the growing shift toward biological liquid fertilizers and sustainable agricultural inputs.
- In April 2023, Indian Farmers Fertiliser Cooperative Limited (IFFCO) launched the world’s first Nano DAP Liquid Fertiliser, designed to provide an efficient source of nitrogen and phosphorus while improving crop productivity and reducing dependence on conventional granular fertilizers. The product was developed as part of India’s initiative toward advanced fertilizer technologies and sustainable agriculture practices. IFFCO stated that Nano DAP Liquid can reduce logistics and storage costs while supporting improved nutrient delivery through foliar application. This launch represents a significant advancement in liquid fertilizer innovation and precision nutrient management.
- In January 2023, OCP Group and India entered a strategic partnership to strengthen food security and promote innovative and sustainable agriculture solutions. The collaboration focused on research and development initiatives, innovative fertilizer solutions, and customized nutrient products to meet farmers’ requirements. This partnership supports the development of advanced fertilizer technologies and reinforces the industry’s transition toward efficient and sustainable crop nutrition solutions.
SKU-

- Interactive Data Analysis Dashboard
- Company Analysis Dashboard for high growth potential opportunities
- Research Analyst Access for customization & queries
- Competitor Analysis with Interactive dashboard
- Latest News, Updates & Trend analysis
- Harness the Power of Benchmark Analysis for Comprehensive Competitor Tracking
Data collection and base year analysis are done using data collection modules with large sample sizes. The stage includes obtaining market information or related data through various sources and strategies. It includes examining and planning all the data acquired from the past in advance. It likewise envelops the examination of information inconsistencies seen across different information sources. The market data is analysed and estimated using market statistical and coherent models. Also, market share analysis and key trend analysis are the major success factors in the market report. To know more, please request an analyst call or drop down your inquiry.
The key research methodology used by DBMR research team is data triangulation which involves data mining, analysis of the impact of data variables on the market and primary (industry expert) validation. Data models include Vendor Positioning Grid, Market Time Line Analysis, Market Overview and Guide, Company Positioning Grid, Patent Analysis, Pricing Analysis, Company Market Share Analysis, Standards of Measurement, Global versus Regional and Vendor Share Analysis. To know more about the research methodology, drop in an inquiry to speak to our industry experts.
Data Bridge Market Research is a leader in advanced formative research. We take pride in servicing our existing and new customers with data and analysis that match and suits their goal. The report can be customized to include price trend analysis of target brands understanding the market for additional countries (ask for the list of countries), clinical trial results data, literature review, refurbished market and product base analysis. Market analysis of target competitors can be analyzed from technology-based analysis to market portfolio strategies. We can add as many competitors that you require data about in the format and data style you are looking for. Our team of analysts can also provide you data in crude raw excel files pivot tables (Fact book) or can assist you in creating presentations from the data sets available in the report.


