
Global Liquid Particle Counters Market
Market Size in USD Million
 USD
140.23 Million
USD
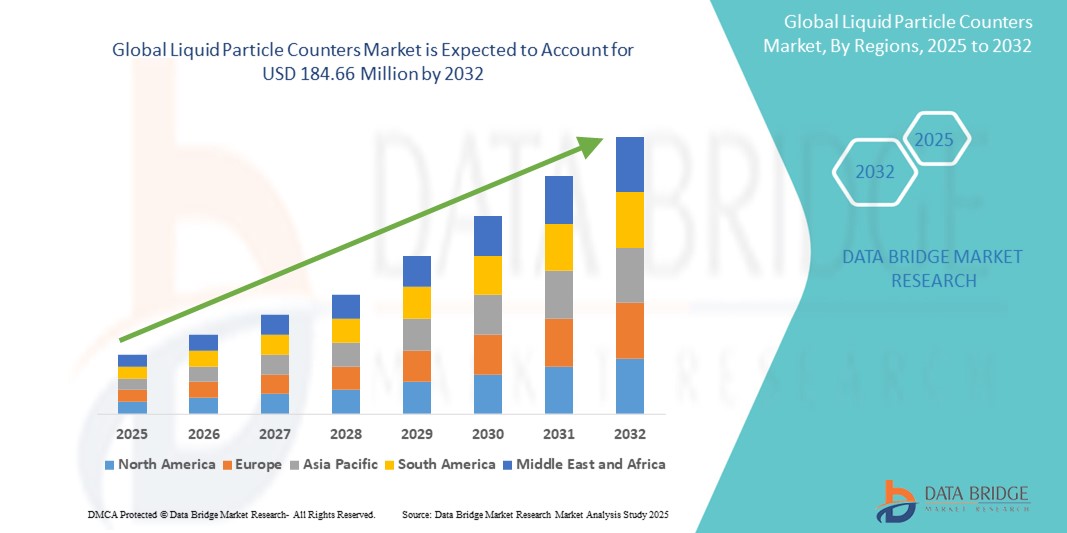
184.66 Million
2024
2032
USD
140.23 Million
USD
184.66 Million
2024
2032
| 2025 - 2032 | |
| USD 140.23 Million | |
| USD 184.66 Million | |
| % | |
|
Liquid Particle Counters Market Size
- The global liquid particle counters market size was valued at USD 140.23 million in 2024 and is expected to reach USD 184.66 million by 2032, at a CAGR of 3.50% during the forecast period
- The market growth is largely driven by stringent regulatory requirements in pharmaceutical and semiconductor industries, which necessitate high-precision contamination monitoring and cleanroom validations, thus elevating demand for liquid particle counting technologies
- Furthermore, increasing investments in biotechnology and nanotechnology research, coupled with the growing need for real-time, accurate, and automated contamination detection systems, are positioning liquid particle counters as critical instruments across several high-purity applications
Liquid Particle Counters Market Analysis
- Liquid particle counters, essential instruments for detecting and quantifying particulate contamination in liquids, are gaining increasing importance across pharmaceutical, semiconductor, and industrial sectors due to their precision in ensuring product and process integrity
- The rising demand for liquid particle counters is primarily driven by stringent regulatory standards for contamination control, increasing production of injectable drugs, and the need for ultrapure water in advanced manufacturing processes
- North America dominated the liquid particle counters market with the largest revenue share of 42.2% in 2024, attributed to well-established pharmaceutical manufacturing infrastructure, growing R&D activities, and strict regulatory enforcement by bodies such as the FDA and USP
- Asia-Pacific is expected to be the fastest growing region in the liquid particle counters market during the forecast period, supported by expanding pharmaceutical production, rising investments in microelectronics, and increasing adoption of cleanroom technologies
- The online particle counters segment led the market with a share of 58.5% in 2024, owing to its ability to deliver continuous, real-time contamination monitoring, thereby enhancing process efficiency and compliance in critical applications
Report Scope and Liquid Particle Counters Market Segmentation
|
Attributes |
Liquid Particle Counters Key Market Insights |
|
Segments Covered |
|
|
Countries Covered |
North America
Europe
Asia-Pacific
Middle East and Africa
South America
|
|
Key Market Players |
|
|
Market Opportunities |
|
|
Value Added Data Infosets |
In addition to the insights on market scenarios such as market value, growth rate, segmentation, geographical coverage, and major players, the market reports curated by the Data Bridge Market Research also include in-depth expert analysis, pricing analysis, brand share analysis, consumer survey, demography analysis, supply chain analysis, value chain analysis, raw material/consumables overview, vendor selection criteria, PESTLE Analysis, Porter Analysis, and regulatory framework. |
Liquid Particle Counters Market Trends
“Automation and Real-Time Monitoring for Regulatory Compliance”
- A significant and accelerating trend in the global liquid particle counters market is the increasing adoption of real-time monitoring and automation technologies to support compliance with stringent regulatory standards in pharmaceuticals, biotechnology, and semiconductor manufacturing
- For instance, Particle Measuring Systems offers online liquid particle counters designed for continuous monitoring in aseptic processing, ensuring timely detection of contamination events. Similarly, Beckman Coulter's HIAC systems provide automated sampling and integration with quality control systems, reducing manual errors and improving compliance efficiency
- The integration of smart sensors, cloud-based data logging, and MES (Manufacturing Execution Systems) connectivity enables facilities to maintain uninterrupted particle monitoring, support regulatory audits, and respond rapidly to process deviations. Some advanced systems can even trigger automatic alerts when particle thresholds are exceeded, helping mitigate contamination risks proactively
- Real-time monitoring not only enhances process validation but also contributes to reduced downtime, increased product yields, and better control over manufacturing environments. This is especially critical in sectors requiring ultrapure fluids, such as microelectronics and precision optics
- The demand for automated, intelligent particle counters that offer seamless integration with existing facility control systems is growing across industries seeking to modernize their quality assurance processes. Consequently, companies are focusing on offering compact, connected, and compliance-ready particle counters for various liquid applications
- The trend toward fully integrated contamination monitoring systems is reshaping expectations around product quality and operational efficiency, thereby driving innovation and accelerating adoption of advanced liquid particle counting technologies
Liquid Particle Counters Market Dynamics
Driver
“Stringent Industry Regulations and Growing Focus on Product Purity”
- The rising implementation of strict quality and safety regulations across pharmaceutical, biotechnology, and semiconductor sectors is a major driver for the increasing adoption of liquid particle counters
- For instance, regulatory frameworks such as USP <788>, EU GMP Annex 1, and ISO 21501 require precise monitoring and documentation of particulate contamination in injectable drugs and cleanroom environments. This compels manufacturers to deploy reliable and validated particle counting technologies
- The growing production of sterile pharmaceuticals, biologics, and vaccines globally has heightened the demand for contamination-free manufacturing environments, making liquid particle counters indispensable to maintaining compliance and ensuring product safety
- Moreover, the demand for ultrapure water and chemicals in electronics manufacturing—especially in semiconductor fabs—further reinforces the need for high-sensitivity particle detection systems that can operate continuously and accurately
- As regulatory bodies tighten quality assurance requirements and manufacturers seek to avoid product recalls and production losses, the adoption of advanced, automated particle counters continues to grow across regions and sectors
Restraint/Challenge
“High Initial Costs and Technical Complexity in System Integration”
- One of the key challenges restraining the widespread adoption of liquid particle counters is the high upfront cost associated with acquiring and integrating advanced monitoring systems, particularly for small- and mid-sized enterprises
- For instance, automated inline liquid particle counters with real-time data capabilities and GMP compliance features require significant capital investment and often necessitate additional infrastructure or customization for integration into existing production lines
- Technical complexity related to calibration, data interpretation, and ongoing maintenance also presents hurdles for facilities lacking specialized personnel or digital infrastructure
- Furthermore, interoperability issues with legacy systems and the need for compliance with evolving global standards can result in additional resource commitments, leading some companies to delay or limit adoption
- To address these barriers, manufacturers are developing more affordable and user-friendly models, offering training and support services, and promoting scalable solutions that can be gradually integrated into quality control systems—steps that will be critical for expanding market access and adoption across diverse industries
Liquid Particle Counters Market Scope
The market is segmented on the basis of type, technology, liquid type, components, technique, modality, application, and end-user.
- By Type
On the basis of type, the liquid particle counters market is segmented into airborne particle counters, liquid particle counters, and others. The liquid particle counters segment held the largest revenue share in 2024, driven by the rising demand for contamination monitoring in injectable drug manufacturing and ultrapure water systems. These devices are widely used in pharmaceutical, semiconductor, and chemical industries to ensure compliance with stringent purity standards.
The airborne particle counters segment is expected to witness the fastest CAGR from 2025 to 2032, due to their complementary role in cleanroom validations where both air and liquid contamination monitoring is critical. Their adoption is supported by increasing investments in cleanroom infrastructure and quality assurance practices.
- By Technology
On the basis of technology, the liquid particle counters market is segmented into online particle counters and offline particle counters. The online particle counters segment dominated the market of 58.5% in 2024, as they offer continuous, real-time data essential for high-throughput environments such as sterile manufacturing and semiconductor production. Their ability to reduce manual intervention and facilitate automated alerts has made them the preferred choice in regulated environments.
The offline particle counters segment is expected to witness fastest growth during forecast period, particularly in laboratories and facilities that require periodic or batch sampling. These devices are valued for their flexibility, ease of use, and lower cost, making them suitable for small- and mid-sized enterprises.
- By Liquid Type
On the basis of liquid type, the liquid particle counters market is divided into water and aqueous fluids, and oil and hydraulic fluids. The water and aqueous fluids segment held the largest share in 2024, fueled by widespread usage in pharmaceutical, biomedical, and drinking water quality monitoring applications. These systems help detect particulate contamination in process water, purified water (PW), and water for injection (WFI).
The oil and hydraulic fluids segment is expected to witness the fastest CAGR from 2025 to 2032, particularly in automotive, aerospace, and industrial sectors, where hydraulic systems require ongoing monitoring to prevent system failures due to particulate contamination.
- By Components
On the basis of components, the liquid particle counters market is segmented into device, software, and services. The device segment held the majority share in 2024 due to the core role of physical instrumentation in contamination detection. Technological innovations in compact design and sensitivity enhancement have supported segment growth.
The software segment is expected to grow at the fastest CAGR during the forecast period, driven by the rising adoption of data analytics, cloud connectivity, and regulatory reporting tools.
- By Technique
On the basis of technique, the liquid particle counters market is segmented into light obscuration and light scattering. The light obscuration technique led the market in 2024 due to its strong alignment with regulatory standards such as USP <788> and ISO 21501 for parenteral drug product testing. It offers high sensitivity and accuracy for particles in transparent liquids.
The light scattering segment is expected to fastest growth during forecast period, particularly in cases where fluid opacity or composition interferes with obscuration-based measurements. This technique is also favored in applications requiring submicron particle detection
- By Modality
On the basis of modality, the liquid particle counters market is segmented into table top devices and portable devices based on modality. The table top devices segment dominated the market in 2024, widely used in centralized laboratories and fixed monitoring stations for routine particle analysis. Their robustness and ability to support complex workflows contribute to their dominance.
The portable devices segment is anticipated to grow at the highest rate during forecast period, driven by the increasing demand for on-site, flexible contamination monitoring in field environments, hospitals, and production facilities with mobile testing needs.
- By Application
On the basis of application, the liquid particle counters market includes cleanroom monitoring, drinking water contamination monitoring, aerosol monitoring and research, indoor air quality monitoring, contamination monitoring of liquids, and chemical contamination monitoring. Contamination monitoring of liquids accounted for the largest share in 2024, owing to its central role in pharmaceutical and semiconductor production environments.
Cleanroom monitoring and drinking water contamination monitoring are expected witness fastest growth during forecast period, fueled by public health concerns and expanding industrial production in sterile environments.
- By End User
On the basis of end user, the liquid particle counters market is segmented into life sciences and medical device industry, semiconductor industry, automotive industry, aerospace industry, food and beverage industry, and others. The life sciences and medical device industry led the market in 2024, supported by strict regulatory requirements for injectable drugs, biologics, and sterile medical devices.
The semiconductor industry is projected to witness the fastest growth during forecast period, due to the need for particle-free liquids in wafer cleaning, etching, and lithography processes. The food and beverage and aerospace sectors are also emerging as important end users, driven by increasing emphasis on product safety and operational reliability.
Liquid Particle Counters Market Regional Analysis
- North America dominated the liquid particle counters market with the largest revenue share of 42.2% in 2024, attributed to well-established pharmaceutical manufacturing infrastructure, growing R&D activities, and strict regulatory enforcement by bodies such as the FDA and USP
- The region's leadership is supported by the presence of leading pharmaceutical and biotechnology companies, robust cleanroom standards, and increasing investments in precision manufacturing across industries such as semiconductors and life sciences
- In addition, the high demand for automated and real-time particle counting solutions is fueled by regulatory mandates from bodies such as the FDA and USP, as well as a growing focus on ensuring product purity and reducing contamination risks, solidifying North America's position as a key market for liquid particle counters across various critical applications
U.S. Liquid Particle Counters Market Insight
The U.S. liquid particle counters market captured the largest revenue share within North America in 2024, driven by stringent regulatory frameworks such as USP <788> and FDA CGMP standards. The country’s strong pharmaceutical and biotechnology sectors heavily rely on particle counters to maintain compliance in sterile drug manufacturing. In addition, the robust semiconductor industry in the U.S., which requires ultrapure process fluids, supports significant demand for high-precision liquid particle counters. The integration of automated, real-time monitoring solutions is becoming standard practice, reinforcing the U.S. as a global leader in contamination control technologies.
Europe Liquid Particle Counters Market Insight
The Europe liquid particle counters market is expected to grow at a steady CAGR over the forecast period, primarily supported by strict EU regulations on pharmaceutical and cleanroom environments. Countries across the region are investing in upgrading healthcare manufacturing infrastructure, further fueling demand for contamination monitoring. In addition, the rise in biologics production, coupled with clean water quality initiatives, is accelerating the adoption of liquid particle counters in both industrial and environmental monitoring applications.
U.K. Liquid Particle Counters Market Insight
The U.K. liquid particle counters market is anticipated to experience notable growth over the forecast period, fueled by the country’s robust pharmaceutical R&D and increasing emphasis on drug safety and compliance. Rising investment in biomanufacturing and the establishment of advanced cleanroom facilities are key contributors to market expansion. Furthermore, initiatives to modernize healthcare infrastructure and ensure adherence to MHRA and EU quality standards are encouraging broader adoption of liquid particle monitoring solutions.
Germany Liquid Particle Counters Market Insight
The Germany liquid particle counters market is expected to grow at a considerable CAGR during the forecast period, supported by the country’s advanced pharmaceutical and chemical manufacturing sectors. Germany’s strong engineering capabilities, combined with a commitment to quality assurance, drive demand for highly accurate particle counters. The integration of digital monitoring systems and automation aligns with the nation’s Industry 4.0 initiatives, further enhancing market growth in both industrial and scientific applications.
Asia-Pacific Liquid Particle Counters Market Insight
The Asia-Pacific liquid particle counters market is projected to grow at the fastest CAGR from 2025 to 2032, led by increasing pharmaceutical production, rapid industrialization, and expanding semiconductor manufacturing in countries such as China, Japan, and India. Supportive government regulations and investments in cleanroom technologies are enhancing adoption. Furthermore, the region is becoming a manufacturing base for particle counter components, improving affordability and accessibility for end users across industries.
Japan Liquid Particle Counters Market Insight
The Japan liquid particle counters market is gaining traction due to the country’s strong presence in advanced technology manufacturing, particularly in semiconductors and precision optics. With a focus on quality control and contamination prevention, Japanese companies are increasingly implementing real-time particle monitoring in cleanroom and fluid processing environments. The integration of AI and IoT technologies in particle counters is further aligned with Japan’s emphasis on automation and smart factory infrastructure.
India Liquid Particle Counters Market Insight
The India liquid particle counters market is expanding rapidly, accounting for a significant share of the Asia-Pacific market in 2024. Growth is driven by increasing pharmaceutical exports, the development of local manufacturing facilities, and the implementation of WHO-GMP standards. India's rising focus on water purity, life sciences research, and cleanroom validation is fueling demand for cost-effective yet reliable particle counters. Government-led initiatives such as “Make in India” and “Smart Cities” are also boosting adoption across industrial and municipal applications.
Liquid Particle Counters Market Share
The liquid particle counters industry is primarily led by well-established companies, including:
- Particle Measuring Systems (U.S.)
- Beckman Coulter, Inc. (U.S.)
- Lighthouse Worldwide Solutions (U.S.)
- TSI (U.S.)
- Climet Instruments Company (U.S.)
- Met One Instruments Inc. (U.S.)
- Particles Plus, Inc. (U.S.)
- Setra Systems (U.S.)
- PAMAS Partikelmess- und Analysesysteme GmbH (Germany)
- Chemtrac LLC (U.S.)
- HAL Technology (U.S.)
- Kanomax USA, Inc. (U.S.)
- Veltek Associates, Inc. (U.S.)
- PCE Deutschland GmbH (Germany)
- GRAYWOLF SENSING SOLUTIONS, LLC. (U.S.)
- Palas GmbH (Germany)
- RION Co., Ltd. (Japan)
What are the Recent Developments in Global Liquid Particle Counters Market?
- In April 2024, Particle Measuring Systems introduced an upgraded version of its Liquilaz Particle Counter series, featuring enhanced data integration capabilities and compliance with the latest global regulatory standards. This development aims to address the evolving needs of pharmaceutical and semiconductor manufacturers for real-time, accurate contamination monitoring. By providing improved analytics and expanded compatibility with cleanroom data systems, the new Liquilaz models strengthen the company's position as a trusted provider of high-performance liquid particle counters in critical environments
- In March 2024, Beckman Coulter Life Sciences announced the release of the HIAC 8011+ system, designed for high-precision liquid particle counting in industrial fluids such as hydraulic oils and fuels. The system offers improved ease-of-use, automated calibration, and enhanced compliance with ISO 11171 and ASTM D7647 standards. This innovation supports quality control operations in aerospace, automotive, and energy sectors, reflecting Beckman Coulter’s ongoing commitment to technical excellence and regulatory alignment
- In February 2024, RION Co., Ltd. launched a next-generation liquid particle counter with advanced light scattering technology, targeting pharmaceutical injectable applications. The system enables submicron particle detection and integrates seamlessly with laboratory information management systems (LIMS). This development showcases RION’s strategic focus on supporting biopharmaceutical manufacturing with high-sensitivity tools that meet stringent GMP guidelines
- In January 2024, Met One Instruments Inc., a leader in air and liquid particle monitoring solutions, partnered with a leading contract manufacturing organization (CMO) to deploy real-time inline liquid particle counters across several sterile manufacturing lines. This collaboration aims to improve contamination control and accelerate quality assurance processes, reinforcing the role of integrated particle monitoring in ensuring product safety and regulatory compliance
- In December 2023, Climet Instruments Company, a division of Venturedyne Ltd., introduced a modular liquid particle counter with a compact footprint and flexible installation options, catering to growing demand from cleanroom equipment manufacturers. The system is optimized for seamless integration into pharmaceutical water systems and benchtop test stations, underscoring Climet’s responsiveness to evolving market requirements for portable and configurable contamination monitoring tools
SKU-

- Interactive Data Analysis Dashboard
- Company Analysis Dashboard for high growth potential opportunities
- Research Analyst Access for customization & queries
- Competitor Analysis with Interactive dashboard
- Latest News, Updates & Trend analysis
- Harness the Power of Benchmark Analysis for Comprehensive Competitor Tracking
Table of Content
1 INTRODUCTION
1.1 OBJECTIVES OF THE STUDY
1.2 MARKET DEFINITION
1.3 OVERVIEW OF GLOBAL LIQUID PARTICLE COUNTERS MARKET
1.4 CURRENCY AND PRICING
1.5 LIMITATION
1.6 MARKETS COVERED
2 MARKET SEGMENTATION
2.1 KEY TAKEAWAYS
2.2 ARRIVING AT THE GLOBAL LIQUID PARTICLE COUNTERS MARKET SIZE
2.2.1 VENDOR POSITIONING GRID
2.2.2 TECHNOLOGY LIFE LINE CURVE
2.2.3 TRIPOD DATA VALIDATION MODEL
2.2.4 MARKET GUIDE
2.2.5 MULTIVARIATE MODELLING
2.2.6 TOP TO BOTTOM ANALYSIS
2.2.7 CHALLENGE MATRIX
2.2.8 APPLICATION COVERAGE GRID
2.2.9 STANDARDS OF MEASUREMENT
2.2.10 VENDOR SHARE ANALYSIS
2.2.11 DATA POINTS FROM KEY PRIMARY INTERVIEWS
2.2.12 DATA POINTS FROM KEY SECONDARY DATABASES
2.3 GLOBAL LIQUID PARTICLE COUNTERS MARKET: RESEARCH SNAPSHOT
2.4 ASSUMPTIONS
3 MARKET OVERVIEW
3.1 DRIVERS
3.2 RESTRAINTS
3.3 OPPORTUNITIES
3.4 CHALLENGES
4 EXECUTIVE SUMMARY
5 PREMIUM INSIGHTS
5.1 PESTEL ANALYSIS
5.2 PORTER’S FIVE FORCES MODEL
6 INDUSTRY INSIGHTS
6.1 MICRO AND MACRO ECONOMIC FACTORS
6.2 PENETRATION AND GROWTH PROSPECT MAPPING
6.3 KEY PRICING STRATEGIES
6.4 INTERVIEWS WITH SPECIALIST
6.5 ANALYIS AND RECOMMENDATION
7 INTELLECTUAL PROPERTY (IP) PORTFOLIO
7.1 PATENT QUALITY AND STRENGTH
7.2 PATENT FAMILIES
7.3 LICENSING AND COLLABORATIONS
7.4 COMPETITIVE LANDSCAPE
7.5 IP STRATEGY AND MANAGEMENT
7.6 OTHER
8 COST ANALYSIS BREAKDOWN
9 TECHNONLOGY ROADMAP
10 INNOVATION TRACKER AND STRATEGIC ANALYSIS
10.1 MAJOR DEALS AND STRATEGIC ALLIANCES ANALYSIS
10.1.1 JOINT VENTURES
10.1.2 MERGERS AND ACQUISITIONS
10.1.3 LICENSING AND PARTNERSHIP
10.1.4 TECHNOLOGY COLLABORATIONS
10.1.5 STRATEGIC DIVESTMENTS
10.2 NUMBER OF PRODUCTS IN DEVELOPMENT
10.3 STAGE OF DEVELOPMENT
10.4 TIMELINES AND MILESTONES
10.5 INNOVATION STRATEGIES AND METHODOLOGIES
10.6 RISK ASSESSMENT AND MITIGATION
10.7 FUTURE OUTLOOK
11 REGULATORY COMPLIANCE
11.1 REGULATORY AUTHORITIES
11.2 REGULATORY CLASSIFICATIONS
11.2.1 CLASS I
11.2.2 CLASS II
11.2.3 CLASS III
11.3 REGULATORY SUBMISSIONS
11.4 INTERNATIONAL HARMONIZATION
11.5 COMPLIANCE AND QUALITY MANAGEMENT SYSTEMS
11.6 REGULATORY CHALLENGES AND STRATEGIES
12 REIMBURSEMENT FRAMEWORK
13 OPPUTUNITY MAP ANALYSIS
14 VALUE CHAIN ANALYSIS
15 HEALTHCARE ECONOMY
15.1 HEALTHCARE EXPENDITURE
15.2 CAPITAL EXPENDITURE
15.3 CAPEX TRENDS
15.4 CAPEX ALLOCATION
15.5 FUNDING SOURCES
15.6 INDUSTRY BENCHMARKS
15.7 GDP RATION IN OVERALL GDP
15.8 HEALTHCARE SYSTEM STRUCTURE
15.9 GOVERNMENT POLICIES
15.1 ECONOMIC DEVELOPMENT
16 GLOBAL LIQUID PARTICLE COUNTERS MARKET, BY TYPE
16.1 OVERVIEW
16.2 AIRBORNE PARTICLE COUNTERS
16.3 LIQUID PARTICLE COUNTERS
16.3.1 WATER AND AQUEOUS FLUIDS
16.3.2 OIL AND HYDRAULIC FLUIDS
16.3.3 OTHERS
16.4 OTHERS
17 GLOBAL LIQUID PARTICLE COUNTERS MARKET, BY PRODUCT
17.1 OVERVIEW
17.2 DEVICE
17.2.1 BY TYPE
17.2.1.1. ONLINE COUNTER
17.2.1.2. OFFLINE COUNTER
17.2.2 BY COMPONENT
17.2.2.1. SENSOR
17.2.2.2. ANALYZER
17.2.2.3. SOFTWARE CONTROLLER
17.2.3 BY MOADLITY
17.2.3.1. FIXED
17.2.3.2. PORTABLE
17.2.4 DETECTION CHANNELS
17.2.4.1. 2 CHANNELS
17.2.4.2. 4 CHANNELS
17.2.4.3. 8 CHANNELS
17.2.4.4. OTHERS
17.2.5 BY PARTICLE SIZE
17.2.5.1. SUB MICRON
17.2.5.2. MICRON
17.2.5.3. OTHERS
17.2.6 OTHERS
17.3 SOFTWARE
17.3.1 INTEGRATED
17.3.2 STANDALONE
17.4 SERVICES
18 GLOBAL LIQUID PARTICLE COUNTERS MARKET, BY MODALITY
18.1 OVERVIEW
18.2 FIXED
18.3 PORTABLE
19 GLOBAL LIQUID PARTICLE COUNTERS MARKET, BY TECHNOLOGY
19.1 OVERVIEW
19.2 OPTICAL DETECTION TECHNOLOGY
19.3 LASER-BASED TECHNOLOGY
19.4 ELECTROSTATIC DETECTION TECHNOLOGY
19.5 OTHERS
20 GLOBAL LIQUID PARTICLE COUNTERS MARKET, BY PRICE RANGE
20.1 OVERVIEW
20.2 STANDARD
20.3 PREMIUM
21 GLOBAL LIQUID PARTICLE COUNTERS MARKET, BY APPLICATION
21.1 OVERVIEW
21.2 CLEANROOM MONITORING
21.2.1 DEVICES
21.2.2 SOFTWARE
21.2.3 SERVICES
21.3 INDOOR AIR QUALITY MONITORING
21.3.1 DEVICES
21.3.2 SOFTWARE
21.3.3 SERVICES
21.4 AEROSOL MONITORING AND RESEARCH
21.4.1 DEVICES
21.4.2 SOFTWARE
21.4.3 SERVICES
21.5 CHEMICAL CONTAMINATION MONITORING
21.5.1 DEVICES
21.5.2 SOFTWARE
21.5.3 SERVICES
21.6 CONTAMINATION MONITORING OF LIQUIDS
21.6.1 DEVICES
21.6.2 SOFTWARE
21.6.3 SERVICES
21.7 DRINKING WATER CONTAMINATION MONITORING
21.7.1 DEVICES
21.7.2 SOFTWARE
21.7.3 SERVICES
22 GLOBAL LIQUID PARTICLE COUNTERS MARKET, BY END USER
22.1 OVERVIEW
22.2 LIFE SCIENCES AND MEDICAL DEVICE INDUSTRY
22.3 SEMICONDUCTOR INDUSTRY
22.4 AUTOMOTIVE INDUSTRY
22.5 AEROSPACE INDUSTRY
22.6 FOOD AND BEVERAGE INDUSTRY
22.7 ENVIRONMENTAL MONITORING
22.8 OTHERS
23 GLOBAL LIQUID PARTICLE COUNTERS MARKET, BY DISTRIBUTION CHANNEL
23.1 OVERVIEW
23.2 DIRECT SALES
23.3 RETAIL SALES
23.3.1 ONLINE SALES
23.3.2 OFFLINE SALES
23.4 OTHERS
24 GLOBAL LIQUID PARTICLE COUNTERS MARKET, BY GEOGRAPHY
GLOBAL LIQUID PARTICLE COUNTERS MARKET, (ALL SEGMENTATION PROVIDED ABOVE IS REPRESENTED IN THIS CHAPTER BY REGION)
24.1 NORTH AMERICA
24.1.1 U.S.
24.1.2 CANADA
24.1.3 MEXICO
24.2 EUROPE
24.2.1 GERMANY
24.2.2 FRANCE
24.2.3 U.K.
24.2.4 ITALY
24.2.5 SPAIN
24.2.6 RUSSIA
24.2.7 TURKEY
24.2.8 BELGIUM
24.2.9 NETHERLANDS
24.2.10 SWITZERLAND
24.2.11 REST OF EUROPE
24.3 ASIA-PACIFIC
24.3.1 JAPAN
24.3.2 CHINA
24.3.3 SOUTH KOREA
24.3.4 INDIA
24.3.5 AUSTRALIA
24.3.6 SINGAPORE
24.3.7 THAILAND
24.3.8 MALAYSIA
24.3.9 INDONESIA
24.3.10 PHILIPPINES
24.3.11 REST OF ASIA-PACIFIC
24.4 SOUTH AMERICA
24.4.1 BRAZIL
24.4.2 ARGENTINA
24.4.3 REST OF SOUTH AMERICA
24.5 MIDDLE EAST AND AFRICA
24.5.1 SOUTH AFRICA
24.5.2 SAUDI ARABIA
24.5.3 UAE
24.5.4 EGYPT
24.5.5 ISRAEL
24.5.6 REST OF MIDDLE EAST AND AFRICA
24.6 KEY PRIMARY INSIGHTS: BY MAJOR COUNTRIES
25 GLOBAL LIQUID PARTICLE COUNTERS MARKET, COMPANY LANDSCAPE
25.1 COMPANY SHARE ANALYSIS: GLOBAL
25.2 COMPANY SHARE ANALYSIS: NORTH AMERICA
25.3 COMPANY SHARE ANALYSIS: EUROPE
25.4 COMPANY SHARE ANALYSIS: ASIA-PACIFIC
25.5 MERGERS & ACQUISITIONS
25.6 NEW PRODUCT DEVELOPMENT & APPROVALS
25.7 EXPANSIONS
25.8 REGULATORY CHANGES
25.9 PARTNERSHIP AND OTHER STRATEGIC DEVELOPMENTS
26 GLOBAL LIQUID PARTICLE COUNTERS MARKET, SWOT AND DBMR ANALYSIS
27 GLOBAL LIQUID PARTICLE COUNTERS MARKET, COMPANY PROFILE
27.1 DH LIFE SCIENCES, LLC.
27.1.1 COMPANY OVERVIEW
27.1.2 GEOGRAPHIC PRESENCE
27.1.3 PRODUCT PORTFOLIO
27.1.4 RECENT DEVELOPEMENTS
27.2 HACH
27.2.1 COMPANY OVERVIEW
27.2.2 GEOGRAPHIC PRESENCE
27.2.3 PRODUCT PORTFOLIO
27.2.4 RECENT DEVELOPEMENTS
27.3 PARTICLE MEASURING SYSTEMS IS A SPECTRIS COMPANY
27.3.1 COMPANY OVERVIEW
27.3.2 GEOGRAPHIC PRESENCE
27.3.3 PRODUCT PORTFOLIO
27.3.4 RECENT DEVELOPEMENTS
27.4 PERKINELMER INC
27.4.1 COMPANY OVERVIEW
27.4.2 GEOGRAPHIC PRESENCE
27.4.3 PRODUCT PORTFOLIO
27.4.4 RECENT DEVELOPMENTS
27.5 LABTRON
27.5.1 COMPANY OVERVIEW
27.5.2 GEOGRAPHIC PRESENCE
27.5.3 PRODUCT PORTFOLIO
27.5.4 RECENT DEVELOPMENTS
27.6 LABMATE SCIENTIFIC INC.
27.6.1 COMPANY OVERVIEW
27.6.2 GEOGRAPHIC PRESENCE
27.6.3 PRODUCT PORTFOLIO
27.6.4 RECENT DEVELOPMENTS
27.7 RION CO.,LTD.
27.7.1 COMPANY OVERVIEW
27.7.2 GEOGRAPHIC PRESENCE
27.7.3 PRODUCT PORTFOLIO
27.7.4 RECENT DEVELOPMENTS
27.8 AIMIL LTD
27.8.1 COMPANY OVERVIEW
27.8.2 GEOGRAPHIC PRESENCE
27.8.3 PRODUCT PORTFOLIO
27.8.4 RECENT DEVELOPMENTS
27.9 FERROCARE MACHINES PRIVATE LIMITED
27.9.1 COMPANY OVERVIEW
27.9.2 GEOGRAPHIC PRESENCE
27.9.3 PRODUCT PORTFOLIO
27.9.4 RECENT DEVELOPMENTS
27.1 LIGHTHOUSE WORLDWIDE SOLUTIONS
27.10.1 COMPANY OVERVIEW
27.10.2 GEOGRAPHIC PRESENCE
27.10.3 PRODUCT PORTFOLIO
27.10.4 RECENT DEVELOPMENTS
27.11 VENTUREDYNE LTD.
27.11.1 COMPANY OVERVIEW
27.11.2 GEOGRAPHIC PRESENCE
27.11.3 PRODUCT PORTFOLIO
27.11.4 RECENT DEVELOPMENTS
27.12 TSI INCORPORATED
27.12.1 COMPANY OVERVIEW
27.12.2 GEOGRAPHIC PRESENCE
27.12.3 PRODUCT PORTFOLIO
27.12.4 RECENT DEVELOPMENTS
27.13 PALAS GMBH
27.13.1 COMPANY OVERVIEW
27.13.2 GEOGRAPHIC PRESENCE
27.13.3 PRODUCT PORTFOLIO
27.13.4 RECENT DEVELOPMENTS
27.14 GRAYWOLF SENSING SOLUTIONS, LLC
27.14.1 COMPANY OVERVIEW
27.14.2 GEOGRAPHIC PRESENCE
27.14.3 PRODUCT PORTFOLIO
27.14.4 RECENT DEVELOPMENTS
27.15 MARKUS KLOTZ GMBH
27.15.1 COMPANY OVERVIEW
27.15.2 GEOGRAPHIC PRESENCE
27.15.3 PRODUCT PORTFOLIO
27.15.4 RECENT DEVELOPMENTS
27.16 PAMAS PARTIKELMESS- UND ANALYSESYSTEME GMBH
27.16.1 COMPANY OVERVIEW
27.16.2 GEOGRAPHIC PRESENCE
27.16.3 PRODUCT PORTFOLIO
27.16.4 RECENT DEVELOPMENTS
27.17 CHEMTRAC LLC.
27.17.1 COMPANY OVERVIEW
27.17.2 GEOGRAPHIC PRESENCE
27.17.3 PRODUCT PORTFOLIO
27.17.4 RECENT DEVELOPMENTS
27.18 LABNICS LTD.
27.18.1 COMPANY OVERVIEW
27.18.2 GEOGRAPHIC PRESENCE
27.18.3 PRODUCT PORTFOLIO
27.18.4 RECENT DEVELOPMENTS
27.19 FISON
27.19.1 COMPANY OVERVIEW
27.19.2 GEOGRAPHIC PRESENCE
27.19.3 PRODUCT PORTFOLIO
27.19.4 RECENT DEVELOPMENTS
27.2 HORIBA GROUP
27.20.1 COMPANY OVERVIEW
27.20.2 GEOGRAPHIC PRESENCE
27.20.3 PRODUCT PORTFOLIO
27.20.4 RECENT DEVELOPMENTS
27.21 SUZHOU SUJING AUTOMATION EQUIPMENT CORPORATION LIMITED
27.21.1 COMPANY OVERVIEW
27.21.2 GEOGRAPHIC PRESENCE
27.21.3 PRODUCT PORTFOLIO
27.21.4 RECENT DEVELOPMENTS
27.22 YK SCIENTIFIC INSTRUMENT CO., LTD
27.22.1 COMPANY OVERVIEW
27.22.2 GEOGRAPHIC PRESENCE
27.22.3 PRODUCT PORTFOLIO
27.22.4 RECENT DEVELOPMENTS
27.23 BEIJING HIYI TECHNOLOGY CO., LTD
27.23.1 COMPANY OVERVIEW
27.23.2 GEOGRAPHIC PRESENCE
27.23.3 PRODUCT PORTFOLIO
27.23.4 RECENT DEVELOPMENTS
27.24 TESCA TECHNOLOGIES PVT. LTD.
27.24.1 COMPANY OVERVIEW
27.24.2 GEOGRAPHIC PRESENCE
27.24.3 PRODUCT PORTFOLIO
27.24.4 RECENT DEVELOPMENTS
27.25 FAITHFUL INSTRUMENT (HEBEI) CO.,LTD.
27.25.1 COMPANY OVERVIEW
27.25.2 GEOGRAPHIC PRESENCE
27.25.3 PRODUCT PORTFOLIO
27.25.4 RECENT DEVELOPMENTS
27.26 KANOMAX USA, INC
27.26.1 COMPANY OVERVIEW
27.26.2 GEOGRAPHIC PRESENCE
27.26.3 PRODUCT PORTFOLIO
27.26.4 RECENT DEVELOPMENTS
27.27 HAL TECHNOLOGY
27.27.1 COMPANY OVERVIEW
27.27.2 GEOGRAPHIC PRESENCE
27.27.3 PRODUCT PORTFOLIO
27.27.4 RECENT DEVELOPMENTS
27.28 PARTICLES PLUS, INC.
27.28.1 COMPANY OVERVIEW
27.28.2 GEOGRAPHIC PRESENCE
27.28.3 PRODUCT PORTFOLIO
27.28.4 RECENT DEVELOPMENTS
NOTE: THE COMPANIES PROFILED IS NOT EXHAUSTIVE LIST AND IS AS PER OUR PREVIOUS CLIENT REQUIREMENT. WE PROFILE MORE THAN 100 COMPANIES IN OUR STUDY AND HENCE THE LIST OF COMPANIES CAN BE MODIFIED OR REPLACED ON REQUEST
28 RELATED REPORTS
29 CONCLUSION
30 QUESTIONNAIRE
31 ABOUT DATA BRIDGE MARKET RESEARCH
Data collection and base year analysis are done using data collection modules with large sample sizes. The stage includes obtaining market information or related data through various sources and strategies. It includes examining and planning all the data acquired from the past in advance. It likewise envelops the examination of information inconsistencies seen across different information sources. The market data is analysed and estimated using market statistical and coherent models. Also, market share analysis and key trend analysis are the major success factors in the market report. To know more, please request an analyst call or drop down your inquiry.
The key research methodology used by DBMR research team is data triangulation which involves data mining, analysis of the impact of data variables on the market and primary (industry expert) validation. Data models include Vendor Positioning Grid, Market Time Line Analysis, Market Overview and Guide, Company Positioning Grid, Patent Analysis, Pricing Analysis, Company Market Share Analysis, Standards of Measurement, Global versus Regional and Vendor Share Analysis. To know more about the research methodology, drop in an inquiry to speak to our industry experts.
Data Bridge Market Research is a leader in advanced formative research. We take pride in servicing our existing and new customers with data and analysis that match and suits their goal. The report can be customized to include price trend analysis of target brands understanding the market for additional countries (ask for the list of countries), clinical trial results data, literature review, refurbished market and product base analysis. Market analysis of target competitors can be analyzed from technology-based analysis to market portfolio strategies. We can add as many competitors that you require data about in the format and data style you are looking for. Our team of analysts can also provide you data in crude raw excel files pivot tables (Fact book) or can assist you in creating presentations from the data sets available in the report.


