
Machined Seals Market Analysis and Insights
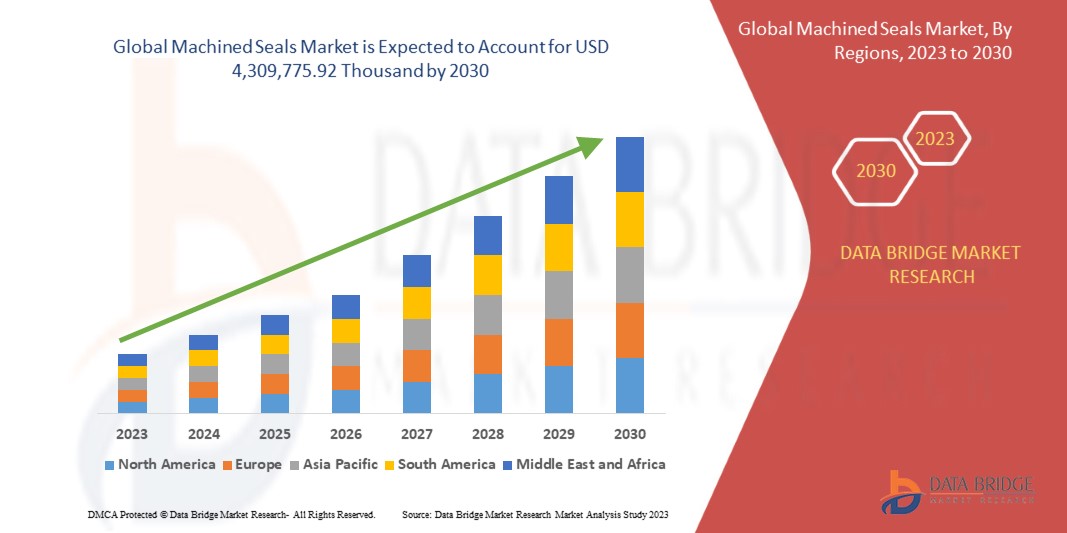
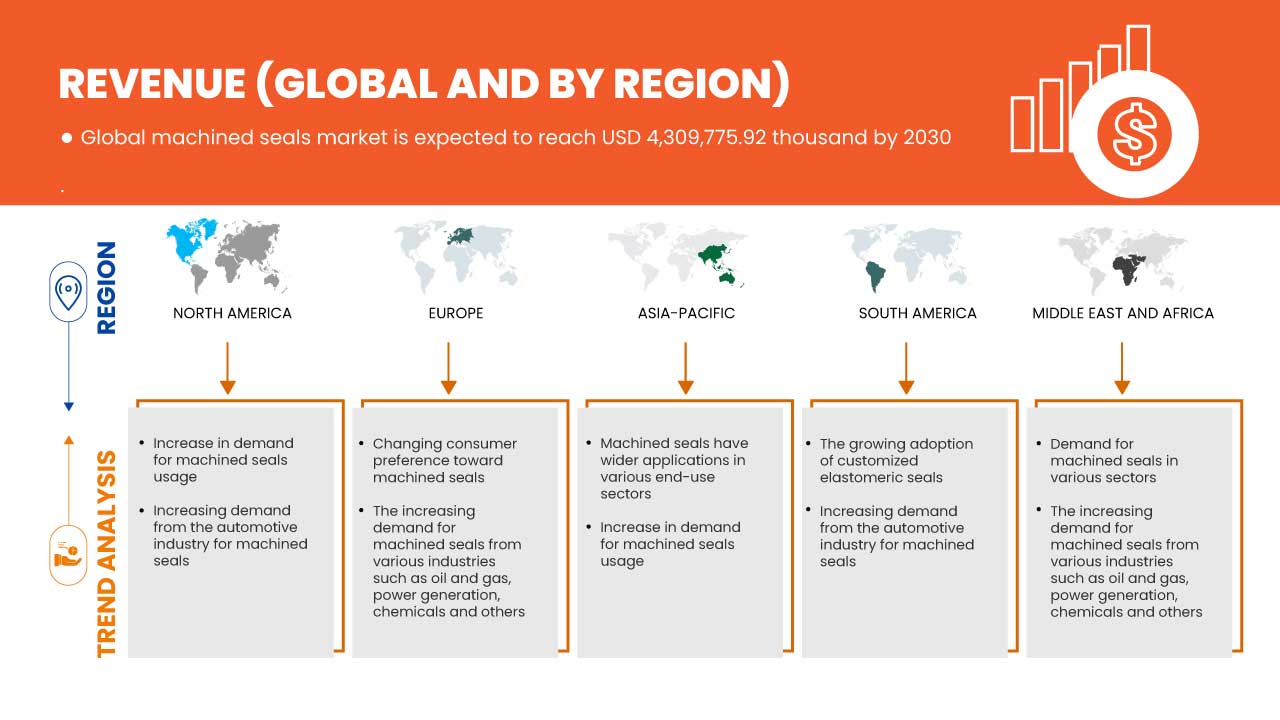
Global Machined Seals Market is expected to gain significant growth in the forecast period of 2023 to 2030. Data Bridge Market Research analyses that the market is growing with a CAGR of 4.5% from 2023 to 2030 and is expected to reach USD 4,309,775.92 thousand by 2030. The major factor driving the growth of the global Machined Seals market is increasing demand from the automotive industry for machined seals is expected to drive the market growth.
Global machined seals market report provides details of market share, new developments, and the impact of domestic and localized market players, analyses opportunities in terms of emerging revenue pockets, changes in market regulations, products approvals, strategic decisions, product launches, geographic expansions, and technological innovations in the market. To understand the analysis and the market scenario, contact us for an Analyst Brief. Our team will help you create a revenue-impact solution to achieve your desired goal.
|
Report Metric |
Details |
|
Forecast Period |
2023 to 2030 |
|
Base Year |
2022 |
|
Historic Years |
2021 (Customizable to 2020 - 2015) |
|
Quantitative Units |
Revenue in USD Thousands |
|
Segments Covered |
By Type (Fluid Power Seals, Power Transmission Seals, and Large Diameter Seals), Product Type (Rod Seals, Piston Seals, Wiper Seals, Static Seals, Rotary Seals, Special Seals, Guide Rings, and Back up Rings), Material (Polytetrafluoroethylene (PTFE), Viton, Polyurethane (PU), Rubber, Metal, Elastomers, Thermoplastics, and Others), Application (Aerospace & Defense, Automotive Industry, Chemical Processing, Machined Tools, Construction, Industrial Turbines, Flow Control, Life Sciences, New Energies, Nuclear Industry, Oil & Gas, Pumps, Semiconductors, Sensors, Valves, Packaging and Materials, and Food & Beverages), Sales Channel (Manufacturers, Distributors, and Aftermarket) |
|
Countries Covered |
South Africa, Egypt, Saudi Arabia, United Arab Emirates, Israel, Kuwait, Qatar, Oman, Bahrain and Rest of Middle East and Africa, U.S., Canada and Mexico, China, Taiwan, Vietnam, Japan, South Korea, India, Singapore, Thailand, Indonesia, Malaysia, Philippines, Australia, New Zealand, and Rest of Asia-Pacific, Germany, U.K., Italy, France, Spain, Russia, Switzerland, Turkey, Belgium, Netherlands, Switzerland, Denmark, Sweden, Poland, Norway, Finland and Rest of Europe. |
|
Market Players Covered |
Grizzly Supplies, Hallite Seals, OZ SEALS PTY LTD, France Joint, FPE Seals Ltd, STACEM, M.Barnwell Services Limited., Martin Fluid Power Company, Inc., MFP Seals, AccroSeal, Seal & Gasket Supplies, Ashton Seals Ltd, Picard Technologies, Evolution Seals Ltd., PARKER HANNIFIN CORP, SKF, Freudenberg FST GmbH, Patriot Fluid Power, Amphora Industries Pty Ltd, and SAINT-GOBAIN. |
Market Definition
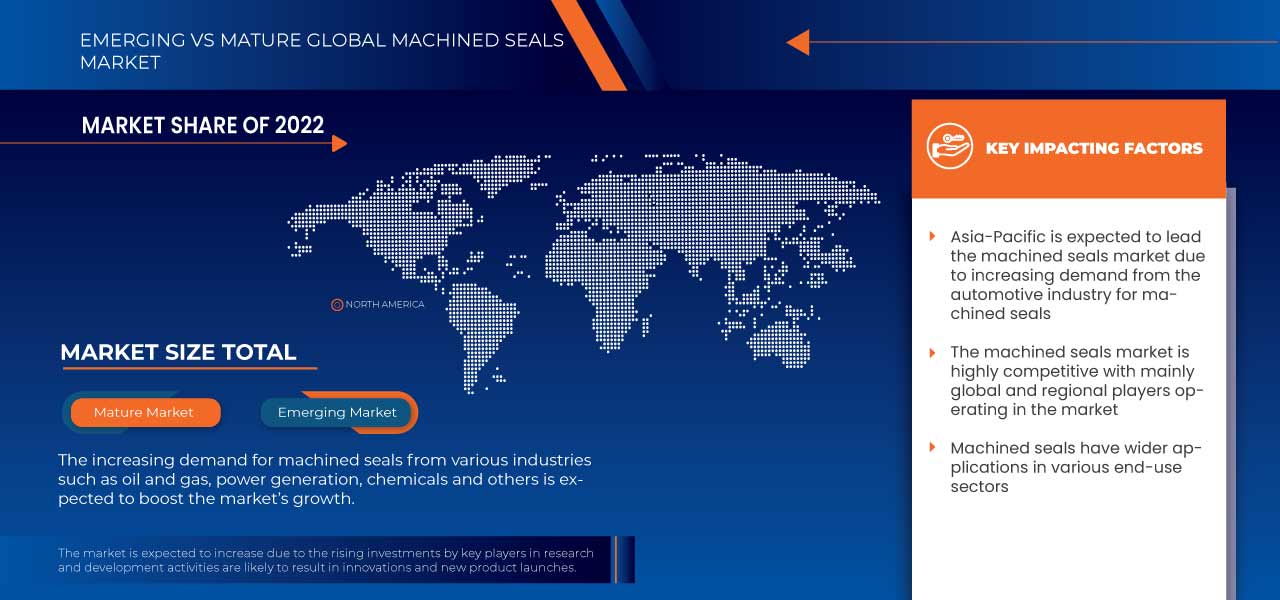
Machined seals are considered important components to avoid leakage in several pieces of equipment. The leakage protection lessens emissions from the prereferral equipment. Additionally, the end users are focusing on improving industrial processes and saving energy by employing fewer energy seals. The machined seals are specially designed depending on the type of equipment and end-use surface. Machined seals are devices used in various industries to seal and protect against the entry of air, water, or other fluids. These are generally equipped with excellent anti-chemical characteristics, anti-compressibility properties, high/low temperature, and weather resistance, and superior heat, water, and abrasion resistance. The increased use of machined seals in various applications such as automotive, oil and gas, food and beverage, electrical and electronics, chemicals, aerospace and defense, and others is expected to increase demand worldwide.
Global Machined Seals Market Dynamics
This section deals with understanding the market drivers, advantages, opportunities, restraints, and challenges. All of this is discussed in detail below:
Drivers
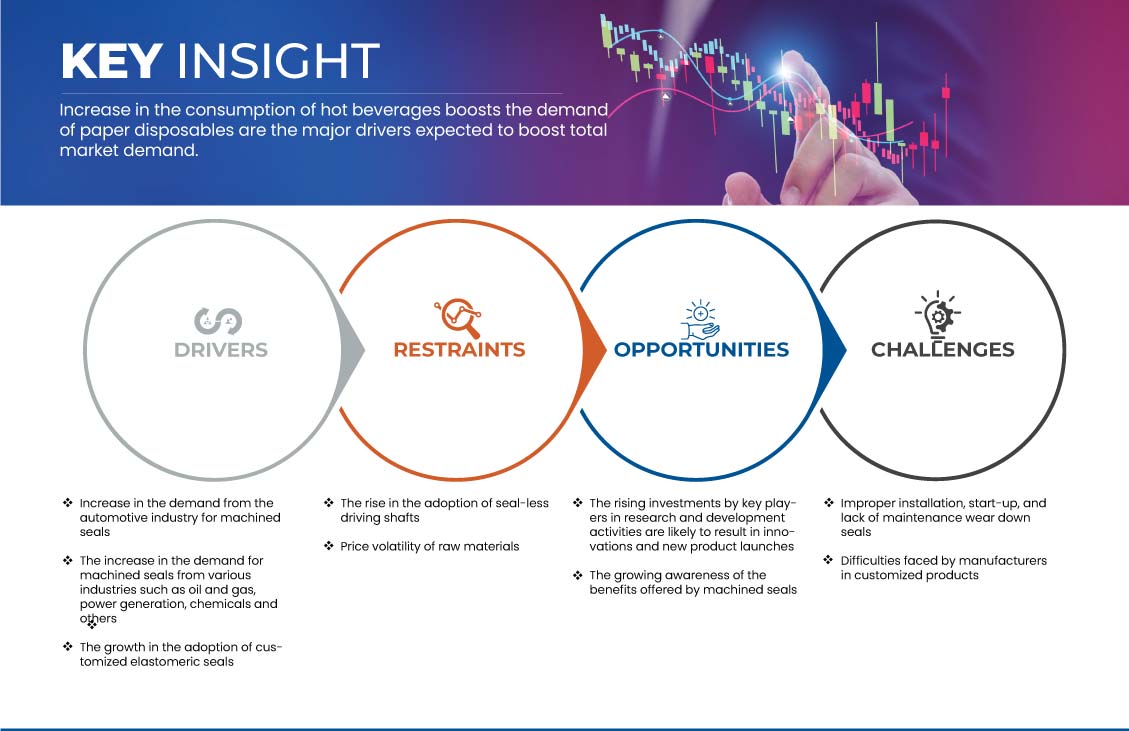
- Increase in the demand from the automotive industry for machined seals
The new technology has made automotive seals safer and more effective. Automobile lightweight components are sealed through high-strength seals to endure high heat and pressure. This indirectly helps improve the fuel efficiency of vehicles with the increasing use of lightweight materials. Thus, growing demand for fuel-efficient vehicles is expected to drive the machine seals market. The seals prevent lubricants from escaping the bearings. The need of the automotive industry to attain better fuel efficiency and vehicle performance is impacting the seals for market players to come up with new machined seals. This is expected to drive the market growth further.
- The increase in the demand for machined seals from various industries such as oil and gas, power generation, chemicals, and others
Machined seals are used against high-pressure gases and liquid chemicals to withstand mechanical deformation. Oil & gas seals have various applications, including drilling, processing, refining, transportation, and others. Seals are machined or molded and carefully designed using sophisticated simulation software. Seals are made of various materials, such as polyurethane, rubber, or polytetrafluoroethylene (PTFE). Machined seals are of different types, such as hydraulic seals, rotary shaft seals, oil seals, packing, gaskets, and other high-performance rubber and plastic parts. In addition, consumers are looking forward to adopting seals that can work in high temperatures and provide better performance than traditional seals. The extensive uses of various machine seals in the industries and the performance of the seals have expected to drive the machined seals global market in the forecast period.
Opportunities
- The rise in the investments by key players in research and development activities is likely to result in innovations and new product launches
Research and development (R&D) is the part of a company's operations that seeks knowledge to develop, design, and enhance its products, services, technologies, or processes. Along with creating new products and adding features to old ones, investing in research and development connects various parts of a company's strategy, such as marketing and cost reduction. R&D often leads to a new type of product or service. Technological advancements, coupled with rapid research and development activities, have greatly contributed to the production of machined seals. R&D is important to business growth and your ability to compete in a market. A business that can innovate, adopt new technologies, and improve existing processes is more likely to succeed in the long run. The rising investment in research and development activities to develop machined seals is estimated to be a key factor in driving the machined seals market during the forecast period.
- The growth in the awareness of the benefits offered by machined seals
The growing awareness of the machine's seals is the features like manufacturing flexibility and fast, a flexible amendment to the wide assortment of production methods for standard molded seals. Machined metal seals are designed to meet applications with high temperatures or cryogenics, high pressures, full vacuum, very corrosive chemicals, and penetrating radiation levels. Machined seals can be invaluable for engineers and maintenance technicians. Getting a customized seal made to order in a day or two can keep a project on track when prototyping new designs.
Furthermore, machined seals can minimize downtime and lost production when a critical component fails, and the standard replacement seal is not in stock. These capabilities enable on-demand manufacturing for everything from single seals to serial production for fluid power, handling, and transmission applications. In addition, machined seals do not require tooling to be developed, reducing this associated cost and lead time.
Restraints/Challenges
- Difficulties faced by manufacturers in customized products
In every industry across the globe, customers demand customized products, and manufacturers must rise to the challenges. Mass customization at mass production volumes is difficult regardless of how simple or complex the product is. A rise in the cost of component procurement due to specific requirements of end-users is one of the key challenges for the market in focus. Manufacturers of machined seals, by considering end-users demands, design seals using the most high-quality materials available. The higher product delivery requirements raise the manufacturing cost in terms of raw material procurement and quality considerations. The difficulties in customizing the products increase the price and challenge to manufacturing that product, which is expected to hamper the market.
- The rise in the adoption of seal-less driving shafts
The rising demand for sealless drive shafts is due to their numerous advantages. Seals additionally require different motors and shafts for power transfer. On the other hand, the sealless magnetic drive pump is surrounded by a series of magnets that aid in transferring the magnetic field to the shaft. As a result, any fluid can be contained totally within the system. A sealless pump has a fully enclosed wet end, eliminating any need for a seal and preventing the possibility of material leakage. Several stringent environmental and safety regulations force the industry to adopt methods that reduce or eliminate fugitive emissions in the workplace. Thus, it is expected to grow sealless driving shafts adoption in the market.
Global Machined Seals Market Scope
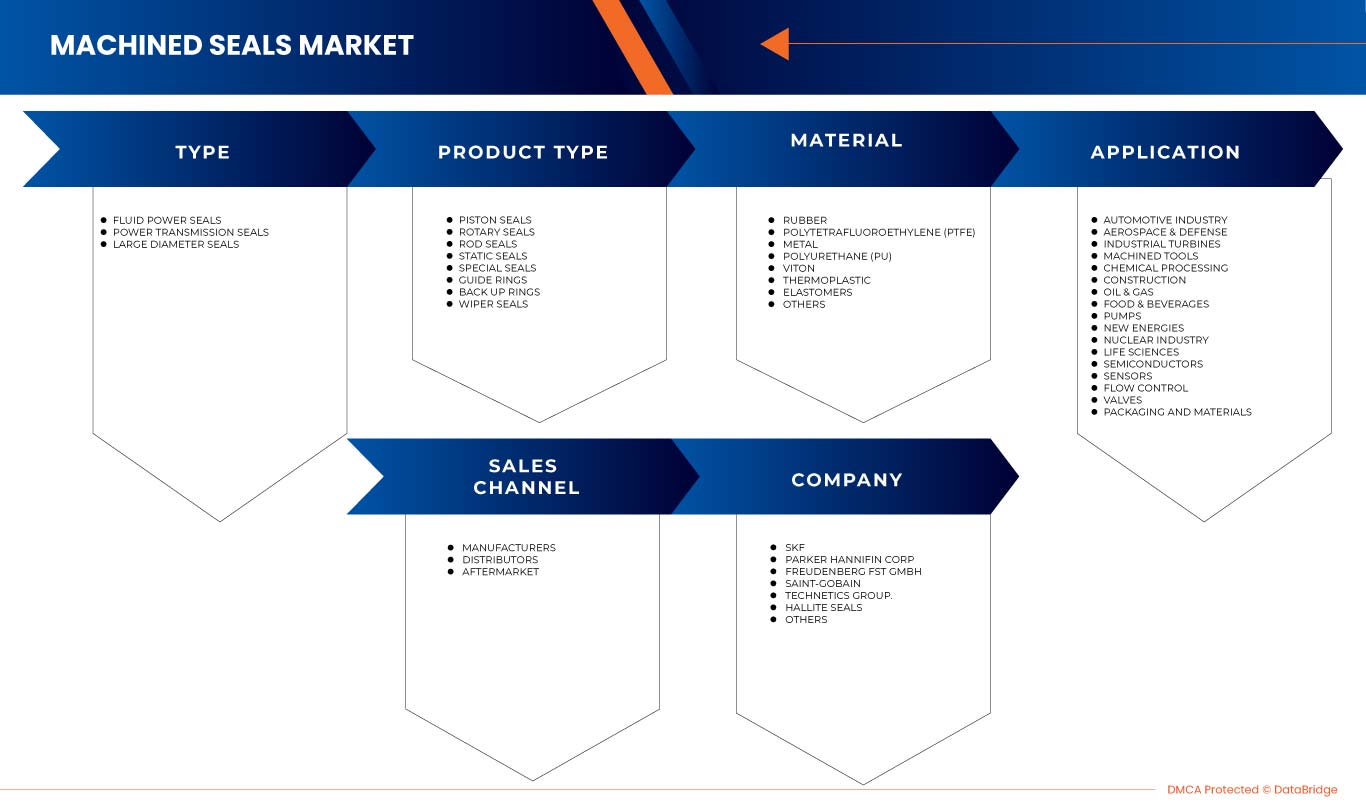
Global machined seals market is categorized based on type, product type, material, application, and sales channel. The growth amongst these segments will help you analyze major industry growth segments and provide the users with a valuable market overview and insights to make strategic decisions to identify core market applications.
Type
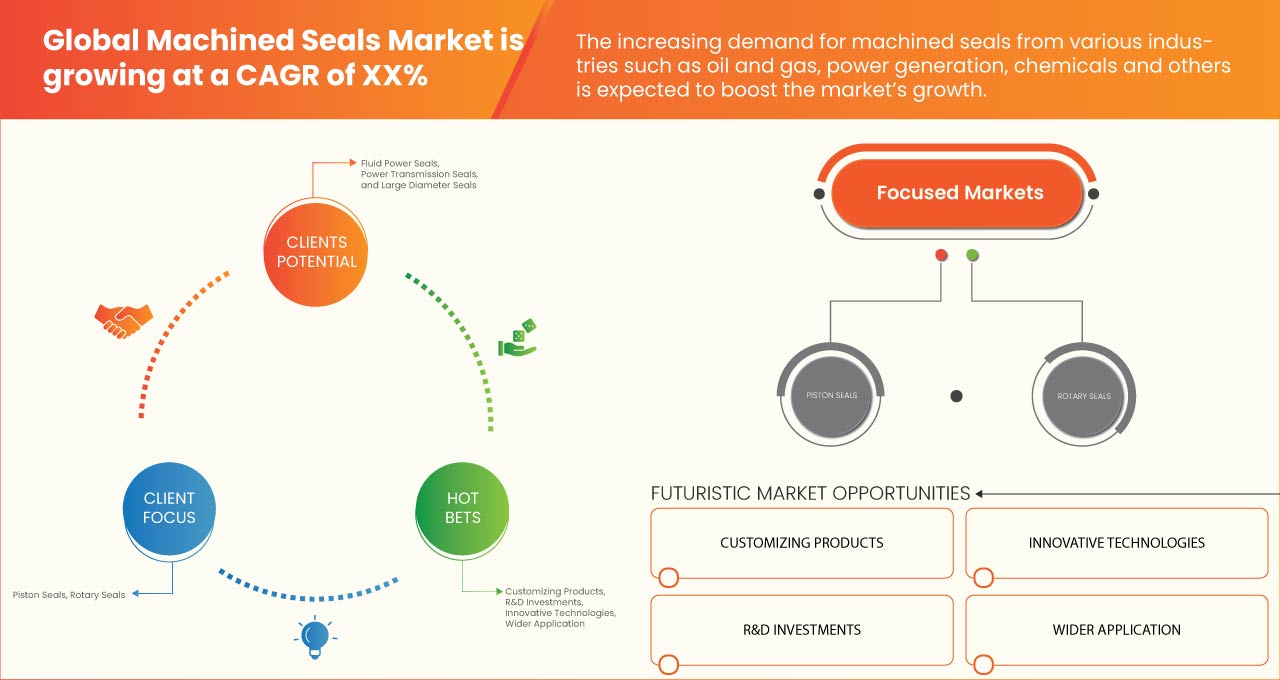
- Fluid Power Seals
- Power Transmission Seals
- Large-Diameter Seals
Based on type, the global machined seals market is classified into fluid power seals, power transmission seals, and large-diameter seals.
Product Type
- Rod Seals
- Piston Seals
- Wiper Seals
- Static Seals
- Rotary Seals
- Special Seals
- Guide Rings
- Backup Rings
Based on product type, the global machined seals market is classified into rod seals, piston seals, wiper seals, static seals, rotary seals, special seals, guide rings, and backup rings.
Material
- Polytetrafluoroethylene (PTFE)
- Viton
- Polyurethane (PU)
- Rubber
- Metal
- Elastomers
- Thermoplastics
- Others
Based on the material, the global machined seals market is classified into polytetrafluoroethylene (PTFE), Viton, polyurethane (PU), rubber, metal, elastomers, thermoplastics, and others.
Application
- Aerospace & Defense
- Automotive Industry
- Chemical Processing
- Machined Tools
- Construction
- Industrial Turbines
- Flow Control
- Life Sciences
- New Energies
- Nuclear Industry
- Oil & Gas
- Pumps
- Semiconductors
- Sensors
- Valves
- Food And Beverages
- Packaging, And Materials
Based on the application, the global machined seals market is classified into aerospace & defense, automotive industry, chemical processing, machined tools, construction, industrial turbines, flow control, life sciences, new energies, nuclear industry, oil & gas, pumps, semiconductors, sensors, valves, food and beverages and packaging, and materials.
Sales- channel
- Manufacturers
- Distributors
- Aftermarket
Based on the end-user, the global machined seals market is classified into manufacturers, distributors, and aftermarket.
Global Machined Seals Market Regional Analysis/Insights
The global machined seals market is segmented on the basis of type, product type, material, application, and sales channel.
The countries in the global machined seals market are South Africa, Egypt, Saudi Arabia, United Arab Emirates, Israel, Kuwait, Qatar, Oman, Bahrain and Rest of Middle East and Africa, U.S., Canada and Mexico, China, Taiwan, Vietnam, Japan, South Korea, India, Singapore, Thailand, Indonesia, Malaysia, Philippines, Australia, New Zealand, and Rest of Asia-Pacific, Germany, U.K., Italy, France, Spain, Russia, Switzerland, Turkey, Belgium, Netherlands, Switzerland, Denmark, Sweden, Poland, Norway, Finland and Rest of Europe.
Asia-Pacific is dominating the global machined seals market in terms of market share and market revenue because of the rising application of demand in the automotive market.
The country section of the report also provides individual market-impacting factors and changes in market regulation that impact the current and future trends of the market. Data points downstream and upstream value chain analysis, technical trends, porter's five forces analysis, and case studies are some of the pointers used to forecast the market scenario for individual countries. Also, the presence and availability of Europe brands and the challenges faced due to large or scarce competition from local and domestic brands, the impact of domestic tariffs, and trade routes are considered while providing forecast analysis of the country data.
Competitive Landscape and Global Machined Seals Market Share Analysis
Global machined seals market competitive landscape provides details of competitors. Details included are company overview, company financials, revenue generated, market potential, investment in research and development, new market initiatives, production sites and facilities, company strengths and weaknesses, product launch, product approvals, patents, product width and breadth, application dominance, product lifeline curve. The above data points are only related to the company’s focus on the global machined seals market.
Some of the prominent participants operating in the global machined seals market are Grizzly Supplies, Hallite Seals, OZ SEALS PTY LTD, France Joint, FPE Seals Ltd, STACEM, M.Barnwell Services Limited., Martin Fluid Power Company, Inc., MFP Seals, AccroSeal, Seal & Gasket Supplies, Ashton Seals Ltd, Picard Technologies, Evolution Seals Ltd., PARKER HANNIFIN CORP, SKF, Freudenberg FST GmbH, Patriot Fluid Power, Amphora Industries Pty Ltd, and SAINT-GOBAIN among others.
SKU-

- Interactive Data Analysis Dashboard
- Company Analysis Dashboard for high growth potential opportunities
- Research Analyst Access for customization & queries
- Competitor Analysis with Interactive dashboard
- Latest News, Updates & Trend analysis
- Harness the Power of Benchmark Analysis for Comprehensive Competitor Tracking
Table of Content
1 INTRODUCTION
1.1 OBJECTIVES OF THE STUDY
1.2 MARKET DEFINITION
1.3 OVERVIEW OF THE GLOBAL MACHINED SEALS MARKET
1.4 LIMITATIONS
1.5 MARKETS COVERED
2 MARKET SEGMENTATION
2.1 MARKETS COVERED
2.2 GEOGRAPHICAL SCOPE
2.3 YEARS CONSIDERED FOR THE STUDY
2.4 CURRENCY AND PRICING
2.5 DBMR TRIPOD DATA VALIDATION MODEL
2.6 TYPE LIFELINE CURVE
2.7 MULTIVARIATE MODELING
2.8 PRIMARY INTERVIEWS WITH KEY OPINION LEADERS
2.9 DBMR MARKET POSITION GRID
2.1 MARKET APPLICATION COVERAGE GRID
2.11 DBMR MARKET CHALLENGE MATRIX
2.12 DBMR VENDOR SHARE ANALYSIS
2.13 SECONDARY SOURCES
2.14 ASSUMPTIONS
3 EXECUTIVE SUMMARY
4 PREMIUM INSIGHTS
4.1 PESTLE ANALYSIS
4.1.1 POLITICAL FACTORS
4.1.2 ECONOMIC FACTORS
4.1.3 SOCIAL FACTORS
4.1.4 TECHNOLOGICAL FACTORS
4.1.5 LEGAL FACTORS
4.1.6 ENVIRONMENTAL FACTORS
4.1.7 CONCLUSION
4.2 PORTER'S FIVE FORCES:
4.2.1 THREAT OF NEW ENTRANTS:
4.2.2 THREAT OF SUBSTITUTES:
4.2.3 CUSTOMER BARGAINING POWER:
4.2.4 SUPPLIER BARGAINING POWER:
4.2.5 INTERNAL COMPETITION (RIVALRY):
4.3 GROWTH STRATEGIES ADOPTED BY KEY MARKET PLAYERS
4.4 IMPORT EXPORT SCENARIO
4.5 INDUSTRY TRENDS AND FUTURE PERSPECTIVE
4.6 PRODUCTION AND CONSUMPTION ANALYSIS
4.7 RAW MATERIAL PRODUCTION COVERAGE
4.8 SUPPLY CHAIN ANALYSIS
4.8.1 RAW MATERIAL PROCUREMENT
4.8.2 MANUFACTURING AND PACKING
4.8.3 MARKETING AND DISTRIBUTION
4.8.4 END USERS
4.9 TECHNOLOGICAL ADVANCEMENT BY MANUFACTURERS
4.1 VENDOR SELECTION CRITERIA
4.11 REGULATION COVERAGE
5 MARKET OVERVIEW
5.1 DRIVERS
5.1.1 INCREASE IN THE DEMAND FROM THE AUTOMOTIVE INDUSTRY FOR MACHINED SEALS
5.1.2 THE INCREASE IN THE DEMAND FOR MACHINED SEALS FROM VARIOUS INDUSTRIES SUCH AS OIL AND GAS, POWER GENERATION, CHEMICALS, AND OTHERS
5.1.3 THE GROWTH IN THE ADOPTION OF CUSTOMIZED ELASTOMERIC SEALS
5.2 RESTRAINTS
5.2.1 THE RISE IN THE ADOPTION OF SEAL-LESS DRIVING SHAFTS
5.2.2 PRICE VOLATILITY OF RAW MATERIALS
5.3 OPPORTUNITIES
5.3.1 THE RISE IN THE INVESTMENTS BY KEY PLAYERS IN RESEARCH AND DEVELOPMENT ACTIVITIES ARE LIKELY TO RESULT IN INNOVATIONS AND NEW PRODUCT LAUNCHES
5.3.2 THE GROWTH IN THE AWARENESS OF THE BENEFITS OFFERED BY MACHINED SEALS
5.4 CHALLENGES
5.4.1 IMPROPER INSTALLATION, START-UP, AND LACK OF MAINTENANCE WEAR DOWN SEALS
5.4.2 DIFFICULTIES FACED BY MANUFACTURERS IN CUSTOMIZED PRODUCTS
6 GLOBAL MACHINED SEALS MARKET, BY TYPE
6.1 OVERVIEW
6.2 FLUID POWER SEALS
6.3 POWER TRANSMISSION SEALS
6.4 LARGE DIAMETER SEALS
7 GLOBAL MACHINED SEALS MARKET, BY PRODUCT TYPE
7.1 OVERVIEW
7.2 PISTON SEALS
7.3 ROTARY SEALS
7.4 ROD SEALS
7.5 STATIC SEALS
7.6 SPECIAL SEALS
7.7 GUIDE RINGS
7.8 BACKUP-UP RINGS
7.9 WIPER SEALS
8 GLOBAL MACHINED SEALS MARKET, BY MATERIAL
8.1 OVERVIEW
8.2 RUBBER
8.3 POLYTETRAFLUORIETHYLENE (PTFE)
8.4 METAL
8.5 POLYURETHANE (PU)
8.6 VITON
8.7 THERMOPLASTICS
8.8 ELASTOMERS
8.9 OTHERS
9 GLOBAL MACHINED SEALS MARKET, BY SALES CHANNEL
9.1 OVERVIEW
9.2 MANUFACTURERS
9.3 DISTRIBUTORS
9.4 AFTERMARKET
10 GLOBAL MACHINED SEALS MARKET, BY APPLICATION
10.1 OVERVIEW
10.2 AUTOMOTIVE INDUSTRY
10.2.1 TWO-WHEELERS
10.2.2 LIGHT VEHICLES
10.2.3 CARS
10.2.4 HEAVY VEHICLES
10.3 AEROSPACE & DEFENSE
10.3.1 COMMERCIAL AIRCRAFT
10.3.2 PASSENGER AIRCRAFT
10.3.3 DEFENSE & MILITARY
10.3.4 SPACE LAUNCH SYSTEM (SLS)
10.3.5 SPACE SHUTTLE
10.4 INDUSTRIAL TURBINES
10.5 MACHINED TOOLS
10.6 CHEMICAL PROCESSING
10.7 CONSTRUCTION
10.8 OIL & GAS
10.9 FOOD & BEVERAGES
10.1 PUMPS
10.11 NEW ENERGIES
10.12 NUCLEAR INDUSTRY
10.13 LIFE SCIENCES
10.14 SEMICONDUCTORS
10.15 SENSORS
10.16 FLOW CONTROL
10.17 VALVES
10.18 PACKAGING AND MATERIALS
11 GLOBAL MACHINED SEALS MARKET, BY REGION
11.1 OVERVIEW
11.2 ASIA-PACIFIC
11.2.1 JAPAN
11.2.2 CHINA
11.2.3 INDIA
11.2.4 TAIWAN
11.2.5 SOUTH KOREA
11.2.6 AUSTRALIA
11.2.7 SINGAPORE
11.2.8 THAILAND
11.2.9 MALAYSIA
11.2.10 INDONESIA
11.2.11 PHILIPPINES
11.2.12 NEW ZEALAND
11.2.13 VIETNAM
11.2.14 REST OF ASIA-PACIFIC
11.3 NORTH AMERICA
11.3.1 U.S.
11.3.2 CANADA
11.3.3 MEXICO
11.4 EUROPE
11.4.1 GERMANY
11.4.2 ITALY
11.4.3 FRANCE
11.4.4 U.K.
11.4.5 SPAIN
11.4.6 RUSSIA
11.4.7 TURKEY
11.4.8 BELGIUM
11.4.9 NETHERLANDS
11.4.10 SWITZERLAND
11.4.11 DENMARK
11.4.12 SWEDEN
11.4.13 POLAND
11.4.14 NORWAY
11.4.15 FINLAND
11.4.16 REST OF EUROPE
11.5 MIDDLE EAST AND AFRICA
11.5.1 SAUDI ARABIA
11.5.2 UNITED ARAB EMIRATES
11.5.3 KUWAIT
11.5.4 QATAR
11.5.5 OMAN
11.5.6 BAHRAIN
11.5.7 EGYPT
11.5.8 ISRAEL
11.5.9 SOUTH AFRICA
11.5.10 REST OF MIDDLE EAST AND AFRICA
11.6 SOUTH AMERICA
11.6.1 BRAZIL
11.6.2 ARGENTINA
11.6.3 REST OF SOUTH AMERICA
12 GLOBAL MACHINED SEALS MARKET, COMPANY LANDSCAPE
12.1 COMPANY SHARE ANALYSIS: GLOBAL
12.2 COMPANY SHARE ANALYSIS: NORTH AMERICA
12.3 COMPANY SHARE ANALYSIS: EUROPE
12.4 COMPANY SHARE ANALYSIS: ASIA-PACIFIC
12.5 MERGERS & ACQUISITIONS
12.6 EXPANSIONS
12.7 AGREEMENT
12.8 NEW PRODUCT DEVELOPMENTS
13 SWOT ANALYSIS
14 COMPANY PROFILES
14.1 SKF
14.1.1 COMPANY SNAPSHOT
14.1.2 REVENUE ANALYSIS
14.1.3 COMPANY SHARE ANALYSIS
14.1.4 PRODUCT PORTFOLIO
14.1.5 RECENT DEVELOPMENT
14.2 PARKER HANNIFIN CORP
14.2.1 COMPANY SNAPSHOT
14.2.2 REVENUE ANALYSIS
14.2.3 COMPANY SHARE ANALYSIS
14.2.4 PRODUCT PORTFOLIO
14.2.5 RECENT DEVELOPMENT
14.3 FREUDENBERG FST GMBH
14.3.1 COMPANY SNAPSHOT
14.3.2 REVENUE ANALYSIS
14.3.3 COMPANY SHARE ANALYSIS
14.3.4 PRODUCT PORTFOLIO
14.3.5 RECENT DEVELOPMENTS
14.4 SAINT-GOBAIN
14.4.1 COMPANY SNAPSHOT
14.4.2 REVENUE ANALYSIS
14.4.3 COMPANY SHARE ANALYSIS
14.4.4 PRODUCT PORTFOLIO
14.4.5 RECENT DEVELOPMENT
14.5 TECHNETICS GROUP.
14.5.1 COMPANY SNAPSHOT
14.5.2 PRODUCT PORTFOLIO
14.5.3 RECENT DEVELOPMENT
14.6 HALLITE SEALS
14.6.1 COMPANY SNAPSHOT
14.6.2 PRODUCT PORTFOLIO
14.6.3 RECENT DEVELOPMENTS
14.7 ACCROSEAL
14.7.1 COMPANY SNAPSHOT
14.7.2 PRODUCT PORTFOLIO
14.7.3 RECENT DEVELOPMENT
14.8 AMPHORA INDUSTRIES PTY LTD
14.8.1 COMPANY SNAPSHOT
14.8.2 PRODUCT PORTFOLIO
14.8.3 RECENT DEVELOPMENTS
14.9 ASHTON SEALS LTD
14.9.1 COMPANY SNAPSHOT
14.9.2 PRODUCT PORTFOLIO
14.9.3 RECENT DEVELOPMENTS
14.1 EVOLUTION SEALS LTD.
14.10.1 COMPANY SNAPSHOT
14.10.2 PRODUCT PORTFOLIO
14.10.3 RECENT DEVELOPMENT
14.11 FRANCE JOINT
14.11.1 COMPANY SNAPSHOT
14.11.2 PRODUCT PORTFOLIO
14.11.3 RECENT DEVELOPMENT
14.12 FPE SEALS LTD
14.12.1 COMPANY SNAPSHOT
14.12.2 PRODUCT PORTFOLIO
14.12.3 RECENT DEVELOPMENT
14.13 GRIZZLY SUPPLIES
14.13.1 COMPANY SNAPSHOT
14.13.2 PRODUCT PORTFOLIO
14.13.3 RECENT DEVELOPMENT
14.14 MARTIN FLUID POWER COMPANY, INC. AND MFP SEALS
14.14.1 COMPANY SNAPSHOT
14.14.2 PRODUCT PORTFOLIO
14.14.3 RECENT DEVELOPMENT
14.15 M.BARNWELL SERVICES LIMITED.
14.15.1 COMPANY SNAPSHOT
14.15.2 PRODUCT PORTFOLIO
14.15.3 RECENT DEVELOPMENT
14.16 OZ SEALS PTY LTD
14.16.1 COMPANY SNAPSHOT
14.16.2 PRODUCT PORTFOLIO
14.16.3 RECENT DEVELOPMENT
14.17 PATRIOT FLUID POWER
14.17.1 COMPANY SNAPSHOT
14.17.2 PRODUCT PORTFOLIO
14.17.3 RECENT DEVELOPMENTS
14.18 PICARD TECHNOLOGIES
14.18.1 COMPANY SNAPSHOT
14.18.2 PRODUCT PORTFOLIO
14.18.3 RECENT DEVELOPMENT
14.19 SEALS & GASKET SUPPLIES
14.19.1 COMPANY SNAPSHOT
14.19.2 PRODUCT PORTFOLIO
14.19.3 RECENT DEVELOPMENT
14.2 STACEM
14.20.1 COMPANY SNAPSHOT
14.20.2 PRODUCT PORTFOLIO
14.20.3 RECENT DEVELOPMENTS
15 QUESTIONNAIRE
16 RELATED REPORTS
List of Table
TABLE 1 BELOW ARE SOME EXAMPLES OF THE GROWTH STRATEGY ADOPTED BY KEY MARKET PLAYERS FOR THE GLOBAL MACHINED SEALS MARKET.
TABLE 2 REGULATORY FRAMEWORK
TABLE 3 GLOBAL MACHINED SEALS MARKET: BY TYPE, 2021-2030 (USD THOUSAND)
TABLE 4 GLOBAL FLUID POWER SEALS IN MACHINED SEALS MARKET, BY REGION, 2021-2030 (USD THOUSAND)
TABLE 5 GLOBAL POWER TRANSMISSION SEALS IN MACHINED SEALS MARKET, BY REGION, 2021-2030 (USD THOUSAND)
TABLE 6 GLOBAL LARGE DIAMETER SEALS IN MACHINED SEALS MARKET, BY REGION, 2021-2030 (USD THOUSAND)
TABLE 7 GLOBAL MACHINED SEALS MARKET: BY PRODUCT TYPE, 2021-2030 (USD THOUSAND)
TABLE 8 GLOBAL PISTON SEALS IN MACHINED SEALS MARKET, BY REGION, 2021-2030 (USD THOUSAND)
TABLE 9 GLOBAL ROTARY SEALS IN MACHINED SEALS MARKET, BY REGION, 2021-2030 (USD THOUSAND)
TABLE 10 GLOBAL ROD SEALS IN MACHINED SEALS MARKET, BY REGION, 2021-2030 (USD THOUSAND)
TABLE 11 GLOBAL STATIC SEALS IN MACHINED SEALS MARKET, BY REGION, 2021-2030 (USD THOUSAND)
TABLE 12 GLOBAL SPECIAL SEALS IN MACHINED SEALS MARKET, BY REGION, 2021-2030 (USD THOUSAND)
TABLE 13 GLOBAL GUIDE RINGS IN MACHINED SEALS MARKET, BY REGION, 2021-2030 (USD THOUSAND)
TABLE 14 GLOBAL BACKUP RINGS IN MACHINED SEALS MARKET, BY REGION, 2021-2030 (USD THOUSAND)
TABLE 15 GLOBAL WIPER SEALS IN MACHINED SEALS MARKET, BY REGION, 2021-2030 (USD THOUSAND)
TABLE 16 GLOBAL MACHINED SEALS MARKET: BY MATERIAL, 2021-2030 (USD THOUSAND)
TABLE 17 GLOBAL RUBBER IN MACHINED SEALS MARKET, BY REGION, 2021-2030 (USD THOUSAND)
TABLE 18 GLOBAL POLYTETRAFLUORIETHYLENE (PTFE) IN MACHINED SEALS MARKET, BY REGION, 2021-2030 (USD THOUSAND)
TABLE 19 GLOBAL METAL IN MACHINED SEALS MARKET, BY REGION, 2021-2030 (USD THOUSAND)
TABLE 20 GLOBAL POLYURETHANE (PU) IN MACHINED SEALS MARKET, BY REGION, 2021-2030 (USD THOUSAND)
TABLE 21 GLOBAL VITON IN MACHINED SEALS MARKET, BY REGION, 2021-2030 (USD THOUSAND)
TABLE 22 GLOBAL THERMOPLASTICS IN MACHINED SEALS MARKET, BY REGION, 2021-2030 (USD THOUSAND)
TABLE 23 GLOBAL ELASTOMERS IN MACHINED SEALS MARKET, BY REGION, 2021-2030 (USD THOUSAND)
TABLE 24 GLOBAL OTHERS IN MACHINED SEALS MARKET, BY REGION, 2021-2030 (USD THOUSAND)
TABLE 25 GLOBAL MACHINED SEALS MARKET: SALES CHANNEL, 2021-2030 (USD THOUSAND)
TABLE 26 GLOBAL MANUFACTURERS IN MACHINED SEALS MARKET, BY REGION, 2021-2030 (USD THOUSAND)
TABLE 27 GLOBAL DISTRIBUTORS IN MACHINED SEALS MARKET, BY REGION, 2021-2030 (USD THOUSAND)
TABLE 28 GLOBAL AFTERMARKET IN MACHINED SEALS MARKET, BY REGION, 2021-2030 (USD THOUSAND)
TABLE 29 GLOBAL MACHINED SEALS MARKET: BY MATERIAL, 2021-2030 (USD THOUSAND)
TABLE 30 GLOBAL AUTOMOTIVE INDUSTRY IN MACHINED SEALS MARKET, BY REGION, 2021-2030 (USD THOUSAND)
TABLE 31 GLOBAL AUTOMOTIVE INDUSTRY IN MACHINED SEALS MARKET, BY TYPE, 2021-2030 (USD THOUSAND)
TABLE 32 GLOBAL AEROSPACE & DEFENSE IN MACHINED SEALS MARKET, BY REGION, 2021-2030 (USD THOUSAND)
TABLE 33 GLOBAL AEROSPACE & DEFENSE IN MACHINED SEALS MARKET, BY TYPE, 2021-2030 (USD THOUSAND)
TABLE 34 GLOBAL INDUSTRIAL TURBINES IN MACHINED SEALS MARKET, BY REGION, 2021-2030 (USD THOUSAND)
TABLE 35 GLOBAL MACHINED TOOLS IN MACHINED SEALS MARKET, BY REGION, 2021-2030 (USD THOUSAND)
TABLE 36 GLOBAL CHEMICAL PROCESSING IN MACHINED SEALS MARKET, BY REGION, 2021-2030 (USD THOUSAND)
TABLE 37 GLOBAL CONSTRUCTION IN MACHINED SEALS MARKET, BY REGION, 2021-2030 (USD THOUSAND)
TABLE 38 GLOBAL OIL & GAS IN MACHINED SEALS MARKET, BY REGION, 2021-2030 (USD THOUSAND)
TABLE 39 GLOBAL FOOD & BEVERAGES IN MACHINED SEALS MARKET, BY REGION, 2021-2030 (USD THOUSAND)
TABLE 40 GLOBAL PUMPS IN MACHINED SEALS MARKET, BY REGION, 2021-2030 (USD THOUSAND)
TABLE 41 GLOBAL NEW ENERGIES IN MACHINED SEALS MARKET, BY REGION, 2021-2030 (USD THOUSAND)
TABLE 42 GLOBAL NUCLEAR INDUSTRY IN MACHINED SEALS MARKET, BY REGION, 2021-2030 (USD THOUSAND)
TABLE 43 GLOBAL LIFE SCIENCES IN MACHINED SEALS MARKET, BY REGION, 2021-2030 (USD THOUSAND)
TABLE 44 GLOBAL SEMICONDUCTORS IN MACHINED SEALS MARKET, BY REGION, 2021-2030 (USD THOUSAND)
TABLE 45 GLOBAL SENSORS IN MACHINED SEALS MARKET, BY REGION, 2021-2030 (USD THOUSAND)
TABLE 46 GLOBAL FLOW CONTROL IN MACHINED SEALS MARKET, BY REGION, 2021-2030 (USD THOUSAND)
TABLE 47 GLOBAL VALVES IN MACHINED SEALS MARKET, BY REGION, 2021-2030 (USD THOUSAND)
TABLE 48 GLOBAL PACKAGING AND MATERIALS IN MACHINED SEALS MARKET, BY REGION, 2021-2030 (USD THOUSAND)
TABLE 49 GLOBAL MACHINED SEALS MARKET, BY REGION, 2021-2030 (USD THOUSAND)
TABLE 50 ASIA-PACIFIC MACHINED SEALS MARKET, BY COUNTRY, 2021-2030 (USD THOUSAND)
TABLE 51 ASIA-PACIFIC MACHINED SEALS MARKET, BY TYPE, 2021-2030 (USD THOUSAND)
TABLE 52 ASIA-PACIFIC MACHINED SEALS MARKET, BY PRODUCT TYPE, 2021-2030 (USD THOUSAND)
TABLE 53 ASIA-PACIFIC MACHINED SEALS MARKET, BY MATERIAL, 2021-2030 (USD THOUSAND)
TABLE 54 ASIA-PACIFIC MACHINED SEALS MARKET, BY APPLICATION, 2021-2030 (USD THOUSAND)
TABLE 55 ASIA-PACIFIC AUTOMOTIVE INDUSTRY IN MACHINED SEALS MARKET, BY TYPE, 2021-2030 (USD THOUSAND)
TABLE 56 ASIA-PACIFIC AEROSPACE & DEFENSE IN MACHINED SEALS MARKET, BY TYPE, 2021-2030 (USD THOUSAND)
TABLE 57 ASIA-PACIFIC MACHINED SEALS MARKET, BY SALES CHANNEL, 2021-2030 (USD THOUSAND)
TABLE 58 JAPAN MACHINED SEALS MARKET, BY TYPE, 2021-2030 (USD THOUSAND)
TABLE 59 JAPAN MACHINED SEALS MARKET, BY PRODUCT TYPE, 2021-2030 (USD THOUSAND)
TABLE 60 JAPAN MACHINED SEALS MARKET, BY MATERIAL, 2021-2030 (USD THOUSAND)
TABLE 61 JAPAN MACHINED SEALS MARKET, BY APPLICATION, 2021-2030 (USD THOUSAND)
TABLE 62 JAPAN AUTOMOTIVE INDUSTRY IN MACHINED SEALS MARKET, BY TYPE, 2021-2030 (USD THOUSAND)
TABLE 63 JAPAN AEROSPACE & DEFENSE IN MACHINED SEALS MARKET, BY TYPE, 2021-2030 (USD THOUSAND)
TABLE 64 JAPAN MACHINED SEALS MARKET, BY SALES CHANNEL, 2021-2030 (USD THOUSAND)
TABLE 65 CHINA MACHINED SEALS MARKET, BY TYPE, 2021-2030 (USD THOUSAND)
TABLE 66 CHINA MACHINED SEALS MARKET, BY PRODUCT TYPE, 2021-2030 (USD THOUSAND)
TABLE 67 CHINA MACHINED SEALS MARKET, BY MATERIAL, 2021-2030 (USD THOUSAND)
TABLE 68 CHINA MACHINED SEALS MARKET, BY APPLICATION, 2021-2030 (USD THOUSAND)
TABLE 69 CHINA AUTOMOTIVE INDUSTRY IN MACHINED SEALS MARKET, BY TYPE, 2021-2030 (USD THOUSAND)
TABLE 70 CHINA AEROSPACE & DEFENSE IN MACHINED SEALS MARKET, BY TYPE, 2021-2030 (USD THOUSAND)
TABLE 71 CHINA MACHINED SEALS MARKET, BY SALES CHANNEL, 2021-2030 (USD THOUSAND)
TABLE 72 INDIA MACHINED SEALS MARKET, BY TYPE, 2021-2030 (USD THOUSAND)
TABLE 73 INDIA MACHINED SEALS MARKET, BY PRODUCT TYPE, 2021-2030 (USD THOUSAND)
TABLE 74 INDIA MACHINED SEALS MARKET, BY MATERIAL, 2021-2030 (USD THOUSAND)
TABLE 75 INDIA MACHINED SEALS MARKET, BY APPLICATION, 2021-2030 (USD THOUSAND)
TABLE 76 INDIA AUTOMOTIVE INDUSTRY IN MACHINED SEALS MARKET, BY TYPE, 2021-2030 (USD THOUSAND)
TABLE 77 INDIA AEROSPACE & DEFENSE IN MACHINED SEALS MARKET, BY TYPE, 2021-2030 (USD THOUSAND)
TABLE 78 INDIA MACHINED SEALS MARKET, BY SALES CHANNEL, 2021-2030 (USD THOUSAND)
TABLE 79 TAIWAN MACHINED SEALS MARKET, BY TYPE, 2021-2030 (USD THOUSAND)
TABLE 80 TAIWAN MACHINED SEALS MARKET, BY PRODUCT TYPE, 2021-2030 (USD THOUSAND)
TABLE 81 TAIWAN MACHINED SEALS MARKET, BY MATERIAL, 2021-2030 (USD THOUSAND)
TABLE 82 TAIWAN MACHINED SEALS MARKET, BY APPLICATION, 2021-2030 (USD THOUSAND)
TABLE 83 TAIWAN AUTOMOTIVE INDUSTRY IN MACHINED SEALS MARKET, BY TYPE, 2021-2030 (USD THOUSAND)
TABLE 84 TAIWAN AEROSPACE & DEFENSE IN MACHINED SEALS MARKET, BY TYPE, 2021-2030 (USD THOUSAND)
TABLE 85 TAIWAN MACHINED SEALS MARKET, BY SALES CHANNEL, 2021-2030 (USD THOUSAND)
TABLE 86 SOUTH KOREA MACHINED SEALS MARKET, BY TYPE, 2021-2030 (USD THOUSAND)
TABLE 87 SOUTH KOREA MACHINED SEALS MARKET, BY PRODUCT TYPE, 2021-2030 (USD THOUSAND)
TABLE 88 SOUTH KOREA MACHINED SEALS MARKET, BY MATERIAL, 2021-2030 (USD THOUSAND)
TABLE 89 SOUTH KOREA MACHINED SEALS MARKET, BY APPLICATION, 2021-2030 (USD THOUSAND)
TABLE 90 SOUTH KOREA AUTOMOTIVE INDUSTRY IN MACHINED SEALS MARKET, BY TYPE, 2021-2030 (USD THOUSAND)
TABLE 91 SOUTH KOREA AEROSPACE & DEFENSE IN MACHINED SEALS MARKET, BY TYPE, 2021-2030 (USD THOUSAND)
TABLE 92 SOUTH KOREA MACHINED SEALS MARKET, BY SALES CHANNEL, 2021-2030 (USD THOUSAND)
TABLE 93 AUSTRALIA MACHINED SEALS MARKET, BY TYPE, 2021-2030 (USD THOUSAND)
TABLE 94 AUSTRALIA MACHINED SEALS MARKET, BY PRODUCT TYPE, 2021-2030 (USD THOUSAND)
TABLE 95 AUSTRALIA MACHINED SEALS MARKET, BY MATERIAL, 2021-2030 (USD THOUSAND)
TABLE 96 AUSTRALIA MACHINED SEALS MARKET, BY APPLICATION, 2021-2030 (USD THOUSAND)
TABLE 97 AUSTRALIA AUTOMOTIVE INDUSTRY IN MACHINED SEALS MARKET, BY TYPE, 2021-2030 (USD THOUSAND)
TABLE 98 AUSTRALIA AEROSPACE & DEFENSE IN MACHINED SEALS MARKET, BY TYPE, 2021-2030 (USD THOUSAND)
TABLE 99 AUSTRALIA MACHINED SEALS MARKET, BY SALES CHANNEL, 2021-2030 (USD THOUSAND)
TABLE 100 SINGAPORE MACHINED SEALS MARKET, BY TYPE, 2021-2030 (USD THOUSAND)
TABLE 101 SINGAPORE MACHINED SEALS MARKET, BY PRODUCT TYPE, 2021-2030 (USD THOUSAND)
TABLE 102 SINGAPORE MACHINED SEALS MARKET, BY MATERIAL, 2021-2030 (USD THOUSAND)
TABLE 103 SINGAPORE MACHINED SEALS MARKET, BY APPLICATION, 2021-2030 (USD THOUSAND)
TABLE 104 SINGAPORE AUTOMOTIVE INDUSTRY IN MACHINED SEALS MARKET, BY TYPE, 2021-2030 (USD THOUSAND)
TABLE 105 SINGAPORE AEROSPACE & DEFENSE IN MACHINED SEALS MARKET, BY TYPE, 2021-2030 (USD THOUSAND)
TABLE 106 SINGAPORE MACHINED SEALS MARKET, BY SALES CHANNEL, 2021-2030 (USD THOUSAND)
TABLE 107 THAILAND MACHINED SEALS MARKET, BY TYPE, 2021-2030 (USD THOUSAND)
TABLE 108 THAILAND MACHINED SEALS MARKET, BY PRODUCT TYPE, 2021-2030 (USD THOUSAND)
TABLE 109 THAILAND MACHINED SEALS MARKET, BY MATERIAL, 2021-2030 (USD THOUSAND)
TABLE 110 THAILAND MACHINED SEALS MARKET, BY APPLICATION, 2021-2030 (USD THOUSAND)
TABLE 111 THAILAND AUTOMOTIVE INDUSTRY IN MACHINED SEALS MARKET, BY TYPE, 2021-2030 (USD THOUSAND)
TABLE 112 THAILAND AEROSPACE & DEFENSE IN MACHINED SEALS MARKET, BY TYPE, 2021-2030 (USD THOUSAND)
TABLE 113 THAILAND MACHINED SEALS MARKET, BY SALES CHANNEL, 2021-2030 (USD THOUSAND)
TABLE 114 MALAYSIA MACHINED SEALS MARKET, BY TYPE, 2021-2030 (USD THOUSAND)
TABLE 115 MALAYSIA MACHINED SEALS MARKET, BY PRODUCT TYPE, 2021-2030 (USD THOUSAND)
TABLE 116 MALAYSIA MACHINED SEALS MARKET, BY MATERIAL, 2021-2030 (USD THOUSAND)
TABLE 117 MALAYSIA MACHINED SEALS MARKET, BY APPLICATION, 2021-2030 (USD THOUSAND)
TABLE 118 MALAYSIA AUTOMOTIVE INDUSTRY IN MACHINED SEALS MARKET, BY TYPE, 2021-2030 (USD THOUSAND)
TABLE 119 MALAYSIA AEROSPACE & DEFENSE IN MACHINED SEALS MARKET, BY TYPE, 2021-2030 (USD THOUSAND)
TABLE 120 MALAYSIA MACHINED SEALS MARKET, BY SALES CHANNEL, 2021-2030 (USD THOUSAND)
TABLE 121 INDONESIA MACHINED SEALS MARKET, BY TYPE, 2021-2030 (USD THOUSAND)
TABLE 122 INDONESIA MACHINED SEALS MARKET, BY PRODUCT TYPE, 2021-2030 (USD THOUSAND)
TABLE 123 INDONESIA MACHINED SEALS MARKET, BY MATERIAL, 2021-2030 (USD THOUSAND)
TABLE 124 INDONESIA MACHINED SEALS MARKET, BY APPLICATION, 2021-2030 (USD THOUSAND)
TABLE 125 INDONESIA AUTOMOTIVE INDUSTRY IN MACHINED SEALS MARKET, BY TYPE, 2021-2030 (USD THOUSAND)
TABLE 126 INDONESIA AEROSPACE & DEFENSE IN MACHINED SEALS MARKET, BY TYPE, 2021-2030 (USD THOUSAND)
TABLE 127 INDONESIA MACHINED SEALS MARKET, BY SALES CHANNEL, 2021-2030 (USD THOUSAND)
TABLE 128 PHILIPPINES MACHINED SEALS MARKET, BY TYPE, 2021-2030 (USD THOUSAND)
TABLE 129 PHILIPPINES MACHINED SEALS MARKET, BY PRODUCT TYPE, 2021-2030 (USD THOUSAND)
TABLE 130 PHILIPPINES MACHINED SEALS MARKET, BY MATERIAL, 2021-2030 (USD THOUSAND)
TABLE 131 PHILIPPINES MACHINED SEALS MARKET, BY APPLICATION, 2021-2030 (USD THOUSAND)
TABLE 132 PHILIPPINES AUTOMOTIVE INDUSTRY IN MACHINED SEALS MARKET, BY TYPE, 2021-2030 (USD THOUSAND)
TABLE 133 PHILIPPINES AEROSPACE & DEFENSE IN MACHINED SEALS MARKET, BY TYPE, 2021-2030 (USD THOUSAND)
TABLE 134 PHILIPPINES MACHINED SEALS MARKET, BY SALES CHANNEL, 2021-2030 (USD THOUSAND)
TABLE 135 NEW ZEALAND MACHINED SEALS MARKET, BY TYPE, 2021-2030 (USD THOUSAND)
TABLE 136 NEW ZEALAND MACHINED SEALS MARKET, BY PRODUCT TYPE, 2021-2030 (USD THOUSAND)
TABLE 137 NEW ZEALAND MACHINED SEALS MARKET, BY MATERIAL, 2021-2030 (USD THOUSAND)
TABLE 138 NEW ZEALAND MACHINED SEALS MARKET, BY APPLICATION, 2021-2030 (USD THOUSAND)
TABLE 139 NEW ZEALAND AUTOMOTIVE INDUSTRY IN MACHINED SEALS MARKET, BY TYPE, 2021-2030 (USD THOUSAND)
TABLE 140 NEW ZEALAND AEROSPACE & DEFENSE IN MACHINED SEALS MARKET, BY TYPE, 2021-2030 (USD THOUSAND)
TABLE 141 NEW ZEALAND MACHINED SEALS MARKET, BY SALES CHANNEL, 2021-2030 (USD THOUSAND)
TABLE 142 VIETNAM MACHINED SEALS MARKET, BY TYPE, 2021-2030 (USD THOUSAND)
TABLE 143 VIETNAM MACHINED SEALS MARKET, BY PRODUCT TYPE, 2021-2030 (USD THOUSAND)
TABLE 144 VIETNAM MACHINED SEALS MARKET, BY MATERIAL, 2021-2030 (USD THOUSAND)
TABLE 145 VIETNAM MACHINED SEALS MARKET, BY APPLICATION, 2021-2030 (USD THOUSAND)
TABLE 146 VIETNAM AUTOMOTIVE INDUSTRY IN MACHINED SEALS MARKET, BY TYPE, 2021-2030 (USD THOUSAND)
TABLE 147 VIETNAM AEROSPACE & DEFENSE IN MACHINED SEALS MARKET, BY TYPE, 2021-2030 (USD THOUSAND)
TABLE 148 VIETNAM MACHINED SEALS MARKET, BY SALES CHANNEL, 2021-2030 (USD THOUSAND)
TABLE 149 REST OF ASIA-PACIFIC MACHINED SEALS MARKET, BY TYPE, 2021-2030 (USD THOUSAND)
TABLE 150 NORTH AMERICA MACHINED SEALS MARKET, BY COUNTRY, 2021-2030 (USD THOUSAND)
TABLE 151 NORTH AMERICA MACHINED SEALS MARKET, BY TYPE, 2021-2030 (USD THOUSAND)
TABLE 152 NORTH AMERICA MACHINED SEALS MARKET, BY PRODUCT TYPE, 2021-2030 (USD THOUSAND)
TABLE 153 NORTH AMERICA MACHINED SEALS MARKET, BY MATERIAL, 2021-2030 (USD THOUSAND)
TABLE 154 NORTH AMERICA MACHINED SEALS MARKET, BY APPLICATION, 2021-2030 (USD THOUSAND)
TABLE 155 NORTH AMERICA AUTOMOTIVE INDUSTRY IN MACHINED SEALS MARKET, BY TYPE, 2021-2030 (USD THOUSAND)
TABLE 156 NORTH AMERICA AEROSPACE & DEFENSE IN MACHINED SEALS MARKET, BY TYPE, 2021-2030 (USD THOUSAND)
TABLE 157 NORTH AMERICA MACHINED SEALS MARKET, BY SALES CHANNEL, 2021-2030 (USD THOUSAND)
TABLE 158 U.S. MACHINED SEALS MARKET, BY TYPE, 2021-2030 (USD THOUSAND)
TABLE 159 U.S. MACHINED SEALS MARKET, BY PRODUCT TYPE, 2021-2030 (USD THOUSAND)
TABLE 160 U.S. MACHINED SEALS MARKET, BY MATERIAL, 2021-2030 (USD THOUSAND)
TABLE 161 U.S. MACHINED SEALS MARKET, BY APPLICATION, 2021-2030 (USD THOUSAND)
TABLE 162 U.S. AUTOMOTIVE INDUSTRY IN MACHINED SEALS MARKET, BY TYPE, 2021-2030 (USD THOUSAND)
TABLE 163 U.S. AEROSPACE & DEFENSE IN MACHINED SEALS MARKET, BY TYPE, 2021-2030 (USD THOUSAND)
TABLE 164 U.S. MACHINED SEALS MARKET, BY SALES CHANNEL, 2021-2030 (USD THOUSAND)
TABLE 165 CANADA MACHINED SEALS MARKET, BY TYPE, 2021-2030 (USD THOUSAND)
TABLE 166 CANADA MACHINED SEALS MARKET, BY PRODUCT TYPE, 2021-2030 (USD THOUSAND)
TABLE 167 CANADA MACHINED SEALS MARKET, BY MATERIAL, 2021-2030 (USD THOUSAND)
TABLE 168 CANADA MACHINED SEALS MARKET, BY APPLICATION, 2021-2030 (USD THOUSAND)
TABLE 169 CANADA AUTOMOTIVE INDUSTRY IN MACHINED SEALS MARKET, BY TYPE, 2021-2030 (USD THOUSAND)
TABLE 170 CANADA AEROSPACE & DEFENSE IN MACHINED SEALS MARKET, BY TYPE, 2021-2030 (USD THOUSAND)
TABLE 171 CANADA MACHINED SEALS MARKET, BY SALES CHANNEL, 2021-2030 (USD THOUSAND)
TABLE 172 MEXICO MACHINED SEALS MARKET, BY TYPE, 2021-2030 (USD THOUSAND)
TABLE 173 MEXICO MACHINED SEALS MARKET, BY PRODUCT TYPE, 2021-2030 (USD THOUSAND)
TABLE 174 MEXICO MACHINED SEALS MARKET, BY MATERIAL, 2021-2030 (USD THOUSAND)
TABLE 175 MEXICO MACHINED SEALS MARKET, BY APPLICATION, 2021-2030 (USD THOUSAND)
TABLE 176 MEXICO AUTOMOTIVE INDUSTRY IN MACHINED SEALS MARKET, BY TYPE, 2021-2030 (USD THOUSAND)
TABLE 177 MEXICO AEROSPACE & DEFENSE IN MACHINED SEALS MARKET, BY TYPE, 2021-2030 (USD THOUSAND)
TABLE 178 MEXICO MACHINED SEALS MARKET, BY SALES CHANNEL, 2021-2030 (USD THOUSAND)
TABLE 179 EUROPE MACHINED SEALS MARKET, BY COUNTRY, 2021-2030 (USD THOUSAND)
TABLE 180 EUROPE MACHINED SEALS MARKET, BY TYPE, 2021-2030 (USD THOUSAND)
TABLE 181 EUROPE MACHINED SEALS MARKET, BY PRODUCT TYPE, 2021-2030 (USD THOUSAND)
TABLE 182 EUROPE MACHINED SEALS MARKET, BY MATERIAL, 2021-2030 (USD THOUSAND)
TABLE 183 EUROPE MACHINED SEALS MARKET, BY APPLICATION, 2021-2030 (USD THOUSAND)
TABLE 184 EUROPE AUTOMOTIVE INDUSTRY IN MACHINED SEALS MARKET, BY TYPE, 2021-2030 (USD THOUSAND)
TABLE 185 EUROPE AEROSPACE & DEFENSE IN MACHINED SEALS MARKET, BY TYPE, 2021-2030 (USD THOUSAND)
TABLE 186 EUROPE MACHINED SEALS MARKET, BY SALES CHANNEL, 2021-2030 (USD THOUSAND)
TABLE 187 GERMANY MACHINED SEALS MARKET, BY TYPE, 2021-2030 (USD THOUSAND)
TABLE 188 GERMANY MACHINED SEALS MARKET, BY PRODUCT TYPE, 2021-2030 (USD THOUSAND)
TABLE 189 GERMANY MACHINED SEALS MARKET, BY MATERIAL, 2021-2030 (USD THOUSAND)
TABLE 190 GERMANY MACHINED SEALS MARKET, BY APPLICATION, 2021-2030 (USD THOUSAND)
TABLE 191 GERMANY AUTOMOTIVE INDUSTRY IN MACHINED SEALS MARKET, BY TYPE, 2021-2030 (USD THOUSAND)
TABLE 192 GERMANY AEROSPACE & DEFENSE IN MACHINED SEALS MARKET, BY TYPE, 2021-2030 (USD THOUSAND)
TABLE 193 GERMANY MACHINED SEALS MARKET, BY SALES CHANNEL, 2021-2030 (USD THOUSAND)
TABLE 194 ITALY MACHINED SEALS MARKET, BY TYPE, 2021-2030 (USD THOUSAND)
TABLE 195 ITALY MACHINED SEALS MARKET, BY PRODUCT TYPE, 2021-2030 (USD THOUSAND)
TABLE 196 ITALY MACHINED SEALS MARKET, BY MATERIAL, 2021-2030 (USD THOUSAND)
TABLE 197 ITALY MACHINED SEALS MARKET, BY APPLICATION, 2021-2030 (USD THOUSAND)
TABLE 198 ITALY AUTOMOTIVE INDUSTRY IN MACHINED SEALS MARKET, BY TYPE, 2021-2030 (USD THOUSAND)
TABLE 199 ITALY AEROSPACE & DEFENSE IN MACHINED SEALS MARKET, BY TYPE, 2021-2030 (USD THOUSAND)
TABLE 200 ITALY MACHINED SEALS MARKET, BY SALES CHANNEL, 2021-2030 (USD THOUSAND)
TABLE 201 FRANCE MACHINED SEALS MARKET, BY TYPE, 2021-2030 (USD THOUSAND)
TABLE 202 FRANCE MACHINED SEALS MARKET, BY PRODUCT TYPE, 2021-2030 (USD THOUSAND)
TABLE 203 FRANCE MACHINED SEALS MARKET, BY MATERIAL, 2021-2030 (USD THOUSAND)
TABLE 204 FRANCE MACHINED SEALS MARKET, BY APPLICATION, 2021-2030 (USD THOUSAND)
TABLE 205 FRANCE AUTOMOTIVE INDUSTRY IN MACHINED SEALS MARKET, BY TYPE, 2021-2030 (USD THOUSAND)
TABLE 206 FRANCE AEROSPACE & DEFENSE IN MACHINED SEALS MARKET, BY TYPE, 2021-2030 (USD THOUSAND)
TABLE 207 FRANCE MACHINED SEALS MARKET, BY SALES CHANNEL, 2021-2030 (USD THOUSAND)
TABLE 208 U.K. MACHINED SEALS MARKET, BY TYPE, 2021-2030 (USD THOUSAND)
TABLE 209 U.K. MACHINED SEALS MARKET, BY PRODUCT TYPE, 2021-2030 (USD THOUSAND)
TABLE 210 U.K. MACHINED SEALS MARKET, BY MATERIAL, 2021-2030 (USD THOUSAND)
TABLE 211 U.K. MACHINED SEALS MARKET, BY APPLICATION, 2021-2030 (USD THOUSAND)
TABLE 212 U.K. AUTOMOTIVE INDUSTRY IN MACHINED SEALS MARKET, BY TYPE, 2021-2030 (USD THOUSAND)
TABLE 213 U.K. AEROSPACE & DEFENSE IN MACHINED SEALS MARKET, BY TYPE, 2021-2030 (USD THOUSAND)
TABLE 214 U.K. MACHINED SEALS MARKET, BY SALES CHANNEL, 2021-2030 (USD THOUSAND)
TABLE 215 SPAIN MACHINED SEALS MARKET, BY TYPE, 2021-2030 (USD THOUSAND)
TABLE 216 SPAIN MACHINED SEALS MARKET, BY PRODUCT TYPE, 2021-2030 (USD THOUSAND)
TABLE 217 SPAIN MACHINED SEALS MARKET, BY MATERIAL, 2021-2030 (USD THOUSAND)
TABLE 218 SPAIN MACHINED SEALS MARKET, BY APPLICATION, 2021-2030 (USD THOUSAND)
TABLE 219 SPAIN AUTOMOTIVE INDUSTRY IN MACHINED SEALS MARKET, BY TYPE, 2021-2030 (USD THOUSAND)
TABLE 220 SPAIN AEROSPACE & DEFENSE IN MACHINED SEALS MARKET, BY TYPE, 2021-2030 (USD THOUSAND)
TABLE 221 SPAIN MACHINED SEALS MARKET, BY SALES CHANNEL, 2021-2030 (USD THOUSAND)
TABLE 222 RUSSIA MACHINED SEALS MARKET, BY TYPE, 2021-2030 (USD THOUSAND)
TABLE 223 RUSSIA MACHINED SEALS MARKET, BY PRODUCT TYPE, 2021-2030 (USD THOUSAND)
TABLE 224 RUSSIA MACHINED SEALS MARKET, BY MATERIAL, 2021-2030 (USD THOUSAND)
TABLE 225 RUSSIA MACHINED SEALS MARKET, BY APPLICATION, 2021-2030 (USD THOUSAND)
TABLE 226 RUSSIA AUTOMOTIVE INDUSTRY IN MACHINED SEALS MARKET, BY TYPE, 2021-2030 (USD THOUSAND)
TABLE 227 RUSSIA AEROSPACE & DEFENSE IN MACHINED SEALS MARKET, BY TYPE, 2021-2030 (USD THOUSAND)
TABLE 228 RUSSIA MACHINED SEALS MARKET, BY SALES CHANNEL, 2021-2030 (USD THOUSAND)
TABLE 229 TURKEY MACHINED SEALS MARKET, BY TYPE, 2021-2030 (USD THOUSAND)
TABLE 230 TURKEY MACHINED SEALS MARKET, BY PRODUCT TYPE, 2021-2030 (USD THOUSAND)
TABLE 231 TURKEY MACHINED SEALS MARKET, BY MATERIAL, 2021-2030 (USD THOUSAND)
TABLE 232 TURKEY MACHINED SEALS MARKET, BY APPLICATION, 2021-2030 (USD THOUSAND)
TABLE 233 TURKEY AUTOMOTIVE INDUSTRY IN MACHINED SEALS MARKET, BY TYPE, 2021-2030 (USD THOUSAND)
TABLE 234 TURKEY AEROSPACE & DEFENSE IN MACHINED SEALS MARKET, BY TYPE, 2021-2030 (USD THOUSAND)
TABLE 235 TURKEY MACHINED SEALS MARKET, BY SALES CHANNEL, 2021-2030 (USD THOUSAND)
TABLE 236 BELGIUM MACHINED SEALS MARKET, BY TYPE, 2021-2030 (USD THOUSAND)
TABLE 237 BELGIUM MACHINED SEALS MARKET, BY PRODUCT TYPE, 2021-2030 (USD THOUSAND)
TABLE 238 BELGIUM MACHINED SEALS MARKET, BY MATERIAL, 2021-2030 (USD THOUSAND)
TABLE 239 BELGIUM MACHINED SEALS MARKET, BY APPLICATION, 2021-2030 (USD THOUSAND)
TABLE 240 BELGIUM AUTOMOTIVE INDUSTRY IN MACHINED SEALS MARKET, BY TYPE, 2021-2030 (USD THOUSAND)
TABLE 241 BELGIUM AEROSPACE & DEFENSE IN MACHINED SEALS MARKET, BY TYPE, 2021-2030 (USD THOUSAND)
TABLE 242 BELGIUM MACHINED SEALS MARKET, BY SALES CHANNEL, 2021-2030 (USD THOUSAND)
TABLE 243 NETHERLANDS MACHINED SEALS MARKET, BY TYPE, 2021-2030 (USD THOUSAND)
TABLE 244 NETHERLANDS MACHINED SEALS MARKET, BY PRODUCT TYPE, 2021-2030 (USD THOUSAND)
TABLE 245 NETHERLANDS MACHINED SEALS MARKET, BY MATERIAL, 2021-2030 (USD THOUSAND)
TABLE 246 NETHERLANDS MACHINED SEALS MARKET, BY APPLICATION, 2021-2030 (USD THOUSAND)
TABLE 247 NETHERLANDS AUTOMOTIVE INDUSTRY IN MACHINED SEALS MARKET, BY TYPE, 2021-2030 (USD THOUSAND)
TABLE 248 NETHERLANDS AEROSPACE & DEFENSE IN MACHINED SEALS MARKET, BY TYPE, 2021-2030 (USD THOUSAND)
TABLE 249 NETHERLANDS MACHINED SEALS MARKET, BY SALES CHANNEL, 2021-2030 (USD THOUSAND)
TABLE 250 SWITZERLAND MACHINED SEALS MARKET, BY TYPE, 2021-2030 (USD THOUSAND)
TABLE 251 SWITZERLAND MACHINED SEALS MARKET, BY PRODUCT TYPE, 2021-2030 (USD THOUSAND)
TABLE 252 SWITZERLAND MACHINED SEALS MARKET, BY MATERIAL, 2021-2030 (USD THOUSAND)
TABLE 253 SWITZERLAND MACHINED SEALS MARKET, BY APPLICATION, 2021-2030 (USD THOUSAND)
TABLE 254 SWITZERLAND AUTOMOTIVE INDUSTRY IN MACHINED SEALS MARKET, BY TYPE, 2021-2030 (USD THOUSAND)
TABLE 255 SWITZERLAND AEROSPACE & DEFENSE IN MACHINED SEALS MARKET, BY TYPE, 2021-2030 (USD THOUSAND)
TABLE 256 SWITZERLAND MACHINED SEALS MARKET, BY SALES CHANNEL, 2021-2030 (USD THOUSAND)
TABLE 257 DENMARK MACHINED SEALS MARKET, BY TYPE, 2021-2030 (USD THOUSAND)
TABLE 258 DENMARK MACHINED SEALS MARKET, BY PRODUCT TYPE, 2021-2030 (USD THOUSAND)
TABLE 259 DENMARK MACHINED SEALS MARKET, BY MATERIAL, 2021-2030 (USD THOUSAND)
TABLE 260 DENMARK MACHINED SEALS MARKET, BY APPLICATION, 2021-2030 (USD THOUSAND)
TABLE 261 DENMARK AUTOMOTIVE INDUSTRY IN MACHINED SEALS MARKET, BY TYPE, 2021-2030 (USD THOUSAND)
TABLE 262 DENMARK AEROSPACE & DEFENSE IN MACHINED SEALS MARKET, BY TYPE, 2021-2030 (USD THOUSAND)
TABLE 263 DENMARK MACHINED SEALS MARKET, BY SALES CHANNEL, 2021-2030 (USD THOUSAND)
TABLE 264 SWEDEN MACHINED SEALS MARKET, BY TYPE, 2021-2030 (USD THOUSAND)
TABLE 265 SWEDEN MACHINED SEALS MARKET, BY PRODUCT TYPE, 2021-2030 (USD THOUSAND)
TABLE 266 SWEDEN MACHINED SEALS MARKET, BY MATERIAL, 2021-2030 (USD THOUSAND)
TABLE 267 SWEDEN MACHINED SEALS MARKET, BY APPLICATION, 2021-2030 (USD THOUSAND)
TABLE 268 SWEDEN AUTOMOTIVE INDUSTRY IN MACHINED SEALS MARKET, BY TYPE, 2021-2030 (USD THOUSAND)
TABLE 269 SWEDEN AEROSPACE & DEFENSE IN MACHINED SEALS MARKET, BY TYPE, 2021-2030 (USD THOUSAND)
TABLE 270 SWEDEN MACHINED SEALS MARKET, BY SALES CHANNEL, 2021-2030 (USD THOUSAND)
TABLE 271 POLAND MACHINED SEALS MARKET, BY TYPE, 2021-2030 (USD THOUSAND)
TABLE 272 POLAND MACHINED SEALS MARKET, BY PRODUCT TYPE, 2021-2030 (USD THOUSAND)
TABLE 273 POLAND MACHINED SEALS MARKET, BY MATERIAL, 2021-2030 (USD THOUSAND)
TABLE 274 POLAND MACHINED SEALS MARKET, BY APPLICATION, 2021-2030 (USD THOUSAND)
TABLE 275 POLAND AUTOMOTIVE INDUSTRY IN MACHINED SEALS MARKET, BY TYPE, 2021-2030 (USD THOUSAND)
TABLE 276 POLAND AEROSPACE & DEFENSE IN MACHINED SEALS MARKET, BY TYPE, 2021-2030 (USD THOUSAND)
TABLE 277 POLAND MACHINED SEALS MARKET, BY SALES CHANNEL, 2021-2030 (USD THOUSAND)
TABLE 278 NORWAY MACHINED SEALS MARKET, BY TYPE, 2021-2030 (USD THOUSAND)
TABLE 279 NORWAY MACHINED SEALS MARKET, BY PRODUCT TYPE, 2021-2030 (USD THOUSAND)
TABLE 280 NORWAY MACHINED SEALS MARKET, BY MATERIAL, 2021-2030 (USD THOUSAND)
TABLE 281 NORWAY MACHINED SEALS MARKET, BY APPLICATION, 2021-2030 (USD THOUSAND)
TABLE 282 NORWAY AUTOMOTIVE INDUSTRY IN MACHINED SEALS MARKET, BY TYPE, 2021-2030 (USD THOUSAND)
TABLE 283 NORWAY AEROSPACE & DEFENSE IN MACHINED SEALS MARKET, BY TYPE, 2021-2030 (USD THOUSAND)
TABLE 284 NORWAY MACHINED SEALS MARKET, BY SALES CHANNEL, 2021-2030 (USD THOUSAND)
TABLE 285 FINLAND MACHINED SEALS MARKET, BY TYPE, 2021-2030 (USD THOUSAND)
TABLE 286 FINLAND MACHINED SEALS MARKET, BY PRODUCT TYPE, 2021-2030 (USD THOUSAND)
TABLE 287 FINLAND MACHINED SEALS MARKET, BY MATERIAL, 2021-2030 (USD THOUSAND)
TABLE 288 FINLAND MACHINED SEALS MARKET, BY APPLICATION, 2021-2030 (USD THOUSAND)
TABLE 289 FINLAND AUTOMOTIVE INDUSTRY IN MACHINED SEALS MARKET, BY TYPE, 2021-2030 (USD THOUSAND)
TABLE 290 FINLAND AEROSPACE & DEFENSE IN MACHINED SEALS MARKET, BY TYPE, 2021-2030 (USD THOUSAND)
TABLE 291 FINLAND MACHINED SEALS MARKET, BY SALES CHANNEL, 2021-2030 (USD THOUSAND)
TABLE 292 REST OF EUROPE MACHINED SEALS MARKET, BY TYPE, 2021-2030 (USD THOUSAND)
TABLE 293 MIDDLE EAST & AFRICA MACHINED SEALS MARKET, BY COUNTRY, 2021-2030 (USD THOUSAND)
TABLE 294 MIDDLE EAST & AFRICA MACHINED SEALS MARKET, BY TYPE, 2021-2030 (USD THOUSAND)
TABLE 295 MIDDLE EAST & AFRICA MACHINED SEALS MARKET, BY PRODUCT TYPE, 2021-2030 (USD THOUSAND)
TABLE 296 MIDDLE EAST & AFRICA MACHINED SEALS MARKET, BY MATERIAL, 2021-2030 (USD THOUSAND)
TABLE 297 MIDDLE EAST & AFRICA MACHINED SEALS MARKET, BY APPLICATION, 2021-2030 (USD THOUSAND)
TABLE 298 MIDDLE EAST & AFRICA AUTOMOTIVE INDUSTRY IN MACHINED SEALS MARKET, BY TYPE, 2021-2030 (USD THOUSAND)
TABLE 299 MIDDLE EAST & AFRICA AEROSPACE & DEFENSE IN MACHINED SEALS MARKET, BY TYPE, 2021-2030 (USD THOUSAND)
TABLE 300 MIDDLE EAST & AFRICA MACHINED SEALS MARKET, BY SALES CHANNEL, 2021-2030 (USD THOUSAND)
TABLE 301 SAUDI ARABIA MACHINED SEALS MARKET, BY TYPE, 2021-2030 (USD THOUSAND)
TABLE 302 SAUDI ARABIA MACHINED SEALS MARKET, BY PRODUCT TYPE, 2021-2030 (USD THOUSAND)
TABLE 303 SAUDI ARABIA MACHINED SEALS MARKET, BY MATERIAL, 2021-2030 (USD THOUSAND)
TABLE 304 SAUDI ARABIA MACHINED SEALS MARKET, BY APPLICATION, 2021-2030 (USD THOUSAND)
TABLE 305 SAUDI ARABIA AUTOMOTIVE INDUSTRY IN MACHINED SEALS MARKET, BY TYPE, 2021-2030 (USD THOUSAND)
TABLE 306 SAUDI ARABIA AEROSPACE & DEFENSE IN MACHINED SEALS MARKET, BY TYPE, 2021-2030 (USD THOUSAND)
TABLE 307 SAUDI ARABIA MACHINED SEALS MARKET, BY SALES CHANNEL, 2021-2030 (USD THOUSAND)
TABLE 308 UNITED ARAB EMIRATES MACHINED SEALS MARKET, BY TYPE, 2021-2030 (USD THOUSAND)
TABLE 309 UNITED ARAB EMIRATES MACHINED SEALS MARKET, BY PRODUCT TYPE, 2021-2030 (USD THOUSAND)
TABLE 310 UNITED ARAB EMIRATES MACHINED SEALS MARKET, BY MATERIAL, 2021-2030 (USD THOUSAND)
TABLE 311 UNITED ARAB EMIRATES MACHINED SEALS MARKET, BY APPLICATION, 2021-2030 (USD THOUSAND)
TABLE 312 UNITED ARAB EMIRATES AUTOMOTIVE INDUSTRY IN MACHINED SEALS MARKET, BY TYPE, 2021-2030 (USD THOUSAND)
TABLE 313 UNITED ARAB EMIRATES AEROSPACE & DEFENSE IN MACHINED SEALS MARKET, BY TYPE, 2021-2030 (USD THOUSAND)
TABLE 314 UNITED ARAB EMIRATES MACHINED SEALS MARKET, BY SALES CHANNEL, 2021-2030 (USD THOUSAND)
TABLE 315 KUWAIT MACHINED SEALS MARKET, BY TYPE, 2021-2030 (USD THOUSAND)
TABLE 316 KUWAIT MACHINED SEALS MARKET, BY PRODUCT TYPE, 2021-2030 (USD THOUSAND)
TABLE 317 KUWAIT MACHINED SEALS MARKET, BY MATERIAL, 2021-2030 (USD THOUSAND)
TABLE 318 KUWAIT MACHINED SEALS MARKET, BY APPLICATION, 2021-2030 (USD THOUSAND)
TABLE 319 KUWAIT AUTOMOTIVE INDUSTRY IN MACHINED SEALS MARKET, BY TYPE, 2021-2030 (USD THOUSAND)
TABLE 320 KUWAIT AEROSPACE & DEFENSE IN MACHINED SEALS MARKET, BY TYPE, 2021-2030 (USD THOUSAND)
TABLE 321 KUWAIT MACHINED SEALS MARKET, BY SALES CHANNEL, 2021-2030 (USD THOUSAND)
TABLE 322 QATAR MACHINED SEALS MARKET, BY TYPE, 2021-2030 (USD THOUSAND)
TABLE 323 QATAR MACHINED SEALS MARKET, BY PRODUCT TYPE, 2021-2030 (USD THOUSAND)
TABLE 324 QATAR MACHINED SEALS MARKET, BY MATERIAL, 2021-2030 (USD THOUSAND)
TABLE 325 QATAR MACHINED SEALS MARKET, BY APPLICATION, 2021-2030 (USD THOUSAND)
TABLE 326 QATAR AUTOMOTIVE INDUSTRY IN MACHINED SEALS MARKET, BY TYPE, 2021-2030 (USD THOUSAND)
TABLE 327 QATAR AEROSPACE & DEFENSE IN MACHINED SEALS MARKET, BY TYPE, 2021-2030 (USD THOUSAND)
TABLE 328 QATAR MACHINED SEALS MARKET, BY SALES CHANNEL, 2021-2030 (USD THOUSAND)
TABLE 329 OMAN MACHINED SEALS MARKET, BY TYPE, 2021-2030 (USD THOUSAND)
TABLE 330 OMAN MACHINED SEALS MARKET, BY PRODUCT TYPE, 2021-2030 (USD THOUSAND)
TABLE 331 OMAN MACHINED SEALS MARKET, BY MATERIAL, 2021-2030 (USD THOUSAND)
TABLE 332 OMAN MACHINED SEALS MARKET, BY APPLICATION, 2021-2030 (USD THOUSAND)
TABLE 333 OMAN AUTOMOTIVE INDUSTRY IN MACHINED SEALS MARKET, BY TYPE, 2021-2030 (USD THOUSAND)
TABLE 334 OMAN AEROSPACE & DEFENSE IN MACHINED SEALS MARKET, BY TYPE, 2021-2030 (USD THOUSAND)
TABLE 335 OMAN MACHINED SEALS MARKET, BY SALES CHANNEL, 2021-2030 (USD THOUSAND)
TABLE 336 BAHRAIN MACHINED SEALS MARKET, BY TYPE, 2021-2030 (USD THOUSAND)
TABLE 337 BAHRAIN MACHINED SEALS MARKET, BY PRODUCT TYPE, 2021-2030 (USD THOUSAND)
TABLE 338 BAHRAIN MACHINED SEALS MARKET, BY MATERIAL, 2021-2030 (USD THOUSAND)
TABLE 339 BAHRAIN MACHINED SEALS MARKET, BY APPLICATION, 2021-2030 (USD THOUSAND)
TABLE 340 BAHRAIN AUTOMOTIVE INDUSTRY IN MACHINED SEALS MARKET, BY TYPE, 2021-2030 (USD THOUSAND)
TABLE 341 BAHRAIN AEROSPACE & DEFENSE IN MACHINED SEALS MARKET, BY TYPE, 2021-2030 (USD THOUSAND)
TABLE 342 BAHRAIN MACHINED SEALS MARKET, BY SALES CHANNEL, 2021-2030 (USD THOUSAND)
TABLE 343 EGYPT MACHINED SEALS MARKET, BY TYPE, 2021-2030 (USD THOUSAND)
TABLE 344 EGYPT MACHINED SEALS MARKET, BY PRODUCT TYPE, 2021-2030 (USD THOUSAND)
TABLE 345 EGYPT MACHINED SEALS MARKET, BY MATERIAL, 2021-2030 (USD THOUSAND)
TABLE 346 EGYPT MACHINED SEALS MARKET, BY APPLICATION, 2021-2030 (USD THOUSAND)
TABLE 347 EGYPT AUTOMOTIVE INDUSTRY IN MACHINED SEALS MARKET, BY TYPE, 2021-2030 (USD THOUSAND)
TABLE 348 EGYPT AEROSPACE & DEFENSE IN MACHINED SEALS MARKET, BY TYPE, 2021-2030 (USD THOUSAND)
TABLE 349 EGYPT MACHINED SEALS MARKET, BY SALES CHANNEL, 2021-2030 (USD THOUSAND)
TABLE 350 ISRAEL MACHINED SEALS MARKET, BY TYPE, 2021-2030 (USD THOUSAND)
TABLE 351 ISRAEL MACHINED SEALS MARKET, BY PRODUCT TYPE, 2021-2030 (USD THOUSAND)
TABLE 352 ISRAEL MACHINED SEALS MARKET, BY MATERIAL, 2021-2030 (USD THOUSAND)
TABLE 353 ISRAEL MACHINED SEALS MARKET, BY APPLICATION, 2021-2030 (USD THOUSAND)
TABLE 354 ISRAEL AUTOMOTIVE INDUSTRY IN MACHINED SEALS MARKET, BY TYPE, 2021-2030 (USD THOUSAND)
TABLE 355 ISRAEL AEROSPACE & DEFENSE IN MACHINED SEALS MARKET, BY TYPE, 2021-2030 (USD THOUSAND)
TABLE 356 ISRAEL MACHINED SEALS MARKET, BY SALES CHANNEL, 2021-2030 (USD THOUSAND)
TABLE 357 SOUTH AFRICA MACHINED SEALS MARKET, BY TYPE, 2021-2030 (USD THOUSAND)
TABLE 358 SOUTH AFRICA MACHINED SEALS MARKET, BY PRODUCT TYPE, 2021-2030 (USD THOUSAND)
TABLE 359 SOUTH AFRICA MACHINED SEALS MARKET, BY MATERIAL, 2021-2030 (USD THOUSAND)
TABLE 360 SOUTH AFRICA MACHINED SEALS MARKET, BY APPLICATION, 2021-2030 (USD THOUSAND)
TABLE 361 SOUTH AFRICA AUTOMOTIVE INDUSTRY IN MACHINED SEALS MARKET, BY TYPE, 2021-2030 (USD THOUSAND)
TABLE 362 SOUTH AFRICA AEROSPACE & DEFENSE IN MACHINED SEALS MARKET, BY TYPE, 2021-2030 (USD THOUSAND)
TABLE 363 SOUTH AFRICA MACHINED SEALS MARKET, BY SALES CHANNEL, 2021-2030 (USD THOUSAND)
TABLE 364 REST OF MIDDLE EAST AND AFRICA MACHINED SEALS MARKET, BY TYPE, 2021-2030 (USD THOUSAND)
TABLE 365 SOUTH AMERICA MACHINED SEALS MARKET, BY COUNTRY, 2021-2030 (USD THOUSAND)
TABLE 366 SOUTH AMERICA MACHINED SEALS MARKET, BY TYPE, 2021-2030 (USD THOUSAND)
TABLE 367 SOUTH AMERICA MACHINED SEALS MARKET, BY PRODUCT TYPE, 2021-2030 (USD THOUSAND)
TABLE 368 SOUTH AMERICA MACHINED SEALS MARKET, BY MATERIAL, 2021-2030 (USD THOUSAND)
TABLE 369 SOUTH AMERICA MACHINED SEALS MARKET, BY APPLICATION, 2021-2030 (USD THOUSAND)
TABLE 370 SOUTH AMERICA AUTOMOTIVE INDUSTRY IN MACHINED SEALS MARKET, BY TYPE, 2021-2030 (USD THOUSAND)
TABLE 371 SOUTH AMERICA AEROSPACE & DEFENSE IN MACHINED SEALS MARKET, BY TYPE, 2021-2030 (USD THOUSAND)
TABLE 372 SOUTH AMERICA MACHINED SEALS MARKET, BY SALES CHANNEL, 2021-2030 (USD THOUSAND)
TABLE 373 BRAZIL MACHINED SEALS MARKET, BY TYPE, 2021-2030 (USD THOUSAND)
TABLE 374 BRAZIL MACHINED SEALS MARKET, BY PRODUCT TYPE, 2021-2030 (USD THOUSAND)
TABLE 375 BRAZIL MACHINED SEALS MARKET, BY MATERIAL, 2021-2030 (USD THOUSAND)
TABLE 376 BRAZIL MACHINED SEALS MARKET, BY APPLICATION, 2021-2030 (USD THOUSAND)
TABLE 377 BRAZIL AUTOMOTIVE INDUSTRY IN MACHINED SEALS MARKET, BY TYPE, 2021-2030 (USD THOUSAND)
TABLE 378 BRAZIL AEROSPACE & DEFENSE IN MACHINED SEALS MARKET, BY TYPE, 2021-2030 (USD THOUSAND)
TABLE 379 BRAZIL MACHINED SEALS MARKET, BY SALES CHANNEL, 2021-2030 (USD THOUSAND)
TABLE 380 ARGENTINA MACHINED SEALS MARKET, BY TYPE, 2021-2030 (USD THOUSAND)
TABLE 381 ARGENTINA MACHINED SEALS MARKET, BY PRODUCT TYPE, 2021-2030 (USD THOUSAND)
TABLE 382 ARGENTINA MACHINED SEALS MARKET, BY MATERIAL, 2021-2030 (USD THOUSAND)
TABLE 383 ARGENTINA MACHINED SEALS MARKET, BY APPLICATION, 2021-2030 (USD THOUSAND)
TABLE 384 ARGENTINA AUTOMOTIVE INDUSTRY IN MACHINED SEALS MARKET, BY TYPE, 2021-2030 (USD THOUSAND)
TABLE 385 ARGENTINA AEROSPACE & DEFENSE IN MACHINED SEALS MARKET, BY TYPE, 2021-2030 (USD THOUSAND)
TABLE 386 ARGENTINA MACHINED SEALS MARKET, BY SALES CHANNEL, 2021-2030 (USD THOUSAND)
TABLE 387 REST OF SOUTH AMERICA MACHINED SEALS MARKET, BY TYPE, 2021-2030 (USD THOUSAND)
List of Figure
FIGURE 1 GLOBAL MACHINED SEALS MARKET
FIGURE 2 GLOBAL MACHINED SEALS MARKET: DATA TRIANGULATION
FIGURE 3 GLOBAL MACHINED SEALS MARKET: DROC ANALYSIS
FIGURE 4 GLOBAL MACHINED SEALS MARKET: GLOBAL VS REGIONAL MARKET ANALYSIS
FIGURE 5 GLOBAL MACHINED SEALS MARKET: COMPANY RESEARCH ANALYSIS
FIGURE 6 GLOBAL MACHINED SEALS MARKET: THE TYPE LIFE LINE CURVE
FIGURE 7 GLOBAL MACHINED SEALS MARKET: MULTIVARIATE MODELLING
FIGURE 8 GLOBAL MACHINED SEALS MARKET: INTERVIEW DEMOGRAPHICS
FIGURE 9 GLOBAL MACHINED SEALS MARKET: DBMR MARKET POSITION GRID
FIGURE 10 GLOBAL MACHINED SEALS MARKET: MARKET APPLICATION COVERAGE GRID
FIGURE 11 GLOBAL MACHINED SEALS MARKET: THE MARKET CHALLENGE MATRIX
FIGURE 12 GLOBAL MACHINED SEALS MARKET: VENDOR SHARE ANALYSIS
FIGURE 13 GLOBAL MACHINED SEALS MARKET: SEGMENTATION
FIGURE 14 ASIA-PACIFIC IS EXPECTED TO DOMINATE THE GLOBAL MACHINED SEALS MARKET, WHILE NORTH AMERICA IS EXPECTED TO GROW WITH THE HIGHEST CAGR IN THE FORECAST PERIOD
FIGURE 15 THE GROWING ADOPTION OF CUSTOMIZED ELASTOMERIC SEALS IS EXPECTED TO DRIVE THE GLOBAL MACHINED SEALS MARKET IN THE FORECAST PERIOD
FIGURE 16 THE FLUID POWER SEALS SEGMENT IS EXPECTED TO ACCOUNT FOR THE LARGEST SHARE OF THE GLOBAL MACHINED SEALS MARKET IN 2023 & 2030
FIGURE 17 ASIA-PACIFIC IS THE FASTEST-GROWING MARKET FOR THE MACHINED SEALS MARKET MANUFACTURERS IN THE FORECAST PERIOD
FIGURE 18 IMPORT-EXPORT SCENARIO (USD THOUSAND)
FIGURE 19 GLOBAL MACHINED SEALS MARKET: PRODUCTION AND CONSUMPTION ANALYSIS, 2021-2023 (USD THOUSAND)
FIGURE 20 DRIVERS, RESTRAINTS, OPPORTUNITIES, AND CHALLENGES OF THE GLOBAL MACHINED SEALS MARKET
FIGURE 21 GLOBAL MACHINED SEALS MARKET: BY TYPE, 2022
FIGURE 22 GLOBAL MACHINED SEALS MARKET: BY PRODUCT TYPE, 2022
FIGURE 23 GLOBAL MACHINED SEALS MARKET: BY MATERIAL, 2022
FIGURE 24 GLOBAL MACHINED SEALS MARKET: SALES CHANNEL, 2022
FIGURE 25 GLOBAL MACHINED SEALS MARKET: BY APPLICATION, 2022
FIGURE 26 GLOBAL MACHINED SEALS MARKET: SNAPSHOT (2022)
FIGURE 27 GLOBAL MACHINED SEALS MARKET: BY REGION (2022)
FIGURE 28 GLOBAL MACHINED SEALS MARKET: BY REGION (2023 & 2030)
FIGURE 29 GLOBAL MACHINED SEALS MARKET: BY REGION (2022 & 2030)
FIGURE 30 GLOBAL MACHINED SEALS MARKET: BY TYPE (2023-2030)
FIGURE 31 ASIA-PACIFIC MACHINED SEALS MARKET: SNAPSHOT (2022)
FIGURE 32 ASIA-PACIFIC MACHINED SEALS MARKET: BY COUNTRY (2022)
FIGURE 33 ASIA-PACIFIC MACHINED SEALS MARKET: BY COUNTRY (2023 & 2030)
FIGURE 34 ASIA-PACIFIC MACHINED SEALS MARKET: BY COUNTRY (2022 & 2030)
FIGURE 35 ASIA-PACIFIC MACHINED SEALS MARKET: BY TYPE (2023-2030)
FIGURE 36 NORTH AMERICA MACHINED SEALS MARKET: SNAPSHOT (2022)
FIGURE 37 NORTH AMERICA MACHINED SEALS MARKET: BY COUNTRY (2022)
FIGURE 38 NORTH AMERICA MACHINED SEALS MARKET: BY COUNTRY (2023 & 2030)
FIGURE 39 NORTH AMERICA MACHINED SEALS MARKET: BY COUNTRY (2022 & 2030)
FIGURE 40 NORTH AMERICA MACHINED SEALS MARKET: BY TYPE (2023-2030)
FIGURE 41 EUROPE MACHINED SEALS MARKET: SNAPSHOT (2022)
FIGURE 42 EUROPE MACHINED SEALS MARKET: BY COUNTRY (2022)
FIGURE 43 EUROPE MACHINED SEALS MARKET: BY COUNTRY (2023 & 2030)
FIGURE 44 EUROPE MACHINED SEALS MARKET: BY COUNTRY (2022 & 2030)
FIGURE 45 EUROPE MACHINED SEALS MARKET: BY TYPE (2023-2030)
FIGURE 46 MIDDLE EAST AND AFRICA MACHINED SEALS MARKET: SNAPSHOT (2022)
FIGURE 47 MIDDLE EAST AND AFRICA MACHINED SEALS MARKET: BY COUNTRY (2022)
FIGURE 48 MIDDLE EAST AND AFRICA MACHINED SEALS MARKET: BY COUNTRY (2023 & 2030)
FIGURE 49 MIDDLE EAST AND AFRICA MACHINED SEALS MARKET: BY COUNTRY (2022 & 2030)
FIGURE 50 MIDDLE EAST AND AFRICA MACHINED SEALS MARKET: BY TYPE (2023-2030)
FIGURE 51 SOUTH AMERICA MACHINED SEALS MARKET: SNAPSHOT (2022)
FIGURE 52 SOUTH AMERICA MACHINED SEALS MARKET: BY COUNTRY (2022)
FIGURE 53 SOUTH AMERICA MACHINED SEALS MARKET: BY COUNTRY (2023 & 2030)
FIGURE 54 SOUTH AMERICA MACHINED SEALS MARKET: BY COUNTRY (2022 & 2030)
FIGURE 55 SOUTH AMERICA MACHINED SEALS MARKET: BY TYPE (2023-2030)
FIGURE 56 GLOBAL MACHINED SEALS MARKET: COMPANY SHARE 2022 (%)
FIGURE 57 NORTH AMERICA MACHINED SEALS MARKET: COMPANY SHARE 2022(%)
FIGURE 58 EUROPE MACHINED SEALS MARKET: COMPANY SHARE 2022 (%)
FIGURE 59 ASIA-PACIFIC MACHINED SEALS MARKET: COMPANY SHARE 2022 (%)
Global Machined Seals Market, Supply Chain Analysis and Ecosystem Framework
To support market growth and help clients navigate the impact of geopolitical shifts, DBMR has integrated in-depth supply chain analysis into its Global Machined Seals Market research reports. This addition empowers clients to respond effectively to global changes affecting their industries. The supply chain analysis section includes detailed insights such as Global Machined Seals Market consumption and production by country, price trend analysis, the impact of tariffs and geopolitical developments, and import and export trends by country and HSN code. It also highlights major suppliers with data on production capacity and company profiles, as well as key importers and exporters. In addition to research, DBMR offers specialized supply chain consulting services backed by over a decade of experience, providing solutions like supplier discovery, supplier risk assessment, price trend analysis, impact evaluation of inflation and trade route changes, and comprehensive market trend analysis.
Data collection and base year analysis are done using data collection modules with large sample sizes. The stage includes obtaining market information or related data through various sources and strategies. It includes examining and planning all the data acquired from the past in advance. It likewise envelops the examination of information inconsistencies seen across different information sources. The market data is analysed and estimated using market statistical and coherent models. Also, market share analysis and key trend analysis are the major success factors in the market report. To know more, please request an analyst call or drop down your inquiry.
The key research methodology used by DBMR research team is data triangulation which involves data mining, analysis of the impact of data variables on the market and primary (industry expert) validation. Data models include Vendor Positioning Grid, Market Time Line Analysis, Market Overview and Guide, Company Positioning Grid, Patent Analysis, Pricing Analysis, Company Market Share Analysis, Standards of Measurement, Global versus Regional and Vendor Share Analysis. To know more about the research methodology, drop in an inquiry to speak to our industry experts.
Data Bridge Market Research is a leader in advanced formative research. We take pride in servicing our existing and new customers with data and analysis that match and suits their goal. The report can be customized to include price trend analysis of target brands understanding the market for additional countries (ask for the list of countries), clinical trial results data, literature review, refurbished market and product base analysis. Market analysis of target competitors can be analyzed from technology-based analysis to market portfolio strategies. We can add as many competitors that you require data about in the format and data style you are looking for. Our team of analysts can also provide you data in crude raw excel files pivot tables (Fact book) or can assist you in creating presentations from the data sets available in the report.


