
Global Marasmus Treatment Market
Market Size in USD Billion
 USD
45.40 Billion
USD
74.60 Billion
2022
2030
USD
45.40 Billion
USD
74.60 Billion
2022
2030
| 2023 - 2030 | |
| USD 45.40 Billion | |
| USD 74.60 Billion | |
| % | |
|
Marasmus Treatment Market Analysis and Size
As per the records of UNICEF, it estimates that around 3 million each year, nearly half of all deaths in children under the age of 5 years result from a lack of nutrition. Growing up in a developing country is a major risk factor for developing marasmus. Regions with famines or high poverty rates have increased percentages of children suffering from marasmus. Both adults and children can suffer from marasmus, but it commonly affects young children in developing countries. And hence, the treatment of these patients are on higher demand as it will help them in faster recovery. Hence the market is expected to rise rapidly.
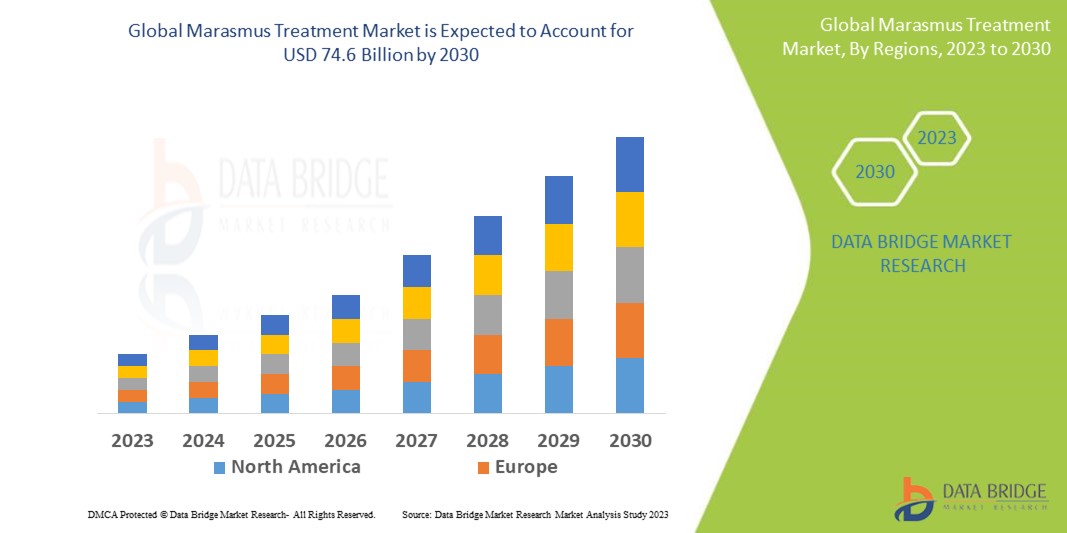
Data Bridge Market Research analyses a growth rate in the marasmus treatment market in the forecast period 2023-2030. The expected CAGR of marasmus treatment market is tend to be around 6.40% in the mentioned forecast period. The market valued at USD 45.4 billion in 2022, and it would grow upto USD 74.6 billion by 2030. In addition to the market insights such as market value, growth rate, market segments, geographical coverage, market players, and market scenario, the market report curated by the Data Bridge Market Research team also includes in-depth expert analysis, patient epidemiology, pipeline analysis, pricing analysis, and regulatory framework.
Marasmus Treatment Market Scope and Segmentation
|
Report Metric |
Details |
|
Forecast Period |
2023 to 2030 |
|
Base Year |
2022 |
|
Historic Years |
2021 (Customizable to 2015 - 2020) |
|
Quantitative Units |
Revenue in USD Billion, Volumes in Units, Pricing in USD |
|
Segments Covered |
Treatment (Medication, Dietary Supplements and Nutritional Diet), Mechanism of Action (Antimicrobial Agents, Antiprotozoal Agents, Antipyretics, Analgesics and Others), (Route of Administration (Oral, Intravenous and Others), End User (Hospitals, Specialty Clinics, Diagnostic Centers and Others), Distribution Channel (Direct Tender, Hospital Pharmacies, Retail Pharmacies and Online Pharmacies) |
|
Countries Covered |
U.S., Canada and Mexico in North America, Germany, France, U.K., Netherlands, Switzerland, Belgium, Russia, Italy, Spain, Turkey, Rest of Europe in Europe, China, Japan, India, South Korea, Singapore, Malaysia, Australia, Thailand, Indonesia, Philippines, Rest of Asia-Pacific (APAC) in the Asia-Pacific (APAC), Saudi Arabia, U.A.E, South Africa, Egypt, Israel, Rest of Middle East and Africa (MEA) as a part of Middle East and Africa (MEA), Brazil, Argentina and Rest of South America as part of South America |
|
Market Players Covered |
Par Pharmaceutical (U.S.), Groupe Lactalis (France), Nutricia (Netherlands), Fresenius SE & Co. KGaA (Germany), Abbott (U.S.), Altasciences (Canada), PepsiCo (U.S.), Nestlé, (Switzerland), Anaiah Healthcare Limited (U.K.), AYMES Nutrition (U.K.), Solvay (Belgium) |
|
Market Opportunities |
|
Market Definition
Marasmus is referred to as severe undernutrition, which underlines a deficiency in all the macronutrients the body necessitates to function, including carbohydrates, protein and fats. Marasmus causes prominent wasting of fat and muscle under the skin. It leads to stunted growth in children. People suffering from marasmus are visibly depleted, severely underweight and emaciated. Prolonged marasmus causes starvation. It is more prevalent in developing countries with extreme poverty and food scarcity, and where parasites and infectious diseases may contribute to calorie depletion.
Marasmus Treatment Market Dynamics
Drivers
- Rising Prevalence of Marasmus
Approximately 30% of humans currently suffer from one or more of the multiple forms of malnutrition. Nearly 50 million children younger than 5 years have PEM, and half of the children who die younger than 5 years are malnourished. It is more common in developing countries, such as in some areas of Asia and Africa. People in these nations are susceptible to having poor access to food, making it more difficult to get enough nutrients. Thus, this boost the growth of the treatment market.
- Increasing Demand of Direct Tender Channel
The direct tender segment is growing the marasmus treatment market since direct tender holds the largest market share along with the highest CAGR. It is majorly because of the service providers who buy the product from different manufacturers and it is witnessed that revenue from direct sales is more influential and increasing in the market.
Opportunities
- Growing Diagnostic Tests For Marasmus
Measures such as upper arm circumference and height-to-weight ratios assist the healthcare professionals to diagnose the severity of undernutrition. Height-to-age ratios help to understand growth delays in children. Additionally, blood test are widely used to identify the secondary effects of marasmus, which includes specific vitamin, enzyme, mineral, and electrolyte deficiencies. This will help define the child’s or adult’s nutritional needs for refeeding. Also, a complete blood count can also help in showing any infections or diseases that may have contributed to marasmus. Thus, this boost the market growth.
- Increasing Demand of Nutritional Rehabilitation
Nutritional rehabilitation is growing and increasing the demand of the market. Refeeding begins gradually with liquid formulas that carefully balance proteins, carbohydrates, and fats. For inpatients, healthcare professionals favour tube feeding since it enables for gradual but continuous nutrition. Calories are introduced at around 70% of normal recommended values for the person’s age. In the end, they may increase to 140% of recommended values to meet the growth requirements of stunted children. Patients slowly progress to more ordinary oral feeding with solid foods during this phase. Thus, this leads to the growth of the market.
Restraints/Challenges
- Developing Quality Issues of Drugs
Numerous quality issues associated with marasmus drug preparations are also projected to impede the growth of the market. Several manufacturers are not obtaining WHO prequalification for manufacturing of marasmus treatment drugs causing the higher production of substandard quality of drugs in the market.
This marasmus treatment market report provides details of new recent developments, trade regulations, import-export analysis, production analysis, value chain optimization, market share, impact of domestic and localized market players, analyses opportunities in terms of emerging revenue pockets, changes in market regulations, strategic market growth analysis, market size, category market growths, application niches and dominance, product approvals, product launches, geographic expansions, technological innovations in the market. To gain more info on the marasmus treatment market contact Data Bridge Market Research for an Analyst Brief, our team will help you take an informed market decision to achieve market growth.
Global Marasmus Treatment Market Scope
The marasmus treatment market is segmented on the basis of treatment, mechanism of action, route of administration, distribution channel and end-user. The growth amongst these segments will help you analyze meagre growth segments in the industries and provide the users with a valuable market overview and market insights to help them make strategic decisions for identifying core market applications.
Treatment
- Medication
- Dietary Supplements
- Nutritional Diet
Mechanism of Action
- Antimicrobial Agents
- Antiprotozoal Agents
- Antipyretics
- Analgesics
- Others
Route of Administration
- Oral
- Intravenous
- Others
End User
- Hospitals
- Specialty Clinics
- Diagnostic Centers
- Others
Distribution Channel
- Direct Tender
- Hospital Pharmacies
- Retail Pharmacies
- Online Pharmacies
- Others
Marasmus Treatment Market Regional Analysis/Insights
The marasmus treatment market is analyzed and market size insights and trends are provided by treatment, mechanism of action, route of administration, distribution channel and end-user as referenced above.
The major countries covered in the marasmus treatment market report are U.S., Canada and Mexico in North America, Germany, France, U.K., Netherlands, Switzerland, Belgium, Russia, Italy, Spain, Turkey, Rest of Europe in Europe, China, Japan, India, South Korea, Singapore, Malaysia, Australia, Thailand, Indonesia, Philippines, Rest of Asia-Pacific (APAC) in the Asia-Pacific (APAC), Saudi Arabia, U.A.E, South Africa, Egypt, Israel, Rest of Middle East and Africa (MEA) as a part of Middle East and Africa (MEA), Brazil, Argentina and Rest of South America as part of South America.
Asia-Pacific is the fastest growing region as the demand for marasmus treatment are increasing very rapidly due to the growing healthcare expenditure and increasing awareness related with the marasmus symptoms.
North America is dominating the market because of the high occurrence of marasmus disease. The funding from regional governments, increased clinical developments and product launches are impacting the market growth positively.
The country section of the report also provides individual market impacting factors and changes in regulation in the market domestically that impacts the current and future trends of the market. Also, the presence and availability of Global brands and their challenges faced due to large or scarce competition from local and domestic brands, impact of domestic tariffs and trade routes are considered while providing forecast analysis of the country data.
Competitive Landscape and Global Marasmus Treatment Market Share Analysis
The marasmus treatment market competitive landscape provides details by competitor. Details included are company overview, company financials, revenue generated, market potential, investment in research and development, new market initiatives, Global presence, production sites and facilities, production capacities, company strengths and weaknesses, product launch, product width and breadth, application dominance. The above data points provided are only related to the companies' focus related to marasmus treatment market.
Key players operating in the marasmus treatment market include:
- Par Pharmaceutical (U.S.)
- Groupe Lactalis (France)
- Nutricia (Netherlands)
- Fresenius SE & Co. KGaA (Germany)
- Abbott (U.S.)
- Altasciences (Canada)
- PepsiCo (U.S.)
- Nestlé, (Switzerland)
- Anaiah Healthcare Limited (U.K.)
- AYMES Nutrition (U.K.)
- Solvay (Belgium)
SKU-

- Interactive Data Analysis Dashboard
- Company Analysis Dashboard for high growth potential opportunities
- Research Analyst Access for customization & queries
- Competitor Analysis with Interactive dashboard
- Latest News, Updates & Trend analysis
- Harness the Power of Benchmark Analysis for Comprehensive Competitor Tracking
Table of Content
1 INTRODUCTION
1.1 OBJECTIVES OF THE STUDY
1.2 MARKET DEFINITION
1.3 OVERVIEW OF GLOBAL MARASMUS TREATMENT MARKET
1.4 CURRENCY AND PRICING
1.5 LIMITATION
1.6 MARKETS COVERED
2 MARKET SEGMENTATION
2.1 KEY TAKEAWAYS
2.2 ARRIVING AT THE GLOBAL MARASMUS TREATMENT MARKET SIZE
2.2.1 VENDOR POSITIONING GRID
2.2.2 TECHNOLOGY LIFE LINE CURVE
2.2.3 TRIPOD DATA VALIDATION MODEL
2.2.4 MARKET GUIDE
2.2.5 MULTIVARIATE MODELLING
2.2.6 TOP TO BOTTOM ANALYSIS
2.2.7 CHALLENGE MATRIX
2.2.8 APPLICATION COVERAGE GRID
2.2.9 STANDARDS OF MEASUREMENT
2.2.10 VENDOR SHARE ANALYSIS
2.2.11 EPIDEMIOLOGY MODELING
2.2.12 DATA POINTS FROM KEY PRIMARY INTERVIEWS
2.2.13 DATA POINTS FROM KEY SECONDARY DATABASES
2.3 GLOBAL MARASMUS TREATMENT MARKET: RESEARCH SNAPSHOT
2.4 ASSUMPTIONS
3 MARKET OVERVIEW
3.1 DRIVERS
3.2 RESTRAINTS
3.3 OPPORTUNITIES
3.4 CHALLENGES
4 EXECUTIVE SUMMARY
5 PREMIUM INSIGHTS
5.1 PESTEL ANALYSIS
5.2 PORTER’S FIVE FORCES MODEL
6 INDUSTRY INSIGHTS
6.1 PATENT ANALYSIS
6.1.1 PATENT LANDSCAPE
6.1.2 USPTO NUMBER
6.1.3 PATENT EXPIRY
6.1.4 EPIO NUMBER
6.1.5 PATENT STRENGTH AND QUALITY
6.1.6 PATENT CLAIMS
6.1.7 PATENT CITATIONS
6.1.8 PATENT LITIGATION AND LICENSING
6.1.9 FILE OF PATENT
6.1.10 PATENT RECEIVED CONTRIES
6.1.11 TECHNOLOGY BACKGROUND
6.2 DRUG TREATMENT RATE BY MATURED MARKETS
6.3 DEMOGRAPHIC TRENDS: IMPACTS ON ALL INCIDENCE RATES
6.4 PATIENT FLOW DIAGRAM
6.5 KEY PRICING STRATEGIES
6.6 KEY PATIENT ENROLLMENT STRATEGIES
6.7 INTERVIEWS WITH SPECIALIST
6.8 OTHER KOL SNAPSHOTS
7 EPIDEMIOLOGY
7.1 INCIDENCE OF ALL BY GENDER
7.2 TREATMENT RATE
7.3 MORTALITY RATE
7.4 DRUG ADHERENCE AND THERAPY SWITCH MODEL
7.5 PATIENT TREATMENT SUCCESS RATES
8 MERGERS AND ACQUISITION
8.1 LICENSING
8.2 COMMERCIALIZATION AGREEMENTS
9 REGULATORY FRAMEWORK
9.1 REGULATORY APPROVAL PROCESS
9.2 GEOGRAPHIES’ EASE OF REGULATORY APPROVAL
9.3 REGULATORY APPROVAL PATHWAYS
9.4 LICENSING AND REGISTRATION
9.5 POST-MARKETING SURVEILLANCE
9.6 GOOD MANUFACTURING PRACTICES (GMPS) GUIDELINES
10 PIPELINE ANALYSIS
10.1 CLINICAL TRIALS AND PHASE ANALYSIS
10.2 DRUG THERAPY PIPELINE
10.3 PHASE III CANDIDATES
10.4 PHASE II CANDIDATES
10.5 PHASE I CANDIDATES
10.6 OTHERS (PRE-CLINICAL AND RESEARCH)
TABLE 1 GLOBAL CLINICAL TRIAL MARKET FOR XX
Company Name Therapeutic Area
XX XX
XX XX
XX XX
XX XX
XX XX
XX XX
Sources: Press Releases, Annual Reports, SEC Filings, Investor Presentations, Other Government Sources, Analysis Based on Inputs from Secondary, Expert Interviews
TABLE 2 DISTRIBUTION OF PRODUCTS AND PROJECTS BY PHASE
Phase Number of Projects
Preclinical/Research Projects XX
Clinical Development XX
Phase I XX
Phase II XX
Phase III XX
U.S. Filed/Approved But Not Yet Marketed XX
Total XX
Sources: Press Releases, Annual Reports, SEC Filings, Investor Presentations, Other Government Sources, Analysis Based on Inputs from Secondary, Expert Interviews
TABLE 3 DISTRIBUTION OF PROJECTS BY THERAPEUTIC AREA AND PHASE
Therapeutic Area Preclinical/ Research Project
XX XX
XX XX
XX XX
XX XX
XX XX
Total Projects XX
Sources: Press Releases, Annual Reports, SEC Filings, Investor Presentations, Other Government Sources, Analysis Based on Inputs from Secondary, Expert Interviews
TABLE 4 DISTRIBUTION OF PROJECTS BY SCIENTIFIC APPROACH AND PHASE
Technology Preclinical/ Research Project
XX XX
XX XX
XX XX
XX XX
XX XX
Total Projects XX
Sources: Press Releases, Annual Reports, SEC Filings, Investor Presentations, Other Government Sources, Analysis Based on Inputs from Secondary, Expert Interviews
FIGURE 1 TOP ENTITIES BASED ON R&D GLANCE FOR XX
Sources: Press Releases, Annual Reports, SEC Filings, Investor Presentations, Other Government Sources, Analysis Based on Inputs from Secondary, Expert Interviews
11 MARKETED DRUG ANALYSIS
11.1 DRUG
11.1.1 BRAND NAME
11.1.2 GENERICS NAME
11.2 THERAPEUTIC INDICTION
11.3 PHARMACOLOGICAL CLASS OF THE DRUG
11.4 DRUG PRIMARY INDICATION
11.5 MARKET STATUS
11.6 MEDICATION TYPE
11.7 DRUG DOSAGES FORM
11.8 DOSAGES AVAILABILITY
11.9 DRUG ROUTE OF ADMINISTRATION
11.1 DOSING FREQUENCY
11.11 DRUG INSIGHT
11.12 AN OVERVIEW OF THE DRUG DEVELOPMENT ACTIVITIES SUCH AS REGULATORY MILSTONE, SAFETY DATA AND EFFICACY DATA, MARKET EXCLUSIVITY DATA.
11.12.1 FORECAST MARKET OUTLOOK
11.12.2 CROSS COMPETITION
11.12.3 THERAPEUTIC PORTFOLIO
11.12.4 CURRENT DEVELOPMENT SCENARIO
12 MARKET ACCESS
12.1 10-YEAR MARKET FORECAST
12.2 CLINICAL TRIAL RECENT UPDATES
12.3 ANNUAL NEW FDA APPROVED DRUGS
12.4 DRUGS MANUFACTURER AND DEALS
12.5 MAJOR DRUG UPTAKE
13 R & D ANALYSIS
13.1 COMPARATIVE ANALYSIS
13.2 DRUG DEVELOPMENTAL LANDSCAPE
13.3 IN-DEPTH INSIGHTS ON REGULATORY MILESTONES
13.4 THERAPEUTIC ASSESSMENT
13.5 ASSET-BASED COLLABORATIONS AND PARTNERSHIPS
14 MARKET OVERVIEW
14.1 DRIVERS
14.2 RESTRAINTS
14.3 OPPORTUNITIES
14.4 CHALLENGES
15 GLOBAL MARASMUS TREATMENT MARKET, BY TREATMENT TYPE
15.1 OVERVIEW
15.2 DRUGS
15.2.1 ANTIMICROBIALS
15.2.1.1. AMOXICILLIN
15.2.1.2. AMPICILLIN
15.2.1.3. CEFTRIAXON
15.2.1.4. GENTAMYCIN
15.2.1.5. NALIDIXIC ACID
15.2.1.6. PENICILLIN G
15.2.1.7. SULFAMETHOXAZOLE
15.2.1.8. ISONIAZID
15.2.1.9. RIFAMPIN
15.2.1.10. QUININE
15.2.2 ANTIPROTOZOALS
15.2.2.1. ALBENDAZOLE
15.2.2.2. METRONIDAZOLE
15.2.2.3. PIPERAZINE
15.2.3 ANTIPYRETICS
15.2.3.1. ACETAMINOPHEN
15.2.3.1.1. ACEPHEN
15.2.3.1.2. TYLENOL
15.2.3.1.3. FEVERALL
15.2.3.1.4. PANADOL
15.2.4 INTRAVENEOUS SOLUTIONS
15.2.4.1. RINGER-LACTATE
15.2.4.2. RESOMAL
15.2.4.3. ORS SOLUTION
15.2.4.4. OTHERS
15.2.5 OTHERS
15.3 DIETARY SUPPLEMENTS
15.3.1 PROTEIN SUPPLEMENTS
15.3.2 CARBOHYDRATES SUPPLEMENTS
15.3.3 MULTIVITAMIN SUPPLEMENTS
15.3.4 LIPID SUPPLEMENTS
15.3.5 HERBAL SUPPLEMENT
15.3.6 PROBIOTICS
15.3.7 OTHERS
15.4 MEDICAL FOOD
15.4.1 RUTF (READY TO USE THERAPEUTICS FOOD)
15.4.2 RUSF (READY TO USE SUPPLEMENT FOOD)
15.4.3 THERAPEUTIC MILKS
15.5 OTHERS
15.5.1 SURGERY
16 GLOBAL MARASMUS TREATMENT MARKET, BY INDICATION
16.1 OVERVIEW
16.2 EDEMA
16.3 CHRONIC DIARRHEA
16.4 ANAEMIA
16.5 CORNEAL LESIONS
16.6 OTITIS
16.7 RHINITIS
16.8 RESPIRATORY INFECTIONS
16.9 INTELLECTUAL DISABILITY
16.1 STUNTED GROWTH
16.11 OTHERS
17 GLOBAL MARASMUS TREATMENT MARKET, BY ROUTE OF ADMINISTRATION
17.1 OVERVIEW
17.2 ORAL
17.3 INTRAVENOUS
17.4 OTHERS
18 GLOBAL MARASMUS TREATMENT MARKET, BY AGE GROUP
18.1 OVERVIEW
18.2 PEDIATRICS
18.3 ADULT
18.4 GERIATRICS
19 GLOBAL MARASMUS TREATMENT MARKET, BY DISTRIBUTION CHANNEL
19.1 OVERVIEW
19.2 DIRECT TENDER
19.3 RETAIL SALES
19.3.1 SUPERMARKETS AND HYPERMARKETS
19.3.2 CONVENIENCE STORES
19.3.3 PHARMACY STORES
19.3.4 ONLINE
19.3.4.1. ONLINE, BY CATEGORY
19.3.4.1.1. COMPANY-OWNED WEBSITES
19.3.4.1.2. THIRD-PARTY E-COMMERCE WEBSITES
19.3.5 OTHERS
20 GLOBAL MARASMUS TREATMENT MARKET, BY GEOGRAPHY
GLOBAL MARASMUS TREATMENT MARKET, (ALL SEGMENTATION PROVIDED ABOVE IS REPRESENTED IN THIS CHAPTER BY COUNTRY)
20.1 NORTH AMERICA
20.1.1 U.S.
20.1.1.1. U.S.MARASMUS TREATMENT MARKET, BY TYPE
20.1.1.2. U.S.MARASMUS TREATMENT MARKET, BYMARASMUS TREATMENTSYSTEMS
20.1.1.3. U.S.MARASMUS TREATMENT MARKET, BY DELIVERY SYSTEMS
20.1.1.4. U.S.MARASMUS TREATMENT MARKET, BY SOURCE
20.1.1.5. U.S.MARASMUS TREATMENT MARKET, BY END USER
20.1.1.6. U.S.MARASMUS TREATMENT MARKET, BY DISTRIBUTION CHANNEL
20.1.2 CANADA
20.1.3 MEXICO
20.1.4 DOMINICAN REPUBLIC
20.1.5 JAMAICA
20.1.6 PANAMA
20.2 EUROPE
20.2.1 GERMANY
20.2.2 FRANCE
20.2.3 U.K.
20.2.4 HUNGARY
20.2.5 LITHUANIA
20.2.6 AUSTRIA
20.2.7 IRELAND
20.2.8 NORWAY
20.2.9 POLAND
20.2.10 ITALY
20.2.11 SPAIN
20.2.12 RUSSIA
20.2.13 TURKEY
20.2.14 NETHERLANDS
20.2.15 SWITZERLAND
20.2.16 REST OF EUROPE
20.3 ASIA-PACIFIC
20.3.1 JAPAN
20.3.2 CHINA
20.3.3 TAIWAN
20.3.4 SOUTH KOREA
20.3.5 INDIA
20.3.6 AUSTRALIA
20.3.7 SINGAPORE
20.3.8 THAILAND
20.3.9 MALAYSIA
20.3.10 INDONESIA
20.3.11 PHILIPPINES
20.3.12 VIETNAM
20.3.13 REST OF ASIA-PACIFIC
20.4 SOUTH AMERICA
20.4.1 BRAZIL
20.4.2 ECUADOR
20.4.3 CHILE
20.4.4 COLOMBIA
20.4.5 VENEZUELA
20.4.6 ARGENTINA
20.4.7 REST OF SOUTH AMERICA
20.5 MIDDLE EAST AND AFRICA
20.5.1 SOUTH AFRICA
20.5.2 SAUDI ARABIA
20.5.3 UAE
20.5.4 EGYPT
20.5.5 KUWAIT
20.5.6 ISRAEL
20.5.7 REST OF MIDDLE EAST AND AFRICA
20.6 KEY PRIMARY INSIGHTS: BY MAJOR COUNTRIES
21 GLOBAL MARASMUS TREATMENT MARKET, SWOT AND DBMR ANALYSIS
22 GLOBAL MARASMUS TREATMENT MARKET, COMPANY LANDSCAPE
22.1 COMPANY SHARE ANALYSIS: GLOBAL
22.2 COMPANY SHARE ANALYSIS: NORTH AMERICA
22.3 COMPANY SHARE ANALYSIS: EUROPE
22.4 COMPANY SHARE ANALYSIS: ASIA-PACIFIC
22.5 MERGERS & ACQUISITIONS
22.6 NEW PRODUCT DEVELOPMENT & APPROVALS
22.7 EXPANSIONS
22.8 REGULATORY CHANGES
22.9 PARTNERSHIP AND OTHER STRATEGIC DEVELOPMENTS
23 GLOBAL MARASMUS TREATMENT MARKET, COMPANY PROFILE
23.1 PRISTINEPREMIXES
23.1.1 COMPANY OVERVIEW
23.1.2 REVENUE ANALYSIS
23.1.3 GEOGRAPHIC PRESENCE
23.1.4 PRODUCT PORTFOLIO
23.1.5 RECENT DEVELOPMENTS
23.2 NUTRISET
23.2.1 COMPANY OVERVIEW
23.2.2 REVENUE ANALYSIS
23.2.3 GEOGRAPHIC PRESENCE
23.2.4 PRODUCT PORTFOLIO
23.2.5 RECENT DEVELOPMENTS
23.3 NUFLOWER FOODS & NUTRITION PVT. LTD.
23.3.1 COMPANY OVERVIEW
23.3.2 REVENUE ANALYSIS
23.3.3 GEOGRAPHIC PRESENCE
23.3.4 PRODUCT PORTFOLIO
23.3.5 RECENT DEVELOPMENTS
23.4 VISTA FORTIFOODS PVT.LTD.
23.4.1 COMPANY OVERVIEW
23.4.2 REVENUE ANALYSIS
23.4.3 GEOGRAPHIC PRESENCE
23.4.4 PRODUCT PORTFOLIO
23.4.5 RECENT DEVELOPMENTS
23.5 RADIANCE GLOBAL FOODS
23.5.1 COMPANY OVERVIEW
23.5.2 REVENUE ANALYSIS
23.5.3 GEOGRAPHIC PRESENCE
23.5.4 PRODUCT PORTFOLIO
23.5.5 RECENT DEVELOPMENTS
23.6 GC RIEBER
23.6.1 COMPANY OVERVIEW
23.6.2 REVENUE ANALYSIS
23.6.3 GEOGRAPHIC PRESENCE
23.6.4 PRODUCT PORTFOLIO
23.6.5 RECENT DEVELOPMENTS
23.7 PROCURENET LIMITED
23.7.1 COMPANY OVERVIEW
23.7.2 REVENUE ANALYSIS
23.7.3 GEOGRAPHIC PRESENCE
23.7.4 PRODUCT PORTFOLIO
23.7.5 RECENT DEVELOPMENTS
23.8 HEXAGON NUTRITION LTD.
23.8.1 COMPANY OVERVIEW
23.8.2 REVENUE ANALYSIS
23.8.3 GEOGRAPHIC PRESENCE
23.8.4 PRODUCT PORTFOLIO
23.8.5 RECENT DEVELOPMENTS
23.9 AMUL DAIRY
23.9.1 COMPANY OVERVIEW
23.9.2 REVENUE ANALYSIS
23.9.3 GEOGRAPHIC PRESENCE
23.9.4 PRODUCT PORTFOLIO
23.9.5 RECENT DEVELOPMENTS
23.1 COMPACT PROVISIONS AS (GC RIEBER)
23.10.1 COMPANY OVERVIEW
23.10.2 REVENUE ANALYSIS
23.10.3 GEOGRAPHIC PRESENCE
23.10.4 PRODUCT PORTFOLIO
23.10.5 RECENT DEVELOPMENTS
23.11 SOMA NUTRITION PVT.LTD.
23.11.1 COMPANY OVERVIEW
23.11.2 REVENUE ANALYSIS
23.11.3 GEOGRAPHIC PRESENCE
23.11.4 PRODUCT PORTFOLIO
23.11.5 RECENT DEVELOPMENTS
23.12 THE FOOD TRANSFORMATION COMPANY (STA)
23.12.1 COMPANY OVERVIEW
23.12.2 REVENUE ANALYSIS
23.12.3 GEOGRAPHIC PRESENCE
23.12.4 PRODUCT PORTFOLIO
23.12.5 RECENT DEVELOPMENTS
23.13 SAMIL INDUSTRY
23.13.1 COMPANY OVERVIEW
23.13.2 REVENUE ANALYSIS
23.13.3 GEOGRAPHIC PRESENCE
23.13.4 PRODUCT PORTFOLIO
23.13.5 RECENT DEVELOPMENTS
23.14 PLUMPYFIELD NETWORK (NUTRIVITA FOODS)
23.14.1 COMPANY OVERVIEW
23.14.2 REVENUE ANALYSIS
23.14.3 GEOGRAPHIC PRESENCE
23.14.4 PRODUCT PORTFOLIO
23.14.5 RECENT DEVELOPMENTS
23.15 MANA NUTRITION
23.15.1 COMPANY OVERVIEW
23.15.2 REVENUE ANALYSIS
23.15.3 GEOGRAPHIC PRESENCE
23.15.4 PRODUCT PORTFOLIO
23.15.5 RECENT DEVELOPMENTS
23.16 ISMAIL INDUSTRIES LIMITED
23.16.1 COMPANY OVERVIEW
23.16.2 REVENUE ANALYSIS
23.16.3 GEOGRAPHIC PRESENCE
23.16.4 PRODUCT PORTFOLIO
23.16.5 RECENT DEVELOPMENTS
23.17 INSTA PRODUCTS LTD.
23.17.1 COMPANY OVERVIEW
23.17.2 REVENUE ANALYSIS
23.17.3 GEOGRAPHIC PRESENCE
23.17.4 PRODUCT PORTFOLIO
23.17.5 RECENT DEVELOPMENTS
23.18 INNOFASO
23.18.1 COMPANY OVERVIEW
23.18.2 REVENUE ANALYSIS
23.18.3 GEOGRAPHIC PRESENCE
23.18.4 PRODUCT PORTFOLIO
23.18.5 RECENT DEVELOPMENTS
23.19 HILINA ENRICHED FOODS
23.19.1 COMPANY OVERVIEW
23.19.2 REVENUE ANALYSIS
23.19.3 GEOGRAPHIC PRESENCE
23.19.4 PRODUCT PORTFOLIO
23.19.5 RECENT DEVELOPMENTS
23.2 ABBOTT
23.20.1 COMPANY OVERVIEW
23.20.2 REVENUE ANALYSIS
23.20.3 GEOGRAPHIC PRESENCE
23.20.4 PRODUCT PORTFOLIO
23.20.5 RECENT DEVELOPMENTS
23.21 B. BRAUN MEDICAL INC.
23.21.1 COMPANY OVERVIEW
23.21.2 REVENUE ANALYSIS
23.21.3 GEOGRAPHIC PRESENCE
23.21.4 PRODUCT PORTFOLIO
23.21.5 RECENT DEVELOPMENTS
23.22 FRESENIUS SE & CO. KGAA
23.22.1 COMPANY OVERVIEW
23.22.2 REVENUE ANALYSIS
23.22.3 GEOGRAPHIC PRESENCE
23.22.4 PRODUCT PORTFOLIO
23.22.5 RECENT DEVELOPMENTS
23.23 NUTRA HEALTHCARE PRIVATE LIMITED
23.23.1 COMPANY OVERVIEW
23.23.2 REVENUE ANALYSIS
23.23.3 GEOGRAPHIC PRESENCE
23.23.4 PRODUCT PORTFOLIO
23.23.5 RECENT DEVELOPMENTS
23.24 GROUPE LACTALIS
23.24.1 COMPANY OVERVIEW
23.24.2 REVENUE ANALYSIS
23.24.3 GEOGRAPHIC PRESENCE
23.24.4 PRODUCT PORTFOLIO
23.24.5 RECENT DEVELOPMENTS
23.25 DANONE (NUTRICIA)
23.25.1 COMPANY OVERVIEW
23.25.2 REVENUE ANALYSIS
23.25.3 GEOGRAPHIC PRESENCE
23.25.4 PRODUCT PORTFOLIO
23.25.5 RECENT DEVELOPMENTS
NOTE: THE COMPANIES PROFILED IS NOT EXHAUSTIVE LIST AND IS AS PER OUR PREVIOUS CLIENT REQUIREMENT. WE PROFILE MORE THAN 100 COMPANIES IN OUR STUDY AND HENCE THE LIST OF COMPANIES CAN BE MODIFIED OR REPLACED ON REQUEST
24 RELATED REPORTS
25 CONCLUSION
26 QUESTIONNAIRE
27 ABOUT DATA BRIDGE MARKET RESEARCH
Data collection and base year analysis are done using data collection modules with large sample sizes. The stage includes obtaining market information or related data through various sources and strategies. It includes examining and planning all the data acquired from the past in advance. It likewise envelops the examination of information inconsistencies seen across different information sources. The market data is analysed and estimated using market statistical and coherent models. Also, market share analysis and key trend analysis are the major success factors in the market report. To know more, please request an analyst call or drop down your inquiry.
The key research methodology used by DBMR research team is data triangulation which involves data mining, analysis of the impact of data variables on the market and primary (industry expert) validation. Data models include Vendor Positioning Grid, Market Time Line Analysis, Market Overview and Guide, Company Positioning Grid, Patent Analysis, Pricing Analysis, Company Market Share Analysis, Standards of Measurement, Global versus Regional and Vendor Share Analysis. To know more about the research methodology, drop in an inquiry to speak to our industry experts.
Data Bridge Market Research is a leader in advanced formative research. We take pride in servicing our existing and new customers with data and analysis that match and suits their goal. The report can be customized to include price trend analysis of target brands understanding the market for additional countries (ask for the list of countries), clinical trial results data, literature review, refurbished market and product base analysis. Market analysis of target competitors can be analyzed from technology-based analysis to market portfolio strategies. We can add as many competitors that you require data about in the format and data style you are looking for. Our team of analysts can also provide you data in crude raw excel files pivot tables (Fact book) or can assist you in creating presentations from the data sets available in the report.


