
Global Metabolic Disorders Therapeutics Market
Market Size in USD Billion
 USD
82.79 Billion
USD
147.65 Billion
2025
2033
USD
82.79 Billion
USD
147.65 Billion
2025
2033
| 2026 - 2033 | |
| USD 82.79 Billion | |
| USD 147.65 Billion | |
| % | |
|
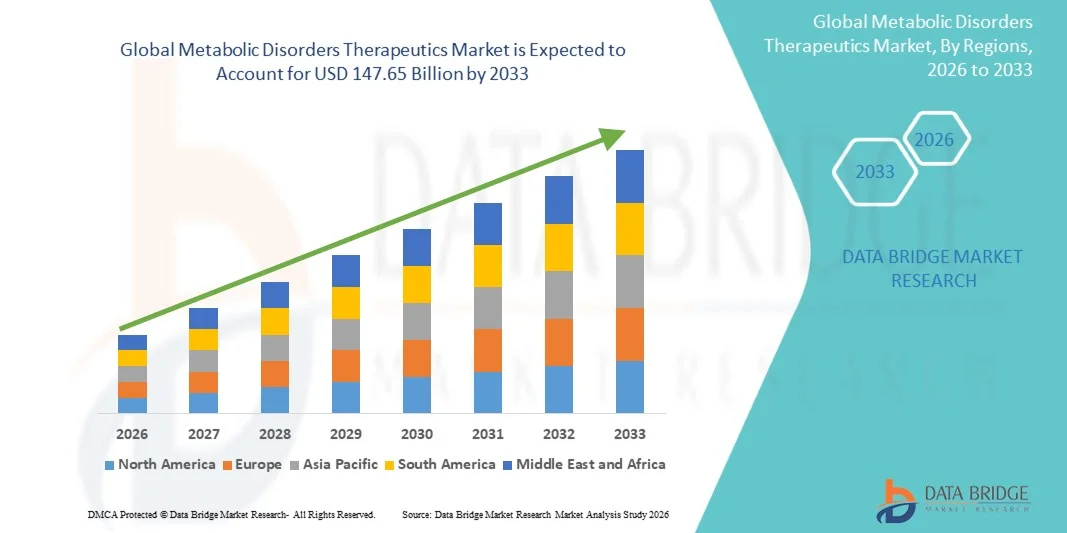
Metabolic Disorders Therapeutics Market Size
- The global Metabolic Disorders Therapeutics market size was valued at USD 82.79 billion in 2025and is expected to reach USD 147.65 billion by 2033, at a CAGR of 7.50% during the forecast period
- The market growth is largely fueled by the increasing prevalence of metabolic disorders, rising awareness regarding early diagnosis and disease management, and continuous advancements in therapeutic development, leading to growing demand for innovative treatment solutions across healthcare settings
- Furthermore, increasing adoption of precision medicine, growing investments in biotechnology and pharmaceutical research, and rising demand for effective long-term management solutions for metabolic conditions are establishing metabolic disorders therapeutics as essential components of modern healthcare. These converging factors are accelerating the uptake of Metabolic Disorders Therapeutics solutions, thereby significantly boosting the industry's growth
Metabolic Disorders Therapeutics Market Analysis
- Metabolic disorders therapeutics, including enzyme replacement therapies, small molecule drugs, biologics, and gene-based treatment approaches, are becoming increasingly important in modern healthcare due to the rising prevalence of inherited and acquired metabolic disorders and the growing need for effective long-term disease management solutions
- The escalating demand for metabolic disorders therapeutics is primarily fueled by increasing incidence of obesity, diabetes, rare genetic metabolic diseases, and lifestyle-related disorders, along with growing awareness regarding early diagnosis and advancements in precision medicine and targeted therapeutic development
- North America dominated the metabolic disorders therapeutics market with the largest revenue share of 40.8% in 2025, characterized by advanced healthcare infrastructure, strong pharmaceutical research capabilities, and high adoption of innovative therapeutic solutions, with the U.S. experiencing substantial growth in metabolic disorder treatment adoption driven by increasing healthcare expenditure, expanding clinical research activities, and rising prevalence of chronic metabolic diseases
- Asia-Pacific is expected to be the fastest growing region in the metabolic disorders therapeutics market during the forecast period due to rising healthcare investments, increasing prevalence of metabolic diseases, expanding access to advanced treatment solutions, and growing awareness regarding early disease diagnosis and management across emerging economies
- The diabetes segment held the largest market revenue share of 48.7% in 2025, driven by the rapidly increasing global prevalence of type 1 and type 2 diabetes
Report Scope and Metabolic Disorders Therapeutics Market Segmentation
|
Attributes |
Metabolic Disorders Therapeutics Key Market Insights |
|
Segments Covered |
|
|
Countries Covered |
North America · U.S. · Canada · Mexico Europe · Germany · France · U.K. · Netherlands · Switzerland · Belgium · Russia · Italy · Spain · Turkey · Rest of Europe Asia-Pacific · China · Japan · India · South Korea · Singapore · Malaysia · Australia · Thailand · Indonesia · Philippines · Rest of Asia-Pacific Middle East and Africa · Saudi Arabia · U.A.E. · South Africa · Egypt · Israel · Rest of Middle East and Africa South America · Brazil · Argentina · Rest of South America |
|
Key Market Players |
· Novo Nordisk A/S (Denmark) · Sanofi S.A. (France) · Eli Lilly and Company (U.S.) · Pfizer Inc. (U.S.) · F. Hoffmann-La Roche Ltd. (Switzerland) · Novartis AG (Switzerland) · AstraZeneca plc (U.K.) · Takeda Pharmaceutical Company Limited (Japan) · Amgen Inc. (U.S.) · AbbVie Inc. (U.S.) · Merck & Co., Inc. (U.S.) · Johnson & Johnson Services, Inc. (U.S.) · BioMarin Pharmaceutical Inc. (U.S.) · Ultragenyx Pharmaceutical Inc. (U.S.) · Orchard Therapeutics plc (U.K.) · Amicus Therapeutics, Inc. (U.S.) · Recordati Rare Diseases Inc. (Italy) · Alexion Pharmaceuticals, Inc. (U.S.) · Teva Pharmaceutical Industries Ltd. (Israel) · Bayer AG (Germany) |
|
Market Opportunities |
· Increasing advancements in gene therapy and precision medicine · Growing global prevalence of obesity, diabetes, and other lifestyle-related metabolic diseases |
|
Value Added Data Infosets |
In addition to the insights on market scenarios such as market value, growth rate, segmentation, geographical coverage, and major players, the market reports curated by the Data Bridge Market Research also include in-depth expert analysis, patient epidemiology, pipeline analysis, pricing analysis, and regulatory framework. |
Metabolic Disorders Therapeutics Market Trends
“Growing Adoption of Precision Medicine and Advanced Biologic Therapies”
- A significant and accelerating trend in the global metabolic disorders therapeutics market is the increasing adoption of precision medicine approaches and advanced biologic therapies aimed at improving disease management and long-term patient outcomes
- For instance, pharmaceutical and biotechnology companies are increasingly developing targeted therapies designed to address the underlying molecular and genetic mechanisms associated with metabolic disorders such as diabetes, obesity, lysosomal storage disorders, and inherited metabolic diseases
- The growing integration of genomics, biomarker-based diagnostics, and personalized treatment strategies is enabling healthcare providers to deliver more individualized therapeutic solutions tailored to specific patient profiles and disease conditions
- Furthermore, advancements in biologic drugs, enzyme replacement therapies, gene therapies, and RNA-based therapeutics are significantly expanding treatment options for patients with rare and chronic metabolic disorders
- The increasing use of digital health technologies, wearable glucose monitoring devices, and remote patient management systems is also improving treatment adherence, disease monitoring, and overall metabolic health management
- This trend toward personalized, technology-driven, and highly targeted therapeutic solutions is transforming metabolic disease treatment practices and supporting continued innovation in the Metabolic Disorders Therapeutics market globally
Metabolic Disorders Therapeutics Market Dynamics
Driver
“Rising Prevalence of Metabolic Diseases and Increasing Healthcare Awareness”
- The growing prevalence of metabolic disorders worldwide, including diabetes, obesity, hyperlipidemia, and inherited metabolic diseases, is a major factor driving the growth of the Metabolic Disorders Therapeutics market
- For instance, sedentary lifestyles, unhealthy dietary habits, increasing obesity rates, and aging populations are significantly contributing to the rising global burden of metabolic disorders and associated complications
- Healthcare providers and public health organizations are increasingly focusing on early diagnosis, preventive healthcare strategies, and long-term disease management to reduce complications associated with metabolic conditions such as cardiovascular diseases, kidney disorders, and neurological complications
- Furthermore, increasing healthcare expenditure, expanding access to advanced therapeutics, and growing investments in biotechnology and pharmaceutical research are supporting market expansion across developed and emerging economies
- The growing awareness regarding rare metabolic disorders and the availability of orphan drug development incentives are also encouraging pharmaceutical companies to invest in innovative treatment development for underserved patient populations
- In addition, supportive government initiatives, rising clinical trial activities, and ongoing advancements in metabolic disease diagnostics are further strengthening market growth opportunities globally
Restraint/Challenge
“High Treatment Costs and Complex Regulatory Requirements”
- The high cost associated with advanced metabolic disorder therapies, particularly biologics, enzyme replacement therapies, and gene therapies, remains a significant challenge for broader market adoption
- For instance, many innovative metabolic disorder treatments involve complex manufacturing processes, specialized administration protocols, and long-term patient monitoring, contributing to elevated healthcare costs and limiting accessibility in low- and middle-income regions
- In addition, stringent regulatory approval requirements and lengthy clinical trial timelines for novel metabolic therapies can delay product commercialization and increase development costs for pharmaceutical companies
- The complexity of diagnosing rare metabolic disorders and limited awareness among certain healthcare settings may also lead to delayed treatment initiation and underdiagnosis in some patient populations
- Furthermore, reimbursement limitations and unequal healthcare access in developing economies may restrict patient access to advanced therapeutic options and long-term disease management services
- Addressing these challenges through cost-effective therapeutic development, expanded healthcare accessibility, improved diagnostic capabilities, supportive reimbursement policies, and continued research into innovative treatment approaches will be essential for sustaining long-term growth in the global Metabolic Disorders Therapeutics market
Metabolic Disorders Therapeutics Market Scope
The market is segmented on the basis of therapy type, application, end-users, and distribution channel.
- By Therapy Type
On the basis of therapy type, the Metabolic Disorders Therapeutics market is segmented into enzyme replacement therapy, substrate reduction therapy, gene therapy, drug therapy, and others. The drug therapy segment dominated the largest market revenue share of 43.5% in 2025, driven by the widespread use of pharmacological treatments for managing chronic metabolic disorders such as diabetes, obesity, and hypercholesterolemia. Drug therapies are highly preferred due to their broad availability, cost-effectiveness, and ability to provide long-term disease management. Physicians commonly prescribe oral and injectable medications to regulate metabolic pathways, improve insulin sensitivity, and reduce disease complications. The increasing prevalence of lifestyle-related disorders and growing aging population globally have significantly contributed to segment growth. In addition, advancements in targeted therapeutics and combination drug formulations are improving treatment efficacy and patient compliance. Pharmaceutical companies continue to invest heavily in research and development for next-generation metabolic therapies. Rising healthcare awareness, expanding diagnostic capabilities, and increasing access to healthcare services are further strengthening market demand. Furthermore, supportive reimbursement policies and strong product pipelines are expected to sustain segment dominance during the forecast period.
The gene therapy segment is anticipated to witness the fastest CAGR of 24.2% from 2026 to 2033, driven by rapid advancements in genetic engineering and precision medicine technologies. Gene therapy is gaining significant attention because of its potential to provide long-term or curative treatment for inherited metabolic disorders. Increasing investments in rare disease research and biotechnology innovation are significantly supporting segment growth. In addition, rising clinical trial activity focused on correcting defective metabolic genes is accelerating therapeutic development. Healthcare providers and researchers are increasingly exploring gene-editing technologies such as CRISPR for targeted metabolic disorder treatment. Growing regulatory support for advanced biologics and orphan drugs is further contributing to market expansion. Expanding collaborations between pharmaceutical companies and biotechnology firms are expected to strengthen future market growth globally.
- By Application
On the basis of application, the Metabolic Disorders Therapeutics market is segmented into lysosomal storage diseases, diabetes, obesity, hypercholesterolemia, and others. The diabetes segment held the largest market revenue share of 48.7% in 2025, driven by the rapidly increasing global prevalence of type 1 and type 2 diabetes. Diabetes remains one of the most common metabolic disorders worldwide, leading to strong demand for insulin therapies, glucose-lowering medications, and supportive metabolic treatments. Healthcare providers increasingly focus on early diagnosis and long-term disease management to reduce complications such as cardiovascular disease and kidney failure. Rising sedentary lifestyles, unhealthy dietary habits, and increasing obesity rates have significantly contributed to segment growth. In addition, advancements in continuous glucose monitoring systems and personalized diabetes therapeutics are improving patient outcomes. Pharmaceutical companies continue to launch innovative antidiabetic drugs and combination therapies to strengthen treatment effectiveness. Expanding healthcare infrastructure and rising awareness regarding preventive metabolic healthcare are further supporting market demand. Furthermore, supportive government healthcare initiatives and reimbursement programs are expected to sustain strong segment dominance during the forecast period.
The obesity segment is projected to witness the fastest CAGR of 23.1% from 2026 to 2033, driven by the growing global burden of obesity and associated metabolic complications. Increasing awareness regarding obesity-related cardiovascular diseases, diabetes, and hormonal imbalances is significantly supporting segment growth. Healthcare providers are increasingly adopting advanced weight management therapies, including appetite suppressants and metabolic regulators, to improve patient health outcomes. In addition, rising consumer focus on preventive healthcare and lifestyle management is accelerating therapeutic adoption. Pharmaceutical companies are actively developing novel obesity drugs targeting appetite regulation and energy metabolism pathways. Growing healthcare expenditure and expanding access to obesity treatment programs are further contributing to market expansion. Rising adoption of personalized nutrition and digital metabolic health management solutions is expected to further strengthen future growth.
- By End-Users
On the basis of end-users, the Metabolic Disorders Therapeutics market is segmented into hospitals, homecare, speciality centres, and others. The hospitals segment accounted for the largest market revenue share of 54.1% in 2025, driven by the high volume of metabolic disorder diagnoses, treatment procedures, and patient monitoring services provided in hospital settings. Hospitals serve as primary healthcare centers for managing severe metabolic conditions requiring multidisciplinary medical care and advanced diagnostic facilities. Increasing prevalence of diabetes, obesity, and inherited metabolic disorders has significantly boosted hospital-based treatment demand. In addition, hospitals increasingly invest in specialized endocrinology departments and metabolic disease management programs to improve patient outcomes. Advancements in diagnostic technologies, integrated healthcare systems, and personalized treatment approaches are further supporting segment growth. Rising healthcare expenditure and expansion of multispecialty hospitals globally continue to strengthen market demand. The growing availability of reimbursement support and government healthcare initiatives for chronic disease management is also contributing to higher patient admissions. Furthermore, increasing adoption of advanced biologic therapies and continuous monitoring systems is expected to sustain segment dominance during the forecast period.
The homecare segment is expected to witness the fastest CAGR of 22.6% from 2026 to 2033, driven by the increasing preference for remote disease management and home-based therapeutic solutions. Patients with chronic metabolic disorders increasingly prefer homecare settings due to convenience, reduced treatment costs, and improved quality of life. The growing adoption of wearable health monitoring devices and telemedicine platforms is significantly accelerating segment growth. In addition, healthcare providers are integrating digital health technologies and remote patient monitoring systems to improve long-term disease management. Rising awareness regarding preventive healthcare and self-management of chronic conditions is further supporting homecare adoption. Expanding availability of home-administered biologic therapies and online healthcare consultation services is expected to further contribute to robust future market expansion.
- By Distribution Channel
On the basis of distribution channel, the Metabolic Disorders Therapeutics market is segmented into hospital pharmacy, online pharmacy, and retail pharmacy. The hospital pharmacy segment dominated the largest market revenue share of 46.8% in 2025, driven by the high dependency on hospital-based treatment and prescription management for metabolic disorders. Hospital pharmacies play a critical role in ensuring timely availability of insulin therapies, enzyme replacement drugs, and advanced metabolic medications. Healthcare professionals increasingly rely on hospital pharmacies for controlled dispensing, dosage monitoring, and patient counseling services. The growing number of chronic disease admissions and increasing use of specialty biologic therapies have significantly contributed to segment growth. In addition, advancements in hospital pharmacy automation systems and integrated healthcare management technologies are improving operational efficiency. Rising healthcare infrastructure investments and expansion of specialty treatment centers globally are further strengthening market demand. The increasing prevalence of complex metabolic disorders requiring specialized drug administration is expected to sustain segment dominance throughout the forecast period.
The online pharmacy segment is anticipated to witness the fastest CAGR of 25.3% from 2026 to 2033, driven by the rapid expansion of digital healthcare ecosystems and increasing consumer preference for convenient medicine purchasing platforms. Online pharmacies provide easy access to chronic disease medications, subscription-based refill services, and home delivery solutions for long-term metabolic disorder management. The growing adoption of telemedicine and digital prescription platforms is significantly accelerating segment growth. Consumers increasingly prefer online pharmaceutical services because of affordability, accessibility, and improved convenience, particularly in remote regions. In addition, rising smartphone penetration, internet connectivity, and digital payment adoption are supporting broader e-pharmacy expansion globally. Pharmaceutical companies and healthcare providers are actively strengthening digital distribution networks and secure online prescription verification systems. Regulatory advancements supporting e-pharmacy operations are expected to further contribute to robust future market growth.
Metabolic Disorders Therapeutics Market Regional Analysis
- North America dominated the metabolic disorders therapeutics market with the largest revenue share of 40.8% in 2025, characterized by advanced healthcare infrastructure, strong pharmaceutical research capabilities, and high adoption of innovative therapeutic solutions
- The region benefits from increasing prevalence of chronic metabolic diseases, rising healthcare expenditure, and growing demand for advanced treatment options for conditions such as diabetes, obesity, and inherited metabolic disorders
- Furthermore, strong clinical research activities, favorable reimbursement frameworks, and increasing adoption of precision medicine approaches are significantly contributing to market growth across North America
U.S. Metabolic Disorders Therapeutics Market Insight
The U.S. metabolic disorders therapeutics market captured the largest revenue share within North America in 2025, driven by increasing healthcare expenditure, expanding clinical research activities, and rising prevalence of chronic metabolic diseases. The country is witnessing substantial growth in the adoption of advanced therapeutic solutions, including biologics, targeted therapies, and personalized treatment approaches for metabolic disorders. In addition, strong pharmaceutical innovation, increasing awareness regarding early diagnosis and treatment, and rising investments in healthcare infrastructure are supporting market expansion in the U.S.
Europe Metabolic Disorders Therapeutics Market Insight
Europe metabolic disorders therapeutics market is projected to expand at a substantial CAGR throughout the forecast period, primarily driven by increasing prevalence of metabolic diseases, rising aging population, and growing healthcare awareness. The region’s well-developed healthcare systems and strong pharmaceutical industry are fostering the adoption of innovative treatment solutions for metabolic disorders. Moreover, increasing investments in research and development, advancements in biotechnology, and growing emphasis on preventive healthcare are contributing significantly to market growth across Europe.
U.K. Metabolic Disorders Therapeutics Market Insight
The U.K. metabolic disorders therapeutics market is anticipated to grow at a noteworthy CAGR during the forecast period, driven by increasing awareness regarding chronic metabolic diseases and rising adoption of advanced therapeutic solutions. The country’s advanced healthcare infrastructure and growing focus on personalized medicine are supporting market growth. Furthermore, increasing government healthcare initiatives, expanding clinical trials, and rising demand for effective long-term disease management solutions are expected to further stimulate the market in the U.K.
Germany Metabolic Disorders Therapeutics Market Insight
The Germany metabolic disorders therapeutics market is expected to expand at a considerable CAGR during the forecast period, fueled by strong pharmaceutical manufacturing capabilities, advanced healthcare infrastructure, and increasing focus on innovative treatment development. Germany’s emphasis on biotechnology research and precision medicine is encouraging the adoption of advanced therapies for metabolic disorders. In addition, rising prevalence of obesity and diabetes, along with increasing investments in healthcare modernization, are positively influencing market growth in the country.
Asia-Pacific Metabolic Disorders Therapeutics Market Insight
Asia-Pacific metabolic disorders therapeutics market is expected to be the fastest growing region in the Metabolic Disorders Therapeutics market during the forecast period due to rising healthcare investments, increasing prevalence of metabolic diseases, expanding access to advanced treatment solutions, and growing awareness regarding early disease diagnosis and management across emerging economies. Rapid improvements in healthcare infrastructure, increasing government healthcare initiatives, and rising accessibility to advanced therapeutic solutions are further accelerating market growth. In addition, the region’s large patient population and increasing incidence of lifestyle-related metabolic disorders are contributing significantly to the adoption of metabolic disorder therapeutics.
Japan Metabolic Disorders Therapeutics Market Insight
The Japan metabolic disorders therapeutics market is gaining momentum due to the country’s advanced healthcare infrastructure, aging population, and strong focus on healthcare innovation. Rising prevalence of diabetes and obesity-related conditions, coupled with increasing adoption of advanced treatment solutions, is supporting market growth. Furthermore, Japan’s emphasis on precision medicine and preventive healthcare is contributing to increasing utilization of metabolic disorder therapeutic products across healthcare settings.
China Metabolic Disorders Therapeutics Market Insight
The China metabolic disorders therapeutics market accounted for the largest market revenue share in Asia-Pacific in 2025, attributed to expanding healthcare infrastructure, increasing prevalence of metabolic diseases, and rising healthcare expenditure. The country is witnessing growing demand for advanced treatment solutions supported by improving healthcare accessibility and increasing awareness regarding chronic disease management. In addition, strong pharmaceutical manufacturing capabilities, government healthcare modernization initiatives, and expanding clinical research activities are key factors propelling market growth in China.
Metabolic Disorders Therapeutics Market Share
The Metabolic Disorders Therapeutics industry is primarily led by well-established companies, including:
- Novo Nordisk A/S (Denmark)
- Sanofi S.A. (France)
- Eli Lilly and Company (U.S.)
- Pfizer Inc. (U.S.)
- Hoffmann-La Roche Ltd. (Switzerland)
- Novartis AG (Switzerland)
- AstraZeneca plc (U.K.)
- Takeda Pharmaceutical Company Limited (Japan)
- Amgen Inc. (U.S.)
- AbbVie Inc. (U.S.)
- Merck & Co., Inc. (U.S.)
- Johnson & Johnson Services, Inc. (U.S.)
- BioMarin Pharmaceutical Inc. (U.S.)
- Ultragenyx Pharmaceutical Inc. (U.S.)
- Orchard Therapeutics plc (U.K.)
- Amicus Therapeutics, Inc. (U.S.)
- Recordati Rare Diseases Inc. (Italy)
- Alexion Pharmaceuticals, Inc. (U.S.)
- Teva Pharmaceutical Industries Ltd. (Israel)
- Bayer AG (Germany)
Latest Developments in Global Metabolic Disorders Therapeutics Market
- In June 2021, Novo Nordisk announced that the U.S. Food and Drug Administration (FDA) approved Wegovy (semaglutide) 2.4 mg injection for chronic weight management in adults with obesity or overweight conditions associated with metabolic disorders. The approval represented a major advancement in metabolic disorders therapeutics by introducing a highly effective GLP-1 receptor agonist therapy for obesity management and related metabolic complications
- In May 2022, Eli Lilly and Company announced positive Phase III SURMOUNT-1 clinical trial results for tirzepatide in adults with obesity or overweight conditions. The dual GIP/GLP-1 receptor agonist demonstrated substantial weight reduction and metabolic improvement, reinforcing the growing importance of incretin-based therapeutics in the treatment of metabolic disorders including obesity and type 2 diabetes
- In March 2024, Madrigal Pharmaceuticals received U.S. FDA approval for Rezdiffra™ (resmetirom), the first approved therapy for metabolic dysfunction-associated steatohepatitis (MASH), formerly known as NASH. The thyroid hormone receptor-beta agonist was approved for adults with noncirrhotic MASH with moderate to advanced liver fibrosis, marking a major breakthrough in metabolic liver disease treatment
- In February 2025, Mirum Pharmaceuticals received U.S. FDA approval for Ctexli (chenodiol), the first approved treatment for cerebrotendinous xanthomatosis (CTX), a rare lipid storage metabolic disorder. The approval strengthened the rare metabolic disease therapeutics landscape and highlighted increasing regulatory support for orphan metabolic disorder treatments
- In March 2025, Soleno Therapeutics received U.S. FDA approval for Vykat XR, the first approved treatment for hyperphagia associated with Prader-Willi syndrome, a rare genetic metabolic disorder. The approval represented a significant advancement in therapies targeting rare metabolic and endocrine disorders with high unmet clinical need
- In August 2025, Novo Nordisk received accelerated U.S. FDA approval for Wegovy for the treatment of metabolic dysfunction-associated steatohepatitis (MASH) with moderate to advanced liver fibrosis. The approval made Wegovy the first GLP-1 therapy approved for MASH, expanding the role of metabolic therapeutics beyond diabetes and obesity into liver disease management
SKU-

- Interactive Data Analysis Dashboard
- Company Analysis Dashboard for high growth potential opportunities
- Research Analyst Access for customization & queries
- Competitor Analysis with Interactive dashboard
- Latest News, Updates & Trend analysis
- Harness the Power of Benchmark Analysis for Comprehensive Competitor Tracking
Data collection and base year analysis are done using data collection modules with large sample sizes. The stage includes obtaining market information or related data through various sources and strategies. It includes examining and planning all the data acquired from the past in advance. It likewise envelops the examination of information inconsistencies seen across different information sources. The market data is analysed and estimated using market statistical and coherent models. Also, market share analysis and key trend analysis are the major success factors in the market report. To know more, please request an analyst call or drop down your inquiry.
The key research methodology used by DBMR research team is data triangulation which involves data mining, analysis of the impact of data variables on the market and primary (industry expert) validation. Data models include Vendor Positioning Grid, Market Time Line Analysis, Market Overview and Guide, Company Positioning Grid, Patent Analysis, Pricing Analysis, Company Market Share Analysis, Standards of Measurement, Global versus Regional and Vendor Share Analysis. To know more about the research methodology, drop in an inquiry to speak to our industry experts.
Data Bridge Market Research is a leader in advanced formative research. We take pride in servicing our existing and new customers with data and analysis that match and suits their goal. The report can be customized to include price trend analysis of target brands understanding the market for additional countries (ask for the list of countries), clinical trial results data, literature review, refurbished market and product base analysis. Market analysis of target competitors can be analyzed from technology-based analysis to market portfolio strategies. We can add as many competitors that you require data about in the format and data style you are looking for. Our team of analysts can also provide you data in crude raw excel files pivot tables (Fact book) or can assist you in creating presentations from the data sets available in the report.


