
Global Myeloproliferative Disorders Drugs Market
Market Size in USD Billion
 USD
9.75 Billion
USD
12.83 Billion
2025
2033
USD
9.75 Billion
USD
12.83 Billion
2025
2033
| 2026 - 2033 | |
| USD 9.75 Billion | |
| USD 12.83 Billion | |
| % | |
|
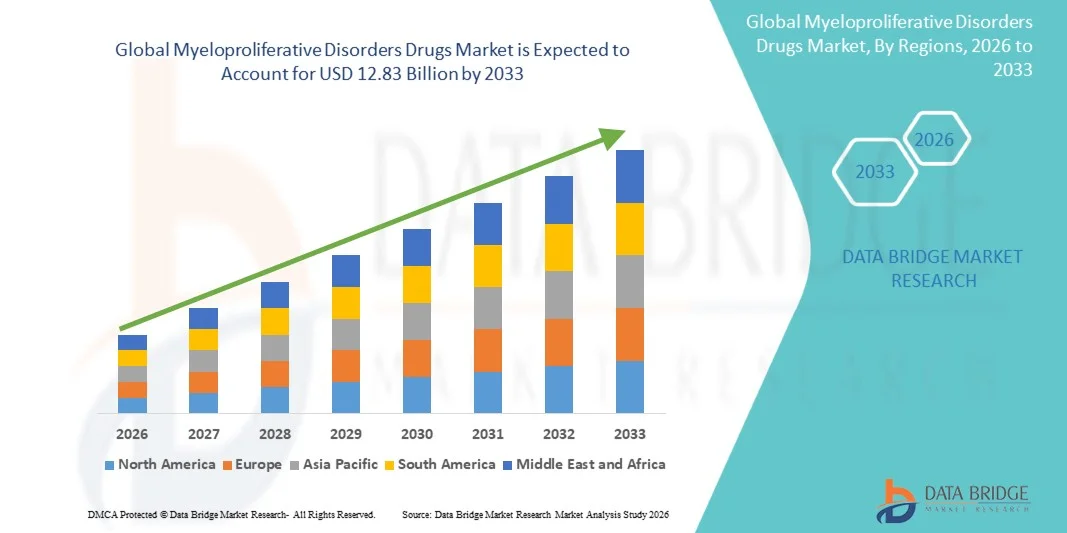
Myeloproliferative Disorders Drugs Market Size
- The global myeloproliferative disorders drugs market size was valued at USD 9.75 billion in 2025and is expected to reach USD 12.83 billion by 2033, at a CAGR of 3.50% during the forecast period
- The market growth is largely fueled by the increasing prevalence of hematological malignancies, rising awareness regarding early diagnosis of blood disorders, and continuous advancements in targeted oncology therapies, leading to growing demand for effective treatment solutions across healthcare settings
- Furthermore, increasing adoption of precision medicine, rising investments in cancer research and drug development, and growing demand for innovative therapies with improved clinical outcomes are establishing myeloproliferative disorders drugs as essential components of modern hematology treatment. These converging factors are accelerating the uptake of Myeloproliferative Disorders Drugs solutions, thereby significantly boosting the industry's growth
Myeloproliferative Disorders Drugs Market Analysis
- Myeloproliferative disorders drugs, including targeted therapies, chemotherapy agents, immunomodulators, and JAK inhibitors, are becoming increasingly important in modern hematology care due to the rising prevalence of chronic blood cancers and the growing need for effective long-term disease management solutions
- The escalating demand for myeloproliferative disorders drugs is primarily fueled by increasing incidence of blood malignancies, growing awareness regarding early diagnosis and treatment, and rising adoption of precision medicine and targeted oncology therapies aimed at improving patient outcomes and disease control
- North America dominated the myeloproliferative disorders drugs market with the largest revenue share of 41.3% in 2025, characterized by advanced healthcare infrastructure, strong oncology research activities, and high adoption of innovative targeted therapies, with the U.S. experiencing substantial growth in myeloproliferative disorder treatment adoption driven by increasing healthcare expenditure, expanding clinical trial activities, and rising prevalence of hematological malignancies
- Asia-Pacific is expected to be the fastest growing region in the myeloproliferative disorders drugs market during the forecast period due to rising healthcare investments, increasing awareness regarding blood cancer treatment, expanding access to advanced oncology therapies, and growing prevalence of hematological disorders across emerging economies
- The targeted therapy segment held the largest market revenue share of 63.5% in 2025, driven by the strong clinical success of tyrosine kinase inhibitors and JAK inhibitors in the treatment of myeloproliferative disorders
Report Scope and Myeloproliferative Disorders Drugs Market Segmentation
|
Attributes |
Myeloproliferative Disorders Drugs Key Market Insights |
|
Segments Covered |
|
|
Countries Covered |
North America · U.S. · Canada · Mexico Europe · Germany · France · U.K. · Netherlands · Switzerland · Belgium · Russia · Italy · Spain · Turkey · Rest of Europe Asia-Pacific · China · Japan · India · South Korea · Singapore · Malaysia · Australia · Thailand · Indonesia · Philippines · Rest of Asia-Pacific Middle East and Africa · Saudi Arabia · U.A.E. · South Africa · Egypt · Israel · Rest of Middle East and Africa South America · Brazil · Argentina · Rest of South America |
|
Key Market Players |
· Novartis AG (Switzerland) · Bristol-Myers Squibb Company (U.S.) · Pfizer Inc. (U.S.) · Incyte Corporation (U.S.) · F. Hoffmann-La Roche Ltd. (Switzerland) · AstraZeneca plc (U.K.) · Merck & Co., Inc. (U.S.) · Takeda Pharmaceutical Company Limited (Japan) · Eli Lilly and Company (U.S.) · Johnson & Johnson Services, Inc. (U.S.) · AbbVie Inc. (U.S.) · Teva Pharmaceutical Industries Ltd. (Israel) · Sun Pharmaceutical Industries Ltd. (India) · Cipla Limited (India) · Dr. Reddy’s Laboratories Ltd. (India) · Bristol Laboratories Ltd. (U.K.) · Bayer AG (Germany) · Amgen Inc. (U.S.) · Sanofi S.A. (France) · GlaxoSmithKline plc (U.K.) |
|
Market Opportunities |
· Increasing adoption of targeted therapies and JAK inhibitors for the treatment of myeloproliferative disorders · Rising Demand in Emerging Markets |
|
Value Added Data Infosets |
In addition to the insights on market scenarios such as market value, growth rate, segmentation, geographical coverage, and major players, the market reports curated by the Data Bridge Market Research also include in-depth expert analysis, patient epidemiology, pipeline analysis, pricing analysis, and regulatory framework. |
Myeloproliferative Disorders Drugs Market Trends
“Increasing Development of Targeted Therapies and Precision Oncology Approaches”
- A significant and accelerating trend in the global Myeloproliferative Disorders Drugs market is the growing development of targeted therapies and precision oncology approaches aimed at improving treatment effectiveness and long-term patient outcomes
- For instance, pharmaceutical companies are increasingly focusing on the development of Janus kinase (JAK) inhibitors and other targeted therapeutic agents designed to address abnormal blood cell production and genetic mutations associated with myeloproliferative disorders such as polycythemia vera, essential thrombocythemia, and myelofibrosis
- The growing integration of molecular diagnostics, biomarker identification, and genetic profiling is enabling healthcare providers to implement more personalized treatment strategies tailored to individual patient conditions and mutation profiles
- Furthermore, increasing research into combination therapies, immunotherapies, and next-generation targeted drugs is expanding treatment possibilities for patients with resistant or advanced-stage myeloproliferative disorders
- Advancements in hematology research and improved understanding of disease biology are also supporting the development of therapies aimed at reducing symptom burden, minimizing disease progression, and improving quality of life for affected patients
- This trend toward precision medicine and innovative targeted therapies is reshaping treatment standards and driving continuous innovation in the Myeloproliferative Disorders Drugs market globally
Myeloproliferative Disorders Drugs Market Dynamics
Driver
“Rising Prevalence of Hematologic Disorders and Growing Demand for Effective Long-Term Treatments”
- The increasing prevalence of hematologic malignancies and chronic blood disorders is a major factor driving the growth of the Myeloproliferative Disorders Drugs market
- For instance, the rising incidence of myelofibrosis, polycythemia vera, and essential thrombocythemia is increasing demand for advanced therapeutic solutions capable of managing symptoms, controlling abnormal blood cell production, and reducing disease-related complications
- Healthcare providers are increasingly emphasizing early diagnosis and long-term disease management to prevent complications such as thrombosis, anemia, splenomegaly, and transformation into acute leukemia. This is contributing to greater adoption of targeted drug therapies and advanced hematology treatment protocols
- Furthermore, increasing healthcare expenditure, expansion of specialized oncology and hematology treatment centers, and growing awareness regarding rare blood cancers are supporting market expansion globally
- The growing geriatric population, which is more susceptible to hematologic disorders and chronic disease conditions, is also contributing to rising demand for myeloproliferative disorder therapeutics
- In addition, ongoing clinical trials, orphan drug development initiatives, and supportive regulatory pathways for rare disease treatments are further strengthening market growth opportunities
Restraint/Challenge
“High Treatment Costs and Limited Curative Options”
- The high cost associated with targeted therapies and long-term treatment regimens remains a significant challenge for the Myeloproliferative Disorders Drugs market, particularly in low- and middle-income regions
- For instance, advanced therapies such as JAK inhibitors and novel biologic treatments often involve prolonged treatment durations and continuous monitoring, increasing the overall financial burden on patients and healthcare systems
- In addition, despite advancements in therapeutic development, many currently available treatments primarily focus on symptom management and disease control rather than providing definitive cures, limiting treatment outcomes for some patients
- The complexity of disease diagnosis and variability in patient response to therapy may also complicate treatment planning and clinical management
- Furthermore, stringent regulatory approval processes, high research and development costs, and limited patient populations for certain rare myeloproliferative disorders may create commercialization challenges for pharmaceutical manufacturers
- Addressing these challenges through expanded research activities, development of cost-effective treatment solutions, improved patient access programs, and continued innovation in targeted hematology therapies will be essential for sustaining long-term growth in the global Myeloproliferative Disorders Drugs market
Myeloproliferative Disorders Drugs Market Scope
The market is segmented on the basis of type, treatment type, route of administration, end-users, and distribution channel.
- By Type
On the basis of type, the Myeloproliferative Disorders Drugs market is segmented into Philadelphia chromosome–negative myeloproliferative neoplasms and Philadelphia chromosome–positive chronic myeloid leukemia. The Philadelphia chromosome–positive chronic myeloid leukemia segment dominated the largest market revenue share of 57.2% in 2025, driven by the increasing prevalence of chronic myeloid leukemia (CML) and the widespread adoption of targeted tyrosine kinase inhibitor therapies. This segment has experienced substantial growth due to advancements in molecular diagnostics and improved disease monitoring techniques that enable early detection and personalized treatment strategies. Healthcare providers increasingly prefer targeted therapies for Philadelphia chromosome–positive CML because of their high clinical efficacy, improved survival outcomes, and reduced disease progression risks. In addition, rising awareness regarding hematologic malignancies and growing access to specialized oncology care have significantly contributed to market expansion. Pharmaceutical companies continue to invest heavily in the development of next-generation kinase inhibitors with improved resistance profiles and reduced adverse effects. Expanding healthcare infrastructure and supportive reimbursement policies for cancer therapeutics are further strengthening segment demand globally. Furthermore, increasing research collaborations and clinical trial activities focused on precision oncology are expected to sustain strong segment dominance during the forecast period.
The Philadelphia chromosome–negative myeloproliferative neoplasms segment is anticipated to witness the fastest CAGR of 22.8% from 2026 to 2033, driven by the rising prevalence of rare blood cancers such as polycythemia vera, essential thrombocythemia, and myelofibrosis. Increasing awareness regarding genetic mutations such as JAK2, MPL, and CALR has significantly improved disease diagnosis and therapeutic targeting. Healthcare providers are increasingly adopting advanced biologic and targeted therapies to improve symptom control and reduce thrombotic complications associated with these disorders. In addition, ongoing research into novel immunotherapies and disease-modifying agents is accelerating treatment innovation. Rising investments in orphan drug development and precision medicine approaches are further contributing to segment growth. Expanding access to specialized hematology treatment centers and increasing patient participation in clinical trials are expected to strengthen future market expansion globally.
- By Treatment Type
On the basis of treatment type, the Myeloproliferative Disorders Drugs market is segmented into targeted therapy, chemotherapy, and others. The targeted therapy segment held the largest market revenue share of 63.5% in 2025, driven by the strong clinical success of tyrosine kinase inhibitors and JAK inhibitors in the treatment of myeloproliferative disorders. Targeted therapies are widely preferred because they specifically inhibit disease-causing molecular pathways while minimizing damage to healthy cells. Physicians increasingly prescribe targeted therapies due to their improved efficacy, reduced relapse rates, and better patient survival outcomes compared to conventional chemotherapy. The growing prevalence of chronic hematologic malignancies and increasing adoption of personalized medicine have significantly contributed to segment growth. In addition, advancements in genomic profiling and biomarker-based treatment selection are supporting broader utilization of targeted oncology therapies. Pharmaceutical companies continue to expand their pipelines with innovative kinase inhibitors and immunomodulatory agents. Rising healthcare investments in cancer research and improved access to advanced hematology care are further strengthening market demand. Furthermore, supportive regulatory approvals and accelerated pathways for precision oncology drugs are expected to sustain segment dominance during the forecast period.
The chemotherapy segment is expected to witness the fastest CAGR of 18.9% from 2026 to 2033, driven by its continued use in advanced-stage and treatment-resistant myeloproliferative disorders. Chemotherapy remains an important therapeutic option for patients who are not suitable candidates for targeted therapies or stem cell transplantation. Healthcare providers increasingly utilize combination chemotherapy regimens to improve disease control and manage aggressive hematologic conditions. The growing burden of blood cancers and increasing demand for cost-effective cancer treatment options are significantly contributing to segment growth. In addition, advancements in supportive oncology care and reduced toxicity protocols are improving patient tolerance and treatment outcomes. Rising investments in oncology infrastructure and expanding cancer care services globally are expected to further support future market expansion.
- By Route of Administration
On the basis of route of administration, the Myeloproliferative Disorders Drugs market is segmented into oral, parenteral, and others. The oral segment accounted for the largest market revenue share of 59.4% in 2025, driven by the extensive use of oral tyrosine kinase inhibitors and targeted therapies in long-term management of myeloproliferative disorders. Oral administration is widely preferred due to its convenience, improved patient compliance, and suitability for chronic outpatient treatment. Patients and healthcare providers increasingly favor oral therapies because they reduce hospitalization dependency and support home-based disease management. The growing availability of advanced oral oncology drugs with improved efficacy and manageable side-effect profiles has significantly contributed to segment growth. In addition, increasing awareness regarding early diagnosis and continuous treatment adherence is supporting broader market penetration. Pharmaceutical companies continue to invest in innovative oral formulations and combination therapies to improve patient outcomes. Expanding access to specialty pharmacies and online medication distribution channels is further strengthening segment dominance. Furthermore, rising adoption of personalized cancer care and remote patient monitoring systems is expected to sustain strong future growth.
The parenteral segment is projected to witness the fastest CAGR of 20.6% from 2026 to 2033, driven by increasing utilization of injectable biologics, immunotherapies, and chemotherapy agents in severe and advanced-stage hematologic disorders. Parenteral administration is essential in hospital and specialty clinic settings where rapid therapeutic action and precise dosage control are required. Healthcare providers increasingly utilize intravenous therapies for patients with aggressive disease progression and treatment-resistant conditions. The growing development of monoclonal antibodies and advanced biologic oncology therapies is significantly contributing to segment growth. In addition, improvements in infusion technologies and supportive cancer care infrastructure are enhancing treatment efficiency and patient outcomes. Rising investments in oncology treatment centers and expanding clinical research activities are expected to further accelerate future market expansion globally.
- By End-Users
On the basis of end-users, the Myeloproliferative Disorders Drugs market is segmented into hospitals, homecare, specialty clinics, and others. The hospitals segment dominated the largest market revenue share of 55.8% in 2025, driven by the high volume of hematologic cancer diagnoses, treatment procedures, and patient monitoring services performed in hospital settings. Hospitals serve as primary treatment centers for myeloproliferative disorders due to the availability of specialized hematologists, oncology infrastructure, and advanced diagnostic technologies. Increasing incidences of blood cancers and rising demand for multidisciplinary cancer care have significantly boosted hospital-based treatment demand. In addition, hospitals increasingly invest in advanced molecular diagnostics, targeted therapy administration systems, and precision oncology programs to improve patient outcomes. Growing healthcare expenditure and expansion of cancer treatment facilities globally are further supporting segment growth. Rising adoption of personalized treatment strategies and advanced monitoring systems is also contributing to higher patient admissions. Furthermore, supportive reimbursement policies and government initiatives for cancer care are expected to sustain strong segment dominance during the forecast period.
The homecare segment is anticipated to witness the fastest CAGR of 21.4% from 2026 to 2033, driven by the increasing preference for home-based management of chronic hematologic disorders. Patients receiving long-term oral targeted therapies increasingly prefer homecare settings due to convenience, lower treatment costs, and improved quality of life. The growing adoption of telemedicine platforms and remote patient monitoring technologies is significantly supporting segment growth. In addition, healthcare providers are integrating digital oncology care systems and home-based supportive therapies to improve treatment adherence and disease monitoring. Rising awareness regarding patient-centered cancer care and expansion of specialty home healthcare services are further accelerating market demand. Expanding access to remote consultation services and home medication delivery systems is expected to further strengthen future market growth globally.
- By Distribution Channel
On the basis of distribution channel, the Myeloproliferative Disorders Drugs market is segmented into hospital pharmacy, online pharmacy, and retail pharmacy. The hospital pharmacy segment held the largest market revenue share of 48.9% in 2025, driven by the high dependency on hospital-based oncology treatment and specialty drug administration for myeloproliferative disorders. Hospital pharmacies play a critical role in ensuring timely access to targeted therapies, chemotherapy agents, and supportive oncology medications. Healthcare institutions increasingly rely on hospital pharmacy systems for controlled dispensing, dosage monitoring, and adverse event management. The growing number of hematologic cancer admissions and increasing use of high-cost specialty biologics have significantly contributed to segment growth. In addition, advancements in pharmacy automation systems and integrated cancer care management technologies are improving operational efficiency and medication safety. Rising healthcare infrastructure investments and expansion of oncology treatment centers globally continue to strengthen market demand. Increasing adoption of personalized oncology therapies and specialty drug programs is expected to sustain segment dominance throughout the forecast period.
The online pharmacy segment is expected to witness the fastest CAGR of 24.7% from 2026 to 2033, driven by the rapid expansion of digital healthcare ecosystems and increasing consumer preference for convenient medication purchasing solutions. Online pharmacies provide easy access to chronic oncology medications, home delivery services, and digital prescription management platforms. The growing adoption of teleoncology and remote patient consultation services is significantly accelerating segment growth. Patients increasingly prefer online pharmaceutical services because of affordability, accessibility, and convenience, particularly for long-term cancer management. In addition, rising smartphone penetration, internet connectivity, and secure digital payment systems are supporting broader e-pharmacy expansion globally. Pharmaceutical companies and healthcare providers are actively strengthening digital distribution networks and online prescription verification systems. Regulatory advancements supporting e-pharmacy operations are expected to further contribute to robust future market growth.
Myeloproliferative Disorders Drugs Market Regional Analysis
- North America dominated the myeloproliferative disorders drugs market with the largest revenue share of 41.3% in 2025, characterized by advanced healthcare infrastructure, strong oncology research activities, and high adoption of innovative targeted therapies
- The region benefits from increasing prevalence of hematological malignancies, rising healthcare expenditure, and strong presence of leading pharmaceutical and biotechnology companies focused on oncology drug development
- Furthermore, expanding clinical trial activities, advancements in precision medicine, and increasing adoption of targeted therapies such as JAK inhibitors are significantly contributing to market growth across North America
U.S. Myeloproliferative Disorders Drugs Market Insight
The U.S. myeloproliferative disorders drugs market captured the largest revenue share within North America in 2025, driven by increasing healthcare expenditure, expanding clinical trial activities, and rising prevalence of hematological malignancies. The country is witnessing substantial growth in the adoption of advanced targeted therapies and personalized treatment approaches for myeloproliferative disorders. Additionally, strong pharmaceutical innovation, growing investments in oncology research, and increasing awareness regarding early diagnosis and disease management are supporting market expansion in the U.S.
Europe Myeloproliferative Disorders Drugs Market Insight
Europe myeloproliferative disorders drugs market is projected to expand at a substantial CAGR throughout the forecast period, primarily driven by increasing prevalence of blood cancers and growing demand for advanced oncology treatment solutions. The region’s strong healthcare infrastructure, combined with rising investments in hematology research and targeted therapy development, is fostering market growth. Moreover, increasing awareness regarding early diagnosis and improved treatment accessibility are contributing significantly to the expansion of the market across Europe.
U.K. Myeloproliferative Disorders Drugs Market Insight
The United Kingdom myeloproliferative disorders drugs market is anticipated to grow at a noteworthy CAGR during the forecast period, driven by increasing awareness regarding hematological disorders and rising adoption of innovative targeted therapies. The country’s advanced healthcare system and growing focus on precision oncology are supporting market growth. Furthermore, increasing government healthcare initiatives, expanding cancer research programs, and rising demand for effective long-term treatment solutions are expected to further stimulate the market in the U.K.
Germany Myeloproliferative Disorders Drugs Market Insight
The Germany myeloproliferative disorders drugs market is expected to expand at a considerable CAGR during the forecast period, fueled by strong pharmaceutical manufacturing capabilities, advanced healthcare infrastructure, and increasing investments in oncology innovation. Germany’s emphasis on biotechnology research and precision medicine is encouraging the adoption of advanced targeted therapies for hematological malignancies. Additionally, growing prevalence of blood cancers and rising clinical research activities are positively influencing market growth in the country.
Asia-Pacific Myeloproliferative Disorders Drugs Market Insight
Asia-Pacific myeloproliferative disorders drugs market is expected to be the fastest growing region in the Myeloproliferative Disorders Drugs market during the forecast period due to rising healthcare investments, increasing awareness regarding blood cancer treatment, expanding access to advanced oncology therapies, and growing prevalence of hematological disorders across emerging economies. Rapid improvements in healthcare infrastructure, increasing government support for cancer care programs, and rising accessibility to advanced treatment solutions are further accelerating market growth. Additionally, the region’s large patient population and increasing focus on early cancer diagnosis are contributing significantly to the adoption of myeloproliferative disorder drugs.
Japan Myeloproliferative Disorders Drugs Market Insight
The Japan Myeloproliferative Disorders Drugs market is gaining momentum due to the country’s advanced healthcare infrastructure, aging population, and strong focus on oncology innovation. Rising prevalence of hematological malignancies, coupled with increasing adoption of targeted therapies and precision medicine approaches, is supporting market growth. Furthermore, Japan’s emphasis on improving cancer treatment outcomes and expanding clinical research capabilities is contributing to increasing utilization of myeloproliferative disorder therapeutics across healthcare settings.
China Myeloproliferative Disorders Drugs Market Insight
The China myeloproliferative disorders drugs market accounted for the largest market revenue share in Asia-Pacific in 2025, attributed to expanding healthcare infrastructure, increasing prevalence of hematological disorders, and rising healthcare expenditure. The country is witnessing growing demand for advanced oncology therapies supported by improving healthcare accessibility and increasing awareness regarding blood cancer management. Additionally, strong pharmaceutical manufacturing capabilities, government healthcare modernization initiatives, and expanding oncology research activities are key factors propelling market growth in China.
Myeloproliferative Disorders Drugs Market Share
The Myeloproliferative Disorders Drugs industry is primarily led by well-established companies, including:
- Novartis AG (Switzerland)
- Bristol-Myers Squibb Company (U.S.)
- Pfizer Inc. (U.S.)
- Incyte Corporation (U.S.)
- Hoffmann-La Roche Ltd. (Switzerland)
- AstraZeneca plc (U.K.)
- Merck & Co., Inc. (U.S.)
- Takeda Pharmaceutical Company Limited (Japan)
- Eli Lilly and Company (U.S.)
- Johnson & Johnson Services, Inc. (U.S.)
- AbbVie Inc. (U.S.)
- Teva Pharmaceutical Industries Ltd. (Israel)
- Sun Pharmaceutical Industries Ltd. (India)
- Cipla Limited (India)
- Reddy’s Laboratories Ltd. (India)
- Bristol Laboratories Ltd. (U.K.)
- Bayer AG (Germany)
- Amgen Inc. (U.S.)
- Sanofi S.A. (France)
- GlaxoSmithKline plc (U.K.)
Latest Developments in Global Myeloproliferative Disorders Drugs Market
- In November 2021, PharmaEssentia announced that the U.S. Food and Drug Administration (FDA) approved BESREMi (ropeginterferon alfa-2b-njft) for the treatment of adults with polycythemia vera, marking the first interferon therapy specifically approved for polycythemia vera in the United States. The approval represented a significant advancement in the treatment landscape for myeloproliferative disorders by offering a long-acting interferon therapy with durable hematologic and molecular responses
- In March 2022, the U.S. FDA approved Vonjo (pacritinib) for the treatment of adults with intermediate or high-risk primary or secondary myelofibrosis with severe thrombocytopenia, making it the first approved therapy specifically indicated for myelofibrosis patients with platelet counts below 50 × 10⁹/L. The approval addressed a major unmet need in the myeloproliferative disorders drugs market for patients with limited treatment options.
- In September 2023, GSK announced that the U.S. FDA approved Ojjaara® (momelotinib) for the treatment of intermediate or high-risk myelofibrosis with anemia, including primary and secondary myelofibrosis. Ojjaara became the first approved therapy designed to address anemia, splenomegaly, and constitutional symptoms simultaneously in myelofibrosis patients, significantly expanding therapeutic options within the global myeloproliferative disorders drugs market
- In November 2023, the European Medicines Agency (EMA) issued a positive opinion recommending approval of momelotinib for myelofibrosis patients with anemia. The recommendation strengthened global regulatory momentum for advanced Janus kinase (JAK) inhibitor therapies aimed at improving disease management and quality of life in myeloproliferative neoplasm patients
- In October 2024, Novartis announced that the U.S. FDA granted accelerated approval for Scemblix (asciminib) as a first-line treatment for adults with newly diagnosed Philadelphia chromosome-positive chronic myeloid leukemia in chronic phase. The approval was based on superior molecular response data from the Phase III ASC4FIRST trial and highlighted continued innovation in targeted therapies for myeloproliferative disorders
SKU-

- Interactive Data Analysis Dashboard
- Company Analysis Dashboard for high growth potential opportunities
- Research Analyst Access for customization & queries
- Competitor Analysis with Interactive dashboard
- Latest News, Updates & Trend analysis
- Harness the Power of Benchmark Analysis for Comprehensive Competitor Tracking
Data collection and base year analysis are done using data collection modules with large sample sizes. The stage includes obtaining market information or related data through various sources and strategies. It includes examining and planning all the data acquired from the past in advance. It likewise envelops the examination of information inconsistencies seen across different information sources. The market data is analysed and estimated using market statistical and coherent models. Also, market share analysis and key trend analysis are the major success factors in the market report. To know more, please request an analyst call or drop down your inquiry.
The key research methodology used by DBMR research team is data triangulation which involves data mining, analysis of the impact of data variables on the market and primary (industry expert) validation. Data models include Vendor Positioning Grid, Market Time Line Analysis, Market Overview and Guide, Company Positioning Grid, Patent Analysis, Pricing Analysis, Company Market Share Analysis, Standards of Measurement, Global versus Regional and Vendor Share Analysis. To know more about the research methodology, drop in an inquiry to speak to our industry experts.
Data Bridge Market Research is a leader in advanced formative research. We take pride in servicing our existing and new customers with data and analysis that match and suits their goal. The report can be customized to include price trend analysis of target brands understanding the market for additional countries (ask for the list of countries), clinical trial results data, literature review, refurbished market and product base analysis. Market analysis of target competitors can be analyzed from technology-based analysis to market portfolio strategies. We can add as many competitors that you require data about in the format and data style you are looking for. Our team of analysts can also provide you data in crude raw excel files pivot tables (Fact book) or can assist you in creating presentations from the data sets available in the report.


