
Global Neuromyelitis Optica Treatment Market
Market Size in USD Million
 USD
297.72 Million
USD
503.94 Million
2024
2032
USD
297.72 Million
USD
503.94 Million
2024
2032
| 2025 - 2032 | |
| USD 297.72 Million | |
| USD 503.94 Million | |
| % | |
|
Neuromyelitis Optica Treatment Market Analysis
The neuromyelitis optica treatment market is gaining traction due to the rising prevalence of neuromyelitis optica spectrum disorder and advancements in therapeutic options. Neuromyelitis optica spectrum disorder is a rare autoimmune condition characterized by severe inflammation of the optic nerves and spinal cord, leading to vision loss and disability. Recent developments in the market have focused on targeted therapies that specifically address the underlying pathophysiology of the disease, including monoclonal antibodies that inhibit key proteins involved in the inflammatory process. The growing awareness of neuromyelitis optica spectrum disorder among healthcare professionals and patients is driving the demand for effective treatment options. Additionally, ongoing clinical trials and research are expanding the pipeline of potential therapies, which is expected to enhance patient outcomes. As the understanding of the condition evolves, the market is poised for significant growth, presenting opportunities for pharmaceutical companies and healthcare providers to develop innovative solutions tailored to the needs of affected individuals.
Neuromyelitis Optica Treatment Market Size
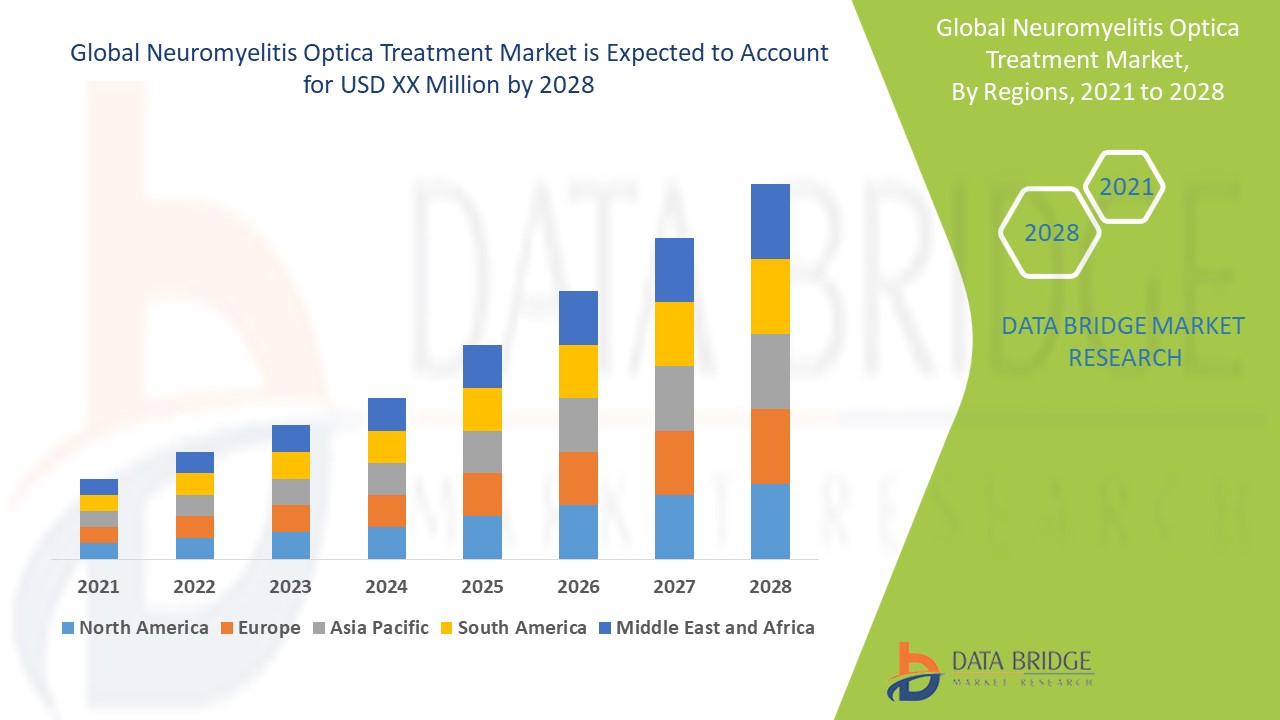
The global neuromyelitis optica treatment market size was valued at USD 297.72 million in 2024 and is projected to reach USD 503.94 million by 2032, with a CAGR of 6.80% during the forecast period of 2025 to 2032. In addition to the insights on market scenarios such as market value, growth rate, segmentation, geographical coverage, and major players, the market reports curated by the Data Bridge Market Research also include depth expert analysis, patient epidemiology, pipeline analysis, pricing analysis, and regulatory framework.
Neuromyelitis Optica Treatment Market Trends
“Development of Targeted Therapies”
The neuromyelitis optica treatment market is evolving rapidly, driven by innovations in therapeutic approaches and increased research efforts. A notable trend is the development of targeted therapies, particularly monoclonal antibodies, designed to specifically inhibit inflammatory processes associated with neuromyelitis optica spectrum disorder. These advancements are enhancing the efficacy and safety of treatments, offering hope for better patient outcomes. Furthermore, the integration of precision medicine is gaining traction, allowing for personalized treatment plans based on individual patient profiles. As awareness of the disorder grows and more clinical trials are initiated, the market is expected to witness substantial growth, reflecting a commitment to improving the quality of care for those affected by this debilitating condition.
Report Scope and Neuromyelitis Optica Treatment Market Segmentation
|
Attributes |
Neuromyelitis Optica Treatment Key Market Insights |
|
Segments Covered |
|
|
Countries Covered |
U.S., Canada and Mexico in North America, Germany, France, U.K., Netherlands, Switzerland, Belgium, Russia, Italy, Spain, Turkey, Rest of Europe in Europe, China, Japan, India, South Korea, Singapore, Malaysia, Australia, Thailand, Indonesia, Philippines, Rest of Asia-Pacific (APAC) in the Asia-Pacific (APAC), Saudi Arabia, U.A.E., South Africa, Egypt, Israel, Rest of Middle East and Africa (MEA) as a part of Middle East and Africa (MEA), Brazil, Argentina and Rest of South America as part of South America |
|
Key Market Players |
F. Hoffmann-La Roche Ltd (Switzerland), AstraZeneca (U.K.), Teva Pharmaceutical Industries Ltd. (Israel), Alexion Pharmaceuticals, Inc (U.S.), Viela Bio (U.S.), Anvil Biosciences (U.S.), Opexa Therapeutics, Inc (U.S.), Arrien Pharmaceuticals, LLC (U.S.), TG Therapeutics, Inc (U.S.), Bionure (Spain) |
|
Market Opportunities |
|
|
Value Added Data Infosets |
In addition to the insights on market scenarios such as market value, growth rate, segmentation, geographical coverage, and major players, the market reports curated by the Data Bridge Market Research also include depth expert analysis, patient epidemiology, pipeline analysis, pricing analysis, and regulatory framework. |
Neuromyelitis Optica Treatment Market Definition
Neuromyelitis optica treatment encompasses medical interventions aimed at managing neuromyelitis optica spectrum disorder, an autoimmune condition that causes inflammation of the optic nerves and spinal cord. Treatment typically includes immunosuppressive medications, monoclonal antibodies, corticosteroids, and plasma exchange therapy, focusing on reducing inflammation, alleviating symptoms, preventing relapses, and preserving neurological function to enhance patients' quality of life.
Neuromyelitis Optica Treatment Market Dynamics
Drivers
- Increasing Incidence of Neuromyelitis Optica
The increasing prevalence of neuromyelitis optica spectrum disorder is significantly contributing to the demand for effective treatment options, thereby driving market growth. As awareness of this rare autoimmune condition grows, more patients are being diagnosed and seeking medical interventions to manage their symptoms and improve their quality of life. This rising incidence necessitates the development and availability of targeted therapies and innovative treatment solutions. Healthcare providers are increasingly recognizing the importance of timely and effective management of the disorder, leading to an expanded market for therapeutic options. Consequently, pharmaceutical companies are motivated to invest in research and development to meet the escalating needs of patients, further propelling market growth.
- Rising Research and Clinical Trials
Ongoing clinical trials and research initiatives are crucial in expanding the pipeline of potential therapies for neuromyelitis optica spectrum disorder, thereby driving interest in the treatment market. These efforts are focused on developing innovative and targeted therapies that address the unique challenges of the condition, which can significantly improve treatment outcomes for patients. As new therapies emerge from clinical trials, they offer promising alternatives to traditional treatment options, enhancing the overall efficacy and safety of management strategies. Additionally, the increasing investment in research underscores the commitment of pharmaceutical companies and researchers to advance the understanding of neuromyelitis optica, fostering a dynamic environment that encourages the exploration of novel treatment approaches and further stimulating market growth.
Opportunities
- Rise of Telemedicine
The rise of telemedicine offers significant opportunities to enhance patient access to specialists and facilitate remote monitoring for individuals with neuromyelitis optica spectrum disorder. By leveraging telehealth platforms, patients can easily consult with neurologists and other healthcare professionals from the comfort of their homes, eliminating barriers related to travel and scheduling. This increased accessibility allows for timely interventions and regular follow-ups, which are crucial for managing the condition effectively. Additionally, remote monitoring technologies enable healthcare providers to track patients' health data in real-time, facilitating personalized treatment adjustments and proactive management of symptoms. As a result, the integration of telemedicine in neuromyelitis optica care improves patient outcomes and expands the market potential for innovative healthcare solutions.
- Development of New and Innovative Therapies
There is a substantial opportunity for the development of new and innovative therapies, such as monoclonal antibodies and small molecules, that specifically target the underlying mechanisms of neuromyelitis optica spectrum disorder. These advanced therapies can offer more effective treatment options by addressing the root causes of the disease, potentially improving patient outcomes significantly. The growing understanding of the pathophysiology of neuromyelitis optica paves the way for targeted interventions that can reduce disease activity and prevent relapses. Furthermore, as research continues to uncover novel therapeutic pathways, pharmaceutical companies are encouraged to invest in developing these promising treatments, thus expanding their market presence and catering to the evolving needs of patients. This innovation enhances treatment options and contributes to a more personalized approach to managing neuromyelitis optica.
Restraints/Challenges
- Competing Therapeutic Options
The presence of alternative treatments for autoimmune disorders poses a significant challenge for therapies targeting neuromyelitis optica spectrum disorder. Established treatments for other autoimmune conditions may overshadow neuromyelitis optica therapies, making it difficult for newer and potentially more effective treatments to gain market share. Physicians often prioritize familiar options that have a proven track record, leading to hesitance in adopting novel therapies for neuromyelitis optica. This competition can result in limited awareness of the benefits and unique mechanisms of action of neuromyelitis optica treatments, ultimately impacting patient access and reducing the incentive for pharmaceutical companies to invest in research and development in this area. Consequently, the market struggles to achieve its full potential despite the need for effective treatment options.
- High Cost of Treatments
The significant expenses associated with innovative therapies, such as monoclonal antibodies, present a considerable restraint in the neuromyelitis optica treatment market. These advanced therapies often come with high price tags, which can limit patient access, especially in regions with constrained healthcare budgets. Many healthcare providers may hesitate to prescribe these costly options due to concerns about patients' ability to afford them or lack of insurance coverage. This financial barrier affects treatment adherence and contributes to disparities in healthcare access, ultimately hindering the overall effectiveness of treatment strategies for neuromyelitis optica spectrum disorder. As a result, the high costs associated with innovative therapies remain a critical challenge for market growth and patient care.
This market report provides details of new recent developments, trade regulations, import-export analysis, production analysis, value chain optimization, market share, impact of domestic and localized market players, analyses opportunities in terms of emerging revenue pockets, changes in market regulations, strategic market growth analysis, market size, category market growths, application niches and dominance, product approvals, product launches, geographic expansions, technological innovations in the market. To gain more info on the market contact Data Bridge Market Research for an Analyst Brief, our team will help you take an informed market decision to achieve market growth.
Neuromyelitis Optica Treatment Market Scope
The market is segmented on the basis of treatment type, drugs, route of administration, and end-users. The growth amongst these segments will help you analyse meagre growth segments in the industries and provide the users with a valuable market overview and market insights to help them make strategic decisions for identifying core market applications.
Types
- Neuromyelitis Optica Spectrum Disorder with Aquaporin-4 Antibodies
- Neuromyelitis Optica Spectrum Disorder without Aquaporin-4 Antibodies
Treatment Type
- Medication
- Plasma Exchange Therapy
- Immunoglobulin Therapy
Drugs
- C5 Protein Inhibitor
- Oral Corticosteroid
- Non-Steroid Immunosuppressive Drugs
- Others
Route of Administration
- Oral
- Injectable
End-Users
- Hospitals
- Homecare
- Specialty Clinics
- Others
Neuromyelitis Optica Treatment Market Regional Analysis
The market is analysed and market size insights and trends are provided by country, treatment type, drugs, route of administration, and end-users as referenced above.
The countries covered in the market report are U.S., Canada and Mexico in North America, Germany, France, U.K., Netherlands, Switzerland, Belgium, Russia, Italy, Spain, Turkey, Rest of Europe in Europe, China, Japan, India, South Korea, Singapore, Malaysia, Australia, Thailand, Indonesia, Philippines, Rest of Asia-Pacific (APAC) in the Asia-Pacific (APAC), Saudi Arabia, U.A.E., South Africa, Egypt, Israel, Rest of Middle East and Africa (MEA) as a part of Middle East and Africa (MEA), Brazil, Argentina and Rest of South America as part of South America.
North America leads the neuromyelitis optica treatment market, primarily driven by heightened awareness regarding the importance of early diagnosis and treatment options. This growing recognition among healthcare professionals and patients alike has fostered an environment conducive to new product launches and advancements in therapeutic approaches. As a result, the region continues to establish itself as a key player in the development and accessibility of effective treatments for neuromyelitis optica spectrum disorder.
Asia-Pacific region is anticipated to experience significant growth from 2025 to 2032, largely due to the expanding patient population affected by neuromyelitis optica spectrum disorder. This increase in cases is prompting a greater demand for effective treatment options and healthcare services. As awareness and access to medical care improve, the region is poised to become a prominent market for neuromyelitis optica therapies.
The country section of the report also provides individual market impacting factors and changes in regulation in the market domestically that impacts the current and future trends of the market. Data points such as down-stream and upstream value chain analysis, technical trends and porter's five forces analysis, case studies are some of the pointers used to forecast the market scenario for individual countries. Also, the presence and availability of global brands and their challenges faced due to large or scarce competition from local and domestic brands, impact of domestic tariffs and trade routes are considered while providing forecast analysis of the country data.
Neuromyelitis Optica Treatment Market Share
The market competitive landscape provides details by competitor. Details included are company overview, company financials, revenue generated, market potential, investment in research and development, new market initiatives, global presence, production sites and facilities, production capacities, company strengths and weaknesses, product launch, product width and breadth, application dominance. The above data points provided are only related to the companies' focus related to market.
Neuromyelitis Optica Treatment Market Leaders Operating in the Market Are:
- F. Hoffmann-La Roche Ltd (Switzerland)
- AstraZeneca (U.K.)
- Teva Pharmaceutical Industries Ltd. (Israel)
- Alexion Pharmaceuticals, Inc (U.S.)
- Viela Bio (U.S.)
- Anvil Biosciences (U.S.)
- Opexa Therapeutics, Inc (U.S.)
- Arrien Pharmaceuticals, LLC (U.S.)
- TG Therapeutics, Inc (U.S.)
- Bionure (Spain)
Latest Developments in Neuromyelitis Optica Treatment Market
- In March 2024, AstraZeneca's Ultomiris (ravulizumab-cwvz) has received approval from the US Food and Drug Administration (FDA) for the treatment of neuromyelitis optica spectrum disorder, a rare autoimmune condition affecting an estimated 6,000 adults in the United States. This approval marks a significant advancement in therapeutic options for patients living with this challenging disease. By providing a targeted treatment for NMOSD, AstraZeneca aims to improve patient outcomes and quality of life in this underserved population.
- In March 2024, AstraZeneca's Alexion announced that it has gained approval for the fourth indication of Ultomiris, allowing it to be utilized in the treatment of neuromyelitis optica spectrum disorder, a rare autoimmune condition. This milestone underscores the growing versatility of Ultomiris in addressing various severe autoimmune diseases. With this new indication, AstraZeneca aims to enhance treatment options for patients suffering from this challenging disorder, improving their chances for better health outcomes.
- In October 2023, Amgen revealed new findings from the phase 3 N-MOmentum clinical trial, which provide valuable insights into the presence of inflammatory biomarkers associated with neuromyelitis optica spectrum disorder (NMOSD). These findings further reinforce the "durable impact" of Uplizna (inebilizumab) in minimizing disease-related attacks. The study highlights the potential of Uplizna as an effective treatment option, emphasizing its role in managing the condition and improving patient outcomes by targeting the underlying inflammatory processes associated with NMOSD.
SKU-

- Interactive Data Analysis Dashboard
- Company Analysis Dashboard for high growth potential opportunities
- Research Analyst Access for customization & queries
- Competitor Analysis with Interactive dashboard
- Latest News, Updates & Trend analysis
- Harness the Power of Benchmark Analysis for Comprehensive Competitor Tracking
Table of Content
1 INTRODUCTION
1.1 OBJECTIVES OF THE STUDY
1.2 MARKET DEFINITION
1.3 OVERVIEW OF GLOBAL NEUROMYELITIS OPTICA TREATMENT MARKET
1.4 CURRENCY AND PRICING
1.5 LIMITATION
1.6 MARKETS COVERED
2 MARKET SEGMENTATION
2.1 KEY TAKEAWAYS
2.2 ARRIVING AT THE GLOBAL NEUROMYELITIS OPTICA TREATMENT MARKET SIZE
2.2.1 VENDOR POSITIONING GRID
2.2.2 TECHNOLOGY LIFE LINE CURVE
2.2.3 TRIPOD DATA VALIDATION MODEL
2.2.4 MARKET GUIDE
2.2.5 MULTIVARIATE MODELLING
2.2.6 TOP TO BOTTOM ANALYSIS
2.2.7 CHALLENGE MATRIX
2.2.8 APPLICATION COVERAGE GRID
2.2.9 STANDARDS OF MEASUREMENT
2.2.10 VENDOR SHARE ANALYSIS
2.2.11 EPIDEMIOLOGY BASED MODEL
2.2.12 DATA POINTS FROM KEY PRIMARY INTERVIEWS
2.2.13 DATA POINTS FROM KEY SECONDARY DATABASES
2.3 GLOBAL NEUROMYELITIS OPTICA TREATMENT MARKET: RESEARCH SNAPSHOT
2.4 ASSUMPTIONS
3 EXECUTIVE SUMMARY
4 PREMIUM INSIGHTS
4.1 PESTEL ANALYSIS
4.2 PORTER’S FIVE FORCES MODEL
5 INDUSTRY INSIGHTS
5.1 PATENT ANALYSIS
5.1.1 PATENT LANDSCAPE
5.1.2 USPTO NUMBER
5.1.3 PATENT EXPIRY
5.1.4 EPIO NUMBER
5.1.5 PATENT STRENGTH AND QUALITY
5.1.6 PATENT CLAIMS
5.1.7 PATENT CITATIONS
5.1.8 PATENT LITIGATION AND LICENSING
5.1.9 FILE OF PATENT
5.1.10 PATENT RECEIVED CONTRIES
5.1.11 TECHNOLOGY BACKGROUND
5.2 DRUG TREATMENT RATE BY MATURED MARKETS
5.3 DEMOGRAPHIC TRENDS: IMPACTS ON ALL INCIDENCE RATES
5.4 PATIENT FLOW DIAGRAM
5.5 KEY PRICING STRATEGIES
5.6 KEY PATIENT ENROLLMENT STRATEGIES
5.7 INTERVIEWS WITH SPECIALIST
5.8 OTHER KOL SNAPSHOTS
6 EPIDEMIOLOGY
6.1 INCIDENCE OF ALL BY GENDER
6.2 TREATMENT RATE
6.3 MORTALITY RATE
6.4 DRUG ADHERENCE AND THERAPY SWITCH MODEL
6.5 PATIENT TREATMENT SUCCESS RATES
7 MERGERS AND ACQUISITION
7.1 LICENSING
7.2 COMMERCIALIZATION AGREEMENTS
8 REGULATORY FRAMEWORK
8.1 REGULATORY APPROVAL PROCESS
8.2 GEOGRAPHIES’ EASE OF REGULATORY APPROVAL
8.3 REGULATORY APPROVAL PATHWAYS
8.4 LICENSING AND REGISTRATION
8.5 POST-MARKETING SURVEILLANCE
8.6 GOOD MANUFACTURING PRACTICES (GMPS) GUIDELINES
9 PIPELINE ANALYSIS
9.1 CLINICAL TRIALS AND PHASE ANALYSIS
9.2 DRUG THERAPY PIPELINE
9.3 PHASE III CANDIDATES
9.4 PHASE II CANDIDATES
9.5 PHASE I CANDIDATES
9.6 OTHERS (PRE-CLINICAL AND RESEARCH)
TABLE 1 GLOBAL CLINICAL TRIAL MARKET FOR NEUROMYELITIS OPTICA TREATMENT MARKET
Company Name Therapeutic Area
XX XX
XX XX
XX XX
XX XX
XX XX
XX XX
Sources: Press Releases, Annual Reports, SEC Filings, Investor Presentations, Other Government Sources, Analysis Based on Inputs from Secondary, Expert Interviews
TABLE 2 DISTRIBUTION OF PRODUCTS AND PROJECTS BY PHASE NEUROMYELITIS OPTICA TREATMENT MARKET
Phase Number of Projects
Preclinical/Research Projects XX
Clinical Development XX
Phase I XX
Phase II XX
Phase III XX
U.S. Filed/Approved But Not Yest Marketed XX
Total XX
Sources: Press Releases, Annual Reports, SEC Filings, Investor Presentations, Other Government Sources, Analysis Based on Inputs from Secondary, Expert Interviews
TABLE 3 DISTRIBUTION OF PROJECTS BY THERAPEUTIC AREA AND PHASE NEUROMYELITIS OPTICA TREATMENT MARKET
Therapeutic Area Preclinical/ Research Project
XX XX
XX XX
XX XX
XX XX
XX XX
Total Projects XX
Sources: Press Releases, Annual Reports, SEC Filings, Investor Presentations, Other Government Sources, Analysis Based on Inputs from Secondary, Expert Interviews
TABLE 4 DISTRIBUTION OF PROJECTS BY SCIENTIFIC APPROACH AND PHASE NEUROMYELITIS OPTICA TREATMENT MARKET
Technology Preclinical/ Research Project
XX XX
XX XX
XX XX
XX XX
XX XX
Total Projects XX
Sources: Press Releases, Annual Reports, SEC Filings, Investor Presentations, Other Government Sources, Analysis Based on Inputs from Secondary, Expert Interviews
FIGURE 1 TOP ENTITIES BASED ON R&D GLANCE FOR NEUROMYELITIS OPTICA TREATMENT MARKET
Sources: Press Releases, Annual Reports, SEC Filings, Investor Presentations, Other Government Sources, Analysis Based on Inputs from Secondary, Expert Interviews
10 MARKETED DRUG ANALYSIS
10.1 DRUG
10.1.1 BRAND NAME
10.1.2 GENERICS NAME
10.2 THERAPEUTIC INDIACTION
10.3 PHARACOLOGICAL CLASS OD THE DRUG
10.4 DRUG PRIMARY INDICATION
10.5 MARKET STATUS
10.6 MEDICATION TYPE
10.7 DRUG DOSAGES FORM
10.8 DOSAGES AVAILABILITY
10.9 PACKAGING TYPE
10.1 DRUG ROUTE OF ADMINISTRATION
10.11 DOSING FREQUENCY
10.12 DRUG INSIGHT
10.13 AN OVERVIEW OF THE DRUG DEVELOPMENT ACTIVITIES SUCH AS REGULATORY MILSTONE, SAFETY DATA AND EFFICACY DATA, MARKET EXCLUSIVITY DATA.
10.13.1 FORECAST MARKET OUTLOOK
10.13.2 CROSS COMPETITION
10.13.3 THERAPEUTIC PORTFOLIO
10.13.4 CURRENT DEVELOPMENT SCENARIO
11 MARKET ACCESS
11.1 10-YEAR MARKET FORECAST
11.2 CLINICAL TRIAL RECENT UPDATES
11.3 ANNUAL NEW FDA APPROVED DRUGS
11.4 DRUGS MANUFACTURER AND DEALS
11.5 MAJOR DRUG UPTAKE
11.6 CURRENT TREATMENT PRACTICES
11.7 IMPACT OF UPCOMING THERAPY
12 R & D ANALYSIS
12.1 COMPARATIVE ANALYSIS
12.2 DRUG DEVELOPMENTAL LANDSCAPE
12.3 IN-DEPTH INSIGHTS ON REGULATORY MILESTONES
12.4 THERAPEUTIC ASSESSMENT
12.5 ASSET-BASED COLLABORATIONS AND PARTNERSHIPS
13 MARKET OVERVIEW
13.1 DRIVERS
13.2 RESTRAINTS
13.3 OPPORTUNITIES
13.4 CHALLENGES
14 GLOBAL NEUROMYELITIS OPTICA TREATMENT MARKET, BY TYPE
14.1 OVERVIEW
14.2 WITH AQUAPORIN-4 ANTIBODIES
14.3 WITHOUT AQUAPORIN-4 ANTIBODIES
15 GLOBAL NEUROMYELITIS OPTICA TREATMENT MARKET, BY DISEASE TYPE
15.1 OVERVIEW
15.2 RELAPSING FORM
15.3 MONOPHASIC FORM
16 GLOBAL NEUROMYELITIS OPTICA TREATMENT MARKET, BY TREATMENT TYPE
16.1 OVERVIEW
16.2 MEDICATION
16.2.1 APPROVED/MARKETED TREATMENT
16.2.1.1. IMMUNOSUPPRESSANT
16.2.1.1.1. AZATHIOPRINE
16.2.1.1.2. MYCOPHENOLATE
16.2.1.1.3. RITUXIMAB
16.2.1.1.4. CORTICOSTEROID
16.2.1.1.4.1 METHYLPREDNISOLONE
16.2.1.1.4.2 PREDNISONE
16.2.1.1.4.3 OTHERS
16.2.1.1.5. OTHERS
16.2.1.2. MONOCLONAL ANTIBODY
16.2.1.2.1. ECULIZUMAB
16.2.1.2.2. INEBILIZUMAB
16.2.1.2.3. SATRALIZUMAB-MWGE
16.2.1.2.4. OTHERS
16.2.1.3. ANTI-EPILEPTIC MEDICATIONS
16.2.1.3.1. GABAPENTIN
16.2.1.3.2. CARBAMAZEPINE
16.2.1.3.3. OTHERS
16.2.1.4. ANTI-SPASMODICS
16.2.1.4.1. BACLOFEN
16.2.1.4.2. TIZANIDINE
16.2.1.4.3. OTHERS
16.2.1.5. ANTI-DEPRESSANTS
16.2.1.5.1. AMITRIPTYLINE
16.2.1.5.2. DULOXETINE
16.2.1.5.3. OTHERS
16.2.1.6. ANALGESICS
16.2.1.6.1. TRAMADOL
16.2.1.6.2. OPIATES
16.2.1.6.3. OTHERS
16.2.1.7. OTHERS
16.2.2 PIPELINE MEDICATION
16.2.2.1. ANTI-FCRN BATOCLIMAB
16.2.2.2. ABX-1431
16.2.2.3. TG-1101
16.2.2.4. NDC-1308
16.2.2.5. OTHERS
16.3 PLASMAPHERESIS
16.3.1 FILTERS
16.3.1.1. PLASMA EXCHANGE
16.3.1.2. DOUBLE FILTRATION PLASMAPHERESIS
16.3.1.3. IMMUNOADSORPTION
16.3.1.4. OTHERS
16.3.2 MACHINES
16.3.2.1. BY TYPE
16.3.2.1.1. THERAPEUTIC APHAERESISI MACHINE
16.3.2.1.2. PLASMAPHERESIS MACHINE
16.3.2.1.3. CENTRIFUGES
16.3.2.1.4. OTHERS
16.3.2.2. BY MODALITY
16.3.2.2.1. TROLLEY MOUNTED
16.3.2.2.2. BENCH TOP
16.3.2.2.3. OTHERS
16.3.3 REPLACEMENT FLUIDS
16.3.3.1. ALBUMIN
16.3.3.2. ELECTROLYTE
16.3.3.3. HYDROXYETHYL STARCH
16.3.3.4. FFP
16.3.3.5. PURIFIED PROTEIN PRODUCTS
16.3.3.6. OTHERS
16.3.4 DISPOSABLES
16.3.4.1. SINGLE USE TUBING SETS
16.3.4.2. INJECTION NEEDLE
16.3.4.3. SPARE FILTERS
16.3.4.4. SOLUTIONS
16.3.4.5. OTHERS
16.3.5 OTHERS
16.4 STEM CELL THERAPY
16.4.1 HEMATOPOIETIC STEM CELL TRANSPLANTATION (HSCT)
16.4.1.1. AUTOLOGOUS
16.4.1.2. ALLOGENEIC
16.4.2 MESENCHYMAL STEM CELLS
16.5 OTHERS
17 GLOBAL NEUROMYELITIS OPTICA TREATMENT MARKET, BY DRUG TYPE
17.1 OVERVIEW
17.2 BRANDED
17.2.1 SOLIRIS
17.2.2 UPLIZNA
17.2.3 ENSPRYNG
17.2.4 OTHERS
17.3 GENERICS
18 GLOBAL NEUROMYELITIS OPTICA TREATMENT MARKET, BY ROUTE OF ADMINISTRATION
18.1 OVERVIEW
18.2 ORAL
18.2.1 TABLETS
18.2.2 SUSPENSION
18.2.3 OTHERS
18.3 PARENTERAL
18.3.1 INTRAVENOUS
18.3.2 SUBCUTANEOUS
18.3.3 OTHERS
18.4 OTHERS
19 GLOBAL NEUROMYELITIS OPTICA TREATMENT MARKET, BY POPULATION TYPE
19.1 OVERVIEW
19.2 MALE
19.2.1 PEDIATRIC
19.2.2 ADULTS
19.2.3 GERIATRIC
19.3 FEMALE
19.3.1 PEDIATRIC
19.3.2 ADULTS
19.3.3 GERIATRIC
20 GLOBAL NEUROMYELITIS OPTICA TREATMENT MARKET, BY AGE GROUP
20.1 OVERVIEW
20.2 PEDIATRIC
20.3 ADULTS
20.4 GERIATRIC
21 GLOBAL NEUROMYELITIS OPTICA TREATMENT MARKET, BY END USER
21.1 OVERVIEW
21.2 HOSPITALS
21.2.1 BY TYPE
21.2.1.1. PUBLIC
21.2.1.2. PRIVATE
21.2.2 BY LEVEL
21.2.2.1. TIER 1
21.2.2.2. TIER 2
21.2.2.3. TIER 3
21.3 SPECIALTY CLINICS
21.4 HOME HEALTHCARE
21.5 ACADEMIC AND RESEARCH INSTITUTES
21.6 OTHERS
22 GLOBAL NEUROMYELITIS OPTICA TREATMENT MARKET, BY DISTRIBUTION CHANNEL
22.1 OVERVIEW
22.2 DIRECT TENDER
22.3 RETAIL SALES
22.3.1 OFFLINE SALES
22.3.1.1. HOSPITAL PHARMACIES
22.3.1.2. RETAIL PHARMACIES
22.3.1.3. OTHERS
22.3.2 ONLINE SALES
22.3.2.1. E-STORES
22.3.2.2. COMPANY WEBSITE
22.3.2.3. OTHERS
22.4 OTHERS
23 GLOBAL NEUROMYELITIS OPTICA TREATMENT MARKET, BY GEOGRAPHY
23.1 GLOBAL NEUROMYELITIS OPTICA TREATMENT MARKET, (ALL SEGMENTATION PROVIDED ABOVE IS REPRESENTED IN THIS CHAPTER BY COUNTRY)
23.1.1 NORTH AMERICA
23.1.1.1. U.S.
23.1.1.2. CANADA
23.1.1.3. MEXICO
23.1.2 EUROPE
23.1.2.1. GERMANY
23.1.2.2. FRANCE
23.1.2.3. U.K.
23.1.2.4. HUNGARY
23.1.2.5. LITHUANIA
23.1.2.6. AUSTRIA
23.1.2.7. IRELAND
23.1.2.8. NORWAY
23.1.2.9. POLAND
23.1.2.10. ITALY
23.1.2.11. SPAIN
23.1.2.12. RUSSIA
23.1.2.13. TURKEY
23.1.2.14. BELGIUM
23.1.2.15. NETHERLANDS
23.1.2.16. SWITZERLAND
23.1.2.17. REST OF EUROPE
23.1.3 ASIA-PACIFIC
23.1.3.1. JAPAN
23.1.3.2. CHINA
23.1.3.3. SOUTH KOREA
23.1.3.4. INDIA
23.1.3.5. AUSTRALIA
23.1.3.6. SINGAPORE
23.1.3.7. THAILAND
23.1.3.8. MALAYSIA
23.1.3.9. INDONESIA
23.1.3.10. PHILIPPINES
23.1.3.11. VIETNAM
23.1.3.12. REST OF ASIA-PACIFIC
23.1.4 SOUTH AMERICA
23.1.4.1. BRAZIL
23.1.4.2. ARGENTINA
23.1.4.3. PERU
23.1.4.4. REST OF SOUTH AMERICA
23.1.5 MIDDLE EAST AND AFRICA
23.1.5.1. SOUTH AFRICA
23.1.5.2. SAUDI ARABIA
23.1.5.3. UAE
23.1.5.4. EGYPT
23.1.5.5. KUWAIT
23.1.5.6. ISRAEL
23.1.5.7. REST OF MIDDLE EAST AND AFRICA
23.1.6 KEY PRIMARY INSIGHTS: BY MAJOR COUNTRIES
24 GLOBAL NEUROMYELITIS OPTICA TREATMENT MARKET, COMPANY LANDSCAPE
24.1 COMPANY SHARE ANALYSIS: GLOBAL
24.2 COMPANY SHARE ANALYSIS: NORTH AMERICA
24.3 COMPANY SHARE ANALYSIS: EUROPE
24.4 COMPANY SHARE ANALYSIS: ASIA-PACIFIC
24.5 MERGERS & ACQUISITIONS
24.6 NEW PRODUCT DEVELOPMENT & APPROVALS
24.7 EXPANSIONS
24.8 REGULATORY CHANGES
24.9 PARTNERSHIP AND OTHER STRATEGIC DEVELOPMENTS
25 GLOBAL NEUROMYELITIS OPTICA TREATMENT MARKET, SWOT AND DBMR ANALYSIS
26 GLOBAL NEUROMYELITIS OPTICA TREATMENT MARKET, COMPANY PROFILE
26.1 PHARMA MANUFACTURES
26.1.1 CORESTEMCHEMON INC.
26.1.1.1. COMPANY OVERVIEW
26.1.1.2. REVENUE ANALYSIS
26.1.1.3. GEOGRAPHIC PRESENCE
26.1.1.4. PRODUCT PORTFOLIO
26.1.1.5. RECENT DEVELOPMENTS
26.1.2 ASTRAZENECA
26.1.2.1. COMPANY OVERVIEW
26.1.2.2. REVENUE ANALYSIS
26.1.2.3. GEOGRAPHIC PRESENCE
26.1.2.4. PRODUCT PORTFOLIO
26.1.2.5. RECENT DEVELOPMENTS
26.1.3 HARBOUR BIOMED
26.1.3.1. COMPANY OVERVIEW
26.1.3.2. REVENUE ANALYSIS
26.1.3.3. GEOGRAPHIC PRESENCE
26.1.3.4. PRODUCT PORTFOLIO
26.1.3.5. RECENT DEVELOPMENTS
26.1.4 TG THERAPEUTICS
26.1.4.1. COMPANY OVERVIEW
26.1.4.2. REVENUE ANALYSIS
26.1.4.3. GEOGRAPHIC PRESENCE
26.1.4.4. PRODUCT PORTFOLIO
26.1.4.5. RECENT DEVELOPMENTS
26.1.5 ENDECE
26.1.5.1. COMPANY OVERVIEW
26.1.5.2. REVENUE ANALYSIS
26.1.5.3. GEOGRAPHIC PRESENCE
26.1.5.4. PRODUCT PORTFOLIO
26.1.5.5. RECENT DEVELOPMENTS
26.1.6 ALEXION PHARMACEUTICALS
26.1.6.1. COMPANY OVERVIEW
26.1.6.2. REVENUE ANALYSIS
26.1.6.3. GEOGRAPHIC PRESENCE
26.1.6.4. PRODUCT PORTFOLIO
26.1.6.5. RECENT DEVELOPMENTS
26.1.7 HORIZON THERAPEUTICS PLC
26.1.7.1. COMPANY OVERVIEW
26.1.7.2. REVENUE ANALYSIS
26.1.7.3. GEOGRAPHIC PRESENCE
26.1.7.4. PRODUCT PORTFOLIO
26.1.7.5. RECENT DEVELOPMENTS
26.1.8 F. HOFFMANN-LA ROCHE LTD
26.1.8.1. COMPANY OVERVIEW
26.1.8.2. REVENUE ANALYSIS
26.1.8.3. GEOGRAPHIC PRESENCE
26.1.8.4. PRODUCT PORTFOLIO
26.1.8.5. RECENT DEVELOPMENTS
26.1.9 PFIZER INC.
26.1.9.1. COMPANY OVERVIEW
26.1.9.2. REVENUE ANALYSIS
26.1.9.3. GEOGRAPHIC PRESENCE
26.1.9.4. PRODUCT PORTFOLIO
26.1.9.5. RECENT DEVELOPMENTS
26.1.10 AMNEAL PHARMACEUTICALS LLC.
26.1.10.1. COMPANY OVERVIEW
26.1.10.2. REVENUE ANALYSIS
26.1.10.3. GEOGRAPHIC PRESENCE
26.1.10.4. PRODUCT PORTFOLIO
26.1.10.5. RECENT DEVELOPMENTS
26.1.11 ZYDUS GROUP
26.1.11.1. COMPANY OVERVIEW
26.1.11.2. REVENUE ANALYSIS
26.1.11.3. GEOGRAPHIC PRESENCE
26.1.11.4. PRODUCT PORTFOLIO
26.1.11.5. RECENT DEVELOPMENTS
26.1.12 JUBILANT CADISTA PHARMACEUTICALS INC.
26.1.12.1. COMPANY OVERVIEW
26.1.12.2. REVENUE ANALYSIS
26.1.12.3. GEOGRAPHIC PRESENCE
26.1.12.4. PRODUCT PORTFOLIO
26.1.12.5. RECENT DEVELOPMENTS
26.1.13 HIKMA PHARMACEUTICALS PLC
26.1.13.1. COMPANY OVERVIEW
26.1.13.2. REVENUE ANALYSIS
26.1.13.3. GEOGRAPHIC PRESENCE
26.1.13.4. PRODUCT PORTFOLIO
26.1.13.5. RECENT DEVELOPMENTS
26.1.14 VIATRIS INC.
26.1.14.1. COMPANY OVERVIEW
26.1.14.2. REVENUE ANALYSIS
26.1.14.3. GEOGRAPHIC PRESENCE
26.1.14.4. PRODUCT PORTFOLIO
26.1.14.5. RECENT DEVELOPMENTS
26.1.15 SEBELA PHARMACEUTICALS
26.1.15.1. COMPANY OVERVIEW
26.1.15.2. REVENUE ANALYSIS
26.1.15.3. GEOGRAPHIC PRESENCE
26.1.15.4. PRODUCT PORTFOLIO
26.1.15.5. RECENT DEVELOPMENTS
26.1.16 NOVARTIS AG
26.1.16.1. COMPANY OVERVIEW
26.1.16.2. REVENUE ANALYSIS
26.1.16.3. GEOGRAPHIC PRESENCE
26.1.16.4. PRODUCT PORTFOLIO
26.1.16.5. RECENT DEVELOPMENTS
26.1.17 ACCORD-UK LTD
26.1.17.1. COMPANY OVERVIEW
26.1.17.2. REVENUE ANALYSIS
26.1.17.3. GEOGRAPHIC PRESENCE
26.1.17.4. PRODUCT PORTFOLIO
26.1.17.5. RECENT DEVELOPMENTS
26.1.18 TEVA PHARMACEUTICALS USA, INC.
26.1.18.1. COMPANY OVERVIEW
26.1.18.2. REVENUE ANALYSIS
26.1.18.3. GEOGRAPHIC PRESENCE
26.1.18.4. PRODUCT PORTFOLIO
26.1.18.5. RECENT DEVELOPMENTS
26.1.19 ALKEM LABS
26.1.19.1. COMPANY OVERVIEW
26.1.19.2. REVENUE ANALYSIS
26.1.19.3. GEOGRAPHIC PRESENCE
26.1.19.4. PRODUCT PORTFOLIO
26.1.19.5. RECENT DEVELOPMENTS
26.1.20 STRIDES PHARMA INC.
26.1.20.1. COMPANY OVERVIEW
26.1.20.2. REVENUE ANALYSIS
26.1.20.3. GEOGRAPHIC PRESENCE
26.1.20.4. PRODUCT PORTFOLIO
26.1.20.5. RECENT DEVELOPMENTS
26.1.21 CONCORD BIOTECH
26.1.21.1. COMPANY OVERVIEW
26.1.21.2. REVENUE ANALYSIS
26.1.21.3. GEOGRAPHIC PRESENCE
26.1.21.4. PRODUCT PORTFOLIO
26.1.21.5. RECENT DEVELOPMENTS
26.2 MEDICAL DEVICE MANUFACTURE
26.2.1 ASAHI KESEI CORPORATION
26.2.1.1. COMPANY OVERVIEW
26.2.1.2. REVENUE ANALYSIS
26.2.1.3. GEOGRAPHIC PRESENCE
26.2.1.4. PRODUCT PORTFOLIO
26.2.1.5. RECENT DEVELOPMENTS
26.2.2 HAEMONETICS CORPORATION
26.2.2.1. COMPANY OVERVIEW
26.2.2.2. REVENUE ANALYSIS
26.2.2.3. GEOGRAPHIC PRESENCE
26.2.2.4. PRODUCT PORTFOLIO
26.2.2.5. RECENT DEVELOPMENTS
26.2.3 MILTENYI BIOTEC AND/OR ITS AFFILIATES
26.2.3.1. COMPANY OVERVIEW
26.2.3.2. REVENUE ANALYSIS
26.2.3.3. GEOGRAPHIC PRESENCE
26.2.3.4. PRODUCT PORTFOLIO
26.2.3.5. RECENT DEVELOPMENTS
26.2.4 GRIFOLS, S.A.
26.2.4.1. COMPANY OVERVIEW
26.2.4.2. REVENUE ANALYSIS
26.2.4.3. GEOGRAPHIC PRESENCE
26.2.4.4. PRODUCT PORTFOLIO
26.2.4.5. RECENT DEVELOPMENTS
26.2.5 OCTAPHARMA AG
26.2.5.1. COMPANY OVERVIEW
26.2.5.2. REVENUE ANALYSIS
26.2.5.3. GEOGRAPHIC PRESENCE
26.2.5.4. PRODUCT PORTFOLIO
26.2.5.5. RECENT DEVELOPMENTS
26.2.6 3M (SOLVENTUM)
26.2.6.1. COMPANY OVERVIEW
26.2.6.2. REVENUE ANALYSIS
26.2.6.3. GEOGRAPHIC PRESENCE
26.2.6.4. PRODUCT PORTFOLIO
26.2.6.5. RECENT DEVELOPMENTS
26.2.7 B. BRAUN SE
26.2.7.1. COMPANY OVERVIEW
26.2.7.2. REVENUE ANALYSIS
26.2.7.3. GEOGRAPHIC PRESENCE
26.2.7.4. PRODUCT PORTFOLIO
26.2.7.5. RECENT DEVELOPMENTS
26.2.8 FRESENIUS SE & CO. KGAA
26.2.8.1. COMPANY OVERVIEW
26.2.8.2. REVENUE ANALYSIS
26.2.8.3. GEOGRAPHIC PRESENCE
26.2.8.4. PRODUCT PORTFOLIO
26.2.8.5. RECENT DEVELOPMENTS
26.2.9 INFOMED SA
26.2.9.1. COMPANY OVERVIEW
26.2.9.2. REVENUE ANALYSIS
26.2.9.3. GEOGRAPHIC PRESENCE
26.2.9.4. PRODUCT PORTFOLIO
26.2.9.5. RECENT DEVELOPMENTS
26.2.10 SB-KAWASUMI LABORATORIES, INC.
26.2.10.1. COMPANY OVERVIEW
26.2.10.2. REVENUE ANALYSIS
26.2.10.3. GEOGRAPHIC PRESENCE
26.2.10.4. PRODUCT PORTFOLIO
26.2.10.5. RECENT DEVELOPMENTS
26.2.11 TERUMO BCT, INC.
26.2.11.1. COMPANY OVERVIEW
26.2.11.2. REVENUE ANALYSIS
26.2.11.3. GEOGRAPHIC PRESENCE
26.2.11.4. PRODUCT PORTFOLIO
26.2.11.5. RECENT DEVELOPMENTS
26.2.12 BIOBASE BIOTECH (JINAN) CO., LTD
26.2.12.1. COMPANY OVERVIEW
26.2.12.2. REVENUE ANALYSIS
26.2.12.3. GEOGRAPHIC PRESENCE
26.2.12.4. PRODUCT PORTFOLIO
26.2.12.5. RECENT DEVELOPMENTS
26.2.13 BAXTER
26.2.13.1. COMPANY OVERVIEW
26.2.13.2. REVENUE ANALYSIS
26.2.13.3. GEOGRAPHIC PRESENCE
26.2.13.4. PRODUCT PORTFOLIO
26.2.13.5. RECENT DEVELOPMENTS
26.2.14 KANEKA CORPORATION
26.2.14.1. COMPANY OVERVIEW
26.2.14.2. REVENUE ANALYSIS
26.2.14.3. GEOGRAPHIC PRESENCE
26.2.14.4. PRODUCT PORTFOLIO
26.2.14.5. RECENT DEVELOPMENTS
26.2.15 SHANGHAI DAHUA MEDICAL APPARATUS CO., LTD
26.2.15.1. COMPANY OVERVIEW
26.2.15.2. REVENUE ANALYSIS
26.2.15.3. GEOGRAPHIC PRESENCE
26.2.15.4. PRODUCT PORTFOLIO
26.2.15.5. RECENT DEVELOPMENTS
26.2.16 ZHENGYUAN TECHNOLOGY CO., LTD.
26.2.16.1. COMPANY OVERVIEW
26.2.16.2. REVENUE ANALYSIS
26.2.16.3. GEOGRAPHIC PRESENCE
26.2.16.4. PRODUCT PORTFOLIO
26.2.16.5. RECENT DEVELOPMENTS
NOTE: THE COMPANIES PROFILED IS NOT EXHAUSTIVE LIST AND IS AS PER OUR PREVIOUS CLIENT REQUIREMENT. WE PROFILE MORE THAN 100 COMPANIES IN OUR STUDY AND HENCE THE LIST OF COMPANIES CAN BE MODIFIED OR REPLACED ON REQUEST
27 RELATED REPORTS
28 CONCLUSION
29 QUESTIONNAIRE
30 ABOUT DATA BRIDGE MARKET RESEARCH
Data collection and base year analysis are done using data collection modules with large sample sizes. The stage includes obtaining market information or related data through various sources and strategies. It includes examining and planning all the data acquired from the past in advance. It likewise envelops the examination of information inconsistencies seen across different information sources. The market data is analysed and estimated using market statistical and coherent models. Also, market share analysis and key trend analysis are the major success factors in the market report. To know more, please request an analyst call or drop down your inquiry.
The key research methodology used by DBMR research team is data triangulation which involves data mining, analysis of the impact of data variables on the market and primary (industry expert) validation. Data models include Vendor Positioning Grid, Market Time Line Analysis, Market Overview and Guide, Company Positioning Grid, Patent Analysis, Pricing Analysis, Company Market Share Analysis, Standards of Measurement, Global versus Regional and Vendor Share Analysis. To know more about the research methodology, drop in an inquiry to speak to our industry experts.
Data Bridge Market Research is a leader in advanced formative research. We take pride in servicing our existing and new customers with data and analysis that match and suits their goal. The report can be customized to include price trend analysis of target brands understanding the market for additional countries (ask for the list of countries), clinical trial results data, literature review, refurbished market and product base analysis. Market analysis of target competitors can be analyzed from technology-based analysis to market portfolio strategies. We can add as many competitors that you require data about in the format and data style you are looking for. Our team of analysts can also provide you data in crude raw excel files pivot tables (Fact book) or can assist you in creating presentations from the data sets available in the report.


