
Global New Born Eye Imaging Systems Market
Market Size in USD Billion
 USD
5.21 Billion
USD
8.87 Billion
2025
2033
USD
5.21 Billion
USD
8.87 Billion
2025
2033
| 2026 - 2033 | |
| USD 5.21 Billion | |
| USD 8.87 Billion | |
| % | |
|
New Born Eye Imaging Systems Market Size
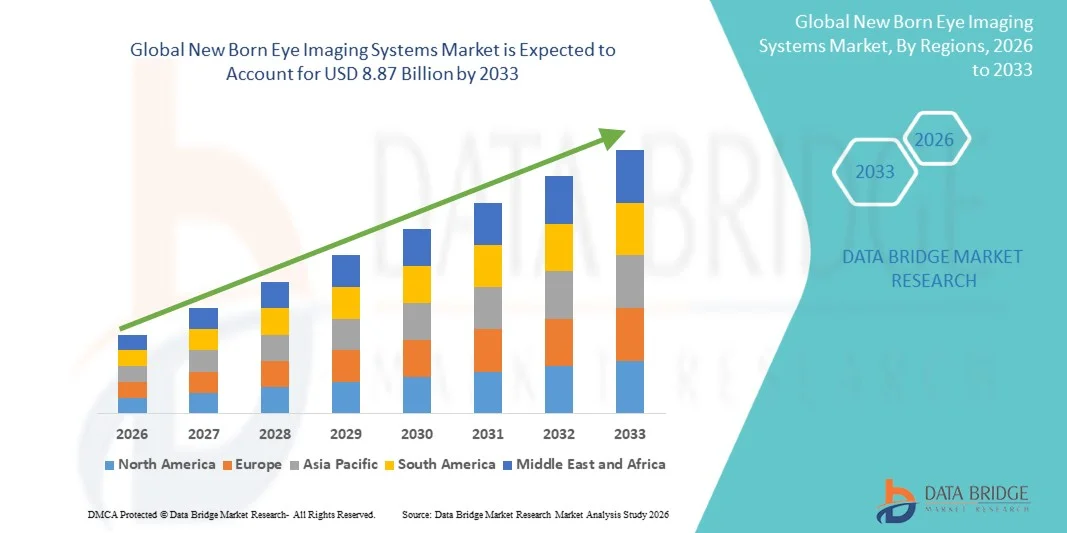
- The global new born eye imaging systems market size was valued at USD 5.21 billion in 2025 and is expected to reach USD 8.87 billion by 2033, at a CAGR of 6.88% during the forecast period
- The market growth is largely fueled by the increasing focus on early detection and treatment of neonatal eye disorders, rising incidence of conditions such as retinopathy of prematurity, and ongoing technological advancements in non‑invasive imaging solutions that enhance precision and diagnostic capabilities
- Furthermore, rising healthcare expenditure, growing awareness among parents and clinicians about infant eye health, and expanding neonatal care infrastructure in both developed and emerging regions are driving the adoption of newborn eye imaging systems, positioning them as critical tools in pediatric ophthalmology and neonatal care settings
New Born Eye Imaging Systems Market Analysis
- Newborn eye imaging systems, providing high-resolution imaging and diagnostic capabilities for infant eyes, are increasingly essential in neonatal care and pediatric ophthalmology due to their ability to detect conditions such as retinopathy of prematurity (ROP) early, ensuring timely intervention and improved treatment outcomes
- The rising demand for newborn eye imaging systems is primarily driven by increasing awareness of neonatal eye disorders, growing incidence of premature births, and technological advancements in non-invasive, portable imaging devices that enhance diagnostic accuracy and workflow efficiency in neonatal units
- North America dominated the newborn eye imaging systems market with the largest revenue share of 42.5% in 2025, supported by advanced neonatal care infrastructure, high healthcare expenditure, and the presence of leading medical device manufacturers offering innovative imaging solutions, with the U.S. experiencing significant adoption in both hospital-based and outpatient neonatal units
- Asia-Pacific is expected to be the fastest-growing region in the newborn eye imaging systems market during the forecast period driven by expanding neonatal healthcare facilities, increasing government initiatives for child health, and rising awareness among parents and healthcare providers about early detection of infant eye disorders
- Retinopathy of Prematurity segment dominated the market with a share of 39.2% in 2025, owing to its critical role in early detection and treatment of vision-threatening conditions in premature infants
Report Scope and New Born Eye Imaging Systems Market Segmentation
|
Attributes |
New Born Eye Imaging Systems Key Market Insights |
|
Segments Covered |
|
|
Countries Covered |
North America
Europe
Asia-Pacific
Middle East and Africa
South America
|
|
Key Market Players |
|
|
Market Opportunities |
|
|
Value Added Data Infosets |
In addition to the insights on market scenarios such as market value, growth rate, segmentation, geographical coverage, and major players, the market reports curated by the Data Bridge Market Research also include in-depth expert analysis, patient epidemiology, pipeline analysis, pricing analysis, and regulatory framework |
New Born Eye Imaging Systems Market Trends
“Advancements in AI-Enabled Imaging and Portable Devices”
- A significant and accelerating trend in the global newborn eye imaging systems market is the integration of artificial intelligence (AI) and portable imaging devices, enhancing diagnostic precision and workflow efficiency in neonatal care units
- For instance, the RetCam AI-enabled imaging system allows clinicians to capture high-resolution retinal images and automatically analyze them for early signs of retinopathy of prematurity, reducing human error and speeding diagnosis
- AI integration enables features such as predictive analysis of disease progression and automated alert systems for abnormal findings, improving timely intervention and treatment decisions. For instance, OptoAI systems utilize machine learning to refine image interpretation over time and notify clinicians of potential retinal anomalies
- The combination of wireless, portable devices with AI analytics facilitates bedside imaging in neonatal intensive care units, enabling real-time monitoring without moving fragile infants to specialized imaging rooms
- Integration with hospital electronic health records (EHR) and cloud-based platforms allows seamless data sharing among clinicians, supporting collaborative decision-making and longitudinal tracking of patient eye health
- This trend toward more intelligent, portable, and integrated imaging solutions is reshaping clinical expectations in pediatric ophthalmology, with companies such as Natus Medical developing AI-powered devices capable of automatic disease detection and integration with hospital electronic health records
- The demand for AI-enabled, portable newborn eye imaging systems is growing rapidly across hospitals and ophthalmology centers, as clinicians increasingly prioritize early detection, accuracy, and efficiency in neonatal eye care
New Born Eye Imaging Systems Market Dynamics
Driver
“Rising Prevalence of Neonatal Eye Disorders and Early Diagnosis Awareness”
- The increasing incidence of premature births and neonatal eye disorders, coupled with growing awareness about early diagnosis, is a significant driver for the adoption of newborn eye imaging systems
- For instance, in March 2025, Natus Medical reported a partnership with leading U.S. neonatal hospitals to implement AI-enabled retinal imaging solutions for early detection of retinopathy of prematurity
- As clinicians and parents recognize the importance of timely detection, imaging systems offer advanced features such as high-resolution retinal capture, automated analysis, and longitudinal tracking of eye development, providing a compelling clinical advantage
- Furthermore, expanding neonatal care infrastructure and government programs promoting infant eye health are making newborn eye imaging systems integral to pediatric ophthalmology workflows, offering seamless integration with other neonatal monitoring devices
- Ease of use, bedside portability, and the ability to monitor multiple eye parameters through wireless devices are key factors propelling adoption in hospitals and ophthalmology centers, while user-friendly software supports clinical decision-making and efficient reporting
- Increasing investments by private healthcare providers and public health initiatives to reduce preventable childhood blindness are accelerating market growth, particularly in high-birth-rate regions
- Collaborations between medical device manufacturers and academic institutions for research and development of next-generation imaging solutions are driving innovation and encouraging wider adoption of advanced newborn eye imaging systems
Restraint/Challenge
“High Device Costs and Limited Skilled Workforce”
- The relatively high cost of advanced newborn eye imaging systems, especially AI-enabled or wireless devices, poses a significant challenge to broader market penetration, particularly in developing regions
- For instance, smaller neonatal centers may find the investment in RetCam or OptoAI systems prohibitive, limiting access to early diagnostic tools in low-resource settings
- Training requirements for clinicians to accurately operate imaging systems and interpret results also act as a barrier, as specialized skills are needed to ensure reliable diagnosis and avoid false positives or negatives
- While some portable or basic devices are more affordable, premium models with AI analytics, high-resolution imaging, and hospital integration often come at a higher price, affecting widespread adoption
- Lack of standardized protocols and regulatory approvals across different countries can delay the adoption of advanced imaging systems, creating uncertainty among healthcare providers
- Maintenance and calibration of high-end imaging devices require specialized technical support, which may be unavailable in remote or underdeveloped regions, hindering consistent usage
- Overcoming these challenges through cost-effective device development, clinician training programs, and government or NGO support for neonatal eye care will be vital for sustained growth of the market
New Born Eye Imaging Systems Market Scope
The market is segmented on the basis of disease type, device type, and end user.
- By Disease Type
On the basis of disease type, the market is segmented into strabismus, visual acuity, ocular development, color vision, retinopathy of prematurity (ROP), refractive state, visual functions, and visual fields. The Retinopathy of Prematurity (ROP) segment dominated the market with the largest revenue share of 39.2% in 2025, driven by the critical need for early detection of vision-threatening conditions in premature infants. Clinicians prioritize ROP screening because timely diagnosis and treatment can prevent permanent blindness. Imaging systems designed for ROP provide high-resolution retinal capture, automated image analysis, and longitudinal monitoring, which enhance diagnostic accuracy. The segment’s dominance is further supported by government programs and hospital initiatives to reduce infant visual impairments. Leading manufacturers are continuously innovating AI-enabled retinal imaging solutions to meet the growing clinical demand. Hospitals and neonatal care units increasingly integrate these systems into routine care, reinforcing the segment’s market leadership.
The Visual Acuity segment is expected to witness the fastest growth rate from 2026 to 2033, as increasing awareness of developmental eye health and routine neonatal vision screenings drive adoption. Visual acuity testing devices are increasingly integrated with portable and wireless imaging systems, making them convenient for bedside monitoring. Technological advancements such as AI-assisted assessment improve accuracy and reduce human error. Growing investments in early childhood healthcare programs and parent awareness campaigns are supporting the rapid uptake of visual acuity-focused devices. In addition, demand is rising in both hospitals and ophthalmology centers for comprehensive infant vision assessments. The increasing prevalence of visual disorders detected through early screening contributes to the accelerating growth of this segment.
- By Device Type
On the basis of device type, the market is segmented into wireless device and basic device. The Wireless Device segment dominated the market with a share of 55% in 2025, driven by its portability, ease of use, and integration with hospital IT systems. Wireless devices enable bedside imaging in neonatal intensive care units, minimizing the need to transport fragile infants to specialized imaging rooms. Their compatibility with AI-assisted analysis and cloud-based data storage allows for real-time monitoring and remote consultation. Hospitals and ophthalmology centers value wireless devices for their flexibility and efficient workflow integration. Manufacturers are focusing on improving battery life, image resolution, and software analytics for these devices. The growing adoption of telemedicine and remote diagnostic programs further reinforces the dominance of wireless newborn eye imaging systems.
The Basic Device segment is expected to witness the fastest CAGR from 2026 to 2033, driven by demand in smaller clinics, ambulatory centers, and regions with limited budgets. Basic devices offer essential imaging capabilities at a lower cost, making them accessible for routine screenings and follow-ups. Their simplicity and durability make them suitable for frequent use without requiring extensive training. The growing awareness of neonatal eye health in developing regions is fueling adoption of these devices. Basic devices are increasingly integrated with modular upgrades, allowing gradual transition to more advanced imaging systems. Cost-effectiveness and ease of operation are key factors supporting the rapid growth of this segment.
- By End User
On the basis of end user, the market is segmented into Ambulatory Surgical Center, Hospital, Ophthalmology Diagnosis Center, and Others. The Hospital segment dominated the market in 2025, accounting for the largest revenue share due to advanced neonatal care infrastructure, high patient volume, and well-equipped ophthalmology departments. Hospitals provide comprehensive eye care services, including ROP screening, visual acuity testing, and follow-up treatments, which drive demand for high-end imaging systems. They benefit from integration of AI-enabled and wireless devices for accurate diagnosis and real-time monitoring. Hospitals also participate in government-supported initiatives for early detection of infant eye disorders, further reinforcing market dominance. Collaboration with device manufacturers ensures hospitals have access to cutting-edge imaging solutions. The segment’s dominance is sustained by continuous upgrades in neonatal intensive care and ophthalmology facilities.
The Ophthalmology Diagnosis Center segment is expected to witness the fastest growth rate from 2026 to 2033, as specialized eye clinics increasingly offer early neonatal vision screening services. These centers focus on targeted diagnostic solutions for infants at risk of visual disorders, creating demand for compact, portable, and AI-enabled imaging systems. Expansion of private pediatric ophthalmology networks and partnerships with hospitals for referral services is supporting rapid adoption. Improved awareness among parents about early eye assessments is contributing to growth. In addition, technological innovations allowing cost-effective, high-quality imaging in outpatient settings are accelerating uptake. The convenience and efficiency of these centers make them a fast-growing end-user segment in the market.
New Born Eye Imaging Systems Market Regional Analysis
- North America dominated the newborn eye imaging systems market with the largest revenue share of 42.5% in 2025, supported by advanced neonatal care infrastructure, high healthcare expenditure, and the presence of leading medical device manufacturers offering innovative imaging solutions, with the U.S. experiencing significant adoption in both hospital-based and outpatient neonatal units
- Hospitals and ophthalmology centers in the region prioritize high-resolution imaging systems and AI-enabled diagnostic tools for retinopathy of prematurity, visual acuity, and other neonatal eye conditions, enhancing the accuracy and efficiency of infant eye care
- This widespread adoption is further supported by government initiatives promoting infant eye health, the presence of leading medical device manufacturers, and high awareness among healthcare professionals and parents, establishing newborn eye imaging systems as essential tools in both hospital-based and outpatient neonatal care units
U.S. New Born Eye Imaging Systems Market Insight
The U.S. newborn eye imaging systems market captured the largest revenue share of 82% in 2025 within North America, fueled by advanced neonatal care infrastructure, increasing incidence of premature births, and rising awareness of early detection of eye disorders such as retinopathy of prematurity. Hospitals and ophthalmology centers are adopting AI-enabled, high-resolution imaging systems for accurate and timely diagnosis. The growing preference for bedside imaging, wireless devices, and integration with hospital IT systems further propels the market. Moreover, collaborations between medical device manufacturers and leading neonatal hospitals are accelerating technology adoption.
Europe Newborn Eye Imaging Systems Market Insight
The Europe newborn eye imaging systems market is projected to expand at a substantial CAGR throughout the forecast period, primarily driven by rising awareness of neonatal eye disorders, government initiatives for infant eye health, and stringent regulations on pediatric care. Increasing urbanization and investments in healthcare infrastructure are fostering the adoption of advanced imaging systems. European hospitals and diagnostic centers are incorporating these systems into both routine screenings and specialized neonatal care programs. The convenience, precision, and reliability offered by AI-enabled imaging solutions are further supporting market growth.
U.K. Newborn Eye Imaging Systems Market Insight
The U.K. newborn eye imaging systems market is anticipated to grow at a noteworthy CAGR during the forecast period, driven by rising awareness of retinopathy of prematurity and other infant eye conditions. Hospitals and ophthalmology centers are increasingly adopting portable and AI-powered imaging devices for early diagnosis. In addition, parental awareness campaigns, government support for neonatal health programs, and a strong healthcare infrastructure are expected to continue stimulating market growth. The focus on integrated, non-invasive diagnostic solutions is attracting both public and private healthcare providers.
Germany Newborn Eye Imaging Systems Market Insight
The Germany newborn eye imaging systems market is expected to expand at a considerable CAGR during the forecast period, fueled by increasing emphasis on neonatal healthcare, technological advancements in imaging systems, and the rising prevalence of premature births. Hospitals and specialized ophthalmology centers are adopting high-resolution, AI-assisted devices to improve diagnostic accuracy. Germany’s robust healthcare infrastructure and commitment to innovation in medical technology support the uptake of these systems. Integration with hospital IT networks and focus on patient safety are further driving adoption.
Asia-Pacific Newborn Eye Imaging Systems Market Insight
The Asia-Pacific newborn eye imaging systems market is poised to grow at the fastest CAGR of 6.3% from 2026 to 2033, driven by rising urbanization, increasing neonatal care facilities, and growing awareness of infant eye health in countries such as China, India, and Japan. Government initiatives for early detection of eye disorders and the expansion of hospital networks are accelerating adoption. Technological advancements in wireless and portable imaging systems make bedside neonatal screening more accessible. Furthermore, improving affordability and domestic manufacturing of imaging devices are expanding the market across the region.
Japan Newborn Eye Imaging Systems Market Insight
The Japan newborn eye imaging systems market is gaining momentum due to advanced neonatal healthcare infrastructure, rising incidence of preterm births, and increasing focus on preventive pediatric ophthalmology. Hospitals and diagnostic centers are adopting AI-enabled and portable imaging systems to ensure accurate, timely detection of eye disorders. Integration with hospital management systems and IoT-enabled monitoring further fuels growth. In addition, awareness campaigns and government support for neonatal health programs are encouraging widespread adoption in both public and private healthcare settings.
India Newborn Eye Imaging Systems Market Insight
The India newborn eye imaging systems market accounted for the largest market revenue share in Asia-Pacific in 2025, attributed to increasing healthcare expenditure, a growing number of neonatal care units, and rising awareness of infant eye health. Hospitals, ophthalmology centers, and diagnostic clinics are adopting cost-effective wireless and AI-enabled imaging systems for early detection of retinopathy of prematurity and other eye conditions. Government programs supporting neonatal eye care, the push toward smart hospital infrastructure, and availability of domestic imaging solutions are key factors propelling market growth in India.
New Born Eye Imaging Systems Market Share
The New Born Eye Imaging Systems industry is primarily led by well-established companies, including:
- Natus Medical Incorporated (U.S.)
- Visunex Medical Systems, Inc. (U.S.)
- Optos plc (U.K.)
- CANON MEDICAL SYSTEMS CORPORATION (U.S.)
- Carl Zeiss Meditec AG (Germany)
- Topcon Corporation (Japan)
- Heidelberg Engineering GmbH (Germany)
- Leica Microsystems (Germany)
- NIDEK Co., Ltd. (Japan)
- D EYE SRL (Italy)
- Eye Photo Systems (U.S.)
- Merge Healthcare Incorporated (U.S.)
- Eyenuk, Inc. (U.S.)
- Spectra Lab (U.S.)
- Vantage Health (U.S.)
- RetiVue (U.S.)
- Intelligent Retinal Imaging Systems, Inc. (U.S.)
- Remidio Innovative Solutions Pvt. Ltd. (India)
- Kowa Company, Ltd. (Japan)
- Clarity Medical Systems Inc. (U.S.)
What are the Recent Developments in Global New Born Eye Imaging Systems Market?
- In November 2025, Remidio Innovative Solutions announced the launch of Neubo 130, a next‑generation AI‑powered ultra‑widefield neonatal retinal imaging system designed to assist clinicians in real‑time detection of Retinopathy of Prematurity (ROP) and improve precision diagnostics in neonatal retinal conditions. The device offers a 130° field of view, offline AI‑assisted triage, and panoramic imaging capabilities to support bedside screening in NICUs, addressing gaps caused by limited specialist availability
- In July 2025, the Africa Eye Imaging Centre, in collaboration with Zero Blind Babies, donated neonatal care equipment worth USD 67,000 to the Komfo Anokye Teaching Hospital (KATH) NICU in Ghana to support ROP prevention and screening, enabling over 3,000 preterm infants to undergo critical eye examinations and early intervention to prevent blindness. This initiative included respiratory support devices and oxygen monitors crucial for safer neonatal care and ROP risk reduction
- In September 2023, Orbis International and Siloam Vision announced a strategic partnership to use a cloud‑based telemedicine and AI platform to expand access to ROP diagnosis and care in hard‑to‑reach communities, leveraging AI to assist clinicians in identifying severe retinopathy of prematurity and reducing preventable infant blindness worldwide
- In August 2023, clinical practice enhancements such as a new Epic EHR‑integrated tracking tool were launched at Children’s Hospital Colorado to ensure babies at risk of ROP receive timely follow‑up care, improving the clinical workflow for neonatal eye care and reducing missed screenings
- In May 2023, the National Eye Institute (NEI) reported research showing that a smartphone‑based fundus camera combined with AI can help doctors identify premature infants needing treatment for ROP, potentially expanding access to screening in low‑resource settings through telemedicine and affordable imaging technology
SKU-

- Interactive Data Analysis Dashboard
- Company Analysis Dashboard for high growth potential opportunities
- Research Analyst Access for customization & queries
- Competitor Analysis with Interactive dashboard
- Latest News, Updates & Trend analysis
- Harness the Power of Benchmark Analysis for Comprehensive Competitor Tracking
Data collection and base year analysis are done using data collection modules with large sample sizes. The stage includes obtaining market information or related data through various sources and strategies. It includes examining and planning all the data acquired from the past in advance. It likewise envelops the examination of information inconsistencies seen across different information sources. The market data is analysed and estimated using market statistical and coherent models. Also, market share analysis and key trend analysis are the major success factors in the market report. To know more, please request an analyst call or drop down your inquiry.
The key research methodology used by DBMR research team is data triangulation which involves data mining, analysis of the impact of data variables on the market and primary (industry expert) validation. Data models include Vendor Positioning Grid, Market Time Line Analysis, Market Overview and Guide, Company Positioning Grid, Patent Analysis, Pricing Analysis, Company Market Share Analysis, Standards of Measurement, Global versus Regional and Vendor Share Analysis. To know more about the research methodology, drop in an inquiry to speak to our industry experts.
Data Bridge Market Research is a leader in advanced formative research. We take pride in servicing our existing and new customers with data and analysis that match and suits their goal. The report can be customized to include price trend analysis of target brands understanding the market for additional countries (ask for the list of countries), clinical trial results data, literature review, refurbished market and product base analysis. Market analysis of target competitors can be analyzed from technology-based analysis to market portfolio strategies. We can add as many competitors that you require data about in the format and data style you are looking for. Our team of analysts can also provide you data in crude raw excel files pivot tables (Fact book) or can assist you in creating presentations from the data sets available in the report.


