
Global Next Generation Sequencing Ngs Market
Market Size in USD Billion
 USD
15.98 Billion
USD
49.21 Billion
2024
2032
USD
15.98 Billion
USD
49.21 Billion
2024
2032
| 2025 - 2032 | |
| USD 15.98 Billion | |
| USD 49.21 Billion | |
| % | |
|
Next Generation Sequencing (NGS) Market Size
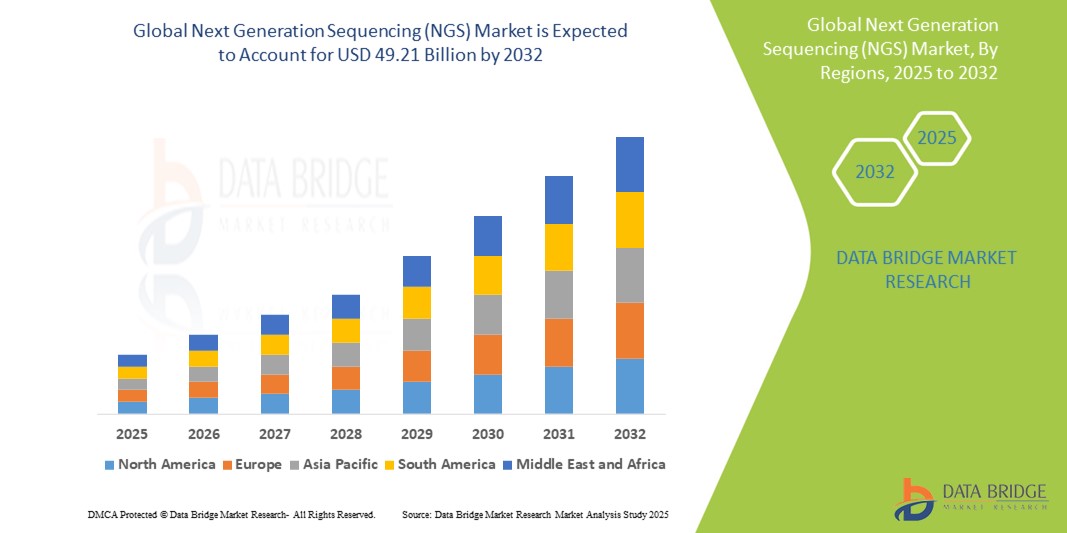
- The global next generation sequencing (NGS) market was valued at USD 15.98 billion in 2024 and is expected to reach USD 49.21 billion by 2032
- During the forecast period of 2025 to 2032 the market is likely to grow at a CAGR of 15.10%, primarily driven by continuous advancements in sequencing technologies and increasing clinical applications
- Key drivers of this growth include the rising incidence of genetic disorders, growing demand for personalized medicine, and increasing adoption of NGS in oncology and reproductive health
Next Generation Sequencing (NGS) Market Analysis
- Next Generation Sequencing (NGS) technologies are transformative tools in genomics, enabling rapid, accurate, and cost-effective sequencing of DNA and RNA. They are widely used in research, clinical diagnostics, and personalized medicine, playing a crucial role in areas such as cancer genomics, rare disease detection, and infectious disease surveillance
- The demand for NGS is significantly driven by the increasing prevalence of genetic disorders, cancer, and infectious diseases, alongside the growing need for precision medicine. The expanding use of NGS in non-invasive prenatal testing (NIPT) and companion diagnostics further supports its market growth
- The North America region stands out as one of the leading markets for NGS, attributed to its strong research infrastructure, substantial funding for genomics research, and early adoption of cutting-edge technologies
- For instance, the U.S. has witnessed a surge in clinical use of NGS-based tests, driven by initiatives such as the Precision Medicine Initiative and expanded FDA approvals for NGS diagnostics. The region also houses major market players and leading genomics research institutions
- Globally, NGS platforms rank as one of the most critical components in modern genomics and molecular biology labs, second only to high-throughput PCR systems, and are essential for driving innovation across healthcare, biotechnology, and academic research sectors
Report Scope and Next Generation Sequencing (NGS) Market Segmentation
|
Attributes |
Next Generation Sequencing (NGS) Key Market Insights |
|
Segments Covered |
|
|
Countries Covered |
North America
Europe
Asia-Pacific
Middle East and Africa
South America
|
|
Key Market Players |
|
|
Market Opportunities |
|
|
Value Added Data Infosets |
In addition to the insights on market scenarios such as market value, growth rate, segmentation, geographical coverage, and major players, the market reports curated by the Data Bridge Market Research also include in-depth expert analysis, patient epidemiology, pipeline analysis, pricing analysis, and regulatory framework. |
Next Generation Sequencing (NGS) Market Trends
“Integration of AI and Cloud-Based Analytics in NGS Workflows”
- One prominent trend in the global Next Generation Sequencing (NGS) market is the increasing integration of artificial intelligence (AI) and cloud-based platforms for data analysis and interpretation
- These technologies enhance the speed, accuracy, and scalability of genomic data processing, making it easier to derive meaningful clinical and research insights from vast amounts of sequencing data
- For instance, AI-powered algorithms are now being used to detect mutations, predict disease risks, and streamline variant classification, significantly reducing turnaround times in clinical genomics
- Cloud-based platforms also support real-time collaboration among researchers and clinicians, enabling secure storage, sharing, and analysis of large genomic datasets across institutions and geographies
- This trend is reshaping the genomics landscape by improving efficiency, reducing costs, and expanding access to NGS technologies, particularly in decentralized and remote healthcare settings
Next Generation Sequencing (NGS) Market Dynamics
Driver
“Rising Prevalence of Genetic Disorders and Chronic Diseases”
- The increasing global burden of genetic disorders, cancer, and chronic diseases is one of the most significant drivers fueling the demand for Next Generation Sequencing (NGS) technologies
- NGS enables high-throughput and precise analysis of genetic mutations, making it a crucial tool in early diagnosis, disease risk assessment, and treatment selection—especially for conditions like cancer, rare inherited disorders, and cardiovascular diseases
- As awareness of personalized and precision medicine grows, healthcare systems and research institutions are turning to NGS to tailor treatment strategies based on individual genetic profiles, thus improving outcomes and reducing trial-and-error approaches in therapy
- Ongoing advancements in NGS platforms—such as higher accuracy, faster turnaround times, and reduced costs—are further accelerating its adoption across clinical and research applications
- With genetic diseases becoming more recognized across all age groups and regions, there is a growing emphasis on integrating genomic testing into routine healthcare workflows
For instance,
- In September 2022, the World Health Organization (WHO) reported that genetic disorders contribute to over 30% of pediatric hospital admissions in some countries. This underscores the need for early genomic screening tools such as NGS to aid in early diagnosis and treatment planning
- In July 2023, according to the Global Genes Foundation, there are over 7,000 known rare genetic diseases, many of which are still underdiagnosed due to lack of accessible testing. NGS is positioned as a powerful solution to bridge this diagnostic gap
- As genetic and chronic diseases continue to rise globally, the demand for accurate and scalable genomic solutions like NGS is expected to grow significantly, establishing it as a cornerstone in the future of modern medicine
Opportunity
“Integration of Artificial Intelligence (AI) in NGS Data Analysis”
- AI-powered tools are increasingly being integrated into NGS workflows to enhance data analysis, automate variant interpretation, and provide more accurate, actionable insights from genomic data
- AI algorithms can process vast amounts of sequencing data rapidly, identifying genetic mutations, disease markers, and potential therapeutic targets with greater precision, helping clinicians and researchers make faster, more informed decisions
- AI also improves the efficiency of genetic data interpretation by automating the detection and classification of mutations, reducing human error, and enabling large-scale genomic studies to be completed in shorter timeframes
For instance,
- In January 2024, according to a study published in Nature Medicine, AI algorithms trained on genomic datasets can predict cancer mutations with a high degree of accuracy, which could revolutionize cancer diagnostics and treatment planning by providing personalized, targeted therapies
- In October 2023, a report from the American Journal of Human Genetics highlighted how AI tools are optimizing the analysis of genetic disorders, particularly rare diseases, by enhancing the ability to identify previously overlooked genetic variants, facilitating earlier and more accurate diagnoses
- The integration of AI in NGS holds the potential to transform the genomics landscape, reducing the time and cost associated with data analysis, improving diagnostic accuracy, and enabling more widespread use of NGS in both clinical and research settings
Restraint/Challenge
“High Costs of NGS Platforms and Reagents Limiting Market Accessibility”
- The high cost of Next Generation Sequencing (NGS) platforms and reagents presents a significant challenge for the widespread adoption of NGS technologies, particularly in resource-limited settings and developing regions
- NGS instruments, which can range from tens of thousands to several hundred thousand dollars, along with the ongoing expense of consumables and reagents, create a financial barrier for smaller laboratories, hospitals, and research institutions
- This substantial initial investment and recurring costs can discourage healthcare providers and researchers from adopting NGS, leading to reliance on more traditional and less efficient genetic testing methods
For instance,
- In October 2023, according to a report by the International Journal of Molecular Sciences, the high costs associated with NGS, including maintenance and reagent costs, limit its accessibility in lower-income regions, affecting the global adoption of precision medicine and genetic testing
- As a result, such cost barriers create disparities in access to cutting-edge genomic diagnostics, hindering the market's growth potential, particularly in emerging economies and smaller clinical settings
Next Generation Sequencing (NGS) Market Scope
The market is segmented on the basis of product and service, technology, application, end user, and distribution channel
|
Segmentation |
Sub-Segmentation |
|
By Product and Service |
|
|
By Technology |
|
|
By Application |
|
|
By End user |
|
|
By Distribution channel |
|
Next Generation Sequencing (NGS) Market Regional Analysis
“North America is the Dominant Region in the Next Generation Sequencing (NGS) Market”
- North America leads the global Next Generation Sequencing (NGS) market, driven by its robust healthcare infrastructure, early adoption of genomic technologies, and significant investments in precision medicine and research
- The U.S. holds the largest market share due to strong government and private sector funding for genomics research, rising demand for personalized therapies, and a high concentration of leading NGS companies and research institutions
- The presence of favorable regulatory frameworks, expanding clinical applications of NGS, and ongoing collaborations between biotech firms, academic institutions, and healthcare providers continue to drive regional growth
- Additionally, initiatives such as the NIH’s All of Us Research Program and growing use of NGS in oncology, reproductive health, and rare disease diagnosis are solidifying the U.S.'s position as a global hub for genomic innovation
“Asia-Pacific is Projected to Register the Highest Growth Rate”
- The Asia-Pacific region is expected to witness the fastest growth in the NGS market, propelled by expanding healthcare access, growing awareness of genetic testing, and increasing prevalence of chronic and hereditary diseases
- Countries such as China, India, and Japan are emerging as major growth engines due to rising government support for genomics research, improving diagnostic infrastructure, and increasing affordability of sequencing technologies
- Japan remains a leader in clinical genomics adoption, especially in cancer diagnostics, with strong government initiatives and a growing ecosystem of genomics-focused companies and research centers
- In China and India, large-scale population genomics initiatives, growing partnerships between local firms and global players, and rising demand for early and precise disease detection are accelerating market adoption. These trends, combined with increasing investment in R&D, are making the Asia-Pacific region a key strategic focus for NGS market expansion
Next Generation Sequencing (NGS) Market Share
The market competitive landscape provides details by competitor. Details included are company overview, company financials, revenue generated, market potential, investment in research and development, new market initiatives, global presence, production sites and facilities, production capacities, company strengths and weaknesses, product launch, product width and breadth, application dominance. The above data points provided are only related to the companies' focus related to market.
The Major Market Leaders Operating in the Market Are:
- Illumina, Inc. (U.S.)
- Thermo Fisher Scientific (U.S.)
- Pacific Biosciences of California, Inc. (U.S.)
- Oxford Nanopore Technologies (United Kingdom)
- BGI Group (China)
- MGI Tech (China)
- Roche Sequencing Solutions (Switzerland)
- Agilent Technologies (U.S.)
- PerkinElmer, Inc. (U.S.)
- Bio-Rad Laboratories, Inc. (U.S.)
- QIAGEN N.V. (Germany)
- Genomics PLC (United Kingdom)
- Genedata (Switzerland)
- Roche NimbleGen (Switzerland)
- Macrogen, Inc. (South Korea)
- Novogene Corporation (China)
- GATC Biotech AG (Germany)
- BaseClear B.V. (Netherlands)
- Fasteris SA (Switzerland)
- Dovetail Genomics (U.S.)
Latest Developments in Global Next Generation Sequencing (NGS) Market
- In April 2024, Merck KGaA announced the launch of the industry’s first comprehensive and validated genetic stability assay, marking a significant advancement in biomanufacturing safety. The newly introduced Aptegra CHO Genetic Stability Assay integrates whole genome sequencing with advanced bioinformatics, offering a streamlined approach to genetic stability testing. This all-in-one solution is designed to accelerate biosafety evaluations, thereby facilitating a faster and more efficient transition from clinical development to commercial-scale production for biopharmaceutical clients. This innovation is highly relevant to the global Next Generation Sequencing (NGS) market, as it underscores the growing integration of NGS technologies in bioprocessing and biosafety testing
- In January 2024, QIAGEN announced a significant upgrade to its QIAGEN CLC Genomics Workbench Premium, integrating LightSpeed technology to enhance support for next-generation sequencing (NGS) in somatic cancer secondary analysis. This advanced software accelerator enables the rapid conversion of raw sequencing data from FASTQ files to interpretable genetic variant data in VCF format, delivering results at exceptional speed and cost-efficiency. The enhancement strengthens QIAGEN’s NGS software portfolio, offering researchers and clinicians a more streamlined and cost-effective solution for somatic mutation analysis in oncology. This development is particularly relevant to the global NGS market, as it reflects the growing demand for high-performance bioinformatics tools capable of handling complex genomic data in clinical cancer applications
- In January 2024, Beckman Coulter, Inc. announced a strategic partnership with Polycarbin, a leading innovator in sustainable laboratory solutions. The collaboration aims to enhance sustainability practices in liquid handling automation, particularly in the use and lifecycle management of laboratory plastics. By combining Beckman Coulter Life Sciences' expertise in automated liquid handling technologies with Polycarbin’s circular economy platform, the partnership seeks to reduce plastic waste and promote environmentally responsible lab operations. This initiative is highly relevant to the global Next Generation Sequencing (NGS) market, where high-throughput sequencing workflows generate significant volumes of plastic waste due to extensive pipetting and sample preparation processes
- In November 2023, QIAGEN announced a successful collaboration with DNA Labs International in resolving two decades-old cold cases through the application of QIAGEN’s ForenSeq Kintelligence System, paired with the GEDmatch PRO database. This achievement underscores the growing effectiveness and adoption of forensic genetic genealogy as a powerful tool for human identification in law enforcement and criminal investigations. This advancement is also highly relevant to the global Next Generation Sequencing (NGS) market, as it demonstrates the expanding utility of NGS technologies beyond traditional clinical and research domains into forensic science
- In November 2023, Beckman Coulter, Inc. announced a strategic collaboration with Pillar Biosciences, a leading provider of IVD and RUO NGS testing solutions utilizing its proprietary SLIMamp technology. Under the agreement, Pillar Biosciences will develop a suite of targeted applications designed specifically for use on the Biomek NGeniuS Next Generation Library Preparation System. This collaboration aims to enhance Beckman Coulter’s NGS workflow solutions by integrating Pillar’s advanced genomic assays, thereby supporting more efficient and accurate library preparation processes. This collaboration holds considerable relevance for the global Next Generation Sequencing (NGS) market, as it highlights the growing emphasis on automation, efficiency, and clinical utility in NGS platforms
SKU-

- Interactive Data Analysis Dashboard
- Company Analysis Dashboard for high growth potential opportunities
- Research Analyst Access for customization & queries
- Competitor Analysis with Interactive dashboard
- Latest News, Updates & Trend analysis
- Harness the Power of Benchmark Analysis for Comprehensive Competitor Tracking
Data collection and base year analysis are done using data collection modules with large sample sizes. The stage includes obtaining market information or related data through various sources and strategies. It includes examining and planning all the data acquired from the past in advance. It likewise envelops the examination of information inconsistencies seen across different information sources. The market data is analysed and estimated using market statistical and coherent models. Also, market share analysis and key trend analysis are the major success factors in the market report. To know more, please request an analyst call or drop down your inquiry.
The key research methodology used by DBMR research team is data triangulation which involves data mining, analysis of the impact of data variables on the market and primary (industry expert) validation. Data models include Vendor Positioning Grid, Market Time Line Analysis, Market Overview and Guide, Company Positioning Grid, Patent Analysis, Pricing Analysis, Company Market Share Analysis, Standards of Measurement, Global versus Regional and Vendor Share Analysis. To know more about the research methodology, drop in an inquiry to speak to our industry experts.
Data Bridge Market Research is a leader in advanced formative research. We take pride in servicing our existing and new customers with data and analysis that match and suits their goal. The report can be customized to include price trend analysis of target brands understanding the market for additional countries (ask for the list of countries), clinical trial results data, literature review, refurbished market and product base analysis. Market analysis of target competitors can be analyzed from technology-based analysis to market portfolio strategies. We can add as many competitors that you require data about in the format and data style you are looking for. Our team of analysts can also provide you data in crude raw excel files pivot tables (Fact book) or can assist you in creating presentations from the data sets available in the report.


