
Global Noise Source Mapping Market
Market Size in USD Billion
 USD
3.06 Billion
USD
4.91 Billion
2025
2033
USD
3.06 Billion
USD
4.91 Billion
2025
2033
| 2026 - 2033 | |
| USD 3.06 Billion | |
| USD 4.91 Billion | |
| % | |
|
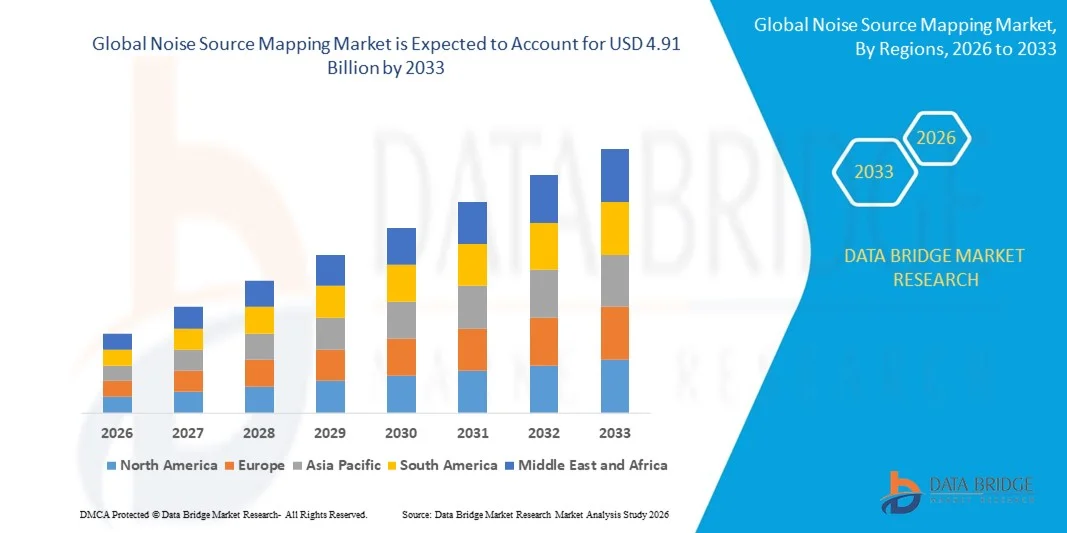
What is the Global Noise Source Mapping Market Size and Growth Rate?
- The global noise source mapping market size was valued at USD 3.06 billion in 2025 and is expected to reach USD 4.91 billion by 2033, at a CAGR of6.10% during the forecast period
- Growth is driven by rising demand for advanced acoustic assessment solutions in industrial, automotive, manufacturing, and environmental‑monitoring sectors as organizations strive to comply with stricter noise regulations and improve occupational and environmental safety
- Added factors supporting market expansion include urbanization, infrastructure projects, industrial growth, environmental awareness, and regulatory enforcement on noise control, which fuel investments in noise mapping, monitoring, and mitigation tools globally
What are the Major Takeaways of Noise Source Mapping Market?
- Growing global emphasis on regulatory compliance, workplace safety, and environmental noise control is creating substantial demand for noise source mapping and identification tools across industries
- Urbanization, expanding infrastructure projects, and rising public awareness about noise pollution’s impact on health and quality of life are accelerating adoption of noise‑mapping services
- Technological advancements — such as high-resolution acoustic cameras, microphone arrays, AI‑powered analysis, IoT and cloud‑integrated noise monitoring platforms — are enhancing precision, usability, and scalability, supporting broader market growth
- North America dominated the Noise Source Mapping market with a 41.9% revenue share in 2025, driven by high adoption of advanced acoustic mapping, environmental noise monitoring, and industrial noise assessment technologies across the U.S. and Canada
- Asia-Pacific is projected to register the fastest CAGR of 7.7% from 2026 to 2033, led by China, India, Japan, and South Korea. Rapid expansion of textile, automotive, electronics, and industrial manufacturing, coupled with growing government focus on noise control, accelerates adoption
- The Hardware segment dominated the market with a 61.3% share in 2025, driven by its essential role in capturing precise acoustic signatures, vibration data, and structural noise patterns
Report Scope and Noise Source Mapping Market Segmentation
|
Attributes |
Noise Source Mapping Key Market Insights |
|
Segments Covered |
|
|
Countries Covered |
North America
Europe
Asia-Pacific
Middle East and Africa
South America
|
|
Key Market Players |
|
|
Market Opportunities |
|
|
Value Added Data Infosets |
In addition to the insights on market scenarios such as market value, growth rate, segmentation, geographical coverage, and major players, the market reports curated by the Data Bridge Market Research also include in-depth expert analysis, pricing analysis, brand share analysis, consumer survey, demography analysis, supply chain analysis, value chain analysis, raw material/consumables overview, vendor selection criteria, PESTLE Analysis, Porter Analysis, and regulatory framework. |
What is the Key Trend in the Noise Source Mapping Market?
Increasing Adoption of High-Precision, Digital, and Sustainable Noise Source Mapping Solutions
- The noise source mapping market is witnessing strong growth driven by adoption of high-resolution, digital, and eco-friendly acoustic mapping technologies that support environmental compliance and sustainable urban planning
- Manufacturers are developing advanced software and hardware solutions capable of detecting, visualizing, and analyzing complex noise sources in industrial, transportation, and urban environments
- Rising demand for real-time, AI-powered noise mapping for airports, highways, industrial plants, and urban infrastructure is accelerating technological investments
- Instance: Companies such as Brüel & Kjær, 3M, Cirrus Research, Norsonic, and RION introduced cutting-edge portable acoustic cameras, microphone arrays, and cloud-enabled noise analysis platforms in 2024–2025
- Integration of IoT, AI analytics, and cloud platforms is transforming noise monitoring practices across North America, Europe, and Asia-Pacific
- As industries and municipalities prioritize precision, sustainability, and regulatory compliance, Noise Source Mapping solutions are evolving toward high-performance, digital-first, and eco-conscious tools
What are the Key Drivers of Noise Source Mapping Market?
- Rising emphasis on environmental noise monitoring, occupational safety, and urban planning is driving global adoption of advanced noise mapping solutions
- Instance: In 2025, Brüel & Kjær, Cirrus Research, Norsonic, 3M, and RION expanded offerings with AI-enabled acoustic cameras, portable sensor networks, and real-time analytics platforms
- Growing industrialization, urbanization, and infrastructure development fuels demand for precise noise measurement in highways, railways, airports, and manufacturing sites
- Technological advancements such as microphone arrays, 3D sound visualization, IoT integration, and cloud-based analytics improve efficiency, accuracy, and scalability
- Increasing government regulations, noise limits, and sustainability initiatives accelerate adoption across environmental monitoring, construction, and transportation sectors
- Ongoing R&D, strategic collaborations, and software-hardware integration are expected to drive long-term expansion of the global Noise Source Mapping market
Which Factor is Challenging the Growth of the Noise Source Mapping Market?
- High costs of advanced acoustic cameras, AI-powered platforms, and multi-sensor networks limit adoption among smaller enterprises and municipalities
- Instance: During 2024–2025, fluctuations in electronic component costs, regulatory updates, and skilled labor shortages affected deployment of sophisticated noise mapping solutions globally
- Complexity in implementing multi-sensor arrays, cloud analytics, and AI modeling increases the need for technical expertise and training
- Limited awareness and expertise in emerging regions slows adoption of precision noise monitoring technologies
- Strong competition from low-cost analog meters, legacy solutions, and regional manufacturers creates pricing and differentiation pressure
- Companies are addressing these challenges by focusing on cost-effective, scalable, cloud-integrated systems, training programs, and automated noise analysis solutions, supporting broader global adoption of high-performance Noise Source Mapping technologies
How is the Noise Source Mapping Market Segmented?
The market is segmented on the basis of type and end-user.
- By Type
On the basis of type, the noise source mapping market is segmented into Hardware and Software. The Hardware segment dominated the market with a 61.3% share in 2025, driven by its essential role in capturing precise acoustic signatures, vibration data, and structural noise patterns. Hardware solutions, including microphones, sensors, accelerometers, and vibration measurement systems, are widely adopted across automotive, aerospace, and industrial applications due to their accuracy, reliability, and durability in harsh environments. Leading manufacturers are developing advanced multi-sensor arrays, portable mapping units, and IoT-integrated devices to enhance real-time noise monitoring and diagnostics.
The Software segment is projected to grow at the fastest CAGR from 2026 to 2033, fueled by increasing demand for cloud-based data analysis, AI-powered simulation, predictive noise modeling, and visualization platforms. Software solutions facilitate efficient interpretation of large datasets, remote monitoring, and integration with digital twins, accelerating adoption across automotive, defense, and industrial sectors globally.
- By End-User
On the basis of end-user, the noise source mapping market is segmented into Automotive and Transportation, Aerospace and Defense, Power Generation, Consumer Electronics, Construction, and Others. The Automotive and Transportation segment dominated the market with a 34.5% share in 2025, driven by the need for NVH (Noise, Vibration, and Harshness) analysis in passenger vehicles, commercial fleets, and electric vehicles. Increasing regulatory standards for cabin comfort, emission control systems, and environmental noise reduction further support widespread adoption.
The Aerospace and Defense segment is projected to grow at the fastest CAGR from 2026 to 2033, fueled by rising demand for precision noise mapping in aircraft, defense equipment, and UAVs. Complex acoustic challenges in high-speed turbines, engine compartments, and structural components require advanced mapping systems for safety, compliance, and performance optimization. Innovations in AI-based analysis, sensor fusion, and real-time monitoring are driving growth in aerospace and defense applications across North America, Europe, and Asia-Pacific.
Which Region Holds the Largest Share of the Noise Source Mapping Market?
- North America dominated the noise source mapping market with a 41.9% revenue share in 2025, driven by high adoption of advanced acoustic mapping, environmental noise monitoring, and industrial noise assessment technologies across the U.S. and Canada. Strong industrialization, extensive infrastructure projects, and strict environmental regulations make the region a key hub for high-precision noise mapping solutions
- Leading manufacturers in North America are focusing on AI-powered acoustic cameras, cloud-enabled monitoring systems, and IoT-integrated noise mapping platforms, strengthening technological leadership. Rapid investment in smart cities, transportation networks, and industrial automation is expanding long-term market opportunities
- Strong R&D capabilities, high engineering talent concentration, and robust industrial and urban ecosystems reinforce North America’s dominant position in the Noise Source Mapping market
U.S. Noise Source Mapping Market Insight
The U.S. is the largest contributor in North America, fueled by increasing investments in industrial automation, automotive NVH testing, and aerospace noise analysis. Growth in smart city projects, IoT-enabled monitoring systems, and environmental compliance programs accelerates adoption. Advanced R&D facilities and a strong presence of tech-driven enterprises ensure continuous innovation and high-volume deployment of Noise Source Mapping solutions.
Canada Noise Source Mapping Market Insight
Canada significantly contributes to regional growth, driven by government-backed noise regulation initiatives, expansion of research labs, and adoption of precision noise measurement technologies. Rising investments in renewable energy, industrial automation, and transportation noise mitigation further boost market penetration.
Asia-Pacific Noise Source Mapping Market Insight
Asia-Pacific is projected to register the fastest CAGR of 7.7% from 2026 to 2033, led by China, India, Japan, and South Korea. Rapid expansion of textile, automotive, electronics, and industrial manufacturing, coupled with growing government focus on noise control, accelerates adoption. Increasing R&D in eco-friendly and digital noise mapping solutions enhances technological capabilities.
China Noise Source Mapping Market Insight
China leads the regional market due to strong industrial base, high manufacturing output, and adoption of precision noise monitoring systems. Expansion in electronics, automotive, and textile industries drives demand for high-performance mapping solutions.
Japan Noise Source Mapping Market Insight
Japan shows steady growth with increasing adoption of noise reduction technologies in automotive, industrial, and construction sectors. Investment in R&D, smart factory solutions, and environmental compliance programs continues to drive market expansion.
India Noise Source Mapping Market Insight
India is emerging as a key growth market, supported by rapid industrialization, expanding automotive and electronics manufacturing, and rising regulatory emphasis on environmental noise monitoring. Increased adoption of digital and sensor-based mapping solutions strengthens market penetration.
South Korea Noise Source Mapping Market Insight
South Korea contributes meaningfully due to growth in smart manufacturing, automotive NVH testing, and electronics production. Rising focus on precision noise measurement and sustainable industrial practices enhances regional demand.
Which are the Top Companies in Noise Source Mapping Market?
The Noise Source Mapping industry is primarily led by well-established companies, including:
- NATIONAL INSTRUMENTS CORP (U.S.)
- Brüel & Kjær (Denmark)
- Siemens Industry Software Inc. (U.S.)
- HEAD acoustics GmbH (Germany)
- imc Test & Measurement GmbH (Germany)
- Dewesoft d.o.o. (Slovenia)
- GRAS Sound & Vibration (Denmark)
- Prosig Ltd (U.K.)
- m+p international Mess- und Rechnertechnik GmbH (Germany)
- SignalX Private Limited (India)
- Honeywell International Inc (U.S.)
- ESI Group (France)
- Thermotron Industries (U.S.)
- ERBESSD INSTRUMENTS (India)
- Kistler Instruments India Pvt. Ltd. (India)
- IMV Corporation (Japan)
- Econ Technologies, Inc (U.S.)
- Polytec GmbH (Germany)
- Benstone Instruments (India)
- PCB Piezotronics, Inc (U.S.)
SKU-

- Interactive Data Analysis Dashboard
- Company Analysis Dashboard for high growth potential opportunities
- Research Analyst Access for customization & queries
- Competitor Analysis with Interactive dashboard
- Latest News, Updates & Trend analysis
- Harness the Power of Benchmark Analysis for Comprehensive Competitor Tracking
Global Noise Source Mapping Market, Supply Chain Analysis and Ecosystem Framework
To support market growth and help clients navigate the impact of geopolitical shifts, DBMR has integrated in-depth supply chain analysis into its Global Noise Source Mapping Market research reports. This addition empowers clients to respond effectively to global changes affecting their industries. The supply chain analysis section includes detailed insights such as Global Noise Source Mapping Market consumption and production by country, price trend analysis, the impact of tariffs and geopolitical developments, and import and export trends by country and HSN code. It also highlights major suppliers with data on production capacity and company profiles, as well as key importers and exporters. In addition to research, DBMR offers specialized supply chain consulting services backed by over a decade of experience, providing solutions like supplier discovery, supplier risk assessment, price trend analysis, impact evaluation of inflation and trade route changes, and comprehensive market trend analysis.
Data collection and base year analysis are done using data collection modules with large sample sizes. The stage includes obtaining market information or related data through various sources and strategies. It includes examining and planning all the data acquired from the past in advance. It likewise envelops the examination of information inconsistencies seen across different information sources. The market data is analysed and estimated using market statistical and coherent models. Also, market share analysis and key trend analysis are the major success factors in the market report. To know more, please request an analyst call or drop down your inquiry.
The key research methodology used by DBMR research team is data triangulation which involves data mining, analysis of the impact of data variables on the market and primary (industry expert) validation. Data models include Vendor Positioning Grid, Market Time Line Analysis, Market Overview and Guide, Company Positioning Grid, Patent Analysis, Pricing Analysis, Company Market Share Analysis, Standards of Measurement, Global versus Regional and Vendor Share Analysis. To know more about the research methodology, drop in an inquiry to speak to our industry experts.
Data Bridge Market Research is a leader in advanced formative research. We take pride in servicing our existing and new customers with data and analysis that match and suits their goal. The report can be customized to include price trend analysis of target brands understanding the market for additional countries (ask for the list of countries), clinical trial results data, literature review, refurbished market and product base analysis. Market analysis of target competitors can be analyzed from technology-based analysis to market portfolio strategies. We can add as many competitors that you require data about in the format and data style you are looking for. Our team of analysts can also provide you data in crude raw excel files pivot tables (Fact book) or can assist you in creating presentations from the data sets available in the report.


