
Global Nutrigenomics Market
Market Size in USD Billion
 USD
1.56 Billion
USD
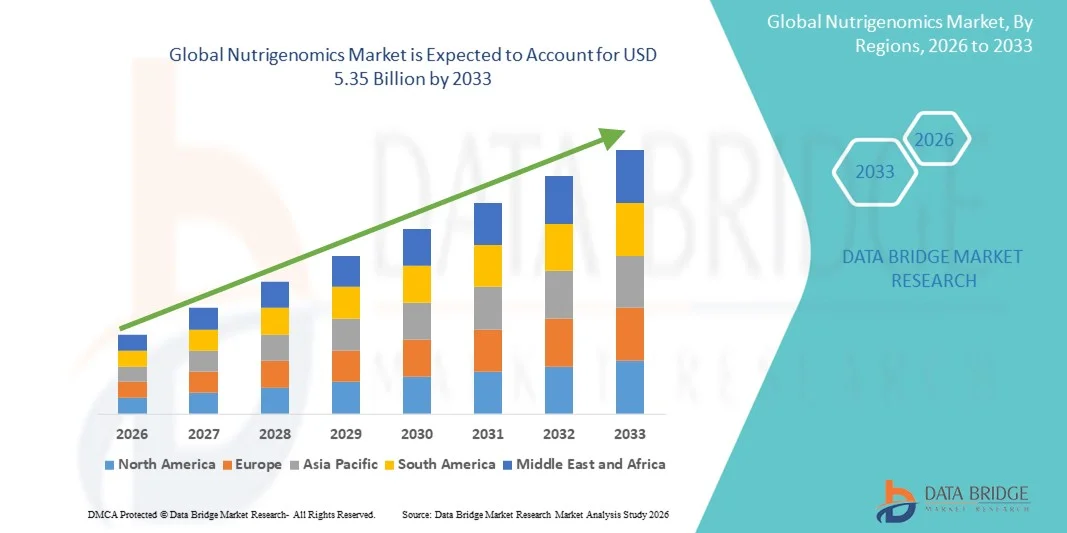
5.35 Billion
2025
2033
USD
1.56 Billion
USD
5.35 Billion
2025
2033
| 2026 - 2033 | |
| USD 1.56 Billion | |
| USD 5.35 Billion | |
| % | |
|
Nutrigenomics Market Size
- The global nutrigenomics market size was valued at USD 1.56 billion in 2025 and is expected to reach USD 5.35 billion by 2033, at a CAGR of 16.64%% during the forecast period
- The market growth is largely fueled by the rising awareness of gene–diet interactions, increasing prevalence of lifestyle-related chronic diseases such as obesity, diabetes, and cardiovascular conditions, and technological advancements in genetic testing and personalized nutrition solutions, which are enhancing health outcomes and preventive care strategies
- Furthermore, growing consumer demand for data-driven, individualized dietary recommendations, integration of digital health platforms with genetic insights, and the expansion of direct-to-consumer nutrigenomic services are establishing nutrigenomics as a key component of personalized healthcare. These converging factors are accelerating the adoption of nutrigenomics solutions, thereby significantly boosting the industry’s growth
Nutrigenomics Market Analysis
- Nutrigenomics, which explores the interaction between diet and human genes to optimize health outcomes through personalized nutrition, is increasingly becoming a cornerstone of preventive healthcare and wellness solutions due to advancements in genetic testing technologies and growing consumer interest in tailored dietary recommendations
- The escalating demand for nutrigenomics services and products is primarily fueled by the rising prevalence of lifestyle-related chronic diseases such as obesity, diabetes, and cardiovascular disorders, growing awareness of gene-diet interactions, and declining costs of sequencing technologies that make personalized nutrition more accessible to consumers worldwide
- North America dominated the nutrigenomics market with the largest revenue share of around 40.2% in 2025, driven by high consumer awareness of preventive health, advanced healthcare infrastructure, widespread adoption of direct-to-consumer genetic testing, and a strong presence of key industry players focused on personalized health solutions. The U.S. market, in particular, leads due to significant investment in genomics research and integration of nutrigenomic insights into wellness and clinical applications
- Asia-Pacific is expected to be the fastest-growing region in the nutrigenomics market during the forecast period owing to rapid urbanization, increasing disposable incomes, rising healthcare digitization, growing health consciousness among consumers, and supportive government initiatives in countries such as China, Japan, and India that are enhancing market uptake
- The reagents and kits segment dominated the market with a market share of 49.8% in 2025 due to increased testing volumes and rising use of saliva and buccal-swab collection techniques
Report Scope and Nutrigenomics Market Segmentation
|
Attributes |
Nutrigenomics Key Market Insights |
|
Segments Covered |
|
|
Countries Covered |
North America
Europe
Asia-Pacific
Middle East and Africa
South America
|
|
Key Market Players |
|
|
Market Opportunities |
|
|
Value Added Data Infosets |
In addition to the insights on market scenarios such as market value, growth rate, segmentation, geographical coverage, and major players, the market reports curated by the Data Bridge Market Research also include in-depth expert analysis, patient epidemiology, pipeline analysis, pricing analysis, and regulatory framework |
Nutrigenomics Market Trends
AI-Driven Personalization and Expansion of Digital Nutritional Ecosystems
- A significant and accelerating trend in the global nutrigenomics market is the deepening integration of artificial intelligence (AI) with genetic nutrition platforms, enabling highly tailored dietary recommendations and enhancing user engagement across both clinical and consumer wellness ecosystems due to these advancements in analytical capabilities
- For instance, leading personalized nutrition programs now use AI-driven engines that analyze genetic markers related to metabolism, micronutrient utilization, and dietary sensitivities to deliver real-time diet plans, making genomics-based nutrition more actionable and precise for users
- AI integration in nutrigenomic platforms enables features such as learning individual metabolic response patterns to potentially refine diet recommendations and providing more intelligent alerts based on nutritional deviations. For instance, several emerging platforms now utilize AI to improve recommendation accuracy over time and can send intelligent alerts if user biometrics deviate from expected norms
- Furthermore, voice-enabled digital assistants are beginning to synchronize with personalized nutrition apps, allowing users to receive daily nutrition guidance, compliance reminders, and recipe suggestions through simple verbal interactions
- The seamless integration of nutrigenomics with broader digital health ecosystems facilitates centralized health management in which users can track their genetics-based diets alongside fitness, sleep, and metabolic health data within unified platforms, creating an interconnected preventive-health environment
- This trend toward more intelligent, intuitive, and integrated nutrigenomic systems is fundamentally reshaping user expectations for personalized wellness. Consequently, companies in the sector are developing AI-enabled platforms capable of automatically updating diet plans based on genomic insights and lifestyle data, enhancing real-time personalization
- The demand for nutrigenomic solutions offering seamless AI-powered personalization is growing rapidly across both healthcare and consumer nutrition sectors, as individuals increasingly prioritize customized health solutions and data-driven dietary optimization
Nutrigenomics Market Dynamics
Driver
Growing Need Due to Rising Chronic Diseases and Personalized Nutrition Adoption
- The increasing prevalence of chronic lifestyle conditions such as obesity, diabetes, and cardiovascular disorders, coupled with the accelerating adoption of personalized nutrition solutions, is a significant driver for the heightened demand for nutrigenomics
- For instance, in recent years, several biotechnology firms have expanded their genomic testing capabilities to include nutrition-related markers, enabling healthcare providers to integrate genetic dietary guidance into personalized treatment strategies, which is expected to drive nutrigenomics industry growth in the forecast period
- As consumers become more aware of how genetics influence nutrient absorption and metabolic responses, nutrigenomics offers advanced tools such as gene-based dietary recommendations, micronutrient optimization, and metabolic pathway analysis, providing a compelling upgrade over conventional nutrition approaches
- Furthermore, the growing popularity of digital health platforms and the desire for data-supported wellness routines are making nutrigenomics an integral component of personalized healthcare systems, offering seamless integration with fitness trackers, mobile health apps, and metabolic monitors
- The convenience of at-home genetic testing, remote access to personalized diet plans, and the ability to manage nutrition through smartphone-based applications are key factors propelling the adoption of nutrigenomics in both clinical and consumer segments
- The trend toward consumer-driven preventive healthcare and the increasing availability of user-friendly genetic testing kits further contribute to market growth
Restraint/Challenge
Data Privacy Concerns and Regulatory Compliance Hurdle
- Concerns surrounding the privacy and security of genetic data, including the storage and handling of personal genomic information, pose a significant challenge to broader market penetration. As nutrigenomic services rely on sensitive biological data, they are susceptible to privacy breaches, raising anxieties among potential users about data security
- For instance, high-profile reports of breaches involving personal genetic data have made some consumers hesitant to adopt DNA-based wellness solutions, including nutrigenomics-driven nutrition platforms
- Addressing these data privacy concerns through secure encryption, transparent consent policies, and strict compliance protocols is crucial for building consumer trust. Companies in the sector increasingly emphasize their robust security frameworks and anonymization practices to reassure potential customers
- In addition, the relatively high cost of advanced nutrigenomic testing compared to standard nutrition assessments can be a barrier to adoption for price-sensitive consumers, particularly in developing regions or among individuals with limited access to personalized healthcare services. While direct-to-consumer tests have become more affordable, comprehensive genomic panels often carry higher price points
- While costs are gradually decreasing, the perceived premium for genomics-based solutions can still hinder widespread adoption, especially among those who do not immediately recognize the added value of personalized genetic nutritional insights
- Overcoming these challenges through enhanced data security measures, consumer education on the benefits and safety of genomic testing, and the development of cost-effective testing solutions will be crucial for market expansion
Nutrigenomics Market Scope
The market is segmented on the basis of product, technique, and application.
- By Product
On the basis of product, the global nutrigenomics market is segmented into reagents and kits and services. The reagents and kits segment dominated the market in 2025 with a market share of 49.8%, driven by the widespread use of consumables required for genetic testing workflows, including DNA extraction, amplification, and gene marker analysis. This segment benefits from recurring demand, as every test requires new reagents, making it a high-volume revenue generator for manufacturers. Increased adoption of saliva and buccal swab tests has further accelerated kit consumption, especially within direct-to-consumer genetic testing platforms. Moreover, research institutions and clinical laboratories rely heavily on high-quality reagents for accurate nutrigenomic profiling, reinforcing segment dominance. Growing focus on personalized nutrition and preventive healthcare continues to elevate the demand for test kits, positioning this segment as the backbone of overall nutrigenomics testing activity.
The services segment is anticipated to witness the fastest growth rate from 2026 to 2033, fueled by rising consumer demand for personalized dietary recommendations and the growing adoption of AI-driven data interpretation platforms. Services include genetic counseling, diet plan creation, and analytics-based reporting, all of which are becoming essential as consumers seek actionable insights rather than raw genetic data. Increasing collaborations between biotech firms and nutrition companies are enabling the development of advanced service packages tailored to metabolic health, weight management, and chronic disease prevention. The convenience of app-based interpretation services and subscription models is further accelerating demand. As genetic literacy improves globally, consumers increasingly value expert-guided interpretation, driving strong growth in this segment.
- By Technique
On the basis of technique, the nutrigenomics market is segmented into saliva, buccal swab, blood, and others. The saliva segment dominated the market in 2025, primarily due to its non-invasive sample collection method that is highly preferred by both consumers and testing companies. Saliva-based kits are easy to use, require no clinical supervision, and can be shipped directly to laboratories from home, boosting adoption across large-scale direct-to-consumer testing programs. The stability of saliva samples and compatibility with automated DNA extraction systems further enhance processing efficiency for testing facilities. Companies offering nutrigenomic testing frequently prioritize saliva collection because it increases participation rates and reduces logistical complexity. With growing consumer interest in home-based genetic analysis, saliva sampling continues to represent the most convenient and widely accepted technique in the market.
The buccal swab segment is expected to witness the fastest growth rate from 2026 to 2033, driven by its increasing adoption in pediatric, geriatric, and clinical settings where saliva collection may be challenging. Buccal swabs offer a quick, painless, and hygienic method for collecting high-quality DNA samples, making them suitable for precision nutrition applications requiring reliable genetic markers. Their use is expanding in hospitals, nutrition clinics, and wellness centers as practitioners integrate nutrigenomics into personalized diet planning. Moreover, the low cost and portability of swab kits make them ideal for large-scale population studies and preventive health programs. As demand rises for simplified, clinician-approved collection methods, buccal swabs are emerging as the technique of choice for supervised nutrigenomic testing.
- By Application
On the basis of application, the nutrigenomics market is segmented into obesity, cardiovascular disorders (CVD), diabetes, anti-aging, and cancer research. The obesity segment dominated the market in 2025, supported by the global rise in obesity rates and the growing recognition of genetic influence on weight management and metabolic response. Nutrigenomic testing is increasingly used to tailor dietary plans based on genes related to fat absorption, appetite regulation, and energy expenditure. Many personalized nutrition companies focus heavily on weight-management insights, as it remains the most in-demand consumer application. Healthcare practitioners are integrating gene-based dietary interventions into obesity treatment programs, improving patient outcomes with personalized strategies. As consumers seek long-term, sustainable weight solutions, nutrigenomic tools addressing obesity continue to command a major share of the overall market.
The anti-aging and cancer research segment is anticipated to witness the fastest growth from 2026 to 2033, driven by rising demand for advanced health optimization and preventive medicine approaches. Nutrigenomics plays a growing role in identifying genetic variants linked to oxidative stress, inflammation, cellular aging, and nutrient-related cancer risk pathways. Research institutions and biotech companies are increasingly exploring nutrigenomic markers to develop targeted nutritional interventions aimed at improving longevity and reducing cancer susceptibility. Consumer interest in age-management supplements and precision diets is also accelerating growth in this segment. As scientific understanding of gene–nutrient interactions deepens, the segment is expected to experience strong expansion in both clinical research and premium preventive health markets.
Nutrigenomics Market Regional Analysis
- North America dominated the nutrigenomics market with the largest revenue share of around 40.2% in 2025, driven by high consumer awareness of preventive health, advanced healthcare infrastructure, widespread adoption of direct-to-consumer genetic testing, and a strong presence of key industry players focused on personalized health solutions
- Consumers in the region highly value personalized dietary recommendations, advanced genetic insights, and seamless integration of nutrigenomic platforms with digital health apps and wellness ecosystems
- This widespread adoption is further supported by high healthcare expenditure, a well-established biotechnology sector, and the growing preference for tailored nutrition plans, establishing nutrigenomics as a favored solution across both clinical and consumer wellness settings
U.S. Nutrigenomics Market Insight
The U.S. nutrigenomics market captured the largest revenue share within North America in 2025, fueled by the rapid adoption of genetic testing and the rising demand for personalized nutrition solutions. Consumers are increasingly prioritizing DNA-based dietary insights to enhance metabolic health, weight management, and preventive care. The growing preference for at-home genetic test kits, combined with strong demand for AI-driven nutrition apps and digital wellness platforms, further propels the nutrigenomics industry. Moreover, the integration of nutrigenomics into clinical practice and corporate wellness programs is significantly contributing to market expansion.
Europe Nutrigenomics Market Insight
The Europe nutrigenomics market is projected to expand at a substantial CAGR throughout the forecast period, primarily driven by heightened focus on preventive healthcare and increasing awareness regarding the role of genetics in nutrition. The rise in lifestyle disorders, coupled with the demand for evidence-based dietary solutions, is fostering the adoption of nutrigenomics across the region. European consumers are drawn to the scientific credibility, personalized diet plans, and improved health outcomes associated with genetic-based nutrition. The region is witnessing notable uptake across clinical nutrition, research institutions, and consumer wellness programs, with nutrigenomics increasingly incorporated into personalized healthcare services.
U.K. Nutrigenomics Market Insight
The U.K. nutrigenomics market is anticipated to grow at a noteworthy CAGR during the forecast period, driven by the rising trend of personalized wellness and a strong emphasis on preventive health management. Increasing awareness of the genetic influence on diet and metabolism is encouraging both consumers and healthcare providers to adopt DNA-based nutrition solutions. The U.K.’s strong digital health ecosystem, along with robust e-commerce adoption for at-home testing kits, continues to stimulate market growth. In addition, the growing interest in precision nutrition among fitness enthusiasts and health-conscious consumers is expected to propel the industry forward.
Germany Nutrigenomics Market Insight
The Germany nutrigenomics market is expected to expand at a considerable CAGR during the forecast period, fueled by increasing emphasis on scientific nutrition, metabolic health, and advanced diagnostics. Germany’s well-developed healthcare infrastructure, combined with its strong focus on innovation and clinical research, supports the adoption of gene-based dietary assessment tools. Consumers in the country place high importance on accuracy, data privacy, and sustainable health outcomes, driving interest in nutrigenomic solutions. The integration of nutrigenomics into nutrition counseling centers, wellness clinics, and personalized diet programs is becoming increasingly prevalent across the country.
Asia-Pacific Nutrigenomics Market Insight
The Asia-Pacific nutrigenomics market is poised to grow at the fastest CAGR during the forecast period, driven by rising health awareness, rapid urbanization, and increasing interest in personalized nutrition across countries such as China, Japan, and India. The region’s growing adoption of digital health platforms and at-home testing kits is accelerating nutrigenomics uptake. Furthermore, APAC’s role as a manufacturing hub for genetic testing components and biotechnology products enhances market accessibility and affordability. Government initiatives supporting preventive healthcare and lifestyle disease management are further expanding the nutrigenomics market across the region.
Japan Nutrigenomics Market Insight
The Japan nutrigenomics market is gaining momentum due to the country’s advanced technological environment, strong focus on longevity, and rising demand for precision health solutions. Japanese consumers place significant emphasis on scientifically validated wellness interventions, driving adoption of DNA-based dietary recommendations. The integration of nutrigenomics with smart health devices, metabolic trackers, and personalized diet platforms is fueling market growth. Moreover, Japan’s aging population is such asly to spur demand for genetic-guided nutrition strategies aimed at improving energy levels, reducing disease risk, and supporting healthy aging.
India Nutrigenomics Market Insight
The India nutrigenomics market accounted for one of the largest market revenue shares in Asia-Pacific in 2025, attributed to the country’s expanding middle class, rising incidence of lifestyle disorders, and increasing health consciousness. India stands as one of the fastest-growing markets for personalized wellness solutions, with nutrigenomics gaining popularity among both consumers and healthcare practitioners. The push toward digital healthcare, combined with the availability of affordable test kits and strong domestic biotechnology activity, is accelerating adoption. In addition, the integration of gene-based diet recommendations into fitness, weight management, and preventive health programs is significantly propelling market growth.
Nutrigenomics Market Share
The Nutrigenomics industry is primarily led by well-established companies, including:
- Nutrigenomix Inc. (Canada)
- GX Sciences, LLC (U.S.)
- DNAfit (U.K.)
- Xcode Life (India)
- Mapmygenome India Ltd (India)
- Genopalate Inc. (U.S.)
- GenePlanet (Slovenia)
- WellnessFX (U.S.)
- Metagenics Inc. (U.S.)
- Genova Diagnostics (U.S.)
- 24Genetics SL (Spain)
- Genomelink, Inc. (U.S.)
- Cura Integrative Medicine (U.S.)
- Holistic Health International, LLC (U.S.)
- dnalife (Nordic Labs) (Scandinavia)
- The Gene Box (U.K.)
- Nutrigenomics Institute (U.S.)
- WellGen Inc. (U.S.)
- Cell Logic Pty Ltd (Australia)
- Vitagene Inc. (U.S.)
What are the Recent Developments in Global Nutrigenomics Market?
- In November 2025, an open-access study was published on integrating genomic, metabolomic, and microbiome data (“multi-omics”) to advance personalized nutrition strategies. This development shows real research moving toward practical nutrigenomics implementations
- In October 2025, nutrition professionals discussed the latest advances in nutrient-gene interactions and nutrigenomics applications as personalized dietary tools. This article describes cutting-edge research emerging in 2025 on how nutrients affect gene expression and personalized diet planning
- In April 2024, GX Sciences launched an enhanced nutrigenomics platform integrating AI-driven meal planning to deliver hyper-personalized nutrition guidance. This move reflects the increasing integration of artificial intelligence with genetic-based nutritional services to provide more precise and personalized diet recommendations
- In March 2024, Xcode Life introduced the “Genes and Caffeine” genetic test report, offering insights on how individual genetics influence caffeine metabolism and response. This expands nutrigenomic testing beyond diet into lifestyle-related nutritional factors
- In June 2023, Xcode Life launched a comprehensive Gene Nutrition test covering nearly 50 aspects of nutrition based on genetic makeup. This test helps users understand how their genes impact metabolism, nutrient absorption, food sensitivities, and personalized dietary needs
SKU-

- Interactive Data Analysis Dashboard
- Company Analysis Dashboard for high growth potential opportunities
- Research Analyst Access for customization & queries
- Competitor Analysis with Interactive dashboard
- Latest News, Updates & Trend analysis
- Harness the Power of Benchmark Analysis for Comprehensive Competitor Tracking
Data collection and base year analysis are done using data collection modules with large sample sizes. The stage includes obtaining market information or related data through various sources and strategies. It includes examining and planning all the data acquired from the past in advance. It likewise envelops the examination of information inconsistencies seen across different information sources. The market data is analysed and estimated using market statistical and coherent models. Also, market share analysis and key trend analysis are the major success factors in the market report. To know more, please request an analyst call or drop down your inquiry.
The key research methodology used by DBMR research team is data triangulation which involves data mining, analysis of the impact of data variables on the market and primary (industry expert) validation. Data models include Vendor Positioning Grid, Market Time Line Analysis, Market Overview and Guide, Company Positioning Grid, Patent Analysis, Pricing Analysis, Company Market Share Analysis, Standards of Measurement, Global versus Regional and Vendor Share Analysis. To know more about the research methodology, drop in an inquiry to speak to our industry experts.
Data Bridge Market Research is a leader in advanced formative research. We take pride in servicing our existing and new customers with data and analysis that match and suits their goal. The report can be customized to include price trend analysis of target brands understanding the market for additional countries (ask for the list of countries), clinical trial results data, literature review, refurbished market and product base analysis. Market analysis of target competitors can be analyzed from technology-based analysis to market portfolio strategies. We can add as many competitors that you require data about in the format and data style you are looking for. Our team of analysts can also provide you data in crude raw excel files pivot tables (Fact book) or can assist you in creating presentations from the data sets available in the report.


