
Global Optical Waveguide Display Market
Market Size in USD Billion
 USD
17.42 Billion
USD
45.97 Billion
2025
2033
USD
17.42 Billion
USD
45.97 Billion
2025
2033
| 2026 - 2033 | |
| USD 17.42 Billion | |
| USD 45.97 Billion | |
| % | |
|
Optical Waveguide Display Market Overview
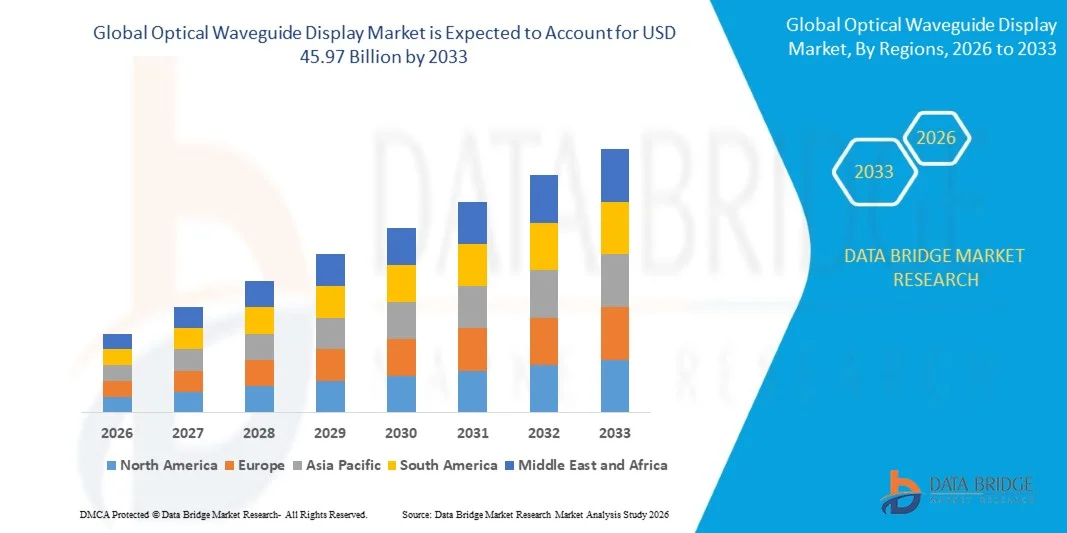
As per Data Bridge Market Research analysis the Optical Waveguide Display Market was valued at USD 17.42 billion in 2025 and is projected to reach USD 45.97 billion by 2033, growing at a CAGR of 12.90% from 2026 to 2033. The market is experiencing rapid growth driven by increasing adoption of augmented reality and virtual reality devices, rising demand for lightweight near-eye displays, and expanding integration of waveguide technology in smart glasses, head-mounted displays, and automotive head-up display systems.
The growing need for immersive digital experiences across consumer electronics, healthcare, industrial training, defense, and automotive sectors is encouraging manufacturers to adopt optical waveguide display technologies. These displays enable compact form factors, high brightness, wide field of view, and improved image quality while reducing the size and weight limitations associated with conventional optical display systems. Increasing investments in AR-enabled smart glasses, mixed reality platforms, and next-generation vehicle display technologies are further supporting market expansion.
Key Market Trends & Insights
- North America dominated the optical waveguide display market with the largest revenue share of 38.4% in 2025, supported by strong investments in AR and mixed reality technologies, the presence of major technology companies, and growing deployment of waveguide-based displays across defense, healthcare, industrial training, and consumer electronics applications.
- Asia-Pacific is expected to be the fastest-growing region, recording a CAGR of 15.8% from 2026 to 2033. Growth is driven by rapid expansion of consumer electronics manufacturing, rising investment in AR and VR technologies, increasing adoption of smart wearable devices, and strong display component production capabilities across China, Japan, South Korea, and India.
- The Planar Waveguide segment held the largest market revenue share of approximately 58.6% in 2025, driven by its widespread use in augmented reality displays, optical communication systems, and compact photonic integrated circuits. Planar waveguides are preferred due to their compatibility with thin display architectures, efficient light propagation, and ability to support large-scale fabrication processes.
- The Channel Waveguide segment is projected to register the fastest growth at a CAGR of 14.2% from 2026 to 2033, driven by increasing demand for high-density optical interconnects, photonic chips, and advanced near-eye display systems. Rising adoption in data centers, telecommunications, and high-performance computing applications is accelerating segment expansion.
- The Glass Waveguides segment held the largest market revenue share of approximately 31.8% in 2025, supported by its high optical transparency, low propagation loss, and extensive use in AR smart glasses and head-mounted display systems. Glass-based waveguides are increasingly preferred for consumer and enterprise AR devices requiring high image clarity and optical durability.
- The Silicon Waveguides segment is projected to register the fastest growth at a CAGR of 15.6% from 2026 to 2033, driven by rising deployment of silicon photonics in high-speed data transmission, AI data centers, and optical computing systems. Increasing integration of silicon waveguides with semiconductor manufacturing processes is supporting scalable and cost-effective production.
- The Lithography Method segment held the largest market revenue share of approximately 46.7% in 2025, driven by its ability to produce highly precise diffraction gratings, optical structures, and integrated waveguide components. The method is widely used in advanced AR displays and semiconductor photonics applications where high accuracy and optical performance are required.
- The Microreplication Method segment is projected to register the fastest growth at a CAGR of 13.8% from 2026 to 2033, supported by increasing demand for lower-cost, high-volume production of polymer and glass waveguide components. The method enables manufacturers to replicate complex optical structures efficiently, improving scalability for consumer smart glasses and automotive head-up display applications.
- The On-Chip Optical Interconnection segment held the largest market revenue share of approximately 29.4% in 2025, driven by growing adoption of photonic integrated circuits in high-performance computing, AI accelerators, and data center infrastructure. On-chip optical interconnects help reduce signal loss, power consumption, and data transmission latency compared to conventional electrical interconnections.
- The Chip-To-Chip Optical Interconnection segment is projected to register the fastest growth at a CAGR of 16.1% from 2026 to 2033, driven by rising demand for high-bandwidth connectivity between processors, memory systems, and AI computing modules. Increasing deployment of advanced semiconductor packaging and optical computing technologies is accelerating segment growth.
- The Computing segment held the largest market revenue share of approximately 24.9% in 2025, driven by rising integration of optical waveguide technologies in AR and VR devices, smart glasses, high-performance computing systems, and next-generation display platforms. Growing demand for compact, high-resolution, and energy-efficient visualization technologies is supporting segment dominance.
- The Aircraft and Automobiles segment is projected to register the fastest growth at a CAGR of 15.3% from 2026 to 2033, driven by increasing deployment of augmented reality head-up displays, advanced driver assistance systems, cockpit visualization technologies, and connected vehicle platforms. Rising investments in smart mobility and aviation display systems are accelerating adoption across this segment.
Market Size & Forecast
- Global Market Value (2025): USD 17.42 Billion
- Expected Market Value (2033): USD 45.97 Billion
- Forecast CAGR (2026–2033): 12.90%
- Leading Region in 2025: North America
- Fastest Growing Region: Asia-Pacific
Report Scope and Optical Waveguide Display Market Segmentation
|
Attributes |
Optical Waveguide Display Key Market Insights |
|
Segments Covered |
|
|
Countries Covered |
North America
Europe
Asia-Pacific
Middle East and Africa
South America
|
|
Key Market Players |
• Waveguide Optical Technologies (U.S.) |
|
Market Opportunities |
• Expansion Of Augmented Reality Smart Glasses |
|
Value Added Data Infosets |
In addition to the insights on market scenarios such as market value, growth rate, segmentation, geographical coverage, and major players, the market reports curated by the Data Bridge Market Research also include in-depth expert analysis, geographically represented company-wise production and capacity, network layouts of distributors and partners, detailed and updated price trend analysis and deficit analysis of supply chain and demand. |
Optical Waveguide Display Market Trends
Trend: Growth In Augmented Reality Smart Glasses And High Performance Waveguide Optics Applications
Increasing demand for lightweight, immersive, and hands-free digital interfaces across consumer electronics, industrial, healthcare, automotive, and defense sectors is accelerating adoption of optical waveguide display technologies. Conventional head-mounted displays often remain bulky and limit user comfort, while optical waveguides enable thinner, transparent, and more compact near-eye display designs capable of overlaying digital content onto the physical environment.
In augmented reality smart glasses, manufacturers are integrating diffractive, reflective, and holographic waveguides with micro-LED and LCoS display engines to improve brightness, field of view, and image uniformity. For instance, Meta introduced its Orion AR glasses prototype in September 2024, featuring silicon carbide diffractive waveguides, a 70-degree field of view, and a 98-gram form factor, demonstrating the increasing focus on delivering wider visual experiences in glasses-like devices.
The expansion of enterprise AR applications is also increasing demand for waveguide displays in industrial training, remote assistance, maintenance, and surgical visualization. In addition, automotive manufacturers are exploring waveguide-based head-up displays to project navigation and safety information within the driver’s line of sight. Research published in 2024 demonstrated full-colour 3D holographic augmented reality displays using metasurface waveguides, highlighting continued progress toward improved visual realism and compact optical architectures.
Optical Waveguide Display Market Dynamics
Key Market Driver: Rising Adoption Of AR And Mixed Reality Devices
Growing investment in augmented reality, mixed reality, and wearable computing devices is driving strong demand for optical waveguide displays. Enterprises and consumers increasingly require compact display technologies that can provide digital overlays, real-time information, and immersive visualization without the bulk associated with conventional headsets.
Technology companies are developing waveguide-enabled smart glasses for industrial, healthcare, defense, and consumer applications. For instance, Meta’s Orion prototype uses a silicon carbide diffraction-type waveguide combined with a three-panel full-colour micro-LED display engine, demonstrating how advanced waveguide architectures can support high-brightness AR content in lightweight wearable devices.
Similarly, industrial organizations are using AR headsets for equipment maintenance, remote expert guidance, and worker training, reducing the need for printed manuals and improving access to contextual information. A systematic review of AR-assisted surgery identified 91 eligible studies between 2013 and 2020, with surgical guidance representing the most common application context, indicating expanding use of optical see-through displays in clinical visualization workflows.
Key Restraint/Challenge: High Manufacturing Costs And Optical Performance Limitations
Optical waveguide displays face challenges related to high fabrication costs, complex optical design requirements, and limitations in brightness, colour uniformity, field of view, and light efficiency. Producing high-quality diffraction gratings and precision optical substrates requires specialized materials, advanced lithography, and stringent quality control, increasing the overall cost of AR smart glasses and head-mounted display systems.
Manufacturers must also balance wide field of view with image resolution, eye-box size, and compact form factors. For instance, Meta’s Orion prototype achieved a 70-degree field of view, compared with approximately 46 degrees for Xreal glasses and 52 degrees for HoloLens 2, illustrating both the progress and continuing engineering complexity involved in delivering wide-view AR experiences.
In addition, waveguide displays can experience visual artifacts such as stray light, rainbow effects, reduced contrast, and image distortion under different ambient lighting conditions. These limitations can affect user comfort and restrict broader adoption in cost-sensitive consumer markets, particularly where conventional displays provide lower-cost alternatives.
Key Market Opportunity: Integration In Automotive Head-Up Displays And Enterprise AR Solutions
Automotive head-up displays, connected vehicles, industrial wearables, and next-generation consumer smart glasses are creating significant opportunities for optical waveguide display providers. Waveguide technologies can project navigation, collision warnings, speed information, and augmented driving guidance directly into the driver’s field of view while maintaining a compact dashboard design.
Automotive OEMs are increasingly evaluating augmented reality head-up display systems to improve driver awareness and reduce distraction. In enterprise environments, optical waveguide displays are being integrated into smart glasses for warehouse operations, field servicing, manufacturing inspection, and defense training, enabling workers to access digital instructions without interrupting manual tasks.
In addition, advancements in metasurface waveguides, micro-LED display engines, and holographic optical elements are improving display efficiency and visual quality. Research published in 2024 demonstrated a full-colour 3D holographic augmented reality display based on metasurface waveguides, supporting future opportunities for compact, high-resolution visualization systems across healthcare, aerospace, and consumer electronics applications.
Optical Waveguide Display Market Scope
The market is segmented on the basis of type, material type, fabrication process, optical interconnection, and application.
• By Type
On the basis of type, the optical waveguide display market is segmented into channel waveguide and planar waveguide. The Planar Waveguide segment held the largest market revenue share of approximately 58.6% in 2025, driven by its widespread use in augmented reality displays, optical communication systems, and compact photonic integrated circuits. Planar waveguides are preferred due to their compatibility with thin display architectures, efficient light propagation, and ability to support large-scale fabrication processes.
The Channel Waveguide segment is projected to register the fastest growth at a CAGR of 14.2% from 2026 to 2033, driven by increasing demand for high-density optical interconnects, photonic chips, and advanced near-eye display systems. Rising adoption in data centers, telecommunications, and high-performance computing applications is accelerating segment expansion.
• By Material Type
On the basis of material type, the market is segmented into electro-optic waveguides, silicon waveguides, semiconductor waveguides, glass waveguides, polymer waveguides, and others. The Glass Waveguides segment held the largest market revenue share of approximately 31.8% in 2025, supported by its high optical transparency, low propagation loss, and extensive use in AR smart glasses and head-mounted display systems. Glass-based waveguides are increasingly preferred for consumer and enterprise AR devices requiring high image clarity and optical durability.
The Silicon Waveguides segment is projected to register the fastest growth at a CAGR of 15.6% from 2026 to 2033, driven by rising deployment of silicon photonics in high-speed data transmission, AI data centers, and optical computing systems. Increasing integration of silicon waveguides with semiconductor manufacturing processes is supporting scalable and cost-effective production.
• By Fabrication Process
On the basis of fabrication process, the market is segmented into lithography method, microreplication method, and photo-address method. The Lithography Method segment held the largest market revenue share of approximately 46.7% in 2025, driven by its ability to produce highly precise diffraction gratings, optical structures, and integrated waveguide components. The method is widely used in advanced AR displays and semiconductor photonics applications where high accuracy and optical performance are required.
The Microreplication Method segment is projected to register the fastest growth at a CAGR of 13.8% from 2026 to 2033, supported by increasing demand for lower-cost, high-volume production of polymer and glass waveguide components. The method enables manufacturers to replicate complex optical structures efficiently, improving scalability for consumer smart glasses and automotive head-up display applications.
• By Optical Interconnection
On the basis of optical interconnection, the market is segmented into board-to-board optical interconnection, optical backplane, on-chip optical interconnection, interboard, chip-to-chip optical interconnection, and others. The On-Chip Optical Interconnection segment held the largest market revenue share of approximately 29.4% in 2025, driven by growing adoption of photonic integrated circuits in high-performance computing, AI accelerators, and data center infrastructure. On-chip optical interconnects help reduce signal loss, power consumption, and data transmission latency compared to conventional electrical interconnections.
The Chip-To-Chip Optical Interconnection segment is projected to register the fastest growth at a CAGR of 16.1% from 2026 to 2033, driven by rising demand for high-bandwidth connectivity between processors, memory systems, and AI computing modules. Increasing deployment of advanced semiconductor packaging and optical computing technologies is accelerating segment growth.
• By Application
On the basis of application, the market is segmented into inspection devices, high-performance server, printers, aircraft and automobiles, tablet PC, super high vision, medical equipment, computing, router, and others. The Computing segment held the largest market revenue share of approximately 24.9% in 2025, driven by rising integration of optical waveguide technologies in AR and VR devices, smart glasses, high-performance computing systems, and next-generation display platforms. Growing demand for compact, high-resolution, and energy-efficient visualization technologies is supporting segment dominance.
The Aircraft and Automobiles segment is projected to register the fastest growth at a CAGR of 15.3% from 2026 to 2033, driven by increasing deployment of augmented reality head-up displays, advanced driver assistance systems, cockpit visualization technologies, and connected vehicle platforms. Rising investments in smart mobility and aviation display systems are accelerating adoption across this segment.
Optical Waveguide Display Market Regional Analysis
North America Optical Waveguide Display Market Insight
North America dominated the optical waveguide display market with the largest revenue share of approximately 38.4% in 2025, supported by strong investments in augmented reality, mixed reality, defense visualization, and advanced consumer electronics. The region benefits from the presence of major technology companies, semiconductor manufacturers, and AR device developers focused on lightweight smart glasses and high-resolution near-eye display platforms. Growing adoption of enterprise AR solutions for industrial training, remote assistance, and maintenance operations is further supporting market expansion.
U.S. Optical Waveguide Display Market Insight
The U.S. optical waveguide display market captured the largest revenue share in 2025 within North America, fueled by rapid development of AR smart glasses, mixed reality headsets, and advanced head-up display systems. Technology companies and defense organizations are increasingly investing in optical waveguide solutions to support immersive visualization, real-time data overlays, and hands-free operational workflows. The growing integration of micro-LED display engines, AI-enabled wearables, and optical computing platforms is further strengthening market growth.
Europe Optical Waveguide Display Market Insight
The Europe optical waveguide display market is expected to witness strong growth from 2026 to 2033, primarily driven by increasing adoption of automotive head-up displays, industrial automation technologies, and enterprise AR platforms. The region’s focus on advanced manufacturing, connected mobility, and digital transformation is encouraging deployment of waveguide-based visualization systems across automotive, aerospace, healthcare, and industrial applications. Growing demand for energy-efficient and compact display technologies is also supporting market expansion.
U.K. Optical Waveguide Display Market Insight
The U.K. optical waveguide display market is expected to witness significant growth from 2026 to 2033, driven by rising investment in immersive technologies, defense modernization programs, and industrial AR applications. Companies are increasingly adopting smart glasses and optical head-mounted displays for remote collaboration, maintenance support, and workforce training. The country’s strong research ecosystem and growing focus on spatial computing technologies are further accelerating adoption of advanced waveguide display solutions.
Germany Optical Waveguide Display Market Insight
The Germany optical waveguide display market is expected to grow steadily from 2026 to 2033, fueled by increasing deployment of augmented reality head-up displays in automobiles, strong industrial automation capabilities, and rising demand for advanced optical technologies. Germany’s automotive and manufacturing sectors are increasingly exploring waveguide displays for driver assistance, production line visualization, and quality inspection applications. The growing focus on precision engineering and high-performance optical systems is supporting market development.
Asia-Pacific Optical Waveguide Display Market Insight
The Asia-Pacific optical waveguide display market is expected to witness the fastest growth rate from 2026 to 2033, supported by rapid expansion of consumer electronics manufacturing, increasing investment in AR and VR technologies, and rising adoption of smart wearable devices across China, Japan, South Korea, and India. The region is emerging as a major production hub for display components, semiconductor devices, and optical materials, improving affordability and accessibility of waveguide display systems.
Japan Optical Waveguide Display Market Insight
The Japan optical waveguide display market is expected to witness strong growth from 2026 to 2033 due to the country’s advanced electronics industry, high adoption of automation technologies, and increasing demand for compact display solutions. Japanese manufacturers are developing optical waveguide technologies for smart glasses, automotive displays, medical visualization systems, and industrial inspection devices. The growing integration of AR platforms with robotics, healthcare equipment, and connected manufacturing infrastructure is further driving market growth.
China Optical Waveguide Display Market Insight
The China optical waveguide display market accounted for the largest market revenue share in Asia-Pacific in 2025, attributed to strong consumer electronics production, expanding investment in AR smart glasses, and rapid development of domestic display and semiconductor manufacturing capabilities. China is increasingly deploying optical waveguide display technologies across consumer wearables, industrial AR devices, automotive head-up displays, and smart manufacturing systems. Government support for digital infrastructure, combined with the availability of cost-effective optical components and a large technology-focused consumer base, is significantly propelling market expansion.
Optical Waveguide Display Market Share
The Optical Waveguide Display industry is primarily led by well-established companies, including:
• Waveguide Optical Technologies (U.S.)
• HFCL Limited (India)
• LEONI AG (Germany)
• Fujikura Ltd. (Japan)
• Corning Incorporated (U.S.)
• Sterlite Technologies Limited (India)
• Furukawa Electric Co., Ltd. (Japan)
• Prysmian Group (Italy)
• Finisar Corporation (U.S.)
• Sumitomo Electric Industries, Ltd. (Japan)
• Lumentum Holdings Inc. (U.S.)
• Coherent Corp. (U.S.)
• II-VI Incorporated (U.S.)
• NKT A/S (Denmark)
• OFS Fitel, LLC (U.S.)
SKU-

- Interactive Data Analysis Dashboard
- Company Analysis Dashboard for high growth potential opportunities
- Research Analyst Access for customization & queries
- Competitor Analysis with Interactive dashboard
- Latest News, Updates & Trend analysis
- Harness the Power of Benchmark Analysis for Comprehensive Competitor Tracking
Global Optical Waveguide Display Market, Supply Chain Analysis and Ecosystem Framework
To support market growth and help clients navigate the impact of geopolitical shifts, DBMR has integrated in-depth supply chain analysis into its Global Optical Waveguide Display Market research reports. This addition empowers clients to respond effectively to global changes affecting their industries. The supply chain analysis section includes detailed insights such as Global Optical Waveguide Display Market consumption and production by country, price trend analysis, the impact of tariffs and geopolitical developments, and import and export trends by country and HSN code. It also highlights major suppliers with data on production capacity and company profiles, as well as key importers and exporters. In addition to research, DBMR offers specialized supply chain consulting services backed by over a decade of experience, providing solutions like supplier discovery, supplier risk assessment, price trend analysis, impact evaluation of inflation and trade route changes, and comprehensive market trend analysis.
Data collection and base year analysis are done using data collection modules with large sample sizes. The stage includes obtaining market information or related data through various sources and strategies. It includes examining and planning all the data acquired from the past in advance. It likewise envelops the examination of information inconsistencies seen across different information sources. The market data is analysed and estimated using market statistical and coherent models. Also, market share analysis and key trend analysis are the major success factors in the market report. To know more, please request an analyst call or drop down your inquiry.
The key research methodology used by DBMR research team is data triangulation which involves data mining, analysis of the impact of data variables on the market and primary (industry expert) validation. Data models include Vendor Positioning Grid, Market Time Line Analysis, Market Overview and Guide, Company Positioning Grid, Patent Analysis, Pricing Analysis, Company Market Share Analysis, Standards of Measurement, Global versus Regional and Vendor Share Analysis. To know more about the research methodology, drop in an inquiry to speak to our industry experts.
Data Bridge Market Research is a leader in advanced formative research. We take pride in servicing our existing and new customers with data and analysis that match and suits their goal. The report can be customized to include price trend analysis of target brands understanding the market for additional countries (ask for the list of countries), clinical trial results data, literature review, refurbished market and product base analysis. Market analysis of target competitors can be analyzed from technology-based analysis to market portfolio strategies. We can add as many competitors that you require data about in the format and data style you are looking for. Our team of analysts can also provide you data in crude raw excel files pivot tables (Fact book) or can assist you in creating presentations from the data sets available in the report.


