
Global Pallet Displays Market
Market Size in USD Billion
 USD
6.21 Billion
USD
8.99 Billion
2024
2032
USD
6.21 Billion
USD
8.99 Billion
2024
2032
| 2025 - 2032 | |
| USD 6.21 Billion | |
| USD 8.99 Billion | |
| % | |
|
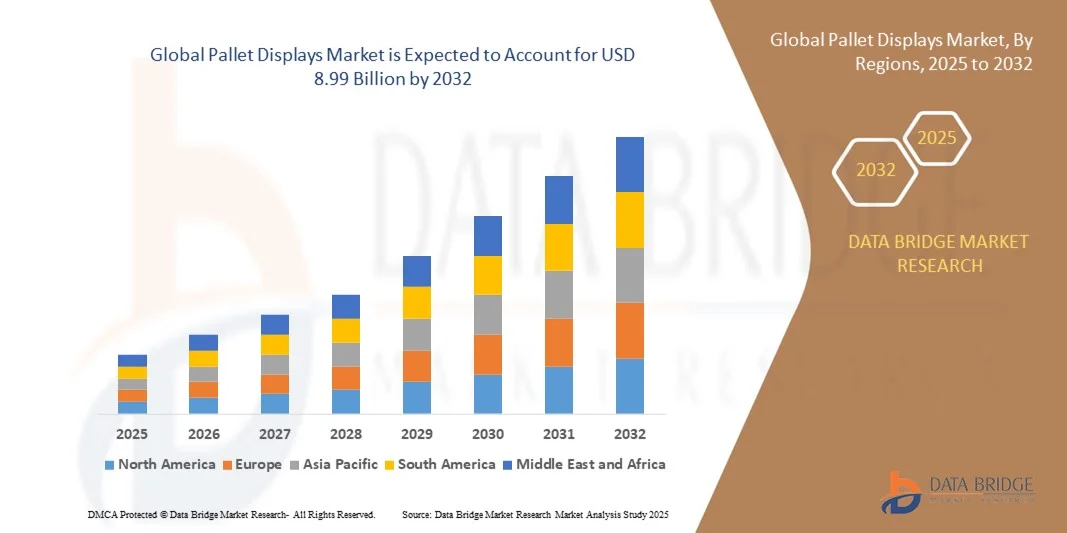
Pallet Displays Market Size
- The global pallet displays market size was valued at USD 6.21 billion in 2024 and is expected to reach USD 8.99 billion by 2032, at a CAGR of 2.93% during the forecast period
- The market growth is largely fuelled by the increasing adoption of pallet displays in retail and supermarkets to enhance product visibility and drive impulse purchases
- Rising demand for cost-effective and flexible merchandising solutions is encouraging manufacturers and retailers to invest in durable and customizable pallet displays
Pallet Displays Market Analysis
- The retail sector continues to drive demand for pallet displays as they offer high product visibility, easy access for consumers, and efficient space utilization in stores
- Growth in e-commerce and omnichannel retail strategies is prompting the development of innovative pallet display solutions that cater to both in-store and online fulfillment requirements
- North America dominated the pallet displays market with the largest revenue share of 38.5% in 2024, driven by the expansion of organized retail chains, supermarkets, and hypermarkets, as well as the growing focus on in-store marketing and visual merchandising
- Asia-Pacific region is expected to witness the highest growth rate in the global pallet displays market, driven by rising retail penetration, growing e-commerce and omnichannel strategies, and increasing investments in advanced and sustainable pallet display solutions
- The Full Pallet Display segment held the largest market revenue share in 2024, driven by its high visibility, larger display capacity, and suitability for promotional campaigns. Full pallet displays are widely used for bulk product placement in supermarkets and hypermarkets, providing ease of stocking and improved in-store branding
Report Scope and Pallet Displays Market Segmentation
|
Attributes |
Pallet Displays Key Market Insights |
|
Segments Covered |
|
|
Countries Covered |
North America
Europe
Asia-Pacific
Middle East and Africa
South America
|
|
Key Market Players |
|
|
Market Opportunities |
|
|
Value Added Data Infosets |
In addition to the insights on market scenarios such as market value, growth rate, segmentation, geographical coverage, and major players, the market reports curated by the Data Bridge Market Research also include import export analysis, production capacity overview, production consumption analysis, price trend analysis, climate change scenario, supply chain analysis, value chain analysis, raw material/consumables overview, vendor selection criteria, PESTLE Analysis, Porter Analysis, and regulatory framework. |
Pallet Displays Market Trends
Growing Adoption of Efficient In-Store Merchandising Solutions
- The increasing use of pallet displays is transforming retail merchandising by enhancing product visibility and promoting impulse purchases. Modular and ready-to-use displays allow retailers to quickly set up promotional campaigns, optimizing store layouts and improving sales
- Rising demand for flexible, durable, and visually appealing pallet solutions is accelerating the adoption of custom-designed displays, particularly in supermarkets, hypermarkets, and convenience stores. These displays support brand recognition and marketing effectiveness
- The shift toward eco-friendly and recyclable materials in pallet displays is gaining traction, as retailers and consumers increasingly prioritize sustainability. Manufacturers are developing lightweight, reusable, and biodegradable options to meet market expectations.
- For instance, in 2023, a leading European retail chain introduced recyclable cardboard pallet displays for seasonal promotions, reducing environmental impact while improving in-store product presentation
- While pallet displays are enhancing in-store sales and operational efficiency, their effectiveness depends on innovation, design customization, and material quality. Market players must continue to develop versatile, cost-effective, and sustainable solutions to capitalize on growing demand
Pallet Displays Market Dynamics
Driver
Increasing Retail Expansion and Focus on Visual Merchandising
- The growth of organized retail chains and supermarkets is driving the demand for pallet displays as they offer high product visibility, easy access, and efficient space utilization. Displays help retailers manage inventory effectively while promoting high-margin products and seasonal items. Retailers increasingly rely on pallet displays to enhance customer experience and streamline in-store operations
- Retailers are investing in innovative designs and branded pallet solutions to attract consumers, enhance brand recall, and support promotional campaigns. This trend is particularly strong in FMCG, beverage, and packaged food sectors, where eye-catching displays can significantly boost sales. Custom graphics, color coding, and modular designs are being widely adopted to differentiate brands
- Expansion of e-commerce and omnichannel retail strategies is creating demand for pallet solutions that cater to both in-store presentation and fulfillment efficiency, bridging the gap between online and offline retail operations. Hybrid solutions, such as modular displays compatible with storage and shipping, are gaining traction. Retailers are also exploring digital integration with QR codes and interactive displays to engage consumers
- For instance, in 2022, several U.S.-based supermarkets adopted modular pallet displays for beverage promotions, improving product turnover and consumer engagement. These implementations helped reduce shelf restocking time and provided flexibility for seasonal or promotional campaigns. Such successes are motivating broader adoption across other FMCG categories
- While retail expansion and marketing strategies drive growth, stakeholders must address customization, durability, and sustainability to maximize the impact of pallet displays. Incorporating eco-friendly materials, lightweight designs, and reusable structures enhances ROI while meeting growing consumer demand for sustainable packaging
Restraint/Challenge
High Manufacturing Costs and Logistical Constraints
- The high production cost of durable and customizable pallet displays limits adoption among small retailers and cost-sensitive markets. Premium materials, specialized designs, and branded solutions increase upfront investment requirements, making it difficult for smaller chains to compete. Cost pressures also affect the frequency of updating or rotating displays
- Transportation and storage of pallet displays can be challenging due to their size, weight, and handling requirements. Improper logistics may result in damage, increased operational costs, and inefficiencies in store deployment. Bulk shipping, limited storage space, and special handling requirements add further complexity to supply chain management
- Market penetration is also restricted in regions with underdeveloped retail infrastructure or limited technical knowledge, where standardized or low-cost shelving solutions are preferred over branded displays. Retailers in such regions may lack the expertise to assemble or optimize pallet display layouts, reducing overall effectiveness
- For instance, in 2023, several retailers in Sub-Saharan Africa reported difficulties in sourcing and deploying quality pallet displays due to high costs and logistical challenges, affecting product visibility and sales. The challenges included long lead times, inconsistent supply, and damage during transit. These factors have limited growth despite rising retail expansion
- While innovative and sustainable pallet displays are evolving, addressing cost, transportation, and deployment issues remains essential for widespread adoption and long-term market growth. Manufacturers are focusing on modular, foldable, and lightweight designs to reduce expenses, improve portability, and enhance retailer flexibility
Pallet Displays Market Scope
The market is segmented on the basis of product type, material type, application, and end-use industry.
- By Product Type
On the basis of product type, the pallet displays market is segmented into Full Pallet Display, Half Pallet Display, and Quarter Pallet Display. The Full Pallet Display segment held the largest market revenue share in 2024, driven by its high visibility, larger display capacity, and suitability for promotional campaigns. Full pallet displays are widely used for bulk product placement in supermarkets and hypermarkets, providing ease of stocking and improved in-store branding.
The Half Pallet Display segment is expected to witness the fastest growth rate from 2025 to 2032, driven by its compact size, flexibility, and cost-effectiveness, making it ideal for medium-sized retail outlets and promotional displays. These displays are particularly popular for seasonal or limited-time product promotions and for stores with space constraints.
- By Material Type
On the basis of material type, the market is segmented into Plastic, Paper and Paperboard, Foam Board, Metal, Glass, and Others. Paper and Paperboard displays held the largest share in 2024 due to their lightweight, recyclable nature, and ease of customization for branding purposes.
Plastic-based pallet displays is expected to witness the fastest growth rate from 2025 to 2032 owing to their durability, reusability, and suitability for heavy products or outdoor retail environments. Manufacturers are increasingly investing in innovative, eco-friendly plastics to reduce environmental impact while maintaining display quality.
- By Application
On the basis of application, the market is segmented into Food and Beverages, Cosmetics and Personal Care, Pharmaceuticals, Printing and Stationery, Electronics, Automotive, and Others. The Food and Beverages segment held the largest market share in 2024, driven by high product turnover, frequent promotions, and the need for in-store visibility.
The Cosmetics and Personal Care segment is expected to witness the fastest growth rate from 2025 to 2032 during the forecast period, supported by increased promotional activities, rising disposable income, and a growing preference for attractive in-store displays to enhance brand recognition.
- By End Use Industry
On the basis of end-use industry, the market is segmented into Supermarkets, Departmental Stores, Hypermarkets, Specialty Stores, Convenience Stores, Retail Stores, Institutional Sales, and Others. Supermarkets held the largest revenue share in 2024 due to their high traffic, diverse product offerings, and reliance on pallet displays for in-store promotions.
Convenience stores is expected to witness the fastest growth rate from 2025 to 2032, driven by their increasing numbers in urban areas, smaller retail spaces, and the demand for compact and visually appealing displays that optimize limited shelf space.
Pallet Displays Market Regional Analysis
- North America dominated the pallet displays market with the largest revenue share of 38.5% in 2024, driven by the expansion of organized retail chains, supermarkets, and hypermarkets, as well as the growing focus on in-store marketing and visual merchandising
- Retailers in the region highly value pallet displays for their ability to improve product visibility, enhance brand promotion, and optimize shelf and floor space
- The widespread adoption is further supported by high consumer spending, technologically advanced retail infrastructure, and the growing preference for ready-to-use promotional solutions, establishing pallet displays as a preferred merchandising tool in supermarkets and retail outlets
U.S. Pallet Displays Market Insight
The U.S. pallet displays market captured the largest revenue share in North America in 2024, fueled by rapid retail expansion and the growing importance of visual merchandising. Retailers are increasingly leveraging pallet displays to boost sales of high-margin products and promotional items. The integration of modular and customizable display solutions, combined with omni-channel retail strategies, further propels market growth. Moreover, the adoption of eco-friendly and sustainable materials is driving product differentiation and consumer preference in the U.S. market.
Europe Pallet Displays Market Insight
The Europe pallet displays market is expected to witness the fastest growth rate from 2025 to 2032, primarily driven by the growth of retail chains, supermarkets, and hypermarkets, alongside increasing focus on consumer experience and product presentation. Urbanization and rising disposable income are encouraging retailers to adopt innovative display solutions. The region is witnessing strong growth in branded and seasonal displays across food and beverage, cosmetics, and personal care sectors.
U.K. Pallet Displays Market Insight
The U.K. pallet displays market is expected to witness the fastest growth rate from 2025 to 2032, driven by the increasing adoption of visually appealing in-store promotional solutions and rising demand from organized retail channels. Retailers are prioritizing high-impact pallet displays to improve product visibility, brand awareness, and impulse buying. The U.K.’s robust retail infrastructure and online-to-offline retail strategies are further supporting market expansion.
Germany Pallet Displays Market Insight
The Germany pallet displays market is expected to witness the fastest growth rate from 2025 to 2032, fueled by rising retail automation, adoption of sustainable display materials, and increasing awareness of brand merchandising. German retailers are emphasizing eco-friendly, reusable, and modular display solutions to meet environmental regulations and enhance shopper engagement. Integration with seasonal promotions and product launches is boosting demand in the food, beverage, and personal care segments.
Asia-Pacific Pallet Displays Market Insight
The Asia-Pacific pallet displays market is expected to witness the fastest growth rate from 2025 to 2032, driven by rapid urbanization, rising retail penetration, and increasing consumer spending in countries such as China, Japan, and India. The region’s growing organized retail sector, coupled with rising e-commerce fulfillment requirements, is boosting demand for pallet display solutions. Furthermore, APAC is emerging as a manufacturing hub for pallet display components, which is improving affordability and availability for retailers across both emerging and developed markets.
Japan Pallet Displays Market Insight
The Japan pallet displays market is expected to witness the fastest growth rate from 2025 to 2032, due to the country’s high retail density, emphasis on customer experience, and focus on store aesthetics. Retailers are adopting compact, modular, and visually appealing pallet displays to optimize limited floor space and enhance product visibility. Seasonal campaigns, promotional launches, and integration with other in-store marketing tools are further driving adoption in the Japanese market.
China Pallet Displays Market Insight
The China pallet displays market accounted for the largest revenue share in Asia-Pacific in 2024, attributed to the rapid expansion of supermarkets, hypermarkets, and modern retail formats. The demand is further fueled by growing consumer awareness, increasing brand promotions, and the adoption of cost-effective, modular, and eco-friendly display solutions. The development of domestic manufacturing capabilities and organized retail expansion is supporting large-scale adoption across food, beverage, and consumer goods sectors.
Pallet Displays Market Share
The Pallet Displays industry is primarily led by well-established companies, including:
- Smurfit Kappa (U.K.)
- Liquibox (U.S.)
- DS Smith (U.K.)
- Amcor plc (U.K.)
- Sonoco Products Company (U.S.)
- WestRock Company (U.S.)
- Proactive Packaging (U.S.)
- Procorrdisplay (U.S.)
- Ardent Displays (U.S.)
- BPKC (U.S.)
- Siffron, Inc. (U.S.)
- U.S. Display Group (U.S.)
- Marketing Alliance Group – MAG (U.S.)
- Pratt Industries, Inc. (U.S.)
- Sterling Contract Packaging, Inc. (U.S.)
- C&B Display Packaging Inc. (U.S.)
- STI - Gustav Stabernack GmbH (U.K.)
- GPA Global (U.S.)
- Gissler & Pass GmbH (U.K.)
- CHEP (U.S.)
Latest Developments in Global Pallet Displays Market
- In April 2024, International Paper Company announced an acquisition agreement with DS Smith, aimed at strengthening its global packaging portfolio. This strategic move is expected to enhance production capabilities, expand market reach, and create synergies across supply chains, reinforcing the company’s competitive position in the global packaging industry
- In May 2024, Sonoco Products Company unveiled a new state-of-the-art center at 2850 Charter Street, Columbus, Ohio, to expand its sustainable metal packaging operations. The facility will centralize production, improve operational efficiency, and support customer demands, while promoting eco-friendly packaging solutions, thereby strengthening the company’s market presence in sustainable packaging
- In May 2023, Smurfit Kappa completed a major investment project in Poland to significantly expand its Pruszków corrugated plant. This expansion is designed to increase production capacity, improve supply chain efficiency, and cater to growing demand in the European market, positively impacting both operational capabilities and market competitiveness
SKU-

- Interactive Data Analysis Dashboard
- Company Analysis Dashboard for high growth potential opportunities
- Research Analyst Access for customization & queries
- Competitor Analysis with Interactive dashboard
- Latest News, Updates & Trend analysis
- Harness the Power of Benchmark Analysis for Comprehensive Competitor Tracking
Table of Content
1 INTRODUCTION
1.1 OBJECTIVES OF THE STUDY
1.2 MARKET DEFINITION
1.3 OVERVIEW OF GLOBAL PALLET DISPLAYS MARKET
1.4 CURRENCY AND PRICING
1.5 LIMITATION
1.6 MARKETS COVERED
2 MARKET SEGMENTATION
2.1 KEY TAKEAWAYS
2.2 ARRIVING AT THE GLOBAL PALLET DISPLAYS MARKET SIZE
2.3 VENDOR POSITIONING GRID
2.4 MARKETS COVERED
2.5 GEOGRAPHIC SCOPE
2.6 YEARS CONSIDERED FOR THE STUDY
2.7 RESEARCH METHODOLOGY
2.8 TECHNOLOGY LIFE LINE CURVE
2.9 MULTIVARIATE MODELLING
2.1 PRIMARY INTERVIEWS WITH KEY OPINION LEADERS
2.11 DBMR MARKET POSITION GRID
2.12 MARKET APPLICATION COVERAGE GRID
2.13 DBMR MARKET CHALLENGE MATRIX
2.14 IMPORT AND EXPORT DATA
2.15 SECONDARY SOURCES
2.16 GLOBAL PALLET DISPLAYS MARKET: RESEARCH SNAPSHOT
2.17 ASSUMPTIONS
3 MARKET OVERVIEW
3.1 DRIVERS
3.2 RESTRAINTS
3.3 OPPORTUNITIES
3.4 CHALLENGES
4 EXECUTIVE SUMMARY
5 PREMIUM INSIGHTS
5.1 RAW MATERIAL COVERAGE
5.2 PRODUCTION CONSUMPTION ANALYSIS
5.3 IMPORT EXPORT SCENARIO
5.4 TECHNOLOGICAL ADVANCEMENT BY MANUFACTURERS
5.5 PORTER’S FIVE FORCES
5.6 VENDOR SELECTION CRITERIA
5.7 PESTEL ANALYSIS
5.8 REGULATION COVERAGE
5.8.1 PRODUCT CODES
5.8.2 CERTIFIED STANDARDS
5.8.3 SAFETY STANDARDS
5.8.3.1. MATERIAL HANDLING & STORAGE
5.8.3.2. TRANSPORT & PRECAUTIONS
5.8.3.3. HARAD IDENTIFICATION
6 PRICE INDEX
7 PRODUCTION CAPACITY OVERVIEW
8 SUPPLY CHAIN ANALYSIS
8.1 OVERVIEW
8.2 LOGISTIC COST SCENARIO
8.3 IMPORTANCE OF LOGISTICS SERVICE PROVIDERS
9 CLIMATE CHANGE SCENARIO
9.1 ENVIRONMENTAL CONCERNS
9.2 INDUSTRY RESPONSE
9.3 GOVERNMENT’S ROLE
9.4 ANALYST RECOMMENDATIONS
10 INDUSTRY INSIGHTS
11 GLOBAL PALLET DISPLAYS MARKET, BY PRODUCT TYPE, (2021-2030), (USD MILLION)
11.1 OVERVIEW
11.2 FULL PALLET DISPLAY
11.3 HALF PALLET DISPLAY
11.4 QUARTER PALLET DISPLAY
12 GLOBAL PALLET DISPLAYS MARKET, BY MATERIAL TYPE, (2021-2030), (USD MILLION)
12.1 OVERVIEW
12.2 PLASTIC
12.3 PAPER AND PAPERBOARD
12.4 FOAM BOARD
12.5 METAL
12.6 GLASS
12.7 OTHERS
13 GLOBAL PALLET DISPLAYS MARKET, BY APPLICATION, (2021-2030), (USD MILLION)
13.1 OVERVIEW
13.2 FOOD AND BEVERAGES
13.2.1 FOOD & BEVERAGES, BY PRODUCT TYPE
13.2.1.1. FULL PALLET DISPLAY
13.2.1.2. HALF PALLET DISPLAY
13.2.1.3. QUARTER PALLET DISPLAY
13.2.2 FOOD & BEVERAGES, BY MATERIAL TYPE
13.2.2.1. FULL PALLET DISPLAY
13.2.2.2. PLASTIC
13.2.2.3. PAPER AND PAPERBOARD
13.2.2.4. FOAM BOARD
13.2.2.5. METAL
13.2.2.6. GLASS
13.2.2.7. OTHERS
13.3 COSMETICS AND PERSONAL CARE
13.3.1 COSMETICS AND PERSONAL CARE, BY PRODUCT TYPE
13.3.1.1. FULL PALLET DISPLAY
13.3.1.2. HALF PALLET DISPLAY
13.3.1.3. QUARTER PALLET DISPLAY
13.3.2 COSMETICS AND PERSONAL CARE, BY MATERIAL TYPE
13.3.2.1. FULL PALLET DISPLAY
13.3.2.2. PLASTIC
13.3.2.3. PAPER AND PAPERBOARD
13.3.2.4. FOAM BOARD
13.3.2.5. METAL
13.3.2.6. GLASS
13.3.2.7. OTHERS
13.4 PHARMACEUTICALS
13.4.1 PHARMACEUTICALS, BY PRODUCT TYPE
13.4.1.1. FULL PALLET DISPLAY
13.4.1.2. HALF PALLET DISPLAY
13.4.1.3. QUARTER PALLET DISPLAY
13.4.2 PHARMACEUTICALS, BY MATERIAL TYPE
13.4.2.1. FULL PALLET DISPLAY
13.4.2.2. PLASTIC
13.4.2.3. PAPER AND PAPERBOARD
13.4.2.4. FOAM BOARD
13.4.2.5. METAL
13.4.2.6. GLASS
13.4.2.7. OTHERS
13.5 PRINTING AND STATIONERY
13.5.1 PRINTING AND STATIONARY, BY PRODUCT TYPE
13.5.1.1. FULL PALLET DISPLAY
13.5.1.2. HALF PALLET DISPLAY
13.5.1.3. QUARTER PALLET DISPLAY
13.5.2 PRINTING AND STATIONARY, BY MATERIAL TYPE
13.5.2.1. FULL PALLET DISPLAY
13.5.2.2. PLASTIC
13.5.2.3. PAPER AND PAPERBOARD
13.5.2.4. FOAM BOARD
13.5.2.5. METAL
13.5.2.6. GLASS
13.5.2.7. OTHERS
13.6 ELECTRONICS
13.6.1 ELECTRONICS, BY PRODUCT TYPE
13.6.1.1. FULL PALLET DISPLAY
13.6.1.2. HALF PALLET DISPLAY
13.6.1.3. QUARTER PALLET DISPLAY
13.6.2 ELECTRONICS, BY MATERIAL TYPE
13.6.2.1. FULL PALLET DISPLAY
13.6.2.2. PLASTIC
13.6.2.3. PAPER AND PAPERBOARD
13.6.2.4. FOAM BOARD
13.6.2.5. METAL
13.6.2.6. GLASS
13.6.2.7. OTHERS
13.7 AUTOMOTIVE
13.7.1 AUTOMOTIVE, BY PRODUCT TYPE
13.7.1.1. FULL PALLET DISPLAY
13.7.1.2. HALF PALLET DISPLAY
13.7.1.3. QUARTER PALLET DISPLAY
13.7.2 AUTOMOTIVE, BY MATERIAL TYPE
13.7.2.1. FULL PALLET DISPLAY
13.7.2.2. PLASTIC
13.7.2.3. PAPER AND PAPERBOARD
13.7.2.4. FOAM BOARD
13.7.2.5. METAL
13.7.2.6. GLASS
13.7.2.7. OTHERS
13.8 OTHERS
13.8.1 OTHERS, BY PRODUCT TYPE
13.8.1.1. FULL PALLET DISPLAY
13.8.1.2. HALF PALLET DISPLAY
13.8.1.3. QUARTER PALLET DISPLAY
13.8.2 OTHERS, BY MATERIAL TYPE
13.8.2.1. FULL PALLET DISPLAY
13.8.2.2. PLASTIC
13.8.2.3. PAPER AND PAPERBOARD
13.8.2.4. FOAM BOARD
13.8.2.5. METAL
13.8.2.6. GLASS
13.8.2.7. OTHERS
14 GLOBAL PALLET DISPLAYS MARKET, BY END USE, (2021-2030), (USD MILLION)
14.1 OVERVIEW
14.2 SUPERMARKETS
14.3 DEPARTMENTAL STORES
14.4 HYPERMARKETS
14.5 SPECIALTY STORES
14.6 CONVENIENCE STORES
14.7 RETAIL STORES
14.8 INSTITUTIONAL SALES
14.9 OTHERS
15 GLOBAL PALLET DISPLAYS MARKET, BY GEOGRAPHY
GLOBAL PALLET DISPLAYS MARKET, (ALL SEGMENTATION PROVIDED ABOVE IS REPRESENTED IN THIS CHAPTER BY COUNTRY)
15.1 NORTH AMERICA
15.1.1 U.S.
15.1.2 CANADA
15.1.3 MEXICO
15.2 EUROPE
15.2.1 GERMANY
15.2.2 U.K.
15.2.3 ITALY
15.2.4 FRANCE
15.2.5 SPAIN
15.2.6 SWITZERLAND
15.2.7 RUSSIA
15.2.8 TURKEY
15.2.9 BELGIUM
15.2.10 NETHERLANDS
15.2.11 REST OF EUROPE
15.3 ASIA-PACIFIC
15.3.1 JAPAN
15.3.2 CHINA
15.3.3 SOUTH KOREA
15.3.4 INDIA
15.3.5 SINGAPORE
15.3.6 THAILAND
15.3.7 INDONESIA
15.3.8 MALAYSIA
15.3.9 PHILIPPINES
15.3.10 AUSTRALIA AND NEW ZEALAND
15.3.11 HONG KONG
15.3.12 TAIWAN
15.3.13 REST OF ASIA-PACIFIC
15.4 SOUTH AMERICA
15.4.1 BRAZIL
15.4.2 ARGENTINA
15.4.3 REST OF SOUTH AMERICA
15.5 MIDDLE EAST AND AFRICA
15.5.1 SOUTH AFRICA
15.5.2 EGYPT
15.5.3 SAUDI ARABIA
15.5.4 UNITED ARAB EMIRATES
15.5.5 ISRAEL
15.5.6 REST OF MIDDLE EAST AND AMERICA
16 GLOBAL PALLET DISPLAYS MARKET, COMPANY LANDSCAPE
16.1 COMPANY SHARE ANALYSIS: GLOBAL
16.2 COMPANY SHARE ANALYSIS: NORTH AMERICA
16.3 COMPANY SHARE ANALYSIS: EUROPE
16.4 COMPANY SHARE ANALYSIS: ASIA-PACIFIC
16.5 MERGERS & ACQUISITIONS
16.6 NEW PRODUCT DEVELOPMENT & APPROVALS
16.7 EXPANSIONS
16.8 REGULATORY CHANGES
16.9 PARTNERSHIP AND OTHER STRATEGIC DEVELOPMENTS
17 SWOT ANALYSIS AND DATA BRIDGE MARKET RESEARCH ANALYSIS
18 GLOBAL PALLET DISPLAYS MARKET - COMPANY PROFILE
18.1 SMURFIT KAPPA
18.1.1 COMPANY SNAPSHOT
18.1.2 PRODUCT PORTFOLIO
18.1.3 SWOT ANALYSIS
18.1.4 REVENUE ANALYSIS
18.1.5 RECENT UPDATES
18.2 PROAMPAC
18.2.1 COMPANY SNAPSHOT
18.2.2 PRODUCT PORTFOLIO
18.2.3 SWOT ANALYSIS
18.2.4 REVENUE ANALYSIS
18.2.5 RECENT UPDATES
18.3 AMCOR PLC
18.3.1 COMPANY SNAPSHOT
18.3.2 PRODUCT PORTFOLIO
18.3.3 SWOT ANALYSIS
18.3.4 REVENUE ANALYSIS
18.3.5 RECENT UPDATES
18.4 GOGLIO SPA
18.4.1 COMPANY SNAPSHOT
18.4.2 PRODUCT PORTFOLIO
18.4.3 SWOT ANALYSIS
18.4.4 REVENUE ANALYSIS
18.4.5 RECENT UPDATES
18.5 AR PACKAGING
18.5.1 COMPANY SNAPSHOT
18.5.2 PRODUCT PORTFOLIO
18.5.3 SWOT ANALYSIS
18.5.4 REVENUE ANALYSIS
18.5.5 RECENT UPDATES
18.6 CONSTANTIA FLEXIBLES
18.6.1 COMPANY SNAPSHOT
18.6.2 PRODUCT PORTFOLIO
18.6.3 SWOT ANALYSIS
18.6.4 REVENUE ANALYSIS
18.6.5 RECENT UPDATES
18.7 ALTANA
18.7.1 COMPANY SNAPSHOT
18.7.2 PRODUCT PORTFOLIO
18.7.3 SWOT ANALYSIS
18.7.4 REVENUE ANALYSIS
18.7.5 RECENT UPDATES
18.8 SONOCO PRODUCTS COMPANY
18.8.1 COMPANY SNAPSHOT
18.8.2 PRODUCT PORTFOLIO
18.8.3 SWOT ANALYSIS
18.8.4 REVENUE ANALYSIS
18.8.5 RECENT UPDATES
18.9 MONDI
18.9.1 COMPANY SNAPSHOT
18.9.2 PRODUCT PORTFOLIO
18.9.3 SWOT ANALYSIS
18.9.4 REVENUE ANALYSIS
18.9.5 RECENT UPDATES
18.1 COVERIS
18.10.1 COMPANY SNAPSHOT
18.10.2 PRODUCT PORTFOLIO
18.10.3 SWOT ANALYSIS
18.10.4 REVENUE ANALYSIS
18.10.5 RECENT UPDATES
18.11 SEALED AIR
18.11.1 COMPANY SNAPSHOT
18.11.2 PRODUCT PORTFOLIO
18.11.3 SWOT ANALYSIS
18.11.4 REVENUE ANALYSIS
18.11.5 RECENT UPDATES
18.12 WIPAK GROUP
18.12.1 COMPANY SNAPSHOT
18.12.2 PRODUCT PORTFOLIO
18.12.3 SWOT ANALYSIS
18.12.4 REVENUE ANALYSIS
18.12.5 RECENT UPDATES
18.13 BISCHOF + KLEIN SE & CO. KG.
18.13.1 COMPANY SNAPSHOT
18.13.2 PRODUCT PORTFOLIO
18.13.3 SWOT ANALYSIS
18.13.4 REVENUE ANALYSIS
18.13.5 RECENT UPDATES
18.14 SCHUR FLEXIBLES
18.14.1 COMPANY SNAPSHOT
18.14.2 PRODUCT PORTFOLIO
18.14.3 SWOT ANALYSIS
18.14.4 REVENUE ANALYSIS
18.14.5 RECENT UPDATES
18.15 BERRY GLOBAL INC.
18.15.1 COMPANY SNAPSHOT
18.15.2 PRODUCT PORTFOLIO
18.15.3 SWOT ANALYSIS
18.15.4 REVENUE ANALYSIS
18.15.5 RECENT UPDATES
18.16 CELLPACK AG PACKAGING
18.16.1 COMPANY SNAPSHOT
18.16.2 PRODUCT PORTFOLIO
18.16.3 SWOT ANALYSIS
18.16.4 REVENUE ANALYSIS
18.16.5 RECENT UPDATES
18.17 SÜDPACK
18.17.1 COMPANY SNAPSHOT
18.17.2 PRODUCT PORTFOLIO
18.17.3 SWOT ANALYSIS
18.17.4 REVENUE ANALYSIS
18.17.5 RECENT UPDATES
18.18 CLONDALKIN GROUP
18.18.1 COMPANY SNAPSHOT
18.18.2 PRODUCT PORTFOLIO
18.18.3 SWOT ANALYSIS
18.18.4 REVENUE ANALYSIS
18.18.5 RECENT UPDATES
18.19 WESTROCK COMPANY
18.19.1 COMPANY SNAPSHOT
18.19.2 PRODUCT PORTFOLIO
18.19.3 SWOT ANALYSIS
18.19.4 REVENUE ANALYSIS
18.19.5 RECENT UPDATES
18.2 LIQUIBOX
18.20.1 COMPANY SNAPSHOT
18.20.2 PRODUCT PORTFOLIO
18.20.3 SWOT ANALYSIS
18.20.4 REVENUE ANALYSIS
18.20.5 RECENT UPDATES
18.21 DS SMITH
18.21.1 COMPANY SNAPSHOT
18.21.2 PRODUCT PORTFOLIO
18.21.3 SWOT ANALYSIS
18.21.4 REVENUE ANALYSIS
18.21.5 RECENT UPDATES
18.22 PROACTIVE PACKAGING
18.22.1 COMPANY SNAPSHOT
18.22.2 PRODUCT PORTFOLIO
18.22.3 SWOT ANALYSIS
18.22.4 REVENUE ANALYSIS
18.22.5 RECENT UPDATES
18.23 PROCORRDISPLAY
18.23.1 COMPANY SNAPSHOT
18.23.2 PRODUCT PORTFOLIO
18.23.3 SWOT ANALYSIS
18.23.4 REVENUE ANALYSIS
18.23.5 RECENT UPDATES
18.24 ARDENT DISPLAYS
18.24.1 COMPANY SNAPSHOT
18.24.2 PRODUCT PORTFOLIO
18.24.3 SWOT ANALYSIS
18.24.4 REVENUE ANALYSIS
18.24.5 RECENT UPDATES
18.25 BPKC
18.25.1 COMPANY SNAPSHOT
18.25.2 PRODUCT PORTFOLIO
18.25.3 SWOT ANALYSIS
18.25.4 REVENUE ANALYSIS
18.25.5 RECENT UPDATES
18.26 SIFFRON, INC.
18.26.1 COMPANY SNAPSHOT
18.26.2 PRODUCT PORTFOLIO
18.26.3 SWOT ANALYSIS
18.26.4 REVENUE ANALYSIS
18.26.5 RECENT UPDATES
18.27 U.S. DISPLAY GROUP
18.27.1 COMPANY SNAPSHOT
18.27.2 PRODUCT PORTFOLIO
18.27.3 SWOT ANALYSIS
18.27.4 REVENUE ANALYSIS
18.27.5 RECENT UPDATES
18.28 MARKETING ALLIANCE GROUP – MAG
18.28.1 COMPANY SNAPSHOT
18.28.2 PRODUCT PORTFOLIO
18.28.3 SWOT ANALYSIS
18.28.4 REVENUE ANALYSIS
18.28.5 RECENT UPDATES
18.29 PRATT INDUSTRIES, INC.
18.29.1 COMPANY SNAPSHOT
18.29.2 PRODUCT PORTFOLIO
18.29.3 SWOT ANALYSIS
18.29.4 REVENUE ANALYSIS
18.29.5 RECENT UPDATES
18.3 STERLING CONTRACT PACKAGING, INC
18.30.1 COMPANY SNAPSHOT
18.30.2 PRODUCT PORTFOLIO
18.30.3 SWOT ANALYSIS
18.30.4 REVENUE ANALYSIS
18.30.5 RECENT UPDATES
18.31 C&B DISPLAY PACKAGING INC.
18.31.1 COMPANY SNAPSHOT
18.31.2 PRODUCT PORTFOLIO
18.31.3 SWOT ANALYSIS
18.31.4 REVENUE ANALYSIS
18.31.5 RECENT UPDATES
18.32 STI - GUSTAV STABERNACK GMBH
18.32.1 COMPANY SNAPSHOT
18.32.2 PRODUCT PORTFOLIO
18.32.3 SWOT ANALYSIS
18.32.4 REVENUE ANALYSIS
18.32.5 RECENT UPDATES
18.33 GPA GLOBAL
18.33.1 COMPANY SNAPSHOT
18.33.2 PRODUCT PORTFOLIO
18.33.3 SWOT ANALYSIS
18.33.4 REVENUE ANALYSIS
18.33.5 RECENT UPDATES
18.34 GISSLER & PASS GMBH
18.34.1 COMPANY SNAPSHOT
18.34.2 PRODUCT PORTFOLIO
18.34.3 SWOT ANALYSIS
18.34.4 REVENUE ANALYSIS
18.34.5 RECENT UPDATES
18.35 CHEP
18.35.1 COMPANY SNAPSHOT
18.35.2 PRODUCT PORTFOLIO
18.35.3 SWOT ANALYSIS
18.35.4 REVENUE ANALYSIS
18.35.5 RECENT UPDATES
19 QUESTIONNAIRE
20 CONCLUSION
21 RELATED REPORTS
22 ABOUT DATA BRIDGE MARKET RESEARCH
Global Pallet Displays Market, Supply Chain Analysis and Ecosystem Framework
To support market growth and help clients navigate the impact of geopolitical shifts, DBMR has integrated in-depth supply chain analysis into its Global Pallet Displays Market research reports. This addition empowers clients to respond effectively to global changes affecting their industries. The supply chain analysis section includes detailed insights such as Global Pallet Displays Market consumption and production by country, price trend analysis, the impact of tariffs and geopolitical developments, and import and export trends by country and HSN code. It also highlights major suppliers with data on production capacity and company profiles, as well as key importers and exporters. In addition to research, DBMR offers specialized supply chain consulting services backed by over a decade of experience, providing solutions like supplier discovery, supplier risk assessment, price trend analysis, impact evaluation of inflation and trade route changes, and comprehensive market trend analysis.
Data collection and base year analysis are done using data collection modules with large sample sizes. The stage includes obtaining market information or related data through various sources and strategies. It includes examining and planning all the data acquired from the past in advance. It likewise envelops the examination of information inconsistencies seen across different information sources. The market data is analysed and estimated using market statistical and coherent models. Also, market share analysis and key trend analysis are the major success factors in the market report. To know more, please request an analyst call or drop down your inquiry.
The key research methodology used by DBMR research team is data triangulation which involves data mining, analysis of the impact of data variables on the market and primary (industry expert) validation. Data models include Vendor Positioning Grid, Market Time Line Analysis, Market Overview and Guide, Company Positioning Grid, Patent Analysis, Pricing Analysis, Company Market Share Analysis, Standards of Measurement, Global versus Regional and Vendor Share Analysis. To know more about the research methodology, drop in an inquiry to speak to our industry experts.
Data Bridge Market Research is a leader in advanced formative research. We take pride in servicing our existing and new customers with data and analysis that match and suits their goal. The report can be customized to include price trend analysis of target brands understanding the market for additional countries (ask for the list of countries), clinical trial results data, literature review, refurbished market and product base analysis. Market analysis of target competitors can be analyzed from technology-based analysis to market portfolio strategies. We can add as many competitors that you require data about in the format and data style you are looking for. Our team of analysts can also provide you data in crude raw excel files pivot tables (Fact book) or can assist you in creating presentations from the data sets available in the report.


