
Global Paper Cup Market
Market Size in USD Billion
 USD
10.61 Billion
USD
13.55 Billion
2022
2030
USD
10.61 Billion
USD
13.55 Billion
2022
2030
| 2023 - 2030 | |
| USD 10.61 Billion | |
| USD 13.55 Billion | |
| % | |
|
Paper Cup Market Analysis and Size
The trend of utilizing environmentally friendly and biodegradable products is increasing as more people worldwide become conscious of environmental issues. Nowadays, it's common to see people prefer paper cups to ones made with plastic components. Businesses such as quick-service restaurants, cafeterias, and other catering service providers are using more paper cups as a result of this customer trend. In addition, the busy lifestyle of a significant portion of the global population is driving up demand for simple products, such as paper cups.
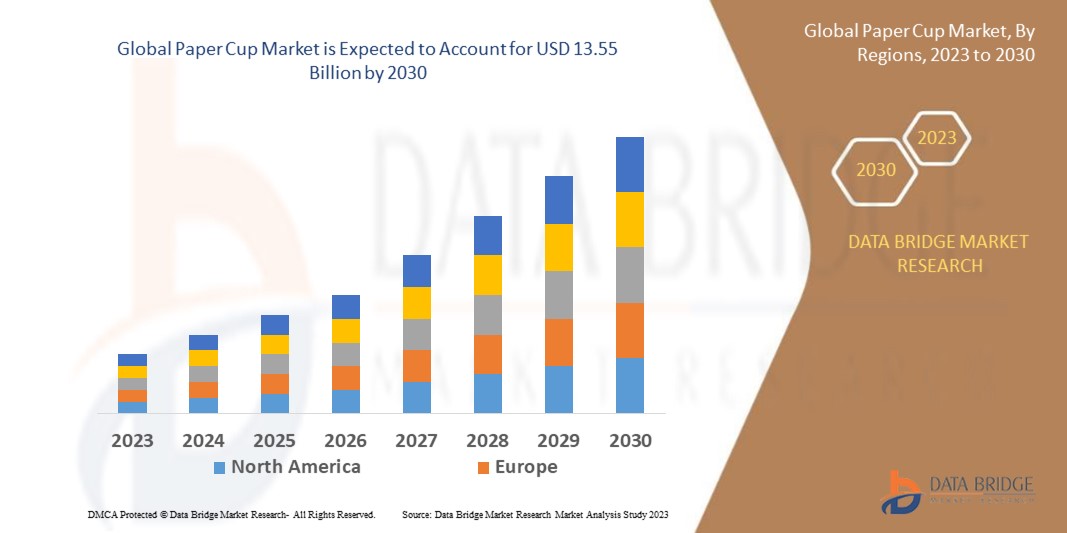
Data Bridge Market Research analyses that the paper cup market is expected to reach USD 13.55 billion by 2030, which is USD 10.61 billion in 2022, registering a CAGR of 3.10% during the forecast period of 2023 to 2030. In addition to the insights on market scenarios such as market value, growth rate, segmentation, geographical coverage, and major players, the market reports curated by the Data Bridge Market Research also include in-depth expert analysis, geographically represented company-wise production and capacity, network layouts of distributors and partners, detailed and updated price trend analysis and deficit analysis of supply chain and demand.
Paper Cup Market Scope and Segmentation
|
Report Metric |
Details |
|
Forecast Period |
2023 to 2030 |
|
Base Year |
2022 |
|
Historic Years |
2021 (Customizable to 2015 - 2020) |
|
Quantitative Units |
Revenue in USD Billion, Volumes in Units, Pricing in USD |
|
Segments Covered |
Cup Capacity (Up to 150 ml, 150 to 350 ml, 350 to 500 ml, and Above 500 ml), Cup Type (Cold Beverage Cup, Hot Beverage Cup), Wall Type (Single Wall Paper Cups, Double Wall Paper Cups, and Triple Wall Paper Cups), End-User (Coffee and Tea Shops, QSR and Other Fast Food Shops, Offices and Educational Institutions, Residential Use, and Others), Distribution Channel (Institutional Sales, Retail Sales) |
|
Countries Covered |
U.S., Canada, Mexico, Brazil, Argentina, Rest of South America, Germany, France, Italy, U.K., Belgium, Spain, Russia, Turkey, Netherlands, Switzerland, Rest of Europe, Japan, China, India, South Korea, Australia and New Zealand, Singapore, Malaysia, Thailand, Indonesia, Philippines, Rest of Asia-Pacific, United Arab Emirate, Saudi Arabia, Egypt, Israel, South Africa, Rest of Middle East and Africa |
|
Market Players Covered |
Huhtamaki (Finland), Konie Cups International, Inc (U.S.), Genpak, LLC (U.S.), Conver Pack, Inc (U.S.), Dart Container Corporation (U.S.), Georgia-Pacific (U.S.), F Bender limited (U.K.), Graphic Packaging International LLC (U.S.), Kap Cones Pvt. Ltd. (India), Grupo phoenix (U.S.), Jiangsu Xinyu Bio-Tech Co., Ltd. (China), Eco-Products Inc (U.S.), International Paper (U.S.), Detmold (Australia) |
|
Market Opportunities |
|
Market Definition
Paper cups, which can be used to sip soup, tea, coffee, soft drinks, and other foods, are disposable. The most popular plastic resin, polyethylene, is used to cover these cups, enhancing their performance and longevity by preventing the lowered moisture from absorbing and retaining taste. Customers typically utilize paper cups to save time and effort due to their hectic lifestyles and busy schedules. These cups do not require washing and can be immediately discarded after use. The growing trend of ready-to-eat food and services around the world has also had an impact on the demand for paper cups.
Paper Cup Market Dynamics
Drivers
- Increasing demand for on-the-go consumption of beverages
The global beverage business is expanding and becoming more dynamic in the global market and is projected to considerably influence the paper cup carrier market. To meet the growing demand for beverages to be consumed on-the-go in various regions, some well-known businesses are offering variety of paper cup carriers. Furthermore, the availability of ordering beverages for delivery to homes and takeout has become more popular. Similar to this, cup carriers that are both stylish and durable seem to be in high demand. Therefore, increasing demand for on-the-go consumption of beverages is anticipated to drive the market's growth rate.
- Stringent government policies about the usage of plastic packaging
Stringent government rules and policies regarding the usage of plastic packaging, growing paper recycling activities and availability of leading fast food chain will increase the consumption of paper cups all around the globe. According to the U.S. Environmental Protection Agency’s report, more than 292 million tons of municipal solid waste was produced in 2018. Approximately 69 million tons of total produced municipal solid waste was recycled and 25 million tons were composted. Moreover, increasing government initiatives towards reducing municipal solid waste such as banning plastic packaging in the food industry and increasing awareness about the importance of paper cups will boost the sales during the forecast period.
Opportunities
- Increasing awareness regarding negative effects of plastics
Increasing awareness regarding the negative effects of plastics on the environment among consumers plays a dynamic role in buying behaviour. Corn starch is the most commonly used alternative for plastic packaging among other. Moreover, prominent online food delivery systems are also substituting to corn starch packaging to promote an environment-friendly brand image. For instance, Shiva Food Packaging which is an Indian company, provides better quality Corn starch Clamshell Food Container, which is extensively used to serve food products on numerous occasions. This food Container is manufactured at its production facility by using corn starch raw material, which is environment-friendly in nature. The company also deliveries packaging products to all suppliers and wholesalers all around the globe in numerous sizes and shapes. It also claims to be an environment-friendly product that is 100% compostable and biodegradable. Thus, a potential opportunity for the market growth has opened up in the wake of current trends.
Restraints/ Challenges
- High cost and side effects associated paper cup
Some industrialists or manufacturers add a significant amount of fluorescent whitener to the cup to make it appear whiter. The ability of these whiting compounds to change cells is harmful to the human body. Additionally, a lack of quality standards could soon impede industry expansion. These are the main market restraint that will slow the growth rate of the market.
This paper cup market report provides details of new recent developments, trade regulations, import-export analysis, production analysis, value chain optimization, market share, impact of domestic and localized market players, analyses opportunities in terms of emerging revenue pockets, changes in market regulations, strategic market growth analysis, market size, category market growth application niches and dominance, product approvals, product launches, geographic expansions, technological innovations in the market. To gain more info on the paper cup market contact Data Bridge Market Research for an Analyst Brief, our team will help you take an informed market decision to achieve market growth.
Impact and Current Market Scenario of Raw Material Shortage and Shipping Delays
Data Bridge Market Research offers a high-level analysis of the market and delivers information by keeping in account the impact and current market environment of raw material shortage and shipping delays. This translates into assessing strategic possibilities, creating effective action plans, and assisting businesses in making important decisions.
Apart from the standard report, we also offer in-depth analysis of the procurement level from forecasted shipping delays, distributor mapping by region, commodity analysis, production analysis, price mapping trends, sourcing, category performance analysis, supply chain risk management solutions, advanced benchmarking, and other services for procurement and strategic support.
Expected Impact of Economic Slowdown on the Pricing and Availability of Products
When economic activity slows, industries begin to suffer. The forecasted effects of the economic downturn on the pricing and accessibility of the products are taken into account in the market insight reports and intelligence services provided by DBMR. With this, our clients can typically keep one step ahead of their competitors, project their sales and revenue, and estimate their profit and loss expenditures.
Recent Development
- In 2021, Chobani announced the introduction of yoghurt in paper cups. Paper packaging solutions are now available for other dairy goods such as cold brew coffee, oat milk, and coffee creamers. The company promises to keep looking for alternatives to plastic packaging made of paper.
- In 2021, The "Garda Embossed Insulated Cup" was introduced, according to Bender Paper Cups. The product line offers many different hot mugs. The cup's design is stunning and one-of-a-kind, and its swirl pattern allows for exceptional print quality and excellent insulation.
Global Paper Cup Market Scope
The paper cup market is segmented on the basis of cup capacity, cup type, wall type, end-user and distribution channel. The growth amongst these segments will help you analyze meagre growth segments in the industries and provide the users with a valuable market overview and market insights to help them make strategic decisions for identifying core market applications.
Cup Capacity
- Up to 150 ml
- 150 to 350 ml
- 350 to 500 ml
- Above 500 ml
Cup Type
- Cold Beverage Cup
- Hot Beverage Cup
Wall Type
- Single Wall Paper Cups
- Double Wall Paper Cups
- Triple Wall Paper Cups
End-User
- Coffee and Tea Shop
- QSR and Other Fast Food Shops
- Offices and Educational Institutions
- Residential Use
- Others
Distribution Channel
- Institutional Sales
- Retail Sales
Paper Cup Market Regional Analysis/Insights
The paper cup market is analyzed and market size insights and trends are provided by country, cup capacity, cup type, wall type, end-user and distribution channel as referenced above.
The countries covered in the paper cup market report are U.S., Canada, Mexico, Brazil, Argentina, Rest of South America, Germany, France, Italy, U.K., Belgium, Spain, Russia, Turkey, Netherlands, Switzerland, Rest of Europe, Japan, China, India, South Korea, Australia and New Zealand, Singapore, Malaysia, Thailand, Indonesia, Philippines, Rest of Asia-Pacific, United Arab Emirate, Saudi Arabia, Egypt, Israel, South Africa, Rest of Middle East and Africa.
Asia-Pacific dominates the paper cup market in terms of market share and revenue. This is attributable to growing requirement for paper cups. Moreover, China leading in terms of manufacturing and consumption of disposable paper cup. China dominates the Asia-Pacific paper cup market owing to the simplicity with which disposable paper cups may be formed.
North America is expected to be the fastest developing region during the forecast period of 2023-2030 due to growing demand for disposable paper cups in industrial and commercial sectors in this region.
The country section of the report also provides individual market impacting factors and changes in market regulation that impact the current and future trends of the market. Data points like down-stream and upstream value chain analysis, technical trends and porter's five forces analysis, case studies are some of the pointers used to forecast the market scenario for individual countries. Also, the presence and availability of global brands and their challenges faced due to large or scarce competition from local and domestic brands, impact of domestic tariffs and trade routes are considered while providing forecast analysis of the country data.
Competitive Landscape and Paper Cup Market Share Analysis
The paper cup market competitive landscape provides details by competitor. Details included are company overview, company financials, revenue generated, market potential, investment in research and development, new market initiatives, global presence, production sites and facilities, production capacities, company strengths and weaknesses, product launch, product width and breadth, application dominance. The above data points provided are only related to the companies' focus related to paper cup market.
Some of the major players operating in the paper cup market are:
- Huhtamaki (Finland)
- Konie Cups International, Inc (U.S.)
- Genpak, LLC (U.S.)
- Conver Pack, Inc (U.S.)
- Dart Container Corporation (U.S.)
- Georgia-Pacific (U.S.)
- F Bender limited (U.K.)
- Graphic Packaging International LLC (U.S.)
- Kap Cones Pvt. Ltd. (India)
- Grupo phoenix (U.S.)
- Jiangsu Xinyu Bio-Tech Co., Ltd. (China)
- Eco-Products Inc (U.S.)
- International Paper (U.S.)
- Detmold (Australia)
SKU-

- Interactive Data Analysis Dashboard
- Company Analysis Dashboard for high growth potential opportunities
- Research Analyst Access for customization & queries
- Competitor Analysis with Interactive dashboard
- Latest News, Updates & Trend analysis
- Harness the Power of Benchmark Analysis for Comprehensive Competitor Tracking
Table of Content
1 INTRODUCTION
1.1 OBJECTIVES OF THE STUDY
1.2 MARKET DEFINITION
1.3 OVERVIEW OF GLOBAL PAPER CUP MARKET
1.4 CURRENCY AND PRICING
1.5 LIMITATION
1.6 MARKETS COVERED
2 MARKET SEGMENTATION
2.1 KEY TAKEAWAYS
2.2 ARRIVING AT THE GLOBAL PAPER CUP MARKET SIZE
2.3 VENDOR POSITIONING GRID
2.4 MARKETS COVERED
2.5 GEOGRAPHIC SCOPE
2.6 YEARS CONSIDERED FOR THE STUDY
2.7 CURRENCY AND PRICING
2.8 RESEARCH METHODOLOGY
2.9 TECHNOLOGY LIFE LINE CURVE
2.1 MULTIVARIATE MODELLING
2.11 PRIMARY INTERVIEWS WITH KEY OPINION LEADERS
2.12 DBMR MARKET POSITION GRID
2.13 MARKET APPLICATION COVERAGE GRID
2.14 DBMR MARKET CHALLENGE MATRIX
2.15 IMPORT AND EXPORT DATA
2.16 SECONDARY SOURCES
2.17 GLOBAL PAPER CUP MARKET: RESEARCH SNAPSHOT
2.18 ASSUMPTIONS
3 MARKET OVERVIEW
3.1 DRIVERS
3.2 RESTRAINTS
3.3 OPPORTUNITIES
3.4 CHALLENGES
4 EXECUTIVE SUMMARY
5 PREMIUM INSIGHTS
5.1 RAW MATERIAL COVERAGE
5.2 PRODUCTION CONSUMPTION ANALYSIS
5.3 IMPORT EXPORT SCENARIO
5.4 TECHNOLOGICAL ADVANCEMENT BY MANUFACTURERS
5.5 PORTER’S FIVE FORCES
5.6 VENDOR SELECTION CRITERIA
5.7 PESTEL ANALYSIS
5.8 REGULATION COVERAGE
5.9 LIST OF POTENTIAL CUSTOMERS
6 PRODUCTION CAPACITY OVERVIEW
7 PRICING ANALYSIS
8 SUPPLY CHAIN ANALYSIS
8.1 OVERVIEW
8.2 LOGISTIC COST SCENARIO
8.3 IMPORTANCE OF LOGISTICS SERVICE PROVIDERS
9 CLIMATE CHANGE SCENARIO
9.1 ENVIRONMENTAL CONCERNS
9.2 INDUSTRY RESPONSE
9.3 GOVERNMENT’S ROLE
9.4 ANALYST RECOMMENDATIONS
10 GLOBAL PAPER CUP MARKET, BY PRODUCT, 2021-2030, (USD MILLION) (MILLION UNITS)
10.1 OVERVIEW
10.2 HOT PAPER CUPS
10.2.1 HOT PAPER CUPS, BY CAPACITY
10.2.2 UP TO 150 ML
10.2.3 150 TO 350 ML
10.2.4 350 TO 500 ML
10.2.5 ABOVE 500 ML
10.3 COLD PAPER CUPS
10.3.1 COLD PAPER CUPS, BY CAPACITY
10.3.2 UP TO 150 ML
10.3.3 150 TO 350 ML
10.3.4 350 TO 500 ML
10.3.5 ABOVE 500 ML
11 GLOBAL PAPER CUP MARKET, BY CAPACITY, 2021-2030, (USD MILLION)
11.1 OVERVIEW
11.2 UP TO 150 ML
11.3 150 TO 350 ML
11.4 350 TO 500 ML
11.5 ABOVE 500 ML
12 GLOBAL PAPER CUP MARKET, BY WALL TYPE, 2021-2030, (USD MILLION)
12.1 OVERVIEW
12.2 SINGLE-WALL PAPER CUPS
12.3 DOUBLE-WALL PAPER CUPS
12.4 CORRUGATED RIPPLE PAPER CUPS
12.5 OTHERS
13 GLOBAL PAPER CUP MARKET, BY APPLICATION, 2021-2030, (USD MILLION)
13.1 OVERVIEW
13.2 COFFEE AND TEA
13.3 CHILLED BEVERAGES
13.4 ICE CREAM AND DESSERTS
13.5 SOUPS AND NOODLES
13.6 OTHERS
14 GLOBAL PAPER CUP MARKET, BY END-USE, 2021-2030, (USD MILLION)
14.1 OVERVIEW
14.2 HORECA
14.3 OFFICES
14.4 EDUCATIONAL INSTITUTIONS
14.5 RESIDENTIAL USE
14.6 RETAIL
14.7 OTHERS
15 GLOBAL PAPER CUP MARKET, BY DISTRIBUTION CHANNEL,(2021-2030), USD MILLION
15.1 OVERVIEW
15.2 DIRECT SALE
15.3 RETAIL SALE
15.3.1 RETAIL SALE, BY TYPE
15.3.2 HYPERMARKET/ SUPERMARKET
15.3.3 E-COMMERCE
15.3.4 SPECIALTY STORE
15.3.5 OTHERS
16 GLOBAL PAPER CUP MARKET, BY GEOGRAPHY ,2021-2030,(USD MILLION) (MILLION UNITS)
GLOBAL PAPER CUP market, (ALL SEGMENTATION PROVIDED ABOVE IS REPRESENTED IN THIS CHAPTER BY COUNTRY)
16.1 NORTH AMERICA
16.1.1 U.S.
16.1.2 CANADA
16.1.3 MEXICO
16.2 EUROPE
16.2.1 GERMANY
16.2.2 U.K.
16.2.3 ITALY
16.2.4 FRANCE
16.2.5 SPAIN
16.2.6 SWITZERLAND
16.2.7 RUSSIA
16.2.8 TURKEY
16.2.9 BELGIUM
16.2.10 NETHERLANDS
16.2.11 SWITZERLAND
16.2.12 REST OF EUROPE
16.3 ASIA-PACIFIC
16.3.1 JAPAN
16.3.2 CHINA
16.3.3 SOUTH KOREA
16.3.4 INDIA
16.3.5 SINGAPORE
16.3.6 THAILAND
16.3.7 INDONESIA
16.3.8 MALAYSIA
16.3.9 PHILIPPINES
16.3.10 AUSTRALIA
16.3.11 NEW ZEALAND
16.3.12 REST OF ASIA-PACIFIC
16.4 SOUTH AMERICA
16.4.1 BRAZIL
16.4.2 ARGENTINA
16.4.3 REST OF SOUTH AMERICA
16.5 MIDDLE EAST AND AFRICA
16.5.1 SOUTH AFRICA
16.5.2 EGYPT
16.5.3 SAUDI ARABIA
16.5.4 UNITED ARAB EMIRATES
16.5.5 ISRAEL
16.5.6 KUWAIT
16.5.7 QATAR
16.5.8 REST OF MIDDLE EAST AND AFRICA
17 GLOBAL PAPER CUP MARKET, COMPANY LANDSCAPE
17.1 COMPANY SHARE ANALYSIS: GLOBAL
17.2 COMPANY SHARE ANALYSIS: NORTH AMERICA
17.3 COMPANY SHARE ANALYSIS: EUROPE
17.4 COMPANY SHARE ANALYSIS: ASIA-PACIFIC
17.5 MERGERS & ACQUISITIONS
17.6 NEW PRODUCT DEVELOPMENT & APPROVALS
17.7 EXPANSIONS
17.8 REGULATORY CHANGES
17.9 PARTNERSHIP AND OTHER STRATEGIC DEVELOPMENTS
18 SWOT AND DATA BRIDGE MARKET RESEARCH ANALYSIS
19 GLOBAL PAPER CUP MARKET - COMPANY PROFILES
19.1 HUHTAMAKI
19.1.1 COMPANY SNAPSHOT
19.1.2 PRODUCT PORTFOLIO
19.1.3 PRODUCTION CAPACITY OVERVIEW
19.1.4 REVENUE ANALYSIS
19.1.5 RECENT UPDATES
19.2 KONIE CUPS INTERNATIONAL, INC.
19.2.1 COMPANY SNAPSHOT
19.2.2 PRODUCT PORTFOLIO
19.2.3 PRODUCTION CAPACITY OVERVIEW
19.2.4 REVENUE ANALYSIS
19.2.5 RECENT UPDATES
19.3 GENPAK, LLC
19.3.1 COMPANY SNAPSHOT
19.3.2 PRODUCT PORTFOLIO
19.3.3 PRODUCTION CAPACITY OVERVIEW
19.3.4 REVENUE ANALYSIS
19.3.5 RECENT UPDATES
19.4 CONVER PACK, INC
19.4.1 COMPANY SNAPSHOT
19.4.2 PRODUCT PORTFOLIO
19.4.3 PRODUCTION CAPACITY OVERVIEW
19.4.4 REVENUE ANALYSIS
19.4.5 RECENT UPDATES
19.5 DART CONTAINER CORPORATION
19.5.1 COMPANY SNAPSHOT
19.5.2 PRODUCT PORTFOLIO
19.5.3 PRODUCTION CAPACITY OVERVIEW
19.5.4 REVENUE ANALYSIS
19.5.5 RECENT UPDATES
19.6 GEORGIA-PACIFIC CONSUMER PRODUCTS LP
19.6.1 COMPANY SNAPSHOT
19.6.2 PRODUCT PORTFOLIO
19.6.3 PRODUCTION CAPACITY OVERVIEW
19.6.4 REVENUE ANALYSIS
19.6.5 RECENT UPDATES
19.7 F BENDER LIMITED
19.7.1 COMPANY SNAPSHOT
19.7.2 PRODUCT PORTFOLIO
19.7.3 PRODUCTION CAPACITY OVERVIEW
19.7.4 REVENUE ANALYSIS
19.7.5 RECENT UPDATES
19.8 GLOPAC INDONESIA
19.8.1 COMPANY SNAPSHOT
19.8.2 PRODUCT PORTFOLIO
19.8.3 PRODUCTION CAPACITY OVERVIEW
19.8.4 REVENUE ANALYSIS
19.8.5 RECENT UPDATES
19.9 GRAPHIC PACKAGING INTERNATIONAL, LLC
19.9.1 COMPANY SNAPSHOT
19.9.2 PRODUCT PORTFOLIO
19.9.3 PRODUCTION CAPACITY OVERVIEW
19.9.4 REVENUE ANALYSIS
19.9.5 RECENT UPDATES
19.1 GRUPO PHOENIX
19.10.1 COMPANY SNAPSHOT
19.10.2 PRODUCT PORTFOLIO
19.10.3 PRODUCTION CAPACITY OVERVIEW
19.10.4 REVENUE ANALYSIS
19.10.5 RECENT UPDATES
19.11 ECO-PRODUCTS INC
19.11.1 COMPANY SNAPSHOT
19.11.2 PRODUCT PORTFOLIO
19.11.3 PRODUCTION CAPACITY OVERVIEW
19.11.4 REVENUE ANALYSIS
19.11.5 RECENT UPDATES
19.12 DETMOLD GROUP
19.12.1 COMPANY SNAPSHOT
19.12.2 PRODUCT PORTFOLIO
19.12.3 PRODUCTION CAPACITY OVERVIEW
19.12.4 REVENUE ANALYSIS
19.12.5 RECENT UPDATES
19.13 NATURAL CHOICE
19.13.1 COMPANY SNAPSHOT
19.13.2 PRODUCT PORTFOLIO
19.13.3 PRODUCTION CAPACITY OVERVIEW
19.13.4 REVENUE ANALYSIS
19.13.5 RECENT UPDATES
19.14 SEDA INTERNATIONAL PACKAGING GROUP
19.14.1 COMPANY SNAPSHOT
19.14.2 PRODUCT PORTFOLIO
19.14.3 PRODUCTION CAPACITY OVERVIEW
19.14.4 REVENUE ANALYSIS
19.14.5 RECENT UPDATES
19.15 GO-PAK GROUP
19.15.1 COMPANY SNAPSHOT
19.15.2 PRODUCT PORTFOLIO
19.15.3 PRODUCTION CAPACITY OVERVIEW
19.15.4 REVENUE ANALYSIS
19.15.5 RECENT UPDATES
19.16 STANPAC
19.16.1 COMPANY SNAPSHOT
19.16.2 PRODUCT PORTFOLIO
19.16.3 PRODUCTION CAPACITY OVERVIEW
19.16.4 REVENUE ANALYSIS
19.16.5 RECENT UPDATES
19.17 BENDERS PAPER CUPS
19.17.1 COMPANY SNAPSHOT
19.17.2 PRODUCT PORTFOLIO
19.17.3 PRODUCTION CAPACITY OVERVIEW
19.17.4 REVENUE ANALYSIS
19.17.5 RECENT UPDATES
19.18 DUNI GROUP
19.18.1 COMPANY SNAPSHOT
19.18.2 PRODUCT PORTFOLIO
19.18.3 PRODUCTION CAPACITY OVERVIEW
19.18.4 REVENUE ANALYSIS
19.18.5 RECENT UPDATES
19.19 PACTIV LLC
19.19.1 COMPANY SNAPSHOT
19.19.2 PRODUCT PORTFOLIO
19.19.3 PRODUCTION CAPACITY OVERVIEW
19.19.4 REVENUE ANALYSIS
19.19.5 RECENT UPDATES
19.2 HELIPRO
19.20.1 COMPANY SNAPSHOT
19.20.2 PRODUCT PORTFOLIO
19.20.3 PRODUCTION CAPACITY OVERVIEW
19.20.4 REVENUE ANALYSIS
19.20.5 RECENT UPDATES
19.21 ZHEJIANG PANDO EP TECHNOLOGY CO., LTD.
19.21.1 COMPANY SNAPSHOT
19.21.2 PRODUCT PORTFOLIO
19.21.3 PRODUCTION CAPACITY OVERVIEW
19.21.4 REVENUE ANALYSIS
19.21.5 RECENT UPDATES
19.22 ANBAO
19.22.1 COMPANY SNAPSHOT
19.22.2 PRODUCT PORTFOLIO
19.22.3 PRODUCTION CAPACITY OVERVIEW
19.22.4 REVENUE ANALYSIS
19.22.5 RECENT UPDATES
20 QUESTIONNAIRE
21 RELATED REPORTS
22 ABOUT DATA BRIDGE MARKET RESEARCH
Global Paper Cup Market, Supply Chain Analysis and Ecosystem Framework
To support market growth and help clients navigate the impact of geopolitical shifts, DBMR has integrated in-depth supply chain analysis into its Global Paper Cup Market research reports. This addition empowers clients to respond effectively to global changes affecting their industries. The supply chain analysis section includes detailed insights such as Global Paper Cup Market consumption and production by country, price trend analysis, the impact of tariffs and geopolitical developments, and import and export trends by country and HSN code. It also highlights major suppliers with data on production capacity and company profiles, as well as key importers and exporters. In addition to research, DBMR offers specialized supply chain consulting services backed by over a decade of experience, providing solutions like supplier discovery, supplier risk assessment, price trend analysis, impact evaluation of inflation and trade route changes, and comprehensive market trend analysis.
Data collection and base year analysis are done using data collection modules with large sample sizes. The stage includes obtaining market information or related data through various sources and strategies. It includes examining and planning all the data acquired from the past in advance. It likewise envelops the examination of information inconsistencies seen across different information sources. The market data is analysed and estimated using market statistical and coherent models. Also, market share analysis and key trend analysis are the major success factors in the market report. To know more, please request an analyst call or drop down your inquiry.
The key research methodology used by DBMR research team is data triangulation which involves data mining, analysis of the impact of data variables on the market and primary (industry expert) validation. Data models include Vendor Positioning Grid, Market Time Line Analysis, Market Overview and Guide, Company Positioning Grid, Patent Analysis, Pricing Analysis, Company Market Share Analysis, Standards of Measurement, Global versus Regional and Vendor Share Analysis. To know more about the research methodology, drop in an inquiry to speak to our industry experts.
Data Bridge Market Research is a leader in advanced formative research. We take pride in servicing our existing and new customers with data and analysis that match and suits their goal. The report can be customized to include price trend analysis of target brands understanding the market for additional countries (ask for the list of countries), clinical trial results data, literature review, refurbished market and product base analysis. Market analysis of target competitors can be analyzed from technology-based analysis to market portfolio strategies. We can add as many competitors that you require data about in the format and data style you are looking for. Our team of analysts can also provide you data in crude raw excel files pivot tables (Fact book) or can assist you in creating presentations from the data sets available in the report.


