
Global Para Virtualization Market
Market Size in USD Billion
 USD
9.46 Billion
USD
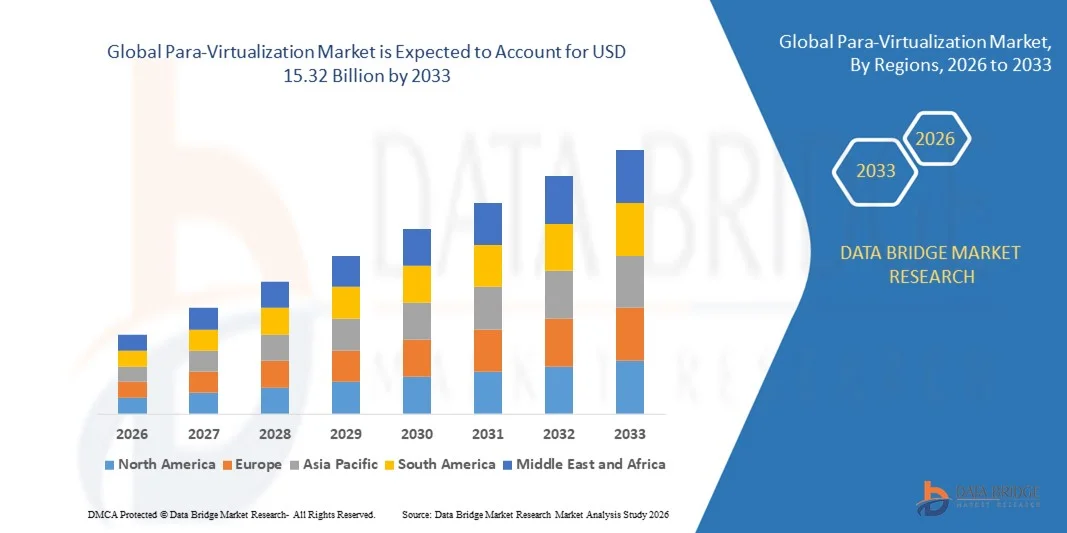
15.32 Billion
2025
2033
USD
9.46 Billion
USD
15.32 Billion
2025
2033
| 2026 - 2033 | |
| USD 9.46 Billion | |
| USD 15.32 Billion | |
| % | |
|
What is the Global Para-Virtualization Market Size and Growth Rate?
- The global para-virtualization market size was valued at USD 9.46 billion in 2025 and is expected to reach USD 15.32 billion by 2033, at a CAGR of 6.20% during the forecast period
- Increasing adoption of cloud computing, rising demand for efficient server virtualization, growing deployment of hypervisor-based infrastructure, expanding data center consolidation strategies, and strong focus on workload optimization and cost-efficient IT resource utilization are some of the major as well as vital factors which are expected to augment the growth of the Para-Virtualization market
What are the Major Takeaways of Para-Virtualization Market?
- Rapid digital transformation across enterprises, growing reliance on virtual machines for scalable computing, and increasing investments in hybrid and multi-cloud environments are creating significant growth opportunities for the Para-Virtualization market
- Security concerns, integration complexities with legacy IT infrastructure, performance overhead in certain workloads, and shortage of skilled virtualization professionals are such asly to act as key restraint factors for the growth of the Para-Virtualization market
- Asia-Pacific dominated the para-virtualization market with a 41.8% revenue share in 2025, driven by rapid expansion of cloud infrastructure, increasing data center investments, strong enterprise digital transformation initiatives, and rising adoption of virtualization technologies across China, Japan, India, South Korea, and Southeast Asia
- North America is projected to register the fastest CAGR of 9.12% from 2026 to 2033, supported by rapid cloud-native adoption, strong presence of leading virtualization vendors, and continuous modernization of enterprise IT infrastructure across the U.S. and Canada
- The On-premises segment dominated the market with a 55.3% share in 2025, as large enterprises and regulated industries continue to rely on internally managed virtualization infrastructure for enhanced data control, security compliance, and customized workload optimization
Report Scope and Para-Virtualization Market Segmentation
|
Attributes |
Para-Virtualization Key Market Insights |
|
Segments Covered |
|
|
Countries Covered |
North America
Europe
Asia-Pacific
Middle East and Africa
South America
|
|
Key Market Players |
|
|
Market Opportunities |
|
|
Value Added Data Infosets |
In addition to the insights on market scenarios such as market value, growth rate, segmentation, geographical coverage, and major players, the market reports curated by the Data Bridge Market Research also include in-depth expert analysis, pricing analysis, brand share analysis, consumer survey, demography analysis, supply chain analysis, value chain analysis, raw material/consumables overview, vendor selection criteria, PESTLE Analysis, Porter Analysis, and regulatory framework. |
What is the Key Trend in the Para-Virtualization Market?
Increasing Shift Toward Cloud-Native, Lightweight, and Hypervisor-Optimized Para-Virtualization Solutions
- The Para-Virtualization market is witnessing strong adoption of lightweight, kernel-aware virtualization solutions designed to improve workload efficiency, reduce overhead, and enhance performance in cloud and data center environments
- Vendors are introducing hypervisor-optimized platforms with enhanced memory management, faster I/O processing, container integration, and compatibility with modern orchestration tools such as Kubernetes and OpenStack
- Growing demand for scalable, cost-efficient, and high-performance virtual machines is driving adoption across enterprises, telecom operators, managed service providers, and hyperscale cloud platforms
- For instance, companies such as VMware, Microsoft, Red Hat, and Oracle are enhancing their virtualization stacks with improved para-virtual drivers, advanced workload balancing, and hybrid-cloud management capabilities
- Increasing need for real-time processing, low-latency networking, and optimized CPU utilization is accelerating the shift toward para-virtualized environments
- As enterprises modernize IT infrastructure and migrate toward multi-cloud ecosystems, Para-Virtualizations will remain critical for efficient resource allocation and workload optimization
What are the Key Drivers of Para-Virtualization Market?
- Rising demand for efficient server consolidation, reduced hardware dependency, and improved data center utilization is fueling the adoption of para-virtualization technologies
- For instance, in 2025, leading providers such as VMware, Red Hat, and Microsoft expanded support for advanced para-virtual drivers and performance-enhanced hypervisors across enterprise and cloud platforms
- Growing adoption of hybrid cloud, edge computing, AI workloads, and enterprise SaaS applications is boosting demand for scalable virtualization infrastructure across the U.S., Europe, and Asia-Pacific
- Advancements in processor virtualization extensions, memory optimization, and software-defined networking have strengthened performance and operational flexibility
- Increasing focus on cost optimization, disaster recovery, and business continuity planning is creating sustained demand for virtualized IT environments
- Supported by continuous investments in digital transformation, cloud migration strategies, and hyperscale data centers, the Para-Virtualization market is expected to witness steady long-term growth
Which Factor is Challenging the Growth of the Para-Virtualization Market?
- High implementation and licensing costs associated with enterprise-grade virtualization platforms limit adoption among small and medium enterprises
- For instance, during 2024–2025, rising subscription pricing models and changes in virtualization licensing structures increased operational expenditure for several enterprises
- Complexity in integrating para-virtualization with legacy infrastructure and ensuring security across virtual workloads requires skilled IT professionals
- Concerns regarding hypervisor vulnerabilities, data breaches, and compliance requirements may slow adoption in regulated industries
- Competition from containerization technologies and serverless computing models creates pricing pressure and shifts enterprise preferences
- To address these challenges, companies are focusing on flexible pricing models, enhanced security frameworks, automation-driven management tools, and deeper cloud integration to strengthen global adoption of para-virtualizations
How is the Para-Virtualization Market Segmented?
The market is segmented on the basis of deployment, organization size, and application.
- By Deployment
On the basis of deployment, the para-virtualization market is segmented into On-premises and Cloud. The On-premises segment dominated the market with a 55.3% share in 2025, as large enterprises and regulated industries continue to rely on internally managed virtualization infrastructure for enhanced data control, security compliance, and customized workload optimization. Organizations operating in finance, government, and healthcare prefer on-premises para-virtualized environments to maintain strict governance policies, minimize latency, and ensure integration with legacy IT systems. Strong investments in private data centers and hypervisor-based infrastructure further strengthen segment leadership.
The Cloud segment is expected to grow at the fastest CAGR from 2026 to 2033, driven by increasing adoption of hybrid cloud strategies, scalable computing demand, lower capital expenditure models, and growing reliance on hyperscale cloud service providers.
- By Organization Size
On the basis of organization size, the market is segmented into SMEs and Large Enterprises. The Large Enterprises segment dominated the market with a 62.7% share in 2025, supported by substantial IT budgets, large-scale data center operations, and extensive virtualization deployment across multiple business units. These organizations leverage para-virtualization to enhance workload efficiency, optimize hardware utilization, strengthen disaster recovery planning, and support mission-critical enterprise applications. Growing adoption of AI workloads, ERP systems, and cloud-native applications further drives segment dominance.
The SMEs segment is projected to grow at the fastest CAGR from 2026 to 2033, fueled by increasing awareness of cost-efficient virtualization models, rising cloud adoption, subscription-based pricing availability, and the need for scalable IT infrastructure without heavy capital investment.
- By Application
On the basis of application, the para-virtualization market is segmented into BFSI, Telecommunications and IT, Healthcare, Transportation and Logistics, and Others. The Telecommunications and IT segment dominated the market with a 34.8% share in 2025, driven by rapid expansion of cloud services, virtualization of network functions (NFV), data center consolidation, and increasing demand for scalable computing resources. IT service providers extensively deploy para-virtualized environments to optimize server utilization, enhance application performance, and manage multi-tenant infrastructures.
The BFSI segment is expected to grow at the fastest CAGR from 2026 to 2033, propelled by rising digital banking adoption, growing cybersecurity requirements, demand for secure transaction processing, and increasing reliance on virtualized disaster recovery and compliance-driven infrastructure solutions.
Which Region Holds the Largest Share of the Para-Virtualization Market?
- Asia-Pacific dominated the para-virtualization market with a 41.8% revenue share in 2025, driven by rapid expansion of cloud infrastructure, increasing data center investments, strong enterprise digital transformation initiatives, and rising adoption of virtualization technologies across China, Japan, India, South Korea, and Southeast Asia. Growing demand for scalable IT infrastructure, server consolidation, and cost-efficient workload management continues to fuel regional market growth
- Leading technology providers across Asia-Pacific are strengthening virtualization ecosystems through cloud-native integration, hypervisor optimization, and advanced resource orchestration platforms, enhancing performance and operational flexibility across enterprises
- Expanding telecom networks, hyperscale cloud facilities, and increasing adoption of AI, edge computing, and enterprise SaaS solutions further reinforce regional market leadership
China Para-Virtualization Market Insight
China is the largest contributor in Asia-Pacific, supported by strong investments in hyperscale data centers, rapid enterprise cloud migration, and government-backed digital infrastructure programs. Increasing deployment of virtualization platforms across telecom, e-commerce, and fintech sectors accelerates demand for para-virtualized environments.
Japan Para-Virtualization Market Insight
Japan demonstrates steady growth due to advanced IT infrastructure, high enterprise virtualization penetration, and strong focus on operational efficiency. Rising integration of hybrid cloud and AI-driven enterprise applications supports continued adoption.
India Para-Virtualization Market Insight
India is emerging as a key growth hub, driven by expanding startup ecosystems, rising SaaS adoption, and government-led digital transformation initiatives. Increasing demand for scalable and cost-effective IT infrastructure strengthens market penetration.
South Korea Para-Virtualization Market Insight
South Korea contributes significantly through strong telecom infrastructure, 5G expansion, and growing enterprise cloud adoption. Increasing investments in smart manufacturing and digital platforms further drive virtualization demand.
North America Para-Virtualization Market
North America is projected to register the fastest CAGR of 9.12% from 2026 to 2033, supported by rapid cloud-native adoption, strong presence of leading virtualization vendors, and continuous modernization of enterprise IT infrastructure across the U.S. and Canada. Growing focus on hybrid cloud, cybersecurity, and high-performance computing accelerates regional demand.
U.S. Para-Virtualization Market Insight
The U.S. leads regional growth due to large-scale enterprise virtualization deployment, strong hyperscale cloud presence, and increasing investments in AI workloads, SaaS platforms, and digital infrastructure modernization.
Canada Para-Virtualization Market Insight
Canada supports growth through rising adoption of hybrid cloud environments, expansion of colocation data centers, and strong government support for digital innovation and secure IT infrastructure development.
Which are the Top Companies in Para-Virtualization Market?
The para-virtualization industry is primarily led by well-established companies, including:
- VMware (U.S.)
- Oracle (U.S.)
- Red Hat (U.S.)
- Citrix (U.S.)
- Microsoft (U.S.)
- Google LLC (U.S.)
- I2K2 Networks (India)
- PCS (U.S.)
- Huawei (China)
- Proxmox Server Solutions GmbH (Austria)
- Amazon.com Inc. (U.S.)
- Odin Inc. (U.S.)
- Symantec Corporation (U.S.)
- Google (U.S.)
- Dell (U.S.)
- Micro Focus (U.K.)
- Parallels International (U.S.)
- Systancia (France)
- Accops (India)
- NComputing (U.S.)
- Sangfor Technologies (China)
- NextAxiom Technology (U.S.)
What are the Recent Developments in Global Para-Virtualization Market?
- In August 2024, Hewlett Packard Enterprise Development LP agreed to acquire U.S.-based software firm Morpheus Data to strengthen hybrid operations within its HPE GreenLake platform, aiming to simplify IT complexity and enhance management of diverse, multi-cloud environments through improved application virtualization capabilities, thereby reinforcing its hybrid cloud leadership strategy
- In May 2024, Red Hat, Inc. and U.S.-based Pure Storage announced an enhancement to Portworx on Red Hat OpenShift by Pure Storage, streamlining platform integration and providing enterprises with a simplified approach to modern virtualization while accelerating application deployment and improving operational resilience in hybrid cloud ecosystems, ultimately strengthening enterprise cloud efficiency
- In July 2023, Citrix Systems introduced Citrix Virtual Apps and Desktops 7 2407 featuring updated Windows Virtual Delivery Agents (VDAs) and upgraded core components, enabling streamlined installation and upgrades via ISO deployment while allowing enterprises to leverage enhanced virtualization features and performance improvements, supporting continuous modernization of virtual desktop infrastructure
SKU-

- Interactive Data Analysis Dashboard
- Company Analysis Dashboard for high growth potential opportunities
- Research Analyst Access for customization & queries
- Competitor Analysis with Interactive dashboard
- Latest News, Updates & Trend analysis
- Harness the Power of Benchmark Analysis for Comprehensive Competitor Tracking
Data collection and base year analysis are done using data collection modules with large sample sizes. The stage includes obtaining market information or related data through various sources and strategies. It includes examining and planning all the data acquired from the past in advance. It likewise envelops the examination of information inconsistencies seen across different information sources. The market data is analysed and estimated using market statistical and coherent models. Also, market share analysis and key trend analysis are the major success factors in the market report. To know more, please request an analyst call or drop down your inquiry.
The key research methodology used by DBMR research team is data triangulation which involves data mining, analysis of the impact of data variables on the market and primary (industry expert) validation. Data models include Vendor Positioning Grid, Market Time Line Analysis, Market Overview and Guide, Company Positioning Grid, Patent Analysis, Pricing Analysis, Company Market Share Analysis, Standards of Measurement, Global versus Regional and Vendor Share Analysis. To know more about the research methodology, drop in an inquiry to speak to our industry experts.
Data Bridge Market Research is a leader in advanced formative research. We take pride in servicing our existing and new customers with data and analysis that match and suits their goal. The report can be customized to include price trend analysis of target brands understanding the market for additional countries (ask for the list of countries), clinical trial results data, literature review, refurbished market and product base analysis. Market analysis of target competitors can be analyzed from technology-based analysis to market portfolio strategies. We can add as many competitors that you require data about in the format and data style you are looking for. Our team of analysts can also provide you data in crude raw excel files pivot tables (Fact book) or can assist you in creating presentations from the data sets available in the report.


