
Global Pharma E Commerce Market
Market Size in USD Billion
 USD
14.70 Billion
USD
74.57 Billion
2024
2032
USD
14.70 Billion
USD
74.57 Billion
2024
2032
| 2025 - 2032 | |
| USD 14.70 Billion | |
| USD 74.57 Billion | |
| % | |
|
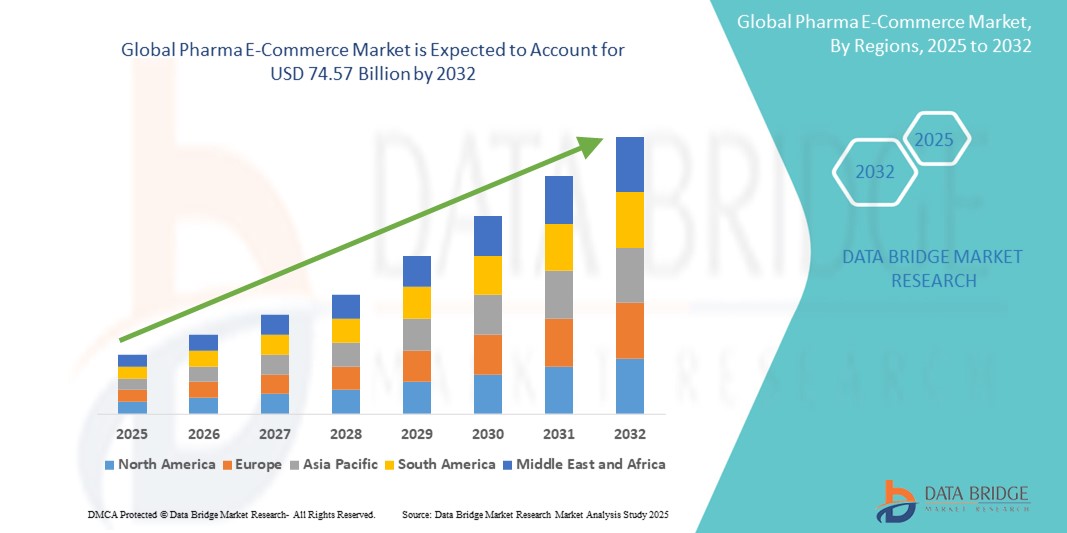
Pharma E-Commerce Market Size
- The global Pharma E-Commerce market was valued at USD 14.70 billion in 2024 and is expected to reach USD 74.57 billion by 2032
- During the forecast period of 2025 to 2032 the market is likely to grow at a CAGR of 22.50%, primarily driven by the increasing adoption of online pharmaceutical platforms for the Global Pharma E-Commerce Market
- This growth is driven by factors such as the rising consumer preference for online shopping, the increasing penetration of internet access in emerging economies, and the growing demand for home delivery of medicines
Pharma E-Commerce Market Analysis
- There is a noticeable shift towards online pharmacies, with consumers seeking the convenience of home delivery and the ability to compare prices and products easily
- E-commerce platforms are integrating technologies such as artificial intelligence and data analytics to offer personalized recommendations and improve customer experiences
- Despite growth, the market faces challenges related to counterfeit drugs and regulatory compliance, necessitating stringent measures to ensure consumer safety
- For instance, Amazon has ventured into the pharmaceutical e-commerce space, offering prescription medications and health products, thereby expanding its healthcare portfolio
- The pharmaceutical e-commerce market is rapidly evolving, with technological advancements and shifting consumer preferences playing pivotal roles in its expansion
Report Scope and Pharma E-Commerce Market Segmentation
|
Attributes |
Pharma E-Commerce Key Market Insights |
|
Segments Covered |
|
|
Countries Covered |
North America
Europe
Asia-Pacific
Middle East and Africa
South America
|
|
Key Market Players |
|
|
Market Opportunities |
|
|
Value Added Data Infosets |
In addition to the insights on market scenarios such as market value, growth rate, segmentation, geographical coverage, and major players, the market reports curated by the Data Bridge Market Research also include in-depth expert analysis, patient epidemiology, pipeline analysis, pricing analysis, and regulatory framework. |
Pharma E-Commerce Market Trends
“Integration of Telemedicine with Pharmaceutical E-Commerce”
- Pharmaceutical e-commerce platforms are increasingly integrating telemedicine services to offer a comprehensive healthcare experience. This integration allows patients to consult with healthcare providers remotely and receive prescriptions that can be directly fulfilled by online pharmacies
- For instance, Pfizer plans to launch an online direct-to-consumer platform that connects U.S. customers with independent telehealth consultants and drug-dispensing partners, aiming to streamline access to medications such as Paxlovid and Zazpret
- Consumers are seeking more convenient options to engage with their healthcare, driving the demand for platforms that combine telemedicine with pharmaceutical services
- For Instance, Amazon Pharmacy is experiencing rapid growth, partly due to the high demand for anti-obesity drugs, and is exploring advancements such as same-day delivery and potential drone deliveries to enhance customer convenience
- Advancements in technology, such as artificial intelligence and data analytics, are enabling e-commerce platforms to offer personalized healthcare services. These technologies assist in prescribing medications based on individual health profiles and previous purchases, improving the overall patient experience
- Strategic collaborations between pharmaceutical companies and e-commerce platforms are facilitating the integration of telemedicine services. These partnerships aim to provide a seamless healthcare experience by combining medical consultations with convenient access to medications, thereby expanding the reach and effectiveness of healthcare services
Pharma E-Commerce Market Dynamics
Driver
“Increasing Adoption of Online Pharmacies”
- The global trend toward e-commerce has significantly influenced the pharmaceutical sector, with more consumers opting for online pharmacies due to the convenience of home delivery and the ability to compare prices easily
- Pharmaceutical e-commerce platforms are increasingly integrating telemedicine services, allowing patients to consult with healthcare providers remotely and receive prescriptions that can be directly fulfilled by online pharmacies
- The adoption of artificial intelligence and data analytics enables online pharmacies to offer personalized recommendations and improve customer service, enhancing the overall user experience
- Regulatory reforms in various regions are streamlining online prescription processes and ensuring better oversight of digital pharmacies, fostering a conducive environment for the growth of pharmaceutical e-commerce
- The increasing penetration of smartphones and internet access in emerging markets presents significant growth opportunities for online pharmacies to expand their reach and customer base
Opportunity
“Expansion in Emerging Markets”
- The increasing internet penetration in emerging markets provides a vast customer base for online pharmacies to tap into, facilitating market expansion
- Governments in emerging markets are implementing initiatives to promote digital health solutions, creating a favorable environment for the growth of pharmaceutical e-commerce
- Collaborations between online pharmacies and local healthcare providers can enhance service delivery and expand reach across diverse regions in emerging markets
- Tailoring services to meet the specific needs and preferences of consumers in emerging markets can drive customer adoption and loyalty
- Online pharmacies can offer cost-effective solutions for accessing medications, addressing the affordability concerns prevalent in emerging markets
Restraint/Challenge
“Counterfeit Drugs”
- Navigating the complex and varied regulatory requirements across different regions poses significant challenges for online pharmacies seeking to expand globally
- The prevalence of counterfeit medications in the pharmaceutical e-commerce market raises concerns about patient safety and undermines consumer trust
- Ensuring the security of sensitive patient information and complying with data protection regulations are critical challenges for online pharmacies
- Implementing stringent verification processes to confirm the legitimacy of online pharmacies can slow down market expansion and increase operational costs
- Concerns over the authenticity of medications and the reliability of online pharmacies can deter consumers from adopting e-pharmacy services, limiting market growth
Pharma E-Commerce Market Scope
The market is segmented on the basis product and end-user.
|
Segmentation |
Sub-Segmentation |
|
By Product |
|
|
By End User |
|
Pharma E-Commerce Market Regional Analysis
“North America is the Dominant Region in the Pharma E-Commerce Market”
- U.S. is a key driver, with a large population increasingly turning to online pharmacies for both prescription and over-the-counter medications
- The region benefits from advanced healthcare infrastructure, high internet penetration, and favorable regulatory policies
- The implementation of stringent data privacy regulations, such as HIPAA, has promoted trust in e-commerce platforms, ensuring consumer confidence in purchasing medications online
- The high demand for wellness products, nutraceuticals, and convenience in healthcare services supports sustained growth in this region
“Asia-Pacific is Projected to Register the Highest Growth Rate”
- Countries such as China, India, and Japan are at the forefront of this expansion, supported by robust infrastructure and government initiatives promoting digital health
- The region's large population, combined with its rising demand for medications, wellness products, and online healthcare services, presents substantial growth opportunities
- Emerging markets, where physical pharmacy access is limited, offer untapped potential for e-commerce platforms
- Regulatory bodies in the region are gradually improving their stance on online pharmaceutical sales, fostering a safer and more structured environment for e-commerce companies
Pharma E-Commerce Market Share
The market competitive landscape provides details by competitor. Details included are company overview, company financials, revenue generated, market potential, investment in research and development, new market initiatives, global presence, production sites and facilities, production capacities, company strengths and weaknesses, product launch, product width and breadth, application dominance. The above data points provided are only related to the companies' focus related to market.
The Major Market Leaders Operating in the Market Are:
- Boehringer Ingelheim International GmbH (Germany)
- AbbVie Inc (U.S.)
- Aurobindo Pharma (India)
- Pfizer Inc. (U.S.)
- Walmart Inc. (U.S.)
- Walgreen Co. (U.S.)
- Express Scripts (U.S.)
- The Kroger Co. (U.S.)
- L Rowland & Co (U.K.)
- DocMorris (Switzerland )
- Giant Eagle, Inc. (U.S.)
- OptumRx, Inc. (U.S.)
- CVS Health (U.S.)
- Merck & Co., Inc. (U.S.)
- Thermo Fisher Scientific (U.S.)
Latest Developments in Global Pharma E-Commerce Market
- In October 2024, Amazon Pharmacy launched same-day prescription delivery in Los Angeles and New York City, with plans to expand to 12 additional cities by the end of 2024. This service utilizes artificial intelligence and machine learning to expedite prescription fulfillment, enhancing customer convenience
- In March 2024, Eli Lilly partnered with Amazon Pharmacy to deliver the weight loss drug Zepbound and other medicines from its direct-to-consumer website
- In January 2024, Eli Lilly and Company launched LillyDirect for people living with obesity, migraine, and diabetes in the U.S. This platform provides disease management resources and direct home delivery of select Lilly medicines for people in the U.S.
- In December 2024, Canadian FinTech company Nuvei Corporation partnered with Familiprix to launch an e-commerce program allowing associated pharmacists to accept online payments. This initiative aims to improve payment acceptance rates and streamline the checkout process for online shoppers, enabling over 400 independent pharmacies in Quebec and New Brunswick to enter the online marketplace
- In March 2023, Roman Pharma Company declared its intention to launch a direct-to-consumer (D2C) online store as an avenue for sales growth. The platform offers a wide range of nutraceutical items, such as vitamins, minerals, herbal supplements, and other nutritional supplements, providing consumers with a practical means of obtaining premium products
SKU-

- Interactive Data Analysis Dashboard
- Company Analysis Dashboard for high growth potential opportunities
- Research Analyst Access for customization & queries
- Competitor Analysis with Interactive dashboard
- Latest News, Updates & Trend analysis
- Harness the Power of Benchmark Analysis for Comprehensive Competitor Tracking
Table of Content
1 INTRODUCTION
1.1 OBJECTIVES OF THE STUDY
1.2 MARKET DEFINITION
1.3 OVERVIEW OF GLOBAL PHARMA E-COMMERCE MARKET
1.4 CURRENCY AND PRICING
1.5 LIMITATION
1.6 MARKETS COVERED
2 MARKET SEGMENTATION
2.1 KEY TAKEAWAYS
2.2 ARRIVING AT THE GLOBAL PHARMA E-COMMERCE MARKET SIZE
2.2.1 VENDOR POSITIONING GRID
2.2.2 TECHNOLOGY LIFE LINE CURVE
2.2.3 TRIPOD DATA VALIDATION MODEL
2.2.4 MARKET GUIDE
2.2.5 MULTIVARIATE MODELLING
2.2.6 TOP TO BOTTOM ANALYSIS
2.2.7 CHALLENGE MATRIX
2.2.8 APPLICATION COVERAGE GRID
2.2.9 STANDARDS OF MEASUREMENT
2.2.10 VENDOR SHARE ANALYSIS
2.2.11 SALES VOLUME DATA
2.2.12 DATA POINTS FROM KEY PRIMARY INTERVIEWS
2.2.13 DATA POINTS FROM KEY SECONDARY DATABASES
2.3 GLOBAL PHARMA E-COMMERCE MARKET: RESEARCH SNAPSHOT
2.4 ASSUMPTIONS
3 MARKET OVERVIEW
3.1 DRIVERS
3.2 RESTRAINTS
3.3 OPPORTUNITIES
3.4 CHALLENGES
4 EXECUTIVE SUMMARY
5 PREMIUM INSIGHTS
5.1 PESTEL ANALYSIS
5.2 PORTER'S FIVE FORCES MODEL
5.3 E-COMMERCE STRATEGIES BY PHARMACEUTICAL MANUFACTURERS
5.3.1 US
5.3.1.1. GSK
5.3.1.2. NOVARTIS
5.3.1.3. MERCK
5.3.1.4. PFIZER
5.3.1.5. ASTRAZENECA
5.3.1.6. BMS
5.3.1.7. ABBVIE
5.3.1.8. AMGEN
5.3.1.9. ROCHE
5.3.1.10. NOVONORDISK
5.3.1.11. LILLY
5.3.1.12. VIATRIS
5.3.1.13. ORGANON
5.3.1.14. OTHERS
5.3.2 REST OF THE WORLD
5.3.2.1. GSK
5.3.2.2. NOVARTIS
5.3.2.3. MERCK
5.3.2.4. PFIZER
5.3.2.5. ASTRAZENECA
5.3.2.6. BMS
5.3.2.7. ABBVIE
5.3.2.8. AMGEN
5.3.2.9. ROCHE
5.3.2.10. NOVONORDISK
5.3.2.11. LILLY
5.3.2.12. VIATRIS
5.3.2.13. ORGANON
5.3.2.14. OTHERS
6 INDUSTRY INSIGHTS
6.1 MICRO AND MACRO ECONOMIC FACTORS
6.2 PENETRATION AND GROWTH PROSPECT MAPPING
6.3 KEY PRICING STRATEGIES
6.4 INTERVIEWS WITH SPECIALIST
6.5 ANALYSIS AND RECOMMENDATIONS
7 INTELLECTUAL PROPERTY (IP) PORTFOLIO
7.1 PATENT QUALITY AND STRENGTH
7.2 PATENT FAMILIES
7.3 LICENSING AND COLLABORATIONS
7.4 COMPETITIVE LANDSCAPE
7.5 IP STRATEGY AND MANAGEMENT
7.6 OTHER
8 COST ANALYSIS BREAKDOWN
9 TECHNOLOGY ROADMAP
10 INNOVATION TRACKER AND STRATEGIC ANALYSIS
10.1 MAJOR DEALS AND STRATEGIC ALLIANCES ANALYSIS
10.1.1 JOINT VENTURES
10.1.2 MERGERS AND ACQUISITIONS
10.1.3 LICENSING AND PARTNERSHIP
10.1.4 TECHNOLOGY COLLABORATIONS
10.1.5 STRATEGIC DIVESTMENTS
10.2 NUMBER OF PRODUCTS IN DEVELOPMENT
10.3 STAGE OF DEVELOPMENT
10.4 TIMELINES AND MILESTONES
10.5 INNOVATION STRATEGIES AND METHODOLOGIES
10.6 RISK ASSESSMENT AND MITIGATION
10.7 FUTURE OUTLOOK
11 REGULATORY COMPLIANCE
11.1 REGULATORY AUTHORITIES
11.2 REGULATORY CLASSIFICATIONS
11.2.1 CLASS I
11.2.2 CLASS II
11.2.3 CLASS III
11.3 REGULATORY SUBMISSIONS
11.4 INTERNATIONAL HARMONIZATION
11.5 COMPLIANCE AND QUALITY MANAGEMENT SYSTEMS
11.6 REGULATORY CHALLENGES AND STRATEGIES
12 REIMBURSEMENT FRAMEWORK
13 OPPUTUNITY MAP ANALYSIS
14 INSTALLED BASE DATA
15 VALUE CHAIN ANALYSIS
16 HEALTHCARE ECONOMY
16.1 HEALTHCARE EXPENDITURE
16.2 CAPITAL EXPENDITURE
16.3 CAPEX TRENDS
16.4 CAPEX ALLOCATION
16.5 FUNDING SOURCES
16.6 INDUSTRY BENCHMARKS
16.7 GDP RATION IN OVERALL GDP
16.8 HEALTHCARE SYSTEM STRUCTURE
16.9 GOVERNMENT POLICIES
16.1 ECONOMIC DEVELOPMENT
17 GLOBAL PHARMA E-COMMERCE MARKET, BY PRODUCT
17.1 OVERVIEW
17.2 PRESCRIPTION PHARMACEUTICALS
17.2.1 ANALGESICS
17.2.1.1. PARACETAMOL
17.2.1.2. FENTANYL
17.2.1.3. TRAMADOL
17.2.1.4. ACETAMINOPHEN
17.2.1.5. OTHERS
17.2.2 IMMUNOSUPPRESSIVES
17.2.2.1. AZATHIOPRINE
17.2.2.2. CICLOSPORIN
17.2.2.3. MYCOPHENOLATE MOFETIL
17.2.2.4. OTHERS
17.2.3 ANTIDEPRESSANT
17.2.3.1. RISPERIDONE
17.2.3.2. OLANZAPINE
17.2.3.3. TRIFLUOPERAZINE
17.2.3.4. CHLORDIAZEPOXIDE
17.2.3.5. OTHERS
17.2.4 ANTI-INFECTIVES
17.2.4.1. ANTIBIOTICS
17.2.4.1.1. AMOXICILLIN
17.2.4.1.2. METRONIDAZOLE
17.2.4.1.3. DOXYCYCLINE
17.2.4.1.4. CIPROFLOXACIN
17.2.4.1.5. LEVOFLOXACIN
17.2.4.1.6. OTHERS
17.2.4.2. ANTIVIRAL
17.2.4.2.1. ACICLOVIR
17.2.4.2.2. ABACAVIR
17.2.4.2.3. LOPINAVIR
17.2.4.2.4. OSELTAMIVIR
17.2.4.2.5. OTHERS
17.2.4.3. ANTIFUNGAL
17.2.4.3.1. CLOTRIMAZOLE
17.2.4.3.2. ITRACONAZOLE
17.2.4.3.3. NYSTATIN
17.2.4.3.4. VORICONAZOLE
17.2.4.3.5. FLUCONAZOLE
17.2.4.3.6. OTHERS
17.2.4.4. OTHERS
17.2.5 ANTI-INFLAMMATORY
17.2.5.1. DICLOFENAC
17.2.5.2. IBUPROFEN
17.2.5.3. NAPROXEN
17.2.5.4. PREDNISOLONE
17.2.5.5. OTHERS
17.2.6 DIURETICS
17.2.6.1. SPIRONOLACTONE
17.2.6.2. HYDROCHLOROTHIAZIDE
17.2.6.3. FUROSEMIDE
17.2.6.4. OTHERS
17.2.7 GASTROINTESTINAL
17.2.7.1. ESOMOPRAZOLE
17.2.7.2. OMEPRAZOLE
17.2.7.3. RANITIDINE
17.2.7.4. LOPERAMIDE
17.2.7.5. OTHERS
17.2.8 CARDIOVASCULAR
17.2.8.1. ATENOLOL
17.2.8.2. MOLSIDOMINE
17.2.8.3. DIGOXIN
17.2.8.4. VERAPAMIL
17.2.8.5. OTHERS
17.3 VACCINES
17.3.1 EBOLA VACCINE
17.3.2 HUMAN PAPILLOMAVIRUS VACCINE
17.3.3 MEASLES, MUMPS, AND RUBELLA VIRUS VACCINE
17.3.4 HAEMOPHILUS B VACCINE
17.3.5 PNEUMOCOCCAL VACCINE
17.3.6 HEPATITIS B VACCINE
17.3.7 ROTAVIRUS VACCINE
17.3.8 HEPATITIS A VACCINE
17.3.9 BCG VACCINE
17.3.10 VARICELLA VIRUS VACCINE
17.3.11 DIPHTHERIA AND TETANUS VACCINES
17.3.12 SHINGLES VACCINES
17.3.13 OTHERS
17.4 SPECIALTY PHARMACEUTICALS
17.4.1 GASTROINTESTINAL
17.4.1.1. AFINITOR
17.4.1.2. AYVAKIT
17.4.1.3. BRAFTOVI
17.4.1.4. CYRAMZA
17.4.1.5. ENHERTU
17.4.1.6. LEUCOVORIN CALCIUM
17.4.1.7. LENVIMA
17.4.1.8. LONSURF
17.4.1.9. LYNPARZA
17.4.1.10. NEXAVAR
17.4.1.11. PEMAZYRE
17.4.1.12. QINLOCK
17.4.1.13. STIVARGA
17.4.1.14. SUTENT
17.4.1.15. TARCEVA
17.4.1.16. TECENTRIQ
17.4.1.17. TIBSOVO
17.4.1.18. WELIREG
17.4.1.19. XELODA
17.4.1.20. XERMELO
17.4.2 BRAIN
17.4.2.1. GLEOSTINE
17.4.2.2. MATULANE
17.4.2.3. TEMODAR
17.4.3 BREAST
17.4.3.1. AFINITOR
17.4.3.2. ANASTROZOLE
17.4.3.3. AROMASIN
17.4.3.4. ENHERTU
17.4.3.5. EVEROLIMUS
17.4.3.6. FEMARA
17.4.3.7. IBRANCE
17.4.3.8. KISQALI
17.4.3.9. LYNPARZA
17.4.3.10. MEGACE
17.4.3.11. METHOTREXATE
17.4.3.12. NERLYNX
17.4.3.13. ORSERDU
17.4.3.14. PIQRAY
17.4.3.15. SOLTAMOX
17.4.3.16. TALZENNA
17.4.3.17. TRODELVY
17.4.3.18. TUKYSA
17.4.3.19. TYKERB
17.4.3.20. VERZENIO
17.4.3.21. XELODA
17.4.3.22. OTHERS
17.4.4 GENITOURINARY
17.4.4.1. AFINITOR
17.4.4.2. BAVENCIO
17.4.4.3. CABOMETYX
17.4.4.4. CASODEX
17.4.4.5. ERLEADA
17.4.4.6. FOTIVDA
17.4.4.7. INLYTA
17.4.4.8. LENVIMA
17.4.4.9. LUPRON
17.4.4.10. LYNPARZA
17.4.4.11. NEXAVAR
17.4.4.12. NILANDRON
17.4.4.13. NUBEQA
17.4.4.14. ORGOVYX
17.4.4.15. RAPAMUNE
17.4.4.16. RUBRACA
17.4.4.17. SUTENT
17.4.4.18. TRODELVY
17.4.4.19. VOTRIENT
17.4.4.20. WELIREG
17.4.4.21. XTANDI
17.4.4.22. YONSA
17.4.4.23. ZYTIGA
17.4.5 GYNECOLOGY
17.4.5.1. HEXALEN
17.4.5.2. HYDREA
17.4.5.3. ELAHERE
17.4.5.4. LENVIMA
17.4.5.5. LYNPARZA
17.4.5.6. RUBRACA
17.4.5.7. ZEJULA
17.4.6 HEAD, NECK & THYROID
17.4.6.1. CAPRELSA
17.4.6.2. GAVRETO
17.4.6.3. HYDREA
17.4.6.4. LENVIMA
17.4.6.5. NEXAVAR
17.4.6.6. RETEVMO
17.4.7 HEMATOLOGIC
17.4.7.1. AGRYLIN
17.4.7.2. ALKERAN
17.4.7.3. BESPONSA
17.4.7.4. BESREMI
17.4.7.5. BOSULIF
17.4.7.6. BRUKINSA
17.4.7.7. CALQUENCE
17.4.7.8. COPIKTRA
17.4.7.9. CYTOXAN
17.4.7.10. DOPTELET
17.4.7.11. GLEEVEC
17.4.7.12. HYDREA
17.4.7.13. IDHIFA
17.4.7.14. IMBRUVICA
17.4.7.15. INQOVI
17.4.7.16. INREBIC
17.4.7.17. JAKAFI
17.4.7.18. JAYPIRCA
17.4.7.19. LEUCOVORIN CALCIUM
17.4.7.20. LEUKERAN
17.4.7.21. METHOTREXATE
17.4.7.22. MONJUVI
17.4.7.23. MYLOTARG
17.4.7.24. NINLARO
17.4.7.25. ONUREG
17.4.7.26. POLIVY
17.4.7.27. POMALYST
17.4.7.28. PROMACTA
17.4.7.29. PURINETHOL
17.4.7.30. REVLIMID
17.4.7.31. REZLIDHIA
17.4.7.32. REZUROCK
17.4.7.33. RYDAPT
17.4.7.34. SARCLISA
17.4.7.35. SCEMBLIX
17.4.7.36. SPRYCEL
17.4.7.37. TARGRETIN
17.4.7.38. TASIGNA
17.4.7.39. TAVALISSE
17.4.7.40. THALOMID
17.4.7.41. TIBSOVO
17.4.7.42. TRETINOIN
17.4.7.43. VENCLEXTA
17.4.7.44. VIDAZA
17.4.7.45. VONJO
17.4.7.46. XOSPATA
17.4.7.47. XPOVIO
17.4.7.48. ZYDELIG
17.4.8 LUNG
17.4.8.1. AFINITOR
17.4.8.2. ALECENSA
17.4.8.3. ALUNBRIG
17.4.8.4. COTELLIC
17.4.8.5. CYRAMZA
17.4.8.6. ERLOTINIB
17.4.8.7. EXKIVITY
17.4.8.8. GAVRETO
17.4.8.9. HYCAMTIN
17.4.8.10. IMFINZI
17.4.8.11. IRESSA
17.4.8.12. KRAZATI
17.4.8.13. LORBRENA
17.4.8.14. LUMAKRAS
17.4.8.15. METHOTREXATE
17.4.8.16. PORTRAZZA
17.4.8.17. RETEVMO
17.4.8.18. ROZLYTREK
17.4.8.19. TABRECTA
17.4.8.20. TAGRISSO
17.4.8.21. TEPMETKO
17.4.8.22. VEPESID
17.4.8.23. VIZIMPRO
17.4.8.24. XALKORI
17.4.9 MELANOMA AND BASAL CELL
17.4.9.1. BAVENCIO
17.4.9.2. BRAFTOVI
17.4.9.3. COTELLIC
17.4.9.4. ERIVEDGE
17.4.9.5. MEKINIST
17.4.9.6. MEKTOVI
17.4.9.7. ODOMZO
17.4.9.8. TAFINLAR
17.4.9.9. ZELBORAF
17.4.10 RARE AND COMPLEX THERAPIES
17.4.10.1. CABLIVI
17.4.10.2. ENSPRYNG
17.4.10.3. FYARRO
17.4.10.4. GAMIFANT
17.4.10.5. KINERET
17.4.10.6. LIVTENCITY
17.4.10.7. LUPKYNIS
17.4.10.8. NULIBRY
17.4.10.9. PYRUKYND
17.4.10.10. SKYCLARYS
17.4.10.11. TARPEYO
17.4.10.12. TURALIO
17.4.10.13. VIJOICE
17.4.11 OTHER SPECIALTY PRODUCTS
17.5 OVER THE COUNTER PHARMACEUTICALS
17.5.1 ANTACIDS
17.5.1.1. ALUMINUM CARBONATE ANTACIDS
17.5.1.2. CALCIUM CARBONATE ANTACIDS
17.5.1.3. MAGNESIUM OXIDE ANTACIDS
17.5.1.4. SODIUM BICARBONATE ANTACIDS
17.5.1.5. SODIUM CITRATE ANTACIDS
17.5.1.6. ALUMINUM HYDROXIDE ANTACIDS
17.5.1.7. MAGNESIUM HYDROXIDE ANTACIDS
17.5.1.8. OTHERS
17.5.2 PAIN RELIEF
17.5.2.1. ASPIRIN
17.5.2.2. NAPROXEN
17.5.2.3. IBUPROFEN
17.5.2.4. ACETAMINOPHEN
17.5.2.5. OTHERS
17.5.3 VITAMINS
17.5.3.1. BIOTIN
17.5.3.2. FOLIC ACID
17.5.3.3. THIAMIN
17.5.3.4. RIBOFLAVIN
17.5.3.5. PANTOTHENIC ACID
17.5.3.6. ASCORBIC ACID
17.5.3.7. COBALAMIN
17.5.3.8. PYRIDOXINE
17.5.3.9. NIACIN
17.5.3.10. RETINOIDS AND CAROTENE
17.5.3.11. CHOLINE
17.5.3.12. CALCIFEROL
17.5.3.13. ALPHA-TOCOPHEROL
17.5.3.14. PHYLLOQUINONE
17.5.3.15. MENADIONE
17.5.3.16. OTHERS
17.5.4 MINERALS
17.5.4.1. CALCIUM
17.5.4.2. CHLORIDE
17.5.4.3. CHROMIUM
17.5.4.4. COPPER
17.5.4.5. FLUORIDE
17.5.4.6. IODINE
17.5.4.7. IRON
17.5.4.8. MAGNESIUM
17.5.4.9. MANGANESE
17.5.4.10. MOLYBDENUM
17.5.4.11. PHOSPHORUS
17.5.4.12. POTASSIUM
17.5.4.13. SELENIUM
17.5.4.14. SODIUM
17.5.4.15. SULFUR
17.5.4.16. ZINC
17.5.4.17. OTHERS
17.5.5 DIETARY SUPPLEMENTATION
17.5.5.1. FISH OIL
17.5.5.2. HYDROCIL
17.5.5.3. REGULOID
17.5.5.4. PSYLLIUM
17.5.5.5. METAMUCIL
17.5.5.6. OTHERS
18 GLOBAL PHARMA E-COMMERCE MARKET, BY DRUG TYPE
18.1 OVERVIEW
18.2 BRANDED
18.3 GENERIC
19 GLOBAL PHARMA E-COMMERCE MARKET, BY THERAPEUTICS APPLICATION
19.1 OVERVIEW
19.2 ISCHEMIC HEART DISEASE
19.2.1 PRESCRIPTION MEDICINE
19.2.2 OVER THE COUNTER
19.3 CHRONIC OBSTRUCTIVE PULMONARY DISEASE
19.3.1 PRESCRIPTION MEDICINE
19.3.2 OVER THE COUNTER
19.4 DIARRHEAL DISEASES
19.4.1 PRESCRIPTION MEDICINE
19.4.2 OVER THE COUNTER
19.5 LOWER RESPIRATORY INFECTION
19.5.1 PRESCRIPTION MEDICINE
19.5.2 OVER THE COUNTER
19.6 CEREBROVASCULAR DISEASES
19.6.1 PRESCRIPTION MEDICINE
19.6.2 OVER THE COUNTER
19.7 IRON-DEFICIENCY ANAEMIA
19.7.1 PRESCRIPTION MEDICINE
19.7.2 OVER THE COUNTER
19.8 NEONATAL PRETERM BIRTH
19.8.1 PRESCRIPTION MEDICINE
19.8.2 OVER THE COUNTER
19.9 TUBERCULOSIS
19.9.1 PRESCRIPTION MEDICINE
19.9.2 OVER THE COUNTER
19.1 SENSE ORGAN DISEASES
19.10.1 PRESCRIPTION MEDICINE
19.10.2 OVER THE COUNTER
19.11 CANCER
19.11.1 PRESCRIPTION MEDICINE
19.11.2 OVER THE COUNTER
19.12 INJURIES
19.12.1 PRESCRIPTION MEDICINE
19.12.2 OVER THE COUNTER
19.13 OPHTHALMOLOGY
19.13.1 PRESCRIPTION MEDICINE
19.13.2 OVER THE COUNTER
19.14 DERMATOLOGY
19.14.1 PRESCRIPTION MEDICINE
19.14.2 OVER THE COUNTER
19.15 NEUROLOGY
19.15.1 PRESCRIPTION MEDICINE
19.15.2 OVER THE COUNTER
19.16 ENDOCRINOLOGY
19.16.1 PRESCRIPTION MEDICINE
19.16.2 OVER THE COUNTER
19.17 GASTROINTESTINAL DISORDERS
19.17.1 PRESCRIPTION MEDICINE
19.17.2 OVER THE COUNTER
19.18 AUTOIMMUNE
19.18.1 PRESCRIPTION MEDICINE
19.18.2 OVER THE COUNTER
19.19 OTHERS
20 GLOBAL PHARMA E-COMMERCE MARKET, BY ROUTE OF ADMINISTRATION
20.1 OVERVIEW
20.2 ORAL
20.2.1 TABLETS
20.2.2 CAPSULES
20.2.3 POWDER
20.2.4 PILLS
20.2.5 SYRUPS
20.2.6 OTHERS
20.3 TOPICAL
20.3.1 SOLUTIONS
20.3.2 CREAM
20.3.3 OINTMENT
20.3.4 GELS
20.3.5 LOTIONS
20.3.6 POWDERS
20.3.7 OTHERS
20.4 PARENTERAL
20.5 INTRANASAL
20.5.1 DROPS
20.5.2 SPRAYS
20.5.3 POWDERS
20.5.4 GELS
20.5.5 OTHERS
20.6 OCULAR
20.6.1 EYE DROPS
20.6.2 SPRAYS
20.6.3 OINTMENTS
20.6.4 OTHERS
20.7 OTHERS
21 GLOBAL PHARMA E-COMMERCE MARKET, BY MODEL TYPE
21.1 OVERVIEW
21.2 B2B
21.2.1 B2B2B
21.2.2 B2B2C
21.3 B2C
22 GLOBAL PHARMA E-COMMERCE MARKET, BY PLATFORM TYPE
22.1 OVERVIEW
22.2 MANUFACTURER OWNED DIGITAL COMMERCE
22.3 DISTRIBUTOR/WHOLESALER OWNED DIGITAL COMMERCE
22.4 MANUFACTURER OWNED MARKET PLACE
22.5 3RD PARTY MARKETPLACE
22.6 RETAIL
23 GLOBAL PHARMA E-COMMERCE MARKET, COMPANY LANDSCAPE
23.1 COMPANY SHARE ANALYSIS: NORTH AMERICA
23.2 COMPANY SHARE ANALYSIS: EUROPE
23.3 COMPANY SHARE ANALYSIS: ASIA-PACIFIC
23.4 MERGERS & ACQUISITIONS
23.5 NEW PRODUCT DEVELOPMENT & APPROVALS
23.6 EXPANSIONS
23.7 REGULATORY CHANGES
23.8 PARTNERSHIP AND OTHER STRATEGIC DEVELOPMENTS
24 GLOBAL PHARMA E-COMMERCE MARKET, SWOT AND DBMR ANALYSIS
25 GLOBAL PHARMA E-COMMERCE MARKET, BY REGION
GLOBAL PHARMA E-COMMERCE MARKET, (ALL SEGMENTATION PROVIDED ABOVE IS REPRESENTED IN THIS CHAPTER BY COUNTRY)
25.1 NORTH AMERICA
25.1.1 U.S.
25.1.2 CANADA
25.1.3 MEXICO
25.2 EUROPE
25.2.1 GERMANY
25.2.2 FRANCE
25.2.3 U.K.
25.2.4 HUNGARY
25.2.5 LITHUANIA
25.2.6 AUSTRIA
25.2.7 IRELAND
25.2.8 NORWAY
25.2.9 POLAND
25.2.10 ITALY
25.2.11 SPAIN
25.2.12 RUSSIA
25.2.13 TURKEY
25.2.14 NETHERLANDS
25.2.15 SWITZERLAND
25.2.16 REST OF EUROPE
25.3 ASIA-PACIFIC
25.3.1 JAPAN
25.3.2 CHINA
25.3.3 SOUTH KOREA
25.3.4 INDIA
25.3.5 AUSTRALIA
25.3.6 SINGAPORE
25.3.7 THAILAND
25.3.8 MALAYSIA
25.3.9 INDONESIA
25.3.10 PHILIPPINES
25.3.11 VIETNAM
25.3.12 REST OF ASIA-PACIFIC
25.4 SOUTH AMERICA
25.4.1 BRAZIL
25.4.2 ARGENTINA
25.4.3 PERU
25.4.4 COLOMBIA
25.4.5 VENEZUELA
25.4.6 REST OF SOUTH AMERICA
25.5 MIDDLE EAST AND AFRICA
25.5.1 SOUTH AFRICA
25.5.2 SAUDI ARABIA
25.5.3 UAE
25.5.4 EGYPT
25.5.5 KUWAIT
25.5.6 ISRAEL
25.5.7 REST OF MIDDLE EAST AND AFRICA
25.6 KEY PRIMARY INSIGHTS: BY MAJOR COUNTRIES
26 GLOBAL PHARMA E-COMMERCE MARKET, COMPANY PROFILE
26.1 CVS HEALTH
26.1.1 COMPANY OVERVIEW
26.1.2 REVENUE ANALYSIS
26.1.3 GEOGRAPHIC PRESENCE
26.1.4 PRODUCT PORTFOLIO
26.1.5 RECENT DEVELOPMENTS
26.2 ZUR ROSE GROUP AG
26.2.1 COMPANY OVERVIEW
26.2.2 REVENUE ANALYSIS
26.2.3 GEOGRAPHIC PRESENCE
26.2.4 PRODUCT PORTFOLIO
26.2.5 RECENT DEVELOPMENTS
26.3 WALGREENS BOOTS ALLIANCE
26.3.1 COMPANY OVERVIEW
26.3.2 REVENUE ANALYSIS
26.3.3 GEOGRAPHIC PRESENCE
26.3.4 PRODUCT PORTFOLIO
26.3.5 RECENT DEVELOPMENTS
26.4 TRUECOMMERCE INC.
26.4.1 COMPANY OVERVIEW
26.4.2 REVENUE ANALYSIS
26.4.3 GEOGRAPHIC PRESENCE
26.4.4 PRODUCT PORTFOLIO
26.4.5 RECENT DEVELOPMENTS
26.5 PHARMAHOPERS (WEBHOPERS INFOTECH PVT. LTD)
26.5.1 COMPANY OVERVIEW
26.5.2 REVENUE ANALYSIS
26.5.3 GEOGRAPHIC PRESENCE
26.5.4 PRODUCT PORTFOLIO
26.5.5 RECENT DEVELOPMENTS
26.6 CONSULTATION REMEDIES
26.6.1 COMPANY OVERVIEW
26.6.2 REVENUE ANALYSIS
26.6.3 GEOGRAPHIC PRESENCE
26.6.4 PRODUCT PORTFOLIO
26.6.5 RECENT DEVELOPMENTS
26.7 RETAILIO
26.7.1 COMPANY OVERVIEW
26.7.2 REVENUE ANALYSIS
26.7.3 GEOGRAPHIC PRESENCE
26.7.4 PRODUCT PORTFOLIO
26.7.5 RECENT DEVELOPMENTS
26.8 PHARMAFLAIR
26.8.1 COMPANY OVERVIEW
26.8.2 REVENUE ANALYSIS
26.8.3 GEOGRAPHIC PRESENCE
26.8.4 PRODUCT PORTFOLIO
26.8.5 RECENT DEVELOPMENTS
26.9 LINIMENT PHARMA PRIVATE LIMITED
26.9.1 COMPANY OVERVIEW
26.9.2 REVENUE ANALYSIS
26.9.3 GEOGRAPHIC PRESENCE
26.9.4 PRODUCT PORTFOLIO
26.9.5 RECENT DEVELOPMENTS
26.1 ALIBABA GROUP
26.10.1 COMPANY OVERVIEW
26.10.2 REVENUE ANALYSIS
26.10.3 GEOGRAPHIC PRESENCE
26.10.4 PRODUCT PORTFOLIO
26.10.5 RECENT DEVELOPMENTS
26.11 MERCK & CO., INC.
26.11.1 COMPANY OVERVIEW
26.11.2 REVENUE ANALYSIS
26.11.3 GEOGRAPHIC PRESENCE
26.11.4 PRODUCT PORTFOLIO
26.11.5 RECENT DEVELOPMENTS
26.12 AMAZON.COM, INC.
26.12.1 COMPANY OVERVIEW
26.12.2 REVENUE ANALYSIS
26.12.3 GEOGRAPHIC PRESENCE
26.12.4 PRODUCT PORTFOLIO
26.12.5 RECENT DEVELOPMENTS
26.13 APOTEK HJÄRTAT AB. (ICA GRUPPEN AB)
26.13.1 COMPANY OVERVIEW
26.13.2 REVENUE ANALYSIS
26.13.3 GEOGRAPHIC PRESENCE
26.13.4 PRODUCT PORTFOLIO
26.13.5 RECENT DEVELOPMENTS
26.14 THE KROGER CO.
26.14.1 COMPANY OVERVIEW
26.14.2 REVENUE ANALYSIS
26.14.3 GEOGRAPHIC PRESENCE
26.14.4 PRODUCT PORTFOLIO
26.14.5 RECENT DEVELOPMENTS
26.15 GIANT EAGLE, INC.
26.15.1 COMPANY OVERVIEW
26.15.2 REVENUE ANALYSIS
26.15.3 GEOGRAPHIC PRESENCE
26.15.4 PRODUCT PORTFOLIO
26.15.5 RECENT DEVELOPMENTS
26.16 OPTUM, INC. (UNITEDHEALTH GROUP.)
26.16.1 COMPANY OVERVIEW
26.16.2 REVENUE ANALYSIS
26.16.3 GEOGRAPHIC PRESENCE
26.16.4 PRODUCT PORTFOLIO
26.16.5 RECENT DEVELOPMENTS
26.17 REDCARE PHARMACY.
26.17.1 COMPANY OVERVIEW
26.17.2 REVENUE ANALYSIS
26.17.3 GEOGRAPHIC PRESENCE
26.17.4 PRODUCT PORTFOLIO
26.17.5 RECENT DEVELOPMENTS
26.18 WALMART.
26.18.1 COMPANY OVERVIEW
26.18.2 REVENUE ANALYSIS
26.18.3 GEOGRAPHIC PRESENCE
26.18.4 PRODUCT PORTFOLIO
26.18.5 RECENT DEVELOPMENTS
26.19 DOCMORRIS
26.19.1 COMPANY OVERVIEW
26.19.2 REVENUE ANALYSIS
26.19.3 GEOGRAPHIC PRESENCE
26.19.4 PRODUCT PORTFOLIO
26.19.5 RECENT DEVELOPMENTS
26.2 TABLETKI.UA
26.20.1 COMPANY OVERVIEW
26.20.2 REVENUE ANALYSIS
26.20.3 GEOGRAPHIC PRESENCE
26.20.4 PRODUCT PORTFOLIO
26.20.5 RECENT DEVELOPMENTS
26.21 APOLLO PHARMACY (APOLLO HOSPITALS)
26.21.1 COMPANY OVERVIEW
26.21.2 REVENUE ANALYSIS
26.21.3 GEOGRAPHIC PRESENCE
26.21.4 PRODUCT PORTFOLIO
26.21.5 RECENT DEVELOPMENTS
26.22 PHARMEASY
26.22.1 COMPANY OVERVIEW
26.22.2 REVENUE ANALYSIS
26.22.3 GEOGRAPHIC PRESENCE
26.22.4 PRODUCT PORTFOLIO
26.22.5 RECENT DEVELOPMENTS
26.23 RITE AID CORP.
26.23.1 COMPANY OVERVIEW
26.23.2 REVENUE ANALYSIS
26.23.3 GEOGRAPHIC PRESENCE
26.23.4 PRODUCT PORTFOLIO
26.23.5 RECENT DEVELOPMENTS
26.24 ASNA.
26.24.1 COMPANY OVERVIEW
26.24.2 REVENUE ANALYSIS
26.24.3 GEOGRAPHIC PRESENCE
26.24.4 PRODUCT PORTFOLIO
26.24.5 RECENT DEVELOPMENTS
26.25 MEDPLUSMART.COM.
26.25.1 COMPANY OVERVIEW
26.25.2 REVENUE ANALYSIS
26.25.3 GEOGRAPHIC PRESENCE
26.25.4 PRODUCT PORTFOLIO
26.25.5 RECENT DEVELOPMENTS
26.26 FOOD LION LLC
26.26.1 COMPANY OVERVIEW
26.26.2 REVENUE ANALYSIS
26.26.3 GEOGRAPHIC PRESENCE
26.26.4 PRODUCT PORTFOLIO
26.26.5 RECENT DEVELOPMENTS
26.27 RXSENSE (SINGLECARE)
26.27.1 COMPANY OVERVIEW
26.27.2 REVENUE ANALYSIS
26.27.3 GEOGRAPHIC PRESENCE
26.27.4 PRODUCT PORTFOLIO
26.27.5 RECENT DEVELOPMENTS
26.28 LLC FAMILY PHARMACY APRIL
26.28.1 COMPANY OVERVIEW
26.28.2 REVENUE ANALYSIS
26.28.3 GEOGRAPHIC PRESENCE
26.28.4 PRODUCT PORTFOLIO
26.28.5 RECENT DEVELOPMENTS
26.29 MCKESSON CORPORATION
26.29.1 COMPANY OVERVIEW
26.29.2 REVENUE ANALYSIS
26.29.3 GEOGRAPHIC PRESENCE
26.29.4 PRODUCT PORTFOLIO
26.29.5 RECENT DEVELOPMENTS
26.3 UK MEDS DIRECT LTD
26.30.1 COMPANY OVERVIEW
26.30.2 REVENUE ANALYSIS
26.30.3 GEOGRAPHIC PRESENCE
26.30.4 PRODUCT PORTFOLIO
26.30.5 RECENT DEVELOPMENTS
26.31 DIRK ROSSMANN GMBH
26.31.1 COMPANY OVERVIEW
26.31.2 REVENUE ANALYSIS
26.31.3 GEOGRAPHIC PRESENCE
26.31.4 PRODUCT PORTFOLIO
26.31.5 RECENT DEVELOPMENTS
26.32 AMERISOURCEBERGEN CORPORATION.
26.32.1 COMPANY OVERVIEW
26.32.2 REVENUE ANALYSIS
26.32.3 GEOGRAPHIC PRESENCE
26.32.4 PRODUCT PORTFOLIO
26.32.5 RECENT DEVELOPMENTS
26.33 STOLICHKI
26.33.1 COMPANY OVERVIEW
26.33.2 REVENUE ANALYSIS
26.33.3 GEOGRAPHIC PRESENCE
26.33.4 PRODUCT PORTFOLIO
26.33.5 RECENT DEVELOPMENTS
26.34 RAIA DROGA
26.34.1 COMPANY OVERVIEW
26.34.2 REVENUE ANALYSIS
26.34.3 GEOGRAPHIC PRESENCE
26.34.4 PRODUCT PORTFOLIO
26.34.5 RECENT DEVELOPMENTS
26.35 APTEKA.RU
26.35.1 COMPANY OVERVIEW
26.35.2 REVENUE ANALYSIS
26.35.3 GEOGRAPHIC PRESENCE
26.35.4 PRODUCT PORTFOLIO
26.35.5 RECENT DEVELOPMENTS
26.36 GOODRX
26.36.1 COMPANY OVERVIEW
26.36.2 REVENUE ANALYSIS
26.36.3 GEOGRAPHIC PRESENCE
26.36.4 PRODUCT PORTFOLIO
26.36.5 RECENT DEVELOPMENTS
26.37 CARDINAL HEALTH
26.37.1 COMPANY OVERVIEW
26.37.2 REVENUE ANALYSIS
26.37.3 GEOGRAPHIC PRESENCE
26.37.4 PRODUCT PORTFOLIO
26.37.5 RECENT DEVELOPMENTS
26.37.6
27 RELATED REPORTS
28 CONCLUSION
29 QUESTIONNAIRE
30 ABOUT DATA BRIDGE MARKET RESEARCH
Data collection and base year analysis are done using data collection modules with large sample sizes. The stage includes obtaining market information or related data through various sources and strategies. It includes examining and planning all the data acquired from the past in advance. It likewise envelops the examination of information inconsistencies seen across different information sources. The market data is analysed and estimated using market statistical and coherent models. Also, market share analysis and key trend analysis are the major success factors in the market report. To know more, please request an analyst call or drop down your inquiry.
The key research methodology used by DBMR research team is data triangulation which involves data mining, analysis of the impact of data variables on the market and primary (industry expert) validation. Data models include Vendor Positioning Grid, Market Time Line Analysis, Market Overview and Guide, Company Positioning Grid, Patent Analysis, Pricing Analysis, Company Market Share Analysis, Standards of Measurement, Global versus Regional and Vendor Share Analysis. To know more about the research methodology, drop in an inquiry to speak to our industry experts.
Data Bridge Market Research is a leader in advanced formative research. We take pride in servicing our existing and new customers with data and analysis that match and suits their goal. The report can be customized to include price trend analysis of target brands understanding the market for additional countries (ask for the list of countries), clinical trial results data, literature review, refurbished market and product base analysis. Market analysis of target competitors can be analyzed from technology-based analysis to market portfolio strategies. We can add as many competitors that you require data about in the format and data style you are looking for. Our team of analysts can also provide you data in crude raw excel files pivot tables (Fact book) or can assist you in creating presentations from the data sets available in the report.


