
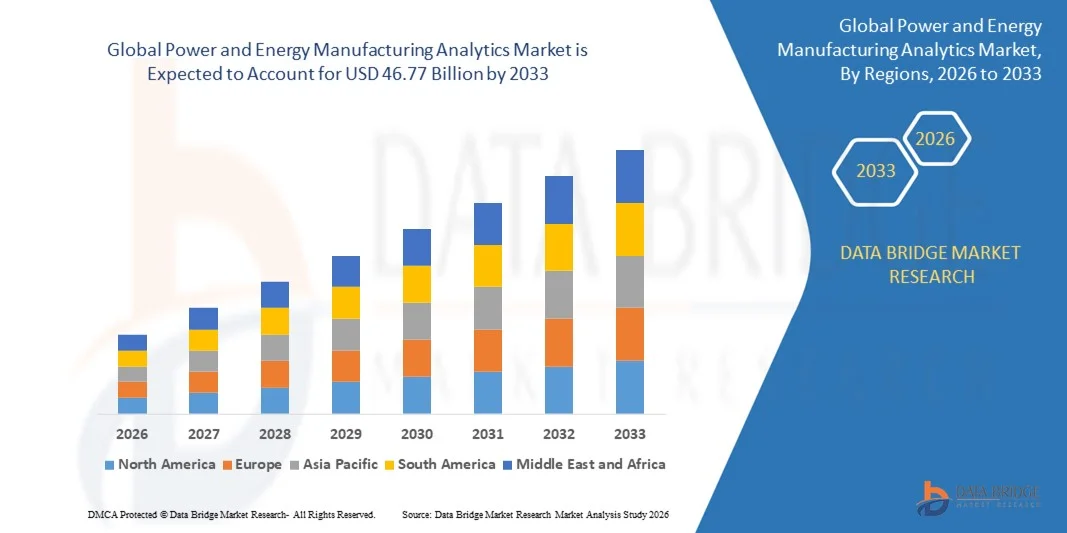
Global Power And Energy Manufacturing Analytics Market
Market Size in USD Billion
 USD
9.59 Billion
USD
46.77 Billion
2025
2033
USD
9.59 Billion
USD
46.77 Billion
2025
2033
| 2026 - 2033 | |
| USD 9.59 Billion | |
| USD 46.77 Billion | |
| % | |
|
What is the Power and Energy Manufacturing Analytics Market Size and Growth Rate ?
- As per Data Bridge Market Research Analysis the global power and energy manufacturing analytics market size was valued at USD 9.59 billion in 2025 and is expected to reach USD 46.77 billion by 2033, at a CAGR of 21.90% during the forecast period
- The market growth is largely fueled by the increasing adoption of digital and connected manufacturing systems, along with advancements in IoT, AI, and cloud-based analytics, enabling manufacturers to monitor energy consumption and optimize operations across various industrial sectors
- Furthermore, rising demand for energy-efficient production, cost optimization, and predictive maintenance is driving manufacturers to implement advanced analytics solutions. These converging factors are accelerating the adoption of power and energy manufacturing analytics, thereby significantly boosting market growth
Market Size & Forecast
- Global Market Value (2025): USD 9.59 billion
- Expected Market Value (2033): USD 46.77 billion
- Forecast CAGR (2026–2033): 21.90%
Power and Energy Manufacturing Analytics Market Analysis
- Power and energy manufacturing analytics solutions, offering real-time monitoring, predictive insights, and operational optimization, are becoming essential tools in modern manufacturing facilities across automotive, aerospace, electronics, chemicals, and industrial equipment sectors due to their ability to enhance energy efficiency and reduce downtime
- The escalating demand for analytics solutions is primarily fueled by the need to improve operational efficiency, comply with sustainability regulations, and adopt smart manufacturing practices, with manufacturers increasingly prioritizing data-driven decision-making to maintain competitiveness and reduce operational costs
- North America dominated the power and energy manufacturing analytics market with a share of 35.5% in 2025, due to increasing investments in smart manufacturing, energy efficiency initiatives, and the adoption of advanced analytics solutions
- Asia-Pacific is expected to be the fastest growing region in the power and energy manufacturing analytics market during the forecast period due to rapid industrialization, increasing energy demands, and adoption of advanced analytics solutions in countries such as China, Japan, and India
- Software segment dominated the market with a market share of 63% in 2025, due to its ability to provide real-time data monitoring, predictive maintenance, and operational efficiency insights. Companies increasingly leverage analytics software to optimize energy consumption, reduce downtime, and enhance overall manufacturing productivity. The software segment also benefits from integration capabilities with existing enterprise resource planning (ERP) systems and IoT devices, offering a unified platform for decision-making. Its role in enabling digital transformation and supporting sustainability goals further reinforces its market leadership
Report Scope and Power and Energy Manufacturing Analytics Market Segmentation
|
Attributes |
Power and Energy Manufacturing Analytics Key Market Insights |
|
Segments Covered |
|
|
Countries Covered |
North America
Europe
Asia-Pacific
Middle East and Africa
South America
|
|
Key Market Players |
|
|
Market Opportunities |
|
|
Value Added Data Infosets |
In addition to the market insights such as market value, growth rate, market segments, geographical coverage, market players, and market scenario, the market report curated by the Data Bridge Market Research team includes in-depth expert analysis, import/export analysis, pricing analysis, production consumption analysis, and pestle analysis. |
Power and Energy Manufacturing Analytics Market Trends
Growing Adoption of AI and IoT-Enabled Energy Analytics
- A significant trend in the power and energy manufacturing analytics market is the increasing adoption of AI, IoT, and cloud-based analytics platforms, driven by the rising need to optimize energy consumption, improve operational efficiency, and enable predictive maintenance across manufacturing sectors. These solutions are becoming integral to modern energy and production systems, providing actionable insights that enhance decision-making and reduce downtime
- For instance, companies such as Schneider Electric and Itron are deploying AI-enabled analytics platforms that provide real-time monitoring and predictive insights for industrial energy management. Such solutions allow manufacturers to identify inefficiencies, forecast energy demand, and reduce operational costs across complex manufacturing setups
- The integration of IoT sensors with analytics platforms is growing rapidly as manufacturers collect vast amounts of operational and energy data. These connected systems enable proactive maintenance, resource optimization, and energy efficiency improvements, positioning analytics as a critical element of smart manufacturing initiatives
- In automotive and aerospace manufacturing, energy analytics solutions are increasingly used to monitor equipment performance, optimize electricity and fuel consumption, and support sustainability goals. This is accelerating the adoption of analytics-driven energy management practices across high-energy-demand sectors
- Electronics, chemicals, and industrial equipment manufacturers are leveraging advanced analytics to detect anomalies, prevent equipment failures, and improve process reliability. This trend is driving stronger preferences for solutions capable of integrating seamlessly with existing enterprise resource planning (ERP) and industrial control systems
- The market is witnessing growth in predictive and prescriptive analytics capabilities, where data from multiple sources is analyzed to suggest actionable improvements. The rising incorporation of AI and IoT analytics is reinforcing the overall transition toward smarter, energy-efficient, and digitally optimized manufacturing operations
Power and Energy Manufacturing Analytics Market Dynamics
Driver
Rising Demand for Energy Efficiency and Operational Optimization
- The growing focus on reducing operational costs, improving energy efficiency, and achieving sustainability targets is driving the adoption of power and energy manufacturing analytics solutions. These solutions enable manufacturers to optimize energy consumption, enhance equipment utilization, and improve overall production efficiency
- For instance, General Electric and IBM offer advanced analytics platforms that help industrial clients monitor energy use, detect inefficiencies, and implement predictive maintenance programs. Such tools empower manufacturers to reduce energy waste, cut operational expenses, and achieve regulatory compliance
- The increasing adoption of Industry 4.0 and smart factory initiatives is fueling demand for analytics solutions that integrate energy management with production monitoring. These platforms allow manufacturers to correlate operational data with energy usage and take corrective actions in real time
- Regulatory pressures and sustainability mandates across global markets are incentivizing manufacturers to adopt analytics-driven energy management solutions. These measures support reduced emissions, improved reporting, and long-term cost savings
- The rise in energy costs and the need for resource optimization further reinforces the reliance on advanced analytics. Manufacturers are deploying solutions that enable proactive energy planning and operational efficiency improvements, thereby driving sustained market growth
Restraint/Challenge
High Implementation Costs and Integration Complexity
- The power and energy manufacturing analytics market faces challenges due to the high costs associated with implementing AI, IoT, and cloud-based analytics platforms across existing manufacturing infrastructures. Initial investment, integration with legacy systems, and ongoing maintenance can be significant barriers for manufacturers
- For instance, deploying end-to-end analytics solutions often requires specialized hardware, software licenses, and skilled personnel, increasing operational expenditure. These factors can limit adoption, especially among small and medium-sized manufacturers
- Integrating analytics platforms with multiple production systems and data sources adds complexity, requiring advanced IT support and customization. Ensuring data accuracy, security, and seamless interoperability further increases deployment difficulty
- Manufacturers must also address challenges related to scalability and real-time data processing, as analytics solutions need to handle large volumes of operational and energy data efficiently. These constraints necessitate additional investments in cloud infrastructure or high-performance computing resources
- The market continues to face hurdles in balancing the benefits of analytics adoption with associated costs and complexity. These challenges collectively require careful planning and strategic investments to realize full value from energy analytics solutions
Power and Energy Manufacturing Analytics Market Scope
The market is segmented on the basis of based on type, deployment model, and end-user.
- By Type
On the basis of type, the power and energy manufacturing analytics market is segmented into software and services. The software segment dominated the market with the largest market revenue share of 63% in 2025, driven by its ability to provide real-time data monitoring, predictive maintenance, and operational efficiency insights. Companies increasingly leverage analytics software to optimize energy consumption, reduce downtime, and enhance overall manufacturing productivity. The software segment also benefits from integration capabilities with existing enterprise resource planning (ERP) systems and IoT devices, offering a unified platform for decision-making. Its role in enabling digital transformation and supporting sustainability goals further reinforces its market leadership.
The services segment is expected to witness the fastest growth rate from 2026 to 2033, fueled by increasing demand for managed analytics, consulting, and implementation support. For instance, companies such as Schneider Electric provide specialized analytics services that help manufacturers optimize energy usage and reduce operational costs. Services facilitate the deployment of advanced analytics solutions without requiring heavy in-house expertise and allow businesses to adopt scalable solutions based on evolving requirements. In addition, service offerings often include continuous monitoring, troubleshooting, and reporting, which enhance operational efficiency and ensure regulatory compliance, making services an attractive choice for many enterprises.
- By Deployment Model
On the basis of deployment model, the market is segmented into on-premises and on-demand (cloud-based) solutions. The on-premises segment held the largest market revenue share in 2025, owing to its high control, data security, and customization capabilities. Manufacturing organizations handling sensitive operational and energy data often prefer on-premises deployment to safeguard critical information while maintaining compliance with industry regulations. On-premises solutions also allow integration with legacy systems, enabling seamless workflows and minimizing disruptions during digital transformation initiatives.
The on-demand segment is anticipated to witness the fastest CAGR from 2026 to 2033, driven by growing adoption of cloud computing and remote monitoring capabilities. For instance, IBM’s cloud-based analytics solutions provide manufacturers with scalable access to energy and production data without requiring heavy upfront investments. On-demand deployment enables real-time insights, predictive maintenance, and remote analytics, supporting flexible operations across multiple facilities. In addition, cloud solutions reduce the need for in-house IT infrastructure, offer automatic updates, and support rapid scalability, making them increasingly popular among small and medium-sized manufacturers.
- By End User
On the basis of end user, the market is segmented into automotive and aerospace manufacturing, electronics equipment manufacturing, food and beverages manufacturing, chemicals and materials manufacturing, machinery and industrial equipment manufacturing, pharma and life sciences, paper, pulp, plastic, and rubber manufacturing, and others. The automotive and aerospace manufacturing segment dominated the market with the largest market revenue share in 2025, due to the high energy demands and complex production processes in these sectors. Analytics solutions help optimize energy usage, reduce production costs, and improve operational efficiency, which are critical in maintaining competitiveness and meeting sustainability targets. The adoption of advanced analytics also supports predictive maintenance, quality assurance, and regulatory compliance, making it indispensable for automotive and aerospace manufacturers.
The electronics equipment manufacturing segment is expected to witness the fastest growth rate from 2026 to 2033, driven by increasing demand for energy-efficient production and smart manufacturing technologies. For instance, Siemens provides analytics solutions tailored to electronics manufacturers, enabling real-time monitoring and predictive energy management. Rapid technological advancements, shorter product lifecycles, and high energy consumption in electronics manufacturing create a strong need for analytics-driven insights. In addition, these solutions enhance production planning, resource allocation, and waste reduction, supporting both operational efficiency and sustainability objectives, which fuels adoption across the sector.
Power and Energy Manufacturing Analytics Market Regional Analysis
- North America dominated the power and energy manufacturing analytics market with the largest revenue share of 35.5% in 2025, driven by increasing investments in smart manufacturing, energy efficiency initiatives, and the adoption of advanced analytics solutions
- Manufacturers in the region highly prioritize data-driven decision-making, operational optimization, and predictive maintenance through analytics solutions, which enhance productivity and reduce energy costs
- This widespread adoption is further supported by robust digital infrastructure, high technological awareness, and the presence of leading analytics and software providers, establishing analytics solutions as a critical tool across multiple manufacturing sectors
U.S. Power and Energy Manufacturing Analytics Market Insight
The U.S. market captured the largest revenue share in North America in 2025, fueled by rapid digitization of manufacturing processes and the growing trend of energy-efficient operations. Manufacturers increasingly adopt predictive and prescriptive analytics to optimize energy consumption, reduce downtime, and enhance process efficiency. The rising integration of cloud-based and on-premises analytics solutions, along with support from government energy efficiency programs, further propels market growth. Focus on sustainability, regulatory compliance, and smart factory initiatives is driving widespread deployment of analytics technologies across automotive, aerospace, and industrial sectors.
Europe Power and Energy Manufacturing Analytics Market Insight
Europe is projected to expand at a substantial CAGR throughout the forecast period, primarily driven by stringent energy efficiency regulations and the push for sustainable manufacturing practices. Countries such as Germany, France, and Italy are witnessing strong adoption of analytics solutions to monitor energy consumption, optimize operations, and reduce carbon emissions. European manufacturers are embracing digital transformation initiatives, including Industry 4.0 frameworks, integrating analytics into production and energy management systems. The focus on industrial automation, coupled with government incentives for energy optimization, supports adoption of advanced analytics solutions across large-scale and mid-sized manufacturing facilities.
U.K. Power and Energy Manufacturing Analytics Market Insight
The U.K. market is anticipated to grow at a noteworthy CAGR during the forecast period, driven by increasing investments in energy management solutions and advanced manufacturing analytics. Manufacturers are adopting analytics solutions to improve operational efficiency, optimize energy usage, and enhance productivity across automotive, aerospace, and electronics sectors. The U.K.’s strong technology ecosystem, along with rising demand for sustainable manufacturing practices and government initiatives supporting smart manufacturing, is expected to continue stimulating market growth.
Germany Power and Energy Manufacturing Analytics Market Insight
Germany is expected to expand at a considerable CAGR during the forecast period, fueled by the country’s emphasis on energy efficiency, digitalization, and industrial innovation. Analytics solutions are increasingly deployed to optimize energy consumption, monitor equipment performance, and support predictive maintenance in automotive, machinery, and chemicals manufacturing. Germany’s well-developed industrial infrastructure, coupled with its focus on Industry 4.0 and sustainability, promotes adoption of energy analytics solutions. Integration with smart manufacturing systems ensures operational efficiency, cost savings, and compliance with environmental regulations, strengthening market growth.
Asia-Pacific Power and Energy Manufacturing Analytics Market Insight
Asia-Pacific is poised to grow at the fastest CAGR during 2026–2033, driven by rapid industrialization, increasing energy demands, and adoption of advanced analytics solutions in countries such as China, Japan, and India. The region’s growing focus on smart manufacturing, supported by government initiatives promoting digitalization and energy efficiency, is driving deployment of analytics solutions. APAC is emerging as a hub for manufacturing analytics software and services, improving affordability and accessibility for small, medium, and large-scale manufacturers. Manufacturers leverage analytics to optimize operations, enhance energy management, and reduce costs, accelerating adoption across automotive, electronics, and industrial equipment sectors.
Japan Power and Energy Manufacturing Analytics Market Insight
Japan is witnessing growth due to rapid industrial modernization, high technological adoption, and increasing focus on energy-efficient manufacturing. Analytics solutions are deployed extensively to monitor energy usage, optimize production processes, and support predictive maintenance in automotive, electronics, and machinery manufacturing. Integration of analytics with IoT and smart factory systems enables improved productivity, reduced downtime, and achievement of sustainability targets. Japan’s aging workforce also encourages adoption of user-friendly analytics solutions to simplify operations and ensure consistent manufacturing efficiency.
China Power and Energy Manufacturing Analytics Market Insight
China accounted for the largest market revenue share in Asia-Pacific in 2025, attributed to rapid industrial growth, expanding manufacturing base, and strong adoption of digital solutions. Analytics solutions are increasingly used to monitor energy consumption, optimize operational efficiency, and support sustainable manufacturing practices across automotive, electronics, and chemical sectors. Government initiatives promoting smart factories, energy optimization, and digital transformation are key drivers. The presence of domestic analytics solution providers and competitive pricing further encourages adoption, establishing China as a leading market for power and energy manufacturing analytics in the region.
Power and Energy Manufacturing Analytics Market Share
The power and energy manufacturing analytics industry is primarily led by well-established companies, including:
- Oracle Corporation (U.S.)
- SAP SE (Germany)
- Zensar Technologies Ltd. (India)
- SAS Institute Inc. (U.S.)
- DXC Technology Company (U.S.)
- Tableau Software, LLC (U.S.)
- TIBCO Software Inc. (U.S.)
- Alteryx, Inc. (U.S.)
- 1010data (U.S.)
- IBM Corporation (U.S.)
- Sisense Inc. (U.S.)
- StatSoft Europe (Germany)
- Wipro Limited (India)
- General Electric (U.S.)
- BRIDGEi2i Analytics (India)
- Cisco Systems, Inc. (U.S.)
- FICO (U.S.)
- Microsoft Corporation (U.S.)
- Civis Analytics (U.S.)
- RapidMiner, Inc. (U.S.)
Latest Developments in Global Power and Energy Manufacturing Analytics Market
- In November 2025, Schneider Electric launched the One Digital Grid Platform, an AI-enabled, integrated software solution designed to modernize grid operations, enhance resilience, and improve energy cost management. The platform supports predictive maintenance, real-time monitoring, and optimized operational planning, which accelerates the adoption of analytics-driven energy solutions by utilities. This launch reinforces the market trend of integrating AI and analytics into energy management systems, positioning advanced software as a critical tool for grid modernization
- In June 2025, PowerGEM acquired Marquette Energy Analytics (MEA), combining MEA’s demand-forecasting software and services for gas and electric utilities with PowerGEM’s existing simulation platforms. This acquisition significantly enhances the market’s capability to provide precise energy demand predictions and operational insights, enabling utilities to better manage supply risks, improve resource allocation, and optimize overall energy efficiency. The combined expertise strengthens the adoption of analytics solutions across the energy sector and expands the potential customer base for advanced analytics technologies
- In March 2025, Itron and Schneider Electric expanded their collaboration, integrating their solutions with cloud and AI capabilities to deliver a comprehensive Grid Edge Intelligence platform. This enables utilities to gain real-time visibility into distributed energy resources, optimize grid performance, and enhance predictive maintenance. The development strengthens market demand for edge analytics and integrated energy management platforms, promoting more efficient and resilient energy distribution networks
- In March 2025, Microsoft partnered with Itron to integrate generative AI into Itron’s Intelligent Edge Operating System, allowing utilities to interact with complex grid, metering, and distribution data through natural-language queries. This reduces technical barriers for utilities, accelerates data-driven decision-making, and promotes the adoption of AI-powered analytics for operational optimization. The collaboration emphasizes the growing role of AI and cloud-based analytics in the energy sector
SKU-

- Interactive Data Analysis Dashboard
- Company Analysis Dashboard for high growth potential opportunities
- Research Analyst Access for customization & queries
- Competitor Analysis with Interactive dashboard
- Latest News, Updates & Trend analysis
- Harness the Power of Benchmark Analysis for Comprehensive Competitor Tracking
Data collection and base year analysis are done using data collection modules with large sample sizes. The stage includes obtaining market information or related data through various sources and strategies. It includes examining and planning all the data acquired from the past in advance. It likewise envelops the examination of information inconsistencies seen across different information sources. The market data is analysed and estimated using market statistical and coherent models. Also, market share analysis and key trend analysis are the major success factors in the market report. To know more, please request an analyst call or drop down your inquiry.
The key research methodology used by DBMR research team is data triangulation which involves data mining, analysis of the impact of data variables on the market and primary (industry expert) validation. Data models include Vendor Positioning Grid, Market Time Line Analysis, Market Overview and Guide, Company Positioning Grid, Patent Analysis, Pricing Analysis, Company Market Share Analysis, Standards of Measurement, Global versus Regional and Vendor Share Analysis. To know more about the research methodology, drop in an inquiry to speak to our industry experts.
Data Bridge Market Research is a leader in advanced formative research. We take pride in servicing our existing and new customers with data and analysis that match and suits their goal. The report can be customized to include price trend analysis of target brands understanding the market for additional countries (ask for the list of countries), clinical trial results data, literature review, refurbished market and product base analysis. Market analysis of target competitors can be analyzed from technology-based analysis to market portfolio strategies. We can add as many competitors that you require data about in the format and data style you are looking for. Our team of analysts can also provide you data in crude raw excel files pivot tables (Fact book) or can assist you in creating presentations from the data sets available in the report.


