
Global Power Over Ethernet Poe Lighting Market
Market Size in USD Billion
 USD
1.57 Billion
USD
17.79 Billion
2025
2033
USD
1.57 Billion
USD
17.79 Billion
2025
2033
| 2026 - 2033 | |
| USD 1.57 Billion | |
| USD 17.79 Billion | |
| % | |
|
Power Over Ethernet (PoE) Lighting Market Size
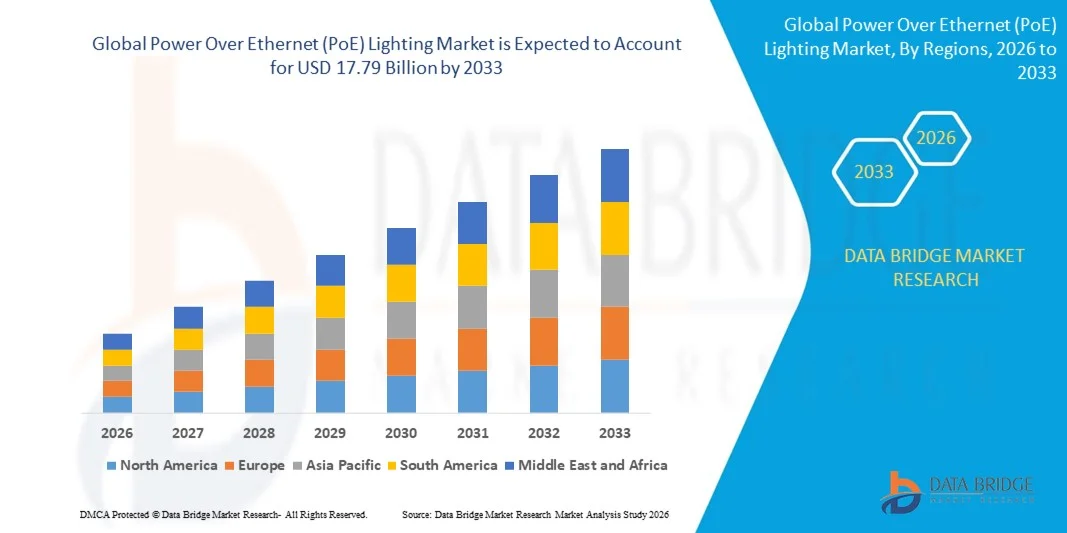
- The global power over ethernet (PoE) lighting market size was valued at USD 1.57 billion in 2025 and is expected to reach USD 17.79 billion by 2033, at a CAGR of 35.40% during the forecast period
- The market growth is largely fuelled by the increasing adoption of smart building technologies and IoT-enabled lighting solutions, which reduce energy consumption and enable centralized control
- Growing demand for energy-efficient and cost-effective lighting solutions in commercial, industrial, and residential sectors is driving market expansion
Power Over Ethernet (PoE) Lighting Market Analysis
- The PoE lighting market is witnessing significant technological advancements, including integration with sensors, smart controls, and building management systems, enhancing operational efficiency and user convenience
- Increasing investment in commercial infrastructure, smart offices, and IoT-enabled smart cities is creating substantial opportunities for PoE lighting adoption, with demand surging across regions such as North America, Europe, and Asia-Pacific
- North America dominated the Power Over Ethernet (PoE) lighting market with the largest revenue share of 38.50% in 2025, driven by the growing adoption of smart building initiatives, energy-efficient infrastructure, and increased awareness of IoT-integrated lighting solutions
- Asia-Pacific region is expected to witness the highest growth rate in the global power over ethernet (PoE) lighting market, driven by government initiatives supporting smart cities, increasing adoption of IoT-based infrastructure, and expanding commercial and industrial construction activities
- The Up to 25 Watts segment held the largest market revenue share in 2025, driven by its energy efficiency, suitability for small- to medium-sized spaces, and ease of integration with smart building systems. Low-wattage PoE lighting is particularly popular in office spaces, residential units, and classrooms, offering sufficient illumination while reducing electricity consumption and operational costs
Report Scope and Power Over Ethernet (PoE) Lighting Market Segmentation
|
Attributes |
Power Over Ethernet (PoE) Lighting Key Market Insights |
|
Segments Covered |
|
|
Countries Covered |
North America
Europe
Asia-Pacific
Middle East and Africa
South America
|
|
Key Market Players |
• Signify Holding (Netherlands) |
|
Market Opportunities |
|
|
Value Added Data Infosets |
In addition to the insights on market scenarios such as market value, growth rate, segmentation, geographical coverage, and major players, the market reports curated by the Data Bridge Market Research also include in-depth expert analysis, geographically represented company-wise production and capacity, network layouts of distributors and partners, detailed and updated price trend analysis and deficit analysis of supply chain and demand. |
Power Over Ethernet (PoE) Lighting Market Trends
Rise of Smart And Energy-Efficient PoE Lighting Solutions
- The growing shift toward smart and energy-efficient Power over Ethernet (PoE) lighting is transforming the commercial and residential lighting landscape by enabling centralized control, reduced energy consumption, and enhanced connectivity. These systems allow real-time monitoring and automated lighting adjustments, improving operational efficiency and lowering electricity costs. The integration with IoT sensors and occupancy-based controls further optimizes energy use while enhancing building sustainability
- The high demand for IoT-integrated and networked lighting in smart buildings is accelerating the adoption of PoE-enabled fixtures and controllers. These solutions are particularly effective in office spaces, campuses, and multi-story buildings, enabling remote management, data-driven lighting schedules, and predictive maintenance. PoE lighting also facilitates interoperability with security and HVAC systems, creating smarter, more responsive environments
- The affordability, ease of installation, and scalability of modern PoE lighting systems are making them attractive for retrofitting existing infrastructures and new construction projects, leading to reduced energy expenses and enhanced user experience. Facility managers benefit from simplified wiring and centralized management, while building owners see lower operational costs and faster ROI on energy investments
- For instance, in 2024, several corporate campuses in North America reported up to 30% energy savings and improved operational control after implementing PoE lighting systems integrated with building management platforms. These deployments also enhanced occupant comfort and sustainability initiatives, while enabling data analytics for predictive maintenance and system optimization
- While PoE lighting solutions are improving energy efficiency and smart building integration, their impact depends on continued technology innovation, compatibility with existing IT infrastructure, and user adoption. Vendors must focus on robust networking protocols, scalable deployment, cost-effective solutions, and integration with emerging IoT platforms to fully capitalize on growing demand
Power Over Ethernet (PoE) Lighting Market Dynamics
Driver
Growing Adoption of Smart Buildings and Energy-Efficient Infrastructure
- The rise in smart building initiatives and demand for energy-efficient infrastructure is driving strong adoption of PoE lighting solutions. Organizations are increasingly prioritizing reduced operational costs, improved energy management, and intelligent lighting controls. The combination of energy savings, automated controls, and predictive maintenance strengthens the business case for large-scale deployment
- Facility managers and building owners are becoming more aware of the benefits of PoE lighting, including centralized control, simplified installation, and integration with IoT devices, which enhances occupant comfort, reduces downtime, and supports sustainability goals. Advanced analytics and remote monitoring capabilities further improve facility management efficiency and occupant satisfaction
- Government policies and green building certifications are strengthening the demand for energy-efficient lighting systems. Initiatives such as LEED, BREEAM, and local energy-efficiency mandates are motivating organizations to implement PoE lighting solutions. Incentives and subsidies for energy-efficient lighting projects also provide financial support, boosting adoption rates
- For instance, in 2023, several European corporate offices adopted PoE lighting to comply with energy-efficiency standards and reduce operational expenditures, resulting in enhanced building automation and improved employee satisfaction. The integration with building management systems also enabled predictive maintenance and real-time energy monitoring, enhancing long-term operational efficiency
- While smart building adoption and energy regulations are driving growth, there is still a strong need for PoE solutions that are cost-effective, easy to integrate with existing infrastructure, and compatible with multiple IoT platforms. Focus on modular, scalable, and interoperable systems will be critical for sustaining market expansion
Restraint/Challenge
High Initial Investment and Integration Complexity
- The high upfront cost of PoE lighting systems, including switches, controllers, and fixtures, makes them less accessible for small-scale commercial projects and budget-conscious organizations. Capital expenditure remains a significant barrier to adoption, particularly for retrofits in existing buildings with complex wiring
- In many regions, limited technical expertise and insufficient IT infrastructure hinder effective deployment and management of PoE lighting systems. Organizations may face challenges in installation, configuration, and ongoing network maintenance, reducing overall system efficiency. The lack of trained personnel can also increase project timelines and operational risks
- Market penetration is also restricted by compatibility issues with legacy lighting systems, complex networking requirements, and concerns regarding data security. These challenges often delay adoption or lead to hybrid solutions with limited benefits. Integration with existing IoT ecosystems and proper cybersecurity measures are critical to maximize functionality
- For instance, in 2023, several small and medium-sized enterprises in APAC delayed PoE lighting implementation due to integration concerns with existing building networks and high initial investment costs. Organizations struggled with network planning, device compatibility, and scaling deployments efficiently across multiple sites
- While PoE technologies continue to evolve, addressing cost, technical skill gaps, and integration challenges is crucial. Vendors must focus on user-friendly, scalable, and affordable solutions, robust installation support, and training programs to unlock long-term market potential and accelerate adoption across diverse building types
Power Over Ethernet (PoE) Lighting Market Scope
The Power Over Ethernet (PoE) lighting market is segmented into four notable segments based on wattage, offering, application, and end user.
- By Wattage
On the basis of wattage, the market is segmented into Up to 25 Watts and Greater Than 25 Watts. The Up to 25 Watts segment held the largest market revenue share in 2025, driven by its energy efficiency, suitability for small- to medium-sized spaces, and ease of integration with smart building systems. Low-wattage PoE lighting is particularly popular in office spaces, residential units, and classrooms, offering sufficient illumination while reducing electricity consumption and operational costs.
The Greater Than 25 Watts segment is expected to witness the fastest growth rate from 2026 to 2033, fueled by demand for high-intensity lighting solutions in commercial complexes, industrial facilities, and large-scale infrastructure projects.
- By Offering
On the basis of offering, the market is segmented into Software and Services and Hardware. The Hardware segment accounted for the largest revenue share in 2025, driven by the widespread adoption of PoE-enabled fixtures, controllers, and switches that simplify installation and improve energy management.
The Software and Services segment is expected to witness the fastest growth from 2026 to 2033, owing to increasing demand for intelligent lighting management platforms, remote monitoring solutions, and integration with building automation systems, which enable real-time control, predictive maintenance, and analytics-based decision-making.
- By Application
On the basis of application, the market is segmented into Connectivity, Infotainment, LED Lighting Control, Security and Access Control, and Others. The LED Lighting Control segment held the largest market revenue share in 2025, driven by the growing emphasis on energy-efficient illumination, IoT-enabled lighting networks, and centralized management in smart buildings.
The Security and Access Control segment is expected to register the fastest growth rate from 2026 to 2033, fueled by increasing adoption of PoE lighting in conjunction with smart security systems for offices, commercial spaces, and industrial facilities, ensuring integrated and safe environments.
- By End User
On the basis of end user, the market is segmented into Residential, Commercial, and Industrial. The Commercial segment accounted for the largest revenue share in 2025, driven by rapid adoption in office buildings, educational institutions, and corporate campuses seeking energy efficiency, automation, and IoT connectivity.
The Industrial segment is expected to witness the fastest growth from 2026 to 2033, owing to rising demand for high-performance PoE lighting in factories, warehouses, and manufacturing plants, where operational efficiency, centralized control, and predictive maintenance are crucial for productivity and cost reduction.
Power Over Ethernet (PoE) Lighting Market Regional Analysis
- North America dominated the Power Over Ethernet (PoE) lighting market with the largest revenue share of 38.50% in 2025, driven by the growing adoption of smart building initiatives, energy-efficient infrastructure, and increased awareness of IoT-integrated lighting solutions
- Consumers and facility managers in the region highly value centralized control, real-time energy monitoring, and automation features offered by PoE lighting systems, which enhance operational efficiency and reduce electricity costs
- This widespread adoption is further supported by advanced IT infrastructure, high disposable incomes, and corporate sustainability goals, establishing PoE lighting as a preferred solution for commercial, industrial, and residential applications
U.S. PoE Lighting Market Insight
The U.S. PoE lighting market captured the largest revenue share in 2025 within North America, fueled by rapid smart building deployment and the demand for energy-efficient, connected lighting solutions. Organizations are increasingly implementing centralized lighting management systems to optimize energy use and integrate with IoT platforms. Growing awareness of LEED and other green building certifications, combined with corporate sustainability mandates, is further accelerating adoption. Moreover, the U.S. market benefits from advanced IT infrastructure, enabling seamless integration of PoE lighting with building management systems, driving market expansion.
Europe PoE Lighting Market Insight
The Europe PoE lighting market is expected to witness the fastest growth rate from 2026 to 2033, primarily driven by stringent energy-efficiency regulations and the increasing need for connected lighting in commercial and industrial spaces. Urbanization and smart city initiatives are fostering adoption, while European consumers and businesses value the energy savings and enhanced operational control these systems offer. Significant growth is seen across offices, campuses, and multi-story residential buildings, with PoE lighting being incorporated into both new construction and retrofitting projects.
U.K. PoE Lighting Market Insight
The U.K. PoE lighting market is expected to witness the fastest growth rate from 2026 to 2033, driven by the adoption of smart building technologies, energy efficiency mandates, and corporate sustainability goals. Concerns about high energy costs and environmental impact are motivating organizations to invest in PoE lighting solutions. The country’s strong IT infrastructure, coupled with robust commercial and industrial construction activities, is expected to continue supporting market growth and the integration of intelligent lighting management systems.
Germany PoE Lighting Market Insight
The Germany PoE lighting market is expected to witness the fastest growth rate from 2026 to 2033, fueled by strict energy regulations, rising awareness of sustainable infrastructure, and the push for smart buildings. Germany’s emphasis on innovation, energy efficiency, and IoT integration promotes the adoption of PoE lighting in commercial and industrial buildings. The integration of PoE lighting with building management and automation systems is also becoming increasingly prevalent, supporting both operational efficiency and compliance with local energy standards.
Asia-Pacific PoE Lighting Market Insight
The Asia-Pacific PoE lighting market is expected to witness the fastest growth rate from 2026 to 2033, driven by rapid urbanization, increasing disposable incomes, and the proliferation of smart buildings in countries such as China, Japan, and India. Government initiatives promoting digitalization and energy-efficient infrastructure are accelerating adoption. Furthermore, APAC is emerging as a hub for PoE lighting component manufacturing, enhancing affordability and accessibility, which is expanding the market to a broader commercial and residential customer base.
Japan PoE Lighting Market Insight
The Japan PoE lighting market is expected to witness the fastest growth rate from 2026 to 2033, due to high technological adoption, energy efficiency awareness, and the trend toward connected smart homes and commercial buildings. Japanese consumers and businesses are increasingly prioritizing centralized lighting control, operational efficiency, and sustainable solutions. Integration with IoT and building automation systems is driving adoption, while aging infrastructure modernization projects further contribute to market growth.
China PoE Lighting Market Insight
The China PoE lighting market accounted for the largest market revenue share in Asia Pacific in 2025, driven by the country’s rapid urbanization, expanding middle class, and high adoption of smart building technologies. China is a major manufacturing hub for PoE lighting systems, offering affordable and scalable solutions. The push toward smart cities, coupled with corporate sustainability initiatives and large-scale commercial and industrial construction projects, is significantly propelling the adoption of PoE lighting solutions across the country.
Power Over Ethernet (PoE) Lighting Market Share
The Power Over Ethernet (PoE) Lighting industry is primarily led by well-established companies, including:
• Signify Holding (Netherlands)
• IDEAL INDUSTRIES, INC. (U.S.)
• Hubbell (U.S.)
• H.E. Williams, Inc. (U.S.)
• Innovative Lighting LLC. (U.S.)
• Deco Lighting, Inc. (U.S.)
• Cooper Lighting Solutions (U.S.)
• NAME Energy Group (U.S.)
• Ubiquiti Networks, Inc. (U.S.)
• ALLNET GmbH Computersysteme (Germany)
• Cisco (U.S.)
• IGOR INC. (U.S.)
• NuLEDs, Inc. (U.S.)
• Molex, LLC (U.S.)
• Leviton Manufacturing Co., Inc. (U.S.)
• Microsemi (U.S.)
• NETGEAR (U.S.)
• Wipro Lighting (India)
• MICROSENS (Germany)
• Texas Instruments Incorporated (U.S.)
Latest Developments in Global Power Over Ethernet (PoE) Lighting Market
- In July 2022, Ethernet Alliance, a global consortium advancing Ethernet technologies, introduced PoE Certification Gen 2 testing in Taipei, Taiwan, in collaboration with UL Solutions. This development allows manufacturers to pursue both Gen1 and Gen2 certification through third-party labs in Asia-Pacific and North America, or via approved in-house testing. The initiative enhances standardization, ensures device interoperability, and accelerates global adoption of PoE solutions across commercial and industrial networks
- In June 2022, ON-Semi launched two comprehensive system solutions supporting popular building automation protocols, Power over Ethernet (PoE) and KNX. These System-in-Package (SiP) solutions simplify the development of access panels and controllers, offering certified performance and streamlined integration. The launch is expected to boost adoption of PoE-enabled automation systems and improve efficiency for smart building deployments
- In April 2022, NETGEAR, Inc. introduced the Insight Managed WiFi 6 AX3000 Dualband Multi-Gig PoE Access Point (WAX615) for small-to-mid-sized businesses. This access point delivers high-performance dual-band Wi-Fi 6 connectivity with multi-gig PoE support, remote cloud management via NETGEAR Insight, and Instant Mesh capabilities. The launch enhances network reliability, simplifies deployment, and strengthens SMB adoption of PoE-enabled networking solutions
SKU-

- Interactive Data Analysis Dashboard
- Company Analysis Dashboard for high growth potential opportunities
- Research Analyst Access for customization & queries
- Competitor Analysis with Interactive dashboard
- Latest News, Updates & Trend analysis
- Harness the Power of Benchmark Analysis for Comprehensive Competitor Tracking
Global Power Over Ethernet Poe Lighting Market, Supply Chain Analysis and Ecosystem Framework
To support market growth and help clients navigate the impact of geopolitical shifts, DBMR has integrated in-depth supply chain analysis into its Global Power Over Ethernet Poe Lighting Market research reports. This addition empowers clients to respond effectively to global changes affecting their industries. The supply chain analysis section includes detailed insights such as Global Power Over Ethernet Poe Lighting Market consumption and production by country, price trend analysis, the impact of tariffs and geopolitical developments, and import and export trends by country and HSN code. It also highlights major suppliers with data on production capacity and company profiles, as well as key importers and exporters. In addition to research, DBMR offers specialized supply chain consulting services backed by over a decade of experience, providing solutions like supplier discovery, supplier risk assessment, price trend analysis, impact evaluation of inflation and trade route changes, and comprehensive market trend analysis.
Data collection and base year analysis are done using data collection modules with large sample sizes. The stage includes obtaining market information or related data through various sources and strategies. It includes examining and planning all the data acquired from the past in advance. It likewise envelops the examination of information inconsistencies seen across different information sources. The market data is analysed and estimated using market statistical and coherent models. Also, market share analysis and key trend analysis are the major success factors in the market report. To know more, please request an analyst call or drop down your inquiry.
The key research methodology used by DBMR research team is data triangulation which involves data mining, analysis of the impact of data variables on the market and primary (industry expert) validation. Data models include Vendor Positioning Grid, Market Time Line Analysis, Market Overview and Guide, Company Positioning Grid, Patent Analysis, Pricing Analysis, Company Market Share Analysis, Standards of Measurement, Global versus Regional and Vendor Share Analysis. To know more about the research methodology, drop in an inquiry to speak to our industry experts.
Data Bridge Market Research is a leader in advanced formative research. We take pride in servicing our existing and new customers with data and analysis that match and suits their goal. The report can be customized to include price trend analysis of target brands understanding the market for additional countries (ask for the list of countries), clinical trial results data, literature review, refurbished market and product base analysis. Market analysis of target competitors can be analyzed from technology-based analysis to market portfolio strategies. We can add as many competitors that you require data about in the format and data style you are looking for. Our team of analysts can also provide you data in crude raw excel files pivot tables (Fact book) or can assist you in creating presentations from the data sets available in the report.


