
Global Power Supply Market
Market Size in USD Billion
 USD
39.49 Billion
USD
62.38 Billion
2024
2032
USD
39.49 Billion
USD
62.38 Billion
2024
2032
| 2025 - 2032 | |
| USD 39.49 Billion | |
| USD 62.38 Billion | |
| % | |
|
Power Supply Market Size
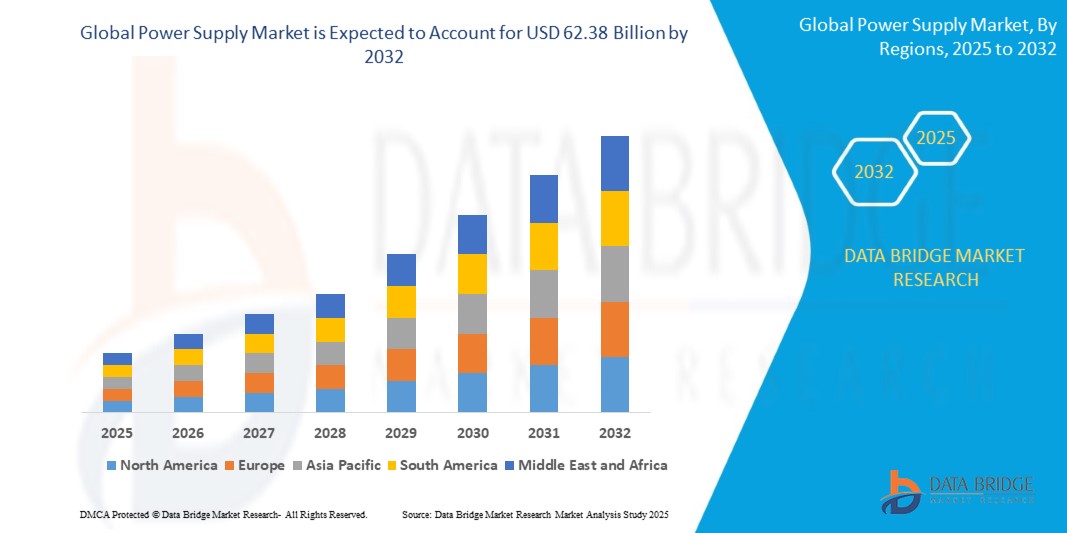
- The global power supply market was valued at USD 39.49 billion in 2024 and is expected to reach USD 62.38 billion by 2032
- During the forecast period of 2025 to 2032 the market is likely to grow at a CAGR of 6.75%, primarily driven by the expansion of industrial automation and growing demand for consumer electronics
- This growth is driven by factors such as the increasing adoption of energy-efficient power supplies, rising demand for renewable energy integration, and advancements in power management technologies
Power Supply Market Analysis
- Power supplies are essential components used to convert and regulate electric power for a wide range of end-use applications including industrial automation, consumer electronics, telecommunications, and healthcare equipment
- The demand for power supplies is significantly driven by the accelerating shift toward energy-efficient systems and the electrification of industrial processes.
- For instance, TDK Corporation launched a new series of AC-DC power supplies (CUS400M) in February 2024, designed for medical and industrial applications, emphasizing efficiency and compact design. Such developments reflect growing industry needs for flexible and high-performance solutions
- North America dominates the power supply market, driven by advanced infrastructure, high adoption of renewable energy solutions, and a strong presence of key market players in the region
- Globally, power supplies are increasingly central to the deployment of renewable energy systems and electric vehicles
Report Scope and Power Supply Market Segmentation
|
Attributes |
Power Supply Key Market Insights |
|
Segments Covered |
|
|
Countries Covered |
North America
Europe
Asia-Pacific
Middle East and Africa
South America
|
|
Key Market Players |
|
|
Market Opportunities |
|
|
Value Added Data Infosets |
In addition to the insights on market scenarios such as market value, growth rate, segmentation, geographical coverage, and major players, the market reports curated by the Data Bridge Market Research also include import export analysis, production capacity overview, production consumption analysis, price trend analysis, climate change scenario, supply chain analysis, value chain analysis, raw material/consumables overview, vendor selection criteria, PESTLE Analysis, Porter Analysis, and regulatory framework. |
Power Supply Market Trends
“Increased Adoption of Smart Grid and Renewable Energy Integration”
- One prominent trend in the global power supply market is the increasing adoption of smart grid technology and the integration of renewable energy sources
- Smart grids are being widely deployed to enhance electricity distribution efficiency and reliability
- For instance, The incorporation of smart grids allows for better management of electricity flow, reduces outages, and enhances grid reliability by automatically rerouting power during faults. This was highlighted in 2023 when Pacific Gas and Electric (PG&E) began rolling out a smart grid system across California, improving grid stability and enabling better energy management
- The integration of renewable energy sources, such as solar and wind, is also shaping the market
- These trends are transforming the power supply infrastructure by improving energy efficiency, enabling better demand response, and reducing carbon emissions, contributing to an increased demand for modern power supply systems in the market
Power Supply Market Dynamics
Driver
“Growing Need Due to Rising Demand for Renewable Energy and Electrification”
- The growing need for sustainable energy solutions and the ongoing shift toward electrification are significantly driving the demand for power supply systems
- The global transition to renewable energy sources such as solar, wind, and hydroelectric power is accelerating, creating a need for reliable and efficient power supply systems that can handle intermittent and decentralized energy generation
- In addition, the electrification of various sectors, including transportation (e.g., electric vehicles) and industry, is fueling the demand for more resilient and scalable power supply systems
- In particular, the growing demand for electric vehicles (EVs) has resulted in an increase in the need for robust power supplies capable of supporting high-voltage charging infrastructure
- As governments worldwide set ambitious targets for carbon emission reductions and renewable energy adoption, the demand for power supply solutions that support green energy initiatives continues to rise
For instance,
- In March 2024, the European Commission announced its “Green Deal” initiative, aiming for Europe to become the first climate-neutral continent by 2050. This ambitious plan emphasizes the adoption of renewable energy and the electrification of various sectors, which directly impacts the need for more advanced and reliable power supply systems to support renewable energy grids and electric transportation networks
- As the need for renewable energy integration and electrification grows, the demand for efficient and scalable power supply solutions continues to rise, driving innovation and investment in the power supply market
Opportunity
“Advancing Power Supply Systems with Artificial Intelligence and Automation”
- AI-powered power supply systems can enhance grid management, improve efficiency, and optimize energy distribution, creating significant opportunities in the power supply market
- AI algorithms can analyze real-time energy usage data and forecast energy demand, allowing power supply systems to respond dynamically to changes in demand and supply. This helps utilities manage electricity flow more efficiently and reduce energy wastage
- In addition, AI can automate the detection and resolution of faults in the power grid, minimizing downtime and improving system reliability. By leveraging machine learning, AI systems can predict potential equipment failures and proactively schedule maintenance, reducing costly outages
For instance,
- In January 2024, Siemens Energy introduced an AI-powered energy management system that integrates with existing power grids to enhance efficiency and reduce operational costs. The system uses real-time data and predictive analytics to optimize energy distribution, forecast peak demand, and improve grid reliability, which supports both renewable energy integration and energy conservation efforts
- The integration of AI into power supply systems not only supports more efficient energy management but also enables predictive maintenance, reducing operational costs and improving system longevity
- This trend presents an opportunity for increased investment in AI-powered technologies that can transform the power supply sector, making it more sustainable and reliable for the future
Restraint/Challenge
“High Capital and Installation Costs Limiting Adoption”
- The high initial cost of advanced power supply systems and their installation is a significant challenge for the global market, particularly in developing countries and for smaller businesses or utilities with limited budgets
- These systems, especially those integrated with renewable energy solutions or advanced smart grid technologies, can require a substantial financial investment, ranging from millions to billions of dollars depending on the scale and complexity of the project
- The high costs of these systems can deter smaller utilities, municipalities, and industries from adopting newer, more efficient power solutions, forcing them to continue using outdated and less efficient infrastructure
For instance,
- December 2023, an article published by the International Energy Agency (IEA) highlighted the challenge of high upfront costs for renewable energy infrastructure and smart grid technologies in developing regions. The report noted that despite the long-term benefits of these systems, the initial financial burden often restricts adoption, particularly in countries with limited access to financing
- Consequently, the financial barrier to adopting advanced power supply systems can result in slower progress toward renewable energy adoption, reduced efficiency in power distribution, and missed opportunities for energy conservation and emission reductions. This challenge significantly hinders the growth and expansion of the power supply market, especially in emerging economies
Power Supply Market Scope
The market is segmented on the basis of vertical, type, and output power.
|
Segmentation |
Sub-Segmentation |
|
By Vertical |
|
|
By Type |
|
|
By Output Power |
|
Power Supply Market Regional Analysis
“North America is the Dominant Region in the Power Supply Market”
- North America dominates the power supply market, driven by advanced infrastructure, high adoption of renewable energy solutions, and a strong presence of key market players in the region
- The U.S. holds a significant share of the market due to the increasing demand for sustainable energy solutions, government incentives for renewable energy adoption, and continuous advancements in energy-efficient technologies
- The availability of well-established policies supporting green energy initiatives, such as the U.S. Clean Energy Standard, and growing investments in infrastructure modernization further strengthen the market
- In addition, the expansion of electric vehicle (EV) infrastructure and increasing integration of smart grid technologies are fueling market growth in North America. The region’s focus on carbon emission reduction and sustainability is propelling the adoption of advanced power supply systems, further driving the market expansion
“Asia-Pacific is Projected to Register the Highest Growth Rate”
- The Asia-Pacific region is expected to witness the highest growth rate in the power supply market, driven by rapid industrialization, increasing demand for energy, and significant investments in renewable energy infrastructure
- Countries such as China, India, and Japan are emerging as key markets due to their growing populations, increasing energy consumption, and expanding renewable energy capacity, which create demand for efficient and reliable power supply systems
- Japan, with its advanced energy infrastructure and focus on sustainability, remains a crucial market for power supply systems. The country continues to lead in the adoption of smart grid technologies and renewable energy solutions, aiming for carbon neutrality by 2050
- China and India, with their vast energy needs and ongoing efforts to expand clean energy solutions, are witnessing increased government and private sector investments in modern power supply systems. The growing presence of global power supply manufacturers and improving access to energy-efficient solutions further contribute to the market’s expansion in the region
Power Supply Market Share
The market competitive landscape provides details by competitor. Details included are company overview, company financials, revenue generated, market potential, investment in research and development, new market initiatives, global presence, production sites and facilities, production capacities, company strengths and weaknesses, product launch, product width and breadth, application dominance. The above data points provided are only related to the companies' focus related to market.
The Major Market Leaders Operating in the Market Are:
- MEAN WELL Enterprises Co. Ltd. (Taiwan)
- TDK Corporation (Japan)
- Siemens AG (Germany)
- General Electric (U.S.)
- XP Power (Singapore)
- Murata Manufacturing Co. Ltd. (Japan)
- Emerson Electric Co. (U.S.)
- PHOENIX CONTACT (Germany)
- Delta Electronics Inc. (Taiwan)
- COSEL CO. LTD. (Japan)
- Puls Technologies Inc (U.S.)
- CUI Inc (U.S.)
- AcBel Polytech Inc. (Taiwan)
- Sea Air & Land Communications Ltd. (U.S.)
- Lite-On Cloud Infrastructure Power Solutions (Taiwan)
- FSP GROUP (Taiwan)
- MTM Power Messtechnik Mellenbach GmbH. (Germany)
- Power Systems & Controls Inc. (U.S.)
- Acopian Technical Company (U.S.)
Latest Developments in Global Power Supply Market
- In May 2024, COSEL unveiled the HFA3500TF, a 3-phase, 3-wire AC/DC enclosed power supply designed for industrial applications. With a compact, low-profile structure, it offers a maximum output power of 3.5kW and boasts exceptional energy efficiency. The HFA3500TF supports a wide input voltage range (200-480V AC) and features parallel operation for increased flexibility. Its robust design ensures reliable performance, even in demanding environments. The unit caters to various industrial needs, including automation, robotics, and power systems. Its innovative technology makes it a standout solution for industries seeking both space efficiency and superior performance
- In February 2024, Delta introduced an advanced power supply automatic testing system designed to streamline efficiency. This innovative system incorporates built-in power testing features that align with international standards, ensuring reliable and precise results. The system's modular design allows for flexible expansion, catering to diverse testing requirements. With intuitive software, users can easily edit testing procedures, enabling automated processes that significantly accelerate product verification. By reducing R&D and manufacturing times, this system helps manufacturers respond swiftly to market demands
- In February 2024, Murata unveiled three innovative power system products: a cutting-edge charge pump IC and two step-down DC-DC converters. These solutions are tailored to address power challenges in consumer electronics and low-output voltage applications. The charge pump IC boasts ultra-high efficiency, making it ideal for portable devices, while the step-down converters offer compact, high-performance solutions for space-constrained designs
- In January 2024, Cooler Master introduced the Ncore 100 Max chassis alongside the V Platinum V2 and X Silent Series power supplies. The Ncore 100 Max is a compact, high-performance mini-ITX case designed for enthusiasts, offering advanced cooling and support for large GPUs. The V Platinum V2 power supplies cater to high-power applications with ultra-quiet cooling and multiple wattage options, while the X Silent Series focuses on delivering efficient, low-noise solutions for consumer systems
- In July 2023, AcBel Polytech Inc. successfully acquired the Power Conversion division of ABB Ltd. (Switzerland). This strategic move reinforces AcBel's dedication to innovation and enhances its expertise in system solutions. By integrating ABB's Power Conversion division, AcBel aims to unlock significant growth opportunities for its customers across various core business sectors
SKU-

- Interactive Data Analysis Dashboard
- Company Analysis Dashboard for high growth potential opportunities
- Research Analyst Access for customization & queries
- Competitor Analysis with Interactive dashboard
- Latest News, Updates & Trend analysis
- Harness the Power of Benchmark Analysis for Comprehensive Competitor Tracking
Table of Content
1 INTRODUCTION
1.1 OBJECTIVES OF THE STUDY
1.2 MARKET DEFINITION
1.3 OVERVIEW OF GLOBAL POWER SUPPLY MARKET
1.4 CURRENCY AND PRICING
1.5 LIMITATION
1.6 MARKETS COVERED
2 MARKET SEGMENTATION
2.1 KEY TAKEAWAYS
2.2 ARRIVING AT THE GLOBAL POWER SUPPLY MARKET
2.2.1 VENDOR POSITIONING GRID
2.2.2 TECHNOLOGY LIFE LINE CURVE
2.2.3 MARKET GUIDE
2.2.4 COMPANY POSITIONING GRID
2.2.5 COMPANY MARKET SHARE ANALYSIS
2.2.6 MULTIVARIATE MODELLING
2.2.7 TOP TO BOTTOM ANALYSIS
2.2.8 STANDARDS OF MEASUREMENT
2.2.9 VENDOR SHARE ANALYSIS
2.2.10 DATA POINTS FROM KEY PRIMARY INTERVIEWS
2.2.11 DATA POINTS FROM KEY SECONDARY DATABASES
2.3 GLOBAL POWER SUPPLY MARKET: RESEARCH SNAPSHOT
2.4 ASSUMPTIONS
3 MARKET OVERVIEW AND INDUSTRY TRENDS
3.1 DRIVERS
3.2 RESTRAINTS
3.3 OPPORTUNITIES
3.4 CHALLENGES
4 EXECUTIVE SUMMARY
5 PREMIUM INSIGHTS
5.1 PORTERS FIVE FORCES
5.2 REGULATORY FRAMEWORK
5.3 TECHNOLOGY TREND
5.4 PATENT ANALYSIS
5.5 VALUE CHAIN ANALYSIS
5.6 COMPANY COMPARITIVE ANALYSIS
5.7 PRICING ANALYSIS
5.8 CURRENT & FUTURISTIC SCENERIO
5.9 CONSUMER BEHAVIOUR ANALYSIS
6 GLOBAL POWER SUPPLY MARKET, BY DEVICE TYPE
6.1 OVERVIEW
6.2 AC-DC POWER SUPPLIES
6.2.1 BY SUPPLY PHASE
6.2.1.1. SINGLE-PHASE
6.2.1.2. THREE-PHASE
6.2.2 BY TYPE
6.2.2.1. DIN RAIL
6.2.2.2. OPEN FRAME
6.2.2.3. PCB MOUNT
6.2.2.4. ENCLOSED/ENCAPSULATED
6.2.2.5. OTHERS
6.3 DC-DC CONVERTERS
6.3.1 BY OUTPUT POWER
6.3.1.1. LOW OUTPUT (UP TO 10 KW)
6.3.1.2. MEDIUM OUTPUT (10 TO 100 KW)
6.3.1.3. HIGH OUTPUT (100 TO 250 KW)
6.3.2 BY TYPE
6.3.2.1. ISOLATED
6.3.2.2. NON ISOLATED
7 GLOBAL POWER SUPPLY MARKET, BY OUTPUT POWER
7.1 OVERVIEW
7.2 LOW (BELOW 500 W)
7.3 MEDIUM (500 W – 1000 W)
7.4 HIGH (MORE THAN 1000 W)
8 GLOBAL POWER SUPPLY MARKET, BY END USER
8.1 OVERVIEW
8.2 CONSUMER ELECTRONICS
8.2.1 BY DEVICE TYPE
8.2.1.1. AC-DC POWER SUPPLIES
8.2.1.1.1. BY SUPPLY PHASE
8.2.1.1.1.1 SINGLE-PHASE
8.2.1.1.1.2 THREE-PHASE
8.2.1.2. DC-DC CONVERTERS
8.2.1.2.1. BY OUTPUT POWER
8.2.1.2.1.1 LOW OUTPUT (UP TO 10 KW)
8.2.1.2.1.2 MEDIUM OUTPUT (10 TO 100 KW)
8.2.1.2.1.3 HIGH OUTPUT (100 TO 250 KW)
8.3 TELECOMMUNICATIONS
8.3.1 BY DEVICE TYPE
8.3.1.1. AC-DC POWER SUPPLIES
8.3.1.1.1. BY SUPPLY PHASE
8.3.1.1.1.1 SINGLE-PHASE
8.3.1.1.1.2 THREE-PHASE
8.3.1.2. DC-DC CONVERTERS
8.3.1.2.1. BY OUTPUT POWER
8.3.1.2.1.1 LOW OUTPUT (UP TO 10 KW)
8.3.1.2.1.2 MEDIUM OUTPUT (10 TO 100 KW)
8.3.1.2.1.3 HIGH OUTPUT (100 TO 250 KW)
8.4 AUTOMOTIVE AND TRANSPORTATION
8.4.1 BY DEVICE TYPE
8.4.1.1. AC-DC POWER SUPPLIES
8.4.1.1.1. BY SUPPLY PHASE
8.4.1.1.1.1 SINGLE-PHASE
8.4.1.1.1.2 THREE-PHASE
8.4.2 DC-DC CONVERTERS
8.4.2.1. BY OUTPUT POWER
8.4.2.1.1. LOW OUTPUT (UP TO 10 KW)
8.4.2.1.2. MEDIUM OUTPUT (10 TO 100 KW)
8.4.2.1.3. HIGH OUTPUT (100 TO 250 KW)
8.5 AEROSPACE AND DEFENSE
8.5.1 BY DEVICE TYPE
8.5.1.1. AC-DC POWER SUPPLIES
8.5.1.1.1. BY SUPPLY PHASE
8.5.1.1.1.1 SINGLE-PHASE
8.5.1.1.1.2 THREE-PHASE
8.5.1.2. DC-DC CONVERTERS
8.5.1.2.1. BY OUTPUT POWER
8.5.1.2.1.1 LOW OUTPUT (UP TO 10 KW)
8.5.1.2.1.2 MEDIUM OUTPUT (10 TO 100 KW)
8.5.1.2.1.3 HIGH OUTPUT (100 TO 250 KW)
8.6 HEALTHCARE
8.6.1 BY DEVICE TYPE
8.6.1.1. AC-DC POWER SUPPLIES
8.6.1.2. BY SUPPLY PHASE
8.6.1.2.1. SINGLE-PHASE
8.6.1.2.2. THREE-PHASE
8.6.1.3. DC-DC CONVERTERS
8.6.1.3.1. BY OUTPUT POWER
8.6.1.3.1.1 LOW OUTPUT (UP TO 10 KW)
8.6.1.3.1.2 MEDIUM OUTPUT (10 TO 100 KW)
8.6.1.3.1.3 HIGH OUTPUT (100 TO 250 KW)
8.7 LIGHTING
8.7.1 BY DEVICE TYPE
8.7.1.1. AC-DC POWER SUPPLIES
8.7.1.1.1. BY SUPPLY PHASE
8.7.1.1.1.1 SINGLE-PHASE
8.7.1.1.1.2 THREE-PHASE
8.7.1.2. DC-DC CONVERTERS
8.7.1.2.1. BY OUTPUT POWER
8.7.1.2.1.1 LOW OUTPUT (UP TO 10 KW)
8.7.1.2.1.2 MEDIUM OUTPUT (10 TO 100 KW)
8.7.1.2.1.3 HIGH OUTPUT (100 TO 250 KW)
8.8 FOOD AND BEVERAGES
8.8.1 BY DEVICE TYPE
8.8.1.1. AC-DC POWER SUPPLIES
8.8.1.1.1. BY SUPPLY PHASE
8.8.1.1.1.1 SINGLE-PHASE
8.8.1.1.1.2 THREE-PHASE
8.8.1.2. DC-DC CONVERTERS
8.8.1.2.1. BY OUTPUT POWER
8.8.1.2.1.1 LOW OUTPUT (UP TO 10 KW)
8.8.1.2.1.2 MEDIUM OUTPUT (10 TO 100 KW)
8.8.1.2.1.3 HIGH OUTPUT (100 TO 250 KW)
8.9 OTHER INDUSTRIAL USERS
9 GLOBAL POWER SUPPLY MARKET, BY SALES CHANNEL
9.1 OVERVIEW
9.2 OVERVIEW
9.3 DIRECT SALES
9.3.1 COMPANY WEBSITE
9.3.2 E-COMMERCE
9.4 INDIRECT SALES
10 GLOBAL POWER SUPPLY MARKET, BY REGION
10.1 GLOBAL POWER SUPPLY MARKET, (ALL SEGMENTATION PROVIDED ABOVE IS REPRESENTED IN THIS CHAPTER BY COUNTRY)
10.1.1 NORTH AMERICA
10.1.1.1. U.S.
10.1.1.2. CANADA
10.1.1.3. MEXICO
10.1.2 EUROPE
10.1.2.1. GERMANY
10.1.2.2. FRANCE
10.1.2.3. U.K.
10.1.2.4. ITALY
10.1.2.5. SPAIN
10.1.2.6. RUSSIA
10.1.2.7. TURKEY
10.1.2.8. BELGIUM
10.1.2.9. NETHERLANDS
10.1.2.10. SWITZERLAND
10.1.2.11. DENMARK
10.1.2.12. POLAND
10.1.2.13. SWEDEN
10.1.2.14. NORWAY
10.1.2.15. FINLAND
10.1.2.16. REST OF EUROPE
10.1.3 ASIA-PACIFIC
10.1.3.1. CHINA
10.1.3.2. JAPAN
10.1.3.3. INDIA
10.1.3.4. SOUTH KOREA
10.1.3.5. AUSTRALIA AND NEW ZEALAND
10.1.3.6. SINGAPORE
10.1.3.7. MALAYSIA
10.1.3.8. THAILAND
10.1.3.9. INDONESIA
10.1.3.10. PHILIPPINES
10.1.3.11. TAIWAN
10.1.3.12. VIETNAM
10.1.3.13. REST OF ASIA-PACIFIC
10.1.4 SOUTH AMERICA
10.1.4.1. BRAZIL
10.1.4.2. ARGENTINA
10.1.4.3. CHILE
10.1.4.4. COLOMBIA
10.1.4.5. PERU
10.1.4.6. REST OF SOUTH AMERICA
10.1.5 MIDDLE EAST AND AFRICA
10.1.5.1. SOUTH AFRICA
10.1.5.2. EGYPT
10.1.5.3. SAUDI ARABIA
10.1.5.4. U.A.E
10.1.5.5. ISRAEL
10.1.5.6. KUWAIT
10.1.5.7. OMAN
10.1.5.8. QATAR
10.1.5.9. BAHRAIN
10.1.5.10. REST OF MIDDLE EAST AND AFRICA
10.2 KEY PRIMARY INSIGHTS: BY MAJOR COUNTRIES
11 GLOBAL POWER SUPPLY MARKET, COMPANY LANDSCAPE
11.1 COMPANY SHARE ANALYSIS: GLOBAL
11.2 COMPANY SHARE ANALYSIS: NORTH AMERICA
11.3 COMPANY SHARE ANALYSIS: EUROPE
11.4 COMPANY SHARE ANALYSIS: ASIA PACIFIC
11.5 MERGERS & ACQUISITIONS
11.6 NEW PRODUCT DEVELOPMENT & APPROVALS
11.7 EXPANSIONS
11.8 REGULATORY CHANGES
11.9 PARTNERSHIP AND OTHER STRATEGIC DEVELOPMENTS
12 GLOBAL POWER SUPPLY MARKET, SWOT & DBMR ANALYSIS
13 GLOBAL POWER SUPPLY MARKET, COMPANY PROFILE
13.1 DELTA ELECTRONICS INC.
13.1.1 COMPANY SNAPSHOT
13.1.2 REVENUE ANALYSIS
13.1.3 PRODUCT PORTFOLIO
13.1.4 RECENT DEVELOPMENTS
13.2 SIEMENS LTD.
13.2.1 COMPANY SNAPSHOT
13.2.2 REVENUE ANALYSIS
13.2.3 PRODUCT PORTFOLIO
13.2.4 RECENT DEVELOPMENTS
13.3 GENERAL ELECTRIC
13.3.1 COMPANY SNAPSHOT
13.3.2 REVENUE ANALYSIS
13.3.3 PRODUCT PORTFOLIO
13.3.4 RECENT DEVELOPMENTS
13.4 ABB LTD.
13.4.1 COMPANY SNAPSHOT
13.4.2 REVENUE ANALYSIS
13.4.3 PRODUCT PORTFOLIO
13.4.4 RECENT DEVELOPMENTS
13.5 XP POWER
13.5.1 COMPANY SNAPSHOT
13.5.2 REVENUE ANALYSIS
13.5.3 PRODUCT PORTFOLIO
13.5.4 RECENT DEVELOPMENTS
13.6 MEAN WELL ENTERPRISES CO.
13.6.1 COMPANY SNAPSHOT
13.6.2 REVENUE ANALYSIS
13.6.3 PRODUCT PORTFOLIO
13.6.4 RECENT DEVELOPMENTS
13.7 PHOENIX CONTACT PVT. LTD.
13.7.1 COMPANY SNAPSHOT
13.7.2 REVENUE ANALYSIS
13.7.3 PRODUCT PORTFOLIO
13.7.4 RECENT DEVELOPMENTS
13.8 ACBEL POLYTECH INC.
13.8.1 COMPANY SNAPSHOT
13.8.2 REVENUE ANALYSIS
13.8.3 PRODUCT PORTFOLIO
13.8.4 RECENT DEVELOPMENTS
13.9 TDK LAMBDA CORPORATION
13.9.1 COMPANY SNAPSHOT
13.9.2 REVENUE ANALYSIS
13.9.3 PRODUCT PORTFOLIO
13.9.4 RECENT DEVELOPMENTS
13.1 SCHNEIDER ELECTRIC
13.10.1 COMPANY SNAPSHOT
13.10.2 REVENUE ANALYSIS
13.10.3 PRODUCT PORTFOLIO
13.10.4 RECENT DEVELOPMENTS
13.11 EMERSON ELECTRIC CO.
13.11.1 COMPANY SNAPSHOT
13.11.2 REVENUE ANALYSIS
13.11.3 PRODUCT PORTFOLIO
13.11.4 RECENT DEVELOPMENTS
13.12 MURATA POWER SOLUTIONS INC.
13.12.1 COMPANY SNAPSHOT
13.12.2 REVENUE ANALYSIS
13.12.3 PRODUCT PORTFOLIO
13.12.4 RECENT DEVELOPMENTS
13.13 ARTESAN TECHNOLOGIES
13.13.1 COMPANY SNAPSHOT
13.13.2 REVENUE ANALYSIS
13.13.3 PRODUCT PORTFOLIO
13.13.4 RECENT DEVELOPMENTS
13.14 LITEON TECHNOLOGY
13.14.1 COMPANY SNAPSHOT
13.14.2 REVENUE ANALYSIS
13.14.3 PRODUCT PORTFOLIO
13.14.4 RECENT DEVELOPMENTS
13.15 OMRON CORPORATION
13.15.1 COMPANY SNAPSHOT
13.15.2 REVENUE ANALYSIS
13.15.3 PRODUCT PORTFOLIO
13.15.4 RECENT DEVELOPMENTS
13.16 SALCOMP PLC
13.16.1 COMPANY SNAPSHOT
13.16.2 REVENUE ANALYSIS
13.16.3 PRODUCT PORTFOLIO
13.16.4 RECENT DEVELOPMENTS
13.17 POWER SYSTEMS & CONTROLS INC.
13.17.1 COMPANY SNAPSHOT
13.17.2 REVENUE ANALYSIS
13.17.3 PRODUCT PORTFOLIO
13.17.4 RECENT DEVELOPMENTS
13.18 MTM POWER MESSTECHNIK MELLENBACH GMBH
13.18.1 COMPANY SNAPSHOT
13.18.2 REVENUE ANALYSIS
13.18.3 PRODUCT PORTFOLIO
13.18.4 RECENT DEVELOPMENTS
13.19 POWER INNOVATION STROMVERSORGUNGSTECHNIK GMBH
13.19.1 COMPANY SNAPSHOT
13.19.2 REVENUE ANALYSIS
13.19.3 PRODUCT PORTFOLIO
13.19.4 RECENT DEVELOPMENTS
13.2 FSP TECHNOLOGY INC.
13.20.1 COMPANY SNAPSHOT
13.20.2 REVENUE ANALYSIS
13.20.3 PRODUCT PORTFOLIO
13.20.4 RECENT DEVELOPMENTS
13.21 ACOPIAN TECHNICAL COMPANY
13.21.1 COMPANY SNAPSHOT
13.21.2 REVENUE ANALYSIS
13.21.3 PRODUCT PORTFOLIO
13.21.4 RECENT DEVELOPMENTS
13.22 CUI INC.
13.22.1 COMPANY SNAPSHOT
13.22.2 REVENUE ANALYSIS
13.22.3 PRODUCT PORTFOLIO
13.22.4 RECENT DEVELOPMENTS
13.23 COSEL CO.
13.23.1 COMPANY SNAPSHOT
13.23.2 REVENUE ANALYSIS
13.23.3 PRODUCT PORTFOLIO
13.23.4 RECENT DEVELOPMENTS
13.24 PULS GROUP
13.24.1 COMPANY SNAPSHOT
13.24.2 REVENUE ANALYSIS
13.24.3 PRODUCT PORTFOLIO
13.24.4 RECENT DEVELOPMENTS
NOTE: THE COMPANIES PROFILED IS NOT EXHAUSTIVE LIST AND IS AS PER OUR PREVIOUS CLIENT REQUIREMENT. WE PROFILE MORE THAN 100 COMPANIES IN OUR STUDY AND HENCE THE LIST OF COMPANIES CAN BE MODIFIED OR REPLACED ON REQUEST
14 CONCLUSION
15 RELATED REPORTS
16 ABOUT DATA BRIDGE MARKET RESEARCH
Global Power Supply Market, Supply Chain Analysis and Ecosystem Framework
To support market growth and help clients navigate the impact of geopolitical shifts, DBMR has integrated in-depth supply chain analysis into its Global Power Supply Market research reports. This addition empowers clients to respond effectively to global changes affecting their industries. The supply chain analysis section includes detailed insights such as Global Power Supply Market consumption and production by country, price trend analysis, the impact of tariffs and geopolitical developments, and import and export trends by country and HSN code. It also highlights major suppliers with data on production capacity and company profiles, as well as key importers and exporters. In addition to research, DBMR offers specialized supply chain consulting services backed by over a decade of experience, providing solutions like supplier discovery, supplier risk assessment, price trend analysis, impact evaluation of inflation and trade route changes, and comprehensive market trend analysis.
Data collection and base year analysis are done using data collection modules with large sample sizes. The stage includes obtaining market information or related data through various sources and strategies. It includes examining and planning all the data acquired from the past in advance. It likewise envelops the examination of information inconsistencies seen across different information sources. The market data is analysed and estimated using market statistical and coherent models. Also, market share analysis and key trend analysis are the major success factors in the market report. To know more, please request an analyst call or drop down your inquiry.
The key research methodology used by DBMR research team is data triangulation which involves data mining, analysis of the impact of data variables on the market and primary (industry expert) validation. Data models include Vendor Positioning Grid, Market Time Line Analysis, Market Overview and Guide, Company Positioning Grid, Patent Analysis, Pricing Analysis, Company Market Share Analysis, Standards of Measurement, Global versus Regional and Vendor Share Analysis. To know more about the research methodology, drop in an inquiry to speak to our industry experts.
Data Bridge Market Research is a leader in advanced formative research. We take pride in servicing our existing and new customers with data and analysis that match and suits their goal. The report can be customized to include price trend analysis of target brands understanding the market for additional countries (ask for the list of countries), clinical trial results data, literature review, refurbished market and product base analysis. Market analysis of target competitors can be analyzed from technology-based analysis to market portfolio strategies. We can add as many competitors that you require data about in the format and data style you are looking for. Our team of analysts can also provide you data in crude raw excel files pivot tables (Fact book) or can assist you in creating presentations from the data sets available in the report.


