
Global Process Analytics Service Market
Market Size in USD Billion
 USD
6.66 Billion
USD
175.29 Billion
2025
2033
USD
6.66 Billion
USD
175.29 Billion
2025
2033
| 2026 - 2033 | |
| USD 6.66 Billion | |
| USD 175.29 Billion | |
| % | |
|
Process Analytics Service Market Size
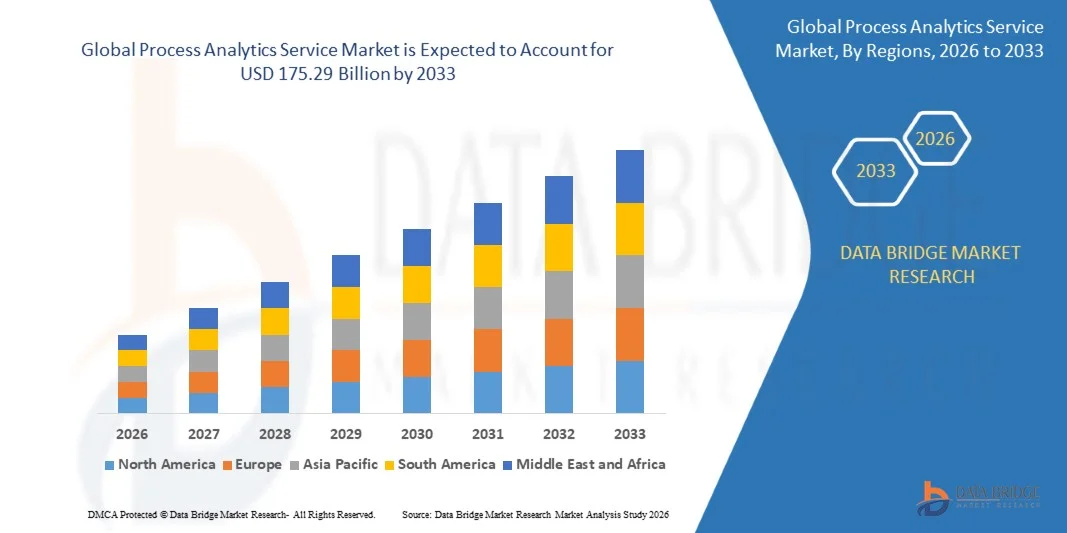
- The global process analytics service market size was valued at USD 6.66 billion in 2025 and is expected to reach USD 175.29 billion by 2033, at a CAGR of 50.50% during the forecast period
- The market growth is largely fuelled by the increasing adoption of advanced data analytics solutions across industries, rising demand for real-time process monitoring, and growing focus on operational efficiency and cost optimization in manufacturing and service sectors
- In addition, rapid digital transformation, integration of AI and machine learning in process analytics platforms, and increasing emphasis on predictive maintenance and decision intelligence are further supporting market expansion
Process Analytics Service Market Analysis
- The market is witnessing strong momentum due to the rising need for data-driven decision-making and continuous process improvement across industries
- Growing deployment of cloud-based analytics solutions, expansion of industrial IoT ecosystems, and increasing focus on automation and smart manufacturing are further accelerating market adoption
- North America dominated the global process analytics service market with the largest revenue share in 2025, driven by strong digital transformation initiatives, early adoption of advanced analytics platforms, and the widespread integration of AI and machine learning technologies across enterprises
- The Asia-Pacific region is expected to witness the highest growth rate in the global process analytics service market, driven by rapid industrial expansion, increasing investment in digital transformation technologies, and rising adoption of AI-powered analytics platforms across emerging economies such as China, India, and Southeast Asia
- The process discovery segment held the largest market revenue share in 2025 driven by its ability to automatically map and visualize end-to-end business processes, enabling organizations to identify inefficiencies and bottlenecks. Process discovery tools are widely adopted as they provide a clear baseline of actual process execution, supporting better decision-making and operational transparency across industriesa
Report Scope and Process Analytics Service Market Segmentation
|
Attributes |
Process Analytics Service Key Market Insights |
|
Segments Covered |
|
|
Countries Covered |
North America
Europe
Asia-Pacific
Middle East and Africa
South America
|
|
Key Market Players |
• Lana Labs (Germany) |
|
Market Opportunities |
• Expansion Of AI Driven Process Optimization |
|
Value Added Data Infosets |
In addition to the market insights such as market value, growth rate, market segments, geographical coverage, market players, and market scenario, the market report curated by the Data Bridge Market Research team includes in-depth expert analysis, import/export analysis, pricing analysis, production consumption analysis, and pestle analysis. |
Process Analytics Service Market Trends
“Rising Adoption Of AI Driven Process Optimization”
• The increasing integration of artificial intelligence and machine learning into process analytics services is significantly transforming the market, as organizations increasingly rely on advanced analytics platforms to monitor, optimize, and automate complex business and industrial processes. Process analytics services are gaining traction due to their ability to provide real-time insights, improve decision-making accuracy, and enhance overall operational efficiency without compromising scalability or flexibility. This trend is strengthening adoption across manufacturing, IT, energy, and service industries, encouraging providers to develop more intelligent and adaptive analytics solutions
• Increasing focus on digital transformation and data driven decision making has accelerated the demand for process analytics services across enterprises. Organizations are actively deploying analytics platforms to improve productivity, reduce operational bottlenecks, and optimize resource utilization, prompting vendors to expand cloud based and hybrid analytics offerings. This has also led to strategic collaborations between technology providers and enterprises to enhance data integration and visualization capabilities
• Cloud based deployment and subscription based analytics models are influencing purchasing decisions, with enterprises prioritizing flexibility, scalability, and cost efficiency. These factors are helping service providers expand their customer base while also driving innovation in real time analytics dashboards and predictive modeling tools. Companies are increasingly highlighting automation, interoperability, and ease of integration to strengthen market positioning
• For instance, in 2024, Siemens in Germany and Honeywell in the U.S. expanded their process analytics service offerings by integrating AI powered monitoring and predictive analytics solutions across industrial operations. These solutions were deployed to enhance process visibility, reduce downtime, and improve operational efficiency across manufacturing and energy facilities. The initiatives also supported customers in achieving sustainability and performance optimization goals
• While demand for process analytics services is growing, sustained market expansion depends on data security, integration complexity, and skilled workforce availability. Providers are focusing on improving platform interoperability, strengthening cybersecurity frameworks, and enhancing user training programs to support broader adoption and long term scalability
Process Analytics Service Market Dynamics
Driver
“Increasing Demand For Real Time Process Monitoring And Optimization”
• Rising demand for real time visibility into business and industrial processes is a major driver for the process analytics service market. Enterprises are increasingly adopting analytics platforms to monitor workflows, identify inefficiencies, and optimize performance across multiple operational layers. This trend is also driving investments in advanced data infrastructure and analytics tools to support continuous process improvement
• Expanding adoption of cloud computing, industrial IoT, and big data technologies is significantly influencing market growth. Process analytics services enable organizations to integrate and analyze large volumes of structured and unstructured data, helping improve operational efficiency and decision making. The increasing use of connected devices further strengthens demand for real time analytics capabilities
• Businesses across manufacturing, energy, IT, and healthcare sectors are actively implementing process analytics solutions to reduce downtime, enhance productivity, and ensure compliance with regulatory standards. These efforts are supported by growing investments in digital transformation initiatives and automation technologies, which further accelerate market expansion
• For instance, in 2023, SAP in Germany and IBM in the U.S. enhanced their process analytics platforms by introducing advanced predictive analytics and automation features for enterprise users. These upgrades helped organizations improve workflow efficiency, reduce operational delays, and strengthen data driven decision making capabilities
• Although rising demand supports growth, wider adoption depends on integration complexity, high implementation costs, and the need for skilled analytics professionals. Continued investment in user friendly interfaces, scalable cloud platforms, and workforce training will be critical for long term market development
Restraint/Challenge
“Data Security Concerns And High Implementation Complexity”
• Data security and privacy concerns remain a key challenge for the process analytics service market, as organizations handle large volumes of sensitive operational and business data. Ensuring secure data storage, transmission, and processing is critical, and any vulnerabilities can limit adoption, particularly in highly regulated industries
• High implementation complexity and integration challenges with legacy systems also restrict market growth. Many enterprises face difficulties in aligning process analytics platforms with existing IT infrastructure, leading to increased deployment time and operational costs. This can slow down adoption, especially among small and medium sized enterprises
• Limited availability of skilled professionals in data analytics, AI, and process optimization further impacts market expansion. Organizations often struggle to fully utilize advanced analytics tools due to lack of expertise, resulting in underutilization of deployed solutions and reduced return on investment
• For instance, in 2024, several manufacturing firms in Southeast Asia reported delays in deploying enterprise process analytics solutions from providers such as Oracle and Microsoft due to integration complexities with legacy ERP systems and concerns around data governance and compliance. These challenges led to phased implementation strategies and increased reliance on external consultants
• Overcoming these challenges will require stronger cybersecurity frameworks, simplified integration architectures, and increased focus on workforce training. Vendors are also expected to invest in low code and no code analytics platforms to improve accessibility and accelerate adoption across industries
Process Analytics Service Market Scope
The market is segmented on the basis of process mining type, deployment type, organization size, and application.
• By Process Mining Type
On the basis of process mining type, the process analytics service market is segmented into process discovery, conformance, and enhancement. The process discovery segment held the largest market revenue share in 2025 driven by its ability to automatically map and visualize end-to-end business processes, enabling organizations to identify inefficiencies and bottlenecks. Process discovery tools are widely adopted as they provide a clear baseline of actual process execution, supporting better decision-making and operational transparency across industries.
The conformance segment is expected to witness the fastest growth rate from 2026 to 2033, driven by increasing demand for compliance monitoring and deviation analysis against predefined process models. Conformance analytics helps organizations ensure regulatory adherence, reduce process deviations, and improve governance, making it highly valuable in regulated industries such as banking, healthcare, and manufacturing.
• By Deployment Type
On the basis of deployment type, the market is segmented into on-premises and cloud. The cloud segment held the largest market revenue share in 2025 driven by its scalability, cost efficiency, and ease of integration with enterprise systems. Cloud-based process analytics services enable real-time data access, faster deployment, and seamless updates, making them highly preferred among organizations undergoing digital transformation.
The on-premises segment is expected to witness the fastest growth rate from 2026 to 2033, driven by increasing demand for enhanced data security, control, and compliance requirements. Large enterprises and regulated industries are increasingly adopting on-premises deployment to maintain strict governance over sensitive operational data and ensure internal infrastructure control.
• By Organization Size
On the basis of organization size, the market is segmented into small and medium-sized enterprises and large enterprises. The large enterprises segment held the largest market revenue share in 2025 driven by high adoption of advanced analytics solutions to optimize complex business processes and manage large-scale operations. These organizations invest heavily in process analytics to improve efficiency, reduce operational costs, and enhance decision-making capabilities across global operations.
The small and medium-sized enterprises segment is expected to witness the fastest growth rate from 2026 to 2033, driven by increasing accessibility of cloud-based analytics platforms and rising awareness of process optimization benefits. SMEs are increasingly adopting cost-effective subscription-based analytics services to improve productivity and compete with larger organizations in dynamic market environments.
• By Application
On the basis of application, the market is segmented into business process, information technology process, and customer interaction. The business process segment held the largest market revenue share in 2025 driven by strong adoption of process analytics services for workflow optimization, operational efficiency, and cost reduction across enterprises. Organizations are increasingly using analytics to streamline core business functions and improve end-to-end process visibility.
The information technology process segment is expected to witness the fastest growth rate from 2026 to 2033, driven by rising demand for IT system monitoring, incident management, and automated process optimization. Process analytics services are increasingly used to enhance IT performance, reduce system downtime, and improve service delivery efficiency across complex IT environments.
Process Analytics Service Market Regional Analysis
• North America dominated the global process analytics service market with the largest revenue share in 2025, driven by strong digital transformation initiatives, early adoption of advanced analytics platforms, and the widespread integration of AI and machine learning technologies across enterprises
• Organizations in the region highly value real-time process visibility, operational efficiency, and data-driven decision-making enabled by process analytics services across manufacturing, IT, and service industries
• This widespread adoption is further supported by strong cloud infrastructure, high technology investment, and the presence of major analytics service providers, establishing process analytics as a key enabler of enterprise optimization
U.S. Process Analytics Service Market Insight
The U.S. process analytics service market captured the largest revenue share in North America in 2025, fueled by rapid adoption of digital transformation strategies and increasing demand for process optimization across enterprises. Organizations are increasingly focusing on improving operational efficiency through AI-powered analytics platforms and automation tools. The strong presence of technology leaders and growing investment in enterprise software solutions further supports market expansion. Moreover, integration of cloud-based analytics, big data platforms, and advanced visualization tools is significantly contributing to market growth
Europe Process Analytics Service Market Insight
The Europe process analytics service market is expected to witness the fastest growth rate from 2026 to 2033, primarily driven by stringent regulatory compliance requirements, increasing focus on operational efficiency, and rising adoption of Industry 4.0 technologies. Organizations across the region are increasingly deploying process analytics solutions to improve productivity, reduce costs, and enhance transparency in business operations. The growing emphasis on sustainable operations and digital transformation is further accelerating market growth across industries.
U.K. Process Analytics Service Market Insight
The U.K. process analytics service market is expected to witness the fastest growth rate from 2026 to 2033, driven by strong adoption of cloud-based analytics platforms and increasing demand for business process optimization. Enterprises are focusing on improving efficiency and reducing operational risks through advanced analytics solutions. In addition, the country’s strong financial services, IT, and retail sectors are contributing significantly to market expansion.
Germany Process Analytics Service Market Insight
The Germany process analytics service market is expected to witness the fastest growth rate from 2026 to 2033, fueled by strong industrial automation, advanced manufacturing infrastructure, and increasing adoption of data-driven decision-making systems. German enterprises are integrating process analytics solutions to enhance productivity, improve compliance, and support Industry 4.0 initiatives. The focus on precision engineering and operational excellence is further driving market growth.
Asia-Pacific Process Analytics Service Market Insight
The Asia-Pacific process analytics service market is expected to witness the fastest growth rate from 2026 to 2033, driven by rapid industrialization, expanding IT infrastructure, and increasing adoption of digital technologies in countries such as China, India, and Japan. Organizations are increasingly investing in analytics platforms to optimize business processes and improve operational efficiency. In addition, rising cloud adoption and government-led digitalization initiatives are supporting strong market expansion across the region.
Japan Process Analytics Service Market Insight
The Japan process analytics service market is expected to witness the fastest growth rate from 2026 to 2033 due to the country’s strong focus on technological innovation, automation, and high operational efficiency standards. Enterprises are increasingly adopting process analytics solutions to optimize manufacturing processes and enhance IT performance. Moreover, integration of AI-driven analytics and smart factory initiatives is further boosting market growth.
China Process Analytics Service Market Insight
The China process analytics service market accounted for the largest market revenue share in Asia Pacific in 2025, attributed to rapid digital transformation, strong manufacturing base, and widespread adoption of cloud and AI technologies. Chinese enterprises are increasingly leveraging process analytics services to improve productivity, reduce costs, and support large-scale industrial operations. In addition, government initiatives promoting smart manufacturing and digital economy growth are further propelling the market in the country.
Process Analytics Service Market Share
The Process Analytics Service industry is primarily led by well-established companies, including:
• Lana Labs (Germany)
• Minit (U.K.)
• Logpickr (France)
• Timelinepi (Italy)
• Scheer (Germany)
• Monkey Mining (U.S.)
• Celonis (Germany)
• Fluxicon (Netherlands)
• Icaro Tech (Brazil)
• Kofax (U.S.)
• Worksoft (U.S.)
• Puzzle Data (Japan)
• QPR Software (Finland)
• Cognitive Technology (U.K.)
• Signavio (Germany)
• SNP (Germany)
• Your Data (U.S.)
• Process Mining Group (U.S.)
• Software AG (Germany)
• Fujitsu (Japan)
• CA Technologies (U.S.)
Latest Developments in Global Process Analytics Service Market
- In October, Microsoft (U.S.), product enhancement, unveiled an upgraded version of its Power BI analytics platform integrated with advanced machine learning capabilities, aiming to deliver more intelligent data visualization and predictive insights, which is expected to improve decision-making efficiency for enterprises and strengthen Microsoft’s competitive position in the global analytics market
- In September, SAP (Germany), product launch, introduced a new suite of process analytics tools tailored for the manufacturing sector, aimed at providing real-time operational insights, optimizing production processes, and reducing waste, which is expected to enhance manufacturing efficiency and support industry-specific digital transformation initiatives across enterprises
- In August, IBM (U.S.), strategic partnership, entered into a collaboration with a leading cloud provider to integrate its AI-driven analytics tools with scalable cloud infrastructure, aiming to improve analytics performance, flexibility, and deployment efficiency, which is expected to expand IBM’s market reach and accelerate adoption of cloud-based analytics solutions across industries
SKU-

- Interactive Data Analysis Dashboard
- Company Analysis Dashboard for high growth potential opportunities
- Research Analyst Access for customization & queries
- Competitor Analysis with Interactive dashboard
- Latest News, Updates & Trend analysis
- Harness the Power of Benchmark Analysis for Comprehensive Competitor Tracking
Data collection and base year analysis are done using data collection modules with large sample sizes. The stage includes obtaining market information or related data through various sources and strategies. It includes examining and planning all the data acquired from the past in advance. It likewise envelops the examination of information inconsistencies seen across different information sources. The market data is analysed and estimated using market statistical and coherent models. Also, market share analysis and key trend analysis are the major success factors in the market report. To know more, please request an analyst call or drop down your inquiry.
The key research methodology used by DBMR research team is data triangulation which involves data mining, analysis of the impact of data variables on the market and primary (industry expert) validation. Data models include Vendor Positioning Grid, Market Time Line Analysis, Market Overview and Guide, Company Positioning Grid, Patent Analysis, Pricing Analysis, Company Market Share Analysis, Standards of Measurement, Global versus Regional and Vendor Share Analysis. To know more about the research methodology, drop in an inquiry to speak to our industry experts.
Data Bridge Market Research is a leader in advanced formative research. We take pride in servicing our existing and new customers with data and analysis that match and suits their goal. The report can be customized to include price trend analysis of target brands understanding the market for additional countries (ask for the list of countries), clinical trial results data, literature review, refurbished market and product base analysis. Market analysis of target competitors can be analyzed from technology-based analysis to market portfolio strategies. We can add as many competitors that you require data about in the format and data style you are looking for. Our team of analysts can also provide you data in crude raw excel files pivot tables (Fact book) or can assist you in creating presentations from the data sets available in the report.


