
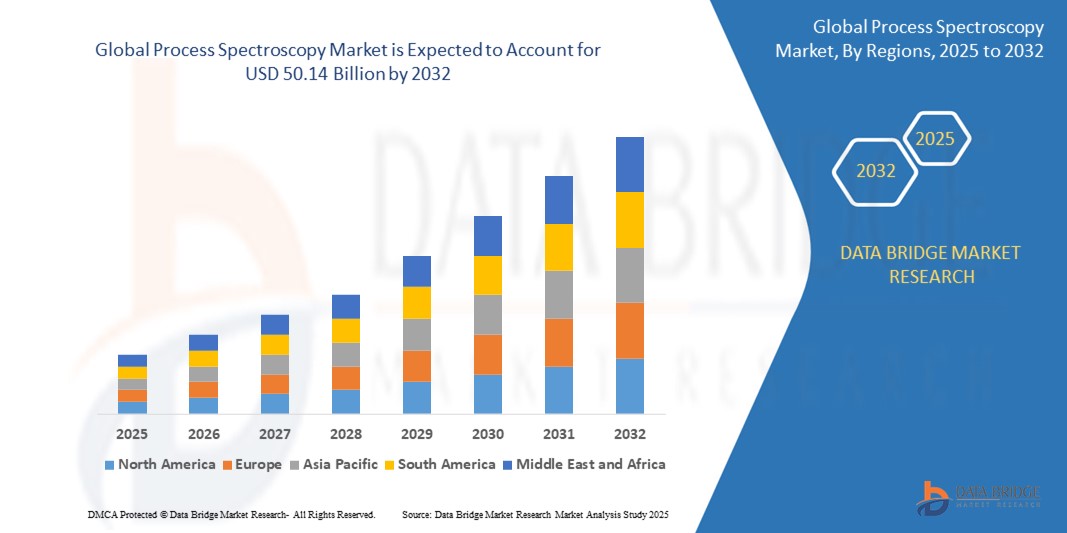
Global Process Spectroscopy Market
Market Size in USD Billion
 USD
21.76 Billion
USD
50.14 Billion
2024
2032
USD
21.76 Billion
USD
50.14 Billion
2024
2032
| 2025 - 2032 | |
| USD 21.76 Billion | |
| USD 50.14 Billion | |
| % | |
|
Process Spectroscopy Market Size
- The global process spectroscopy market was valued at USD 21.76 billion in 2024 and is expected to reach USD 50.14 billion by 2032
- During the forecast period of 2025 to 2032 the market is likely to grow at a CAGR of 11.10%, primarily driven by the high research optimization and growth in emerging sectors
- This growth is driven by factors such as operate and maintain advanced spectroscopic equipment further adds to the overall cost and complexity, hindering widespread adoption, particularly in emerging markets
Process Spectroscopy Market Analysis
- Spectroscopy refers to the study of the interaction between matter and electromagnetic radiation. It encompasses a range of techniques used to analyze the composition and properties of substances across various industries
- The demand for spectroscopy equipment is significantly driven by its crucial role in pharmaceuticals, environmental monitoring, food and beverage analysis, and materials science. These sectors require precise analytical tools for quality control, research, and regulatory compliance
- As industries focus on enhanced quality assurance, stringent regulatory standards, and advanced research and development, the market is expected to grow, providing solutions for improved accuracy, sensitivity, and speed in analytical processes. This supports advancements in various fields, including healthcare and environmental sustainability.
- North America stand out as dominant regions for the spectroscopy market, driven by their strong research and development infrastructure, advanced manufacturing sectors, and stringent regulatory environments
Report Scope and Process Spectroscopy Market Segmentation
|
Attributes |
Process Spectroscopy Market Key Market Insights |
|
Segments Covered |
|
|
Countries Covered |
North America
Europe
Asia-Pacific
South America
Middle East and Africa
|
|
Key Market Players |
|
|
Market Opportunities |
|
|
Value Added Data Infosets |
In addition to the market insights such as market value, growth rate, market segments, geographical coverage, market players, and market scenario, the market report curated by the Data Bridge Market Research team includes in-depth expert analysis, import/export analysis, pricing analysis, production consumption analysis, PORTER analysis, and PESTLE analysis. |
Process Spectroscopy Market Trends
“Advancements in Spectroscopic Technologies & Real-Time Monitoring for Industrial Processes”
- One prominent trend in the evolution of process spectroscopy is the increasing integration of advanced spectroscopic techniques with real-time data analytics and digital monitoring systems
- These innovations enhance process control by providing high-resolution, real-time insights into chemical composition and physical properties during manufacturing, ensuring higher accuracy and efficiency
- For instance, modern near-infrared (NIR) and Raman spectroscopy systems enable non-destructive, in-line analysis, allowing industries such as pharmaceuticals, food & beverage, and chemicals to monitor critical parameters without interrupting production
- The integration of digital platforms and cloud-based analytics also supports remote monitoring, predictive maintenance, and automated decision-making, improving operational transparency and reducing downtime
- These advancements are transforming industrial process monitoring, improving product quality, regulatory compliance, and driving the demand for next-generation spectroscopy systems with smart, connected features
Process Spectroscopy Market Dynamics
Driver
“Increasing Stringency of Regulatory Standards and Quality Control Across Industries”
- The growing emphasis on product safety, environmental protection, and pharmaceutical efficacy is driving the adoption of advanced spectroscopic techniques for rigorous quality control and compliance
- Stringent regulations in sectors like pharmaceuticals, food and beverage, and environmental monitoring necessitate precise and reliable analytical methods to ensure product integrity and adherence to standards
For instance,
- In January 2024, the European Medicines Agency (EMA) updated its guidelines for pharmaceutical manufacturing, requiring more comprehensive in-line monitoring of critical process parameters using techniques like Raman and NIR spectroscopy. This mandate is driving pharmaceutical companies to upgrade their analytical infrastructure, increasing the demand for advanced spectroscopic systems. Future revisions are expected to focus on real-time release testing and process analytical technology (PAT) implementation. This increased regulatory focus is a significant driver for the global process spectroscopy market
- In November 2023, the US EPA finalized new regulations regarding the monitoring of per- and polyfluoroalkyl substances (PFAS) in drinking water, requiring highly sensitive analytical methods. As reported by Environmental Science & Technology journal, this regulation is driving demand for advanced mass spectrometry techniques, like LC-MS/MS, for accurate PFAS quantification. This governmental push for increased environmental monitoring is a key driver for the spectroscopy market.
- As regulatory bodies worldwide enforce stricter guidelines, companies are investing in high-performance spectroscopic instruments to meet these demands, ensuring consumer safety and mitigating risks
Opportunity
“Integration of AI and Machine Learning in Spectroscopic Analysis”
- This AI and Machine Learning in advanced technologies enhance analytical efficiency, precision, and data interpretation by enabling automated spectral analysis, predictive modeling, and real-time process control
- AI-driven analysis reduces processing time, optimizes parameter selection, and minimizes user bias, leading to improved accuracy and faster results
- As the demand for high-throughput analysis and complex data interpretation grows across industries like pharmaceuticals and environmental monitoring, companies that invest in AI-powered spectroscopic solutions will gain a competitive edge, accelerating research, development, and quality control
For instance,
- In November 2023, Thermo Fisher Scientific announced the integration of AI-powered spectral libraries into their Raman spectroscopy systems, enabling automated identification of unknown compounds with higher accuracy and speed. Utilizing deep learning algorithms, the system can analyze complex spectral patterns, differentiate between similar compounds, and provide real-time feedback to users. Future enhancements include predictive modeling for process optimization and automated quality control workflows. This integration of AI and machine learning into spectroscopic analysis presents significant opportunities for the global process spectroscopy market
- In September 2023, according to a publication by Analytical Scientist, AI-powered algorithms are transforming spectral data interpretation in environmental monitoring by providing real-time analysis of pollutants. AI-driven software platforms, like those developed by Bruker, improve the ability to detect and quantify trace contaminants in water and air through deep learning technology. AI-driven analysis allows for the differentiation of complex mixtures, minimizing false positives, and enabling instant alerts
- Adopting AI-driven analysis of spectroscopic data can enhance environmental compliance, optimize monitoring operations, and ensure adherence to evolving regulations, giving environmental monitoring companies a competitive edge
Restraint/Challenge
“High Initial Investment and Complex Integration of Advanced Spectroscopic Systems”
- The implementation of sophisticated spectroscopic instruments often requires substantial upfront capital, posing a significant barrier for smaller companies and research institutions with limited budgets
- Integrating these systems into existing production lines or analytical workflows can be complex, requiring specialized expertise and potentially disrupting ongoing operations
For instance,
- In December 2023, a report published in the Journal of Process Analytics highlighted the challenges faced by pharmaceutical companies in integrating real-time Raman spectroscopy systems into their existing manufacturing processes. The report noted that the complexity of data integration, the need for customized software solutions, and the validation requirements for regulatory compliance created significant hurdles. Many companies face significant challenges during implementation, and these challenges restrain growth within the market
- The need for trained personnel to operate and maintain advanced spectroscopic equipment further adds to the overall cost and complexity, hindering widespread adoption, particularly in emerging markets
Process Spectroscopy Market Scope
The market is segmented into three notable segments based on components, technology, and application.
|
Segmentation |
Sub-Segmentation |
|
By Components |
|
|
By Technology |
|
|
By Application |
|
Process Spectroscopy Market Country Analysis
“North America is a Dominant Region in the Global process spectroscopy market”
- North America dominates the global process spectroscopy market, driven by the early adoption of advanced analytical technologies, strong industrial base, and widespread implementation of process automation across key sectors such as pharmaceuticals, chemicals, and food & beverages
- The U.S. holds a significant share due to the presence of major spectroscopy equipment manufacturers, robust regulatory standards promoting quality assurance, and increased focus on process optimization in manufacturing environments
- The region benefits from significant R&D investments and collaborations between academia and industry, encouraging innovation in spectroscopic techniques such as NIR, FTIR, and Raman spectroscopy
- In addition, growing demand for real-time, in-line monitoring solutions and the integration of spectroscopy with AI and IoT technologies are fueling market expansion in North America
Asia-Pacific is Projected to Register the Highest Growth Rate”
- The Asia-Pacific region is expected to register the highest growth rate in the global process spectroscopy market, supported by rapid industrialization, increasing automation in production facilities, and rising quality standards across emerging economies
- Countries such as China, India, Japan, and South Korea are emerging as key markets due to expanding pharmaceutical and chemical manufacturing sectors, where real-time analysis and compliance with global standards are becoming critical
- Japan continues to lead in the adoption of advanced spectroscopic technologies, driven by a strong focus on innovation, precision manufacturing, and regulatory compliance in industries such as electronics and healthcare
- China and India are witnessing increased adoption of process spectroscopy due to government initiatives supporting industrial digitalization, a growing number of local manufacturers, and rising demand for cost-effective quality assurance solutions. The influx of international players and growing investments in R&D infrastructure further contribute to regional market growth
Process Spectroscopy Market Share
The market competitive landscape provides details by competitor. Details included are company overview, company financials, revenue generated, market potential, investment in research and development, new market initiatives, global presence, production sites and facilities, production capacities, company strengths and weaknesses, product launch, product width and breadth, application dominance. The above data points provided are only related to the companies' focus related to market.
The Major Market Leaders Operating in the Market Are:
- Agilent Technologies, Inc. (U.S.)
- ABB Ltd. (Switzerland)
- Bruker Corporation (U.S.)
- BÜCHI Labortechnik AG (Switzerland)
- Danaher Corporation (U.S.)
- FOSS (Denmark)
- HORIBA, Ltd. (Japan)
- Shimadzu Corporation (Japan)
- Thermo Fisher Scientific Inc. (U.S.)
- Yokogawa Electric Corporation (Japan)
- Sartorius AG (Germany)
- Endress+Hauser Group Services AG (Switzerland)
- PerkinElmer, Inc. (U.S.)
- Kett Electric Laboratory (Japan)
- Jasco International Co., Ltd. (Japan)
Latest Developments in Earthworks & Excavation Equipment Market
- In November 2023, Thermo Fisher Scientific announced the integration of AI-powered spectral libraries into their Raman spectroscopy systems, enabling automated identification of unknown compounds with higher accuracy and speed. Utilizing deep learning algorithms, the system can analyze complex spectral patterns, differentiate between similar compounds, and provide real-time feedback to users. Future enhancements include predictive modeling for process optimization and automated quality control workflows. This integration of AI and machine learning into spectroscopic analysis presents significant opportunities for the global process spectroscopy market
- In January 2024, Bruker Corporation announced the release of a compact, portable NIR spectrometer designed for on-site food quality analysis. This device allows for rapid, non-destructive assessment of food products, enabling immediate determination of parameters like moisture content, protein levels, and sugar concentrations. The compact form factor and user-friendly interface make it suitable for use in various settings, from production facilities to retail environments. This development highlights the increasing demand for portable spectroscopic solutions that can provide rapid, real-time data for quality assurance outside of traditional laboratory settings
- In March 2024, Shimadzu Corporation introduced a new high-resolution mass spectrometer with improved sensitivity and dynamic range for environmental monitoring applications. This instrument is designed to detect and quantify trace levels of pollutants, including PFAS and other emerging contaminants, in water and soil samples. The enhanced sensitivity and dynamic range allow for the analysis of complex samples with greater accuracy, meeting the stringent requirements of environmental regulations. This advancement reflects the growing need for highly sensitive spectroscopic tools to address increasing environmental concerns and stricter regulatory standards
- In December 2023, Sciensano launched a pilot program using handheld Raman spectrometers for rapid food authenticity testing at local markets in Belgium. These devices enable on-site identification of adulterants and contaminants, providing immediate feedback to consumers and regulators. Future developments include integration with mobile apps for data sharing and real-time alerts. This expansion of portable spectroscopy into food safety applications presents significant opportunities for the global process spectroscopy market
- In November 2023, a significant advancement in hyperspectral imaging was announced with the development of a novel, compact sensor capable of real-time, high-resolution chemical mapping for industrial quality control. This breakthrough, originating from a collaboration between a European research consortium and a leading instrumentation company, promises to revolutionize sectors like pharmaceuticals and food processing by enabling immediate identification of contaminants and precise monitoring of production processes directly on the manufacturing line
SKU-

- Interactive Data Analysis Dashboard
- Company Analysis Dashboard for high growth potential opportunities
- Research Analyst Access for customization & queries
- Competitor Analysis with Interactive dashboard
- Latest News, Updates & Trend analysis
- Harness the Power of Benchmark Analysis for Comprehensive Competitor Tracking
Data collection and base year analysis are done using data collection modules with large sample sizes. The stage includes obtaining market information or related data through various sources and strategies. It includes examining and planning all the data acquired from the past in advance. It likewise envelops the examination of information inconsistencies seen across different information sources. The market data is analysed and estimated using market statistical and coherent models. Also, market share analysis and key trend analysis are the major success factors in the market report. To know more, please request an analyst call or drop down your inquiry.
The key research methodology used by DBMR research team is data triangulation which involves data mining, analysis of the impact of data variables on the market and primary (industry expert) validation. Data models include Vendor Positioning Grid, Market Time Line Analysis, Market Overview and Guide, Company Positioning Grid, Patent Analysis, Pricing Analysis, Company Market Share Analysis, Standards of Measurement, Global versus Regional and Vendor Share Analysis. To know more about the research methodology, drop in an inquiry to speak to our industry experts.
Data Bridge Market Research is a leader in advanced formative research. We take pride in servicing our existing and new customers with data and analysis that match and suits their goal. The report can be customized to include price trend analysis of target brands understanding the market for additional countries (ask for the list of countries), clinical trial results data, literature review, refurbished market and product base analysis. Market analysis of target competitors can be analyzed from technology-based analysis to market portfolio strategies. We can add as many competitors that you require data about in the format and data style you are looking for. Our team of analysts can also provide you data in crude raw excel files pivot tables (Fact book) or can assist you in creating presentations from the data sets available in the report.


