
Global Projection Mapping Market
Market Size in USD Billion
 USD
2.80 Billion
USD
12.53 Billion
2022
2030
USD
2.80 Billion
USD
12.53 Billion
2022
2030
| 2023 - 2030 | |
| USD 2.80 Billion | |
| USD 12.53 Billion | |
| % | |
|
Projection Mapping Market Analysis and Size
The global projection mapping market is segmented on the basis of throw distance, dimension, offering and application. The growth among segments helps you analyze niche pockets of growth and strategies to approach the market and determine your core application areas and the difference in your target markets. These advances have made it possible to develop more sophisticated AI software that can handle large amounts of data and make complex decisions.
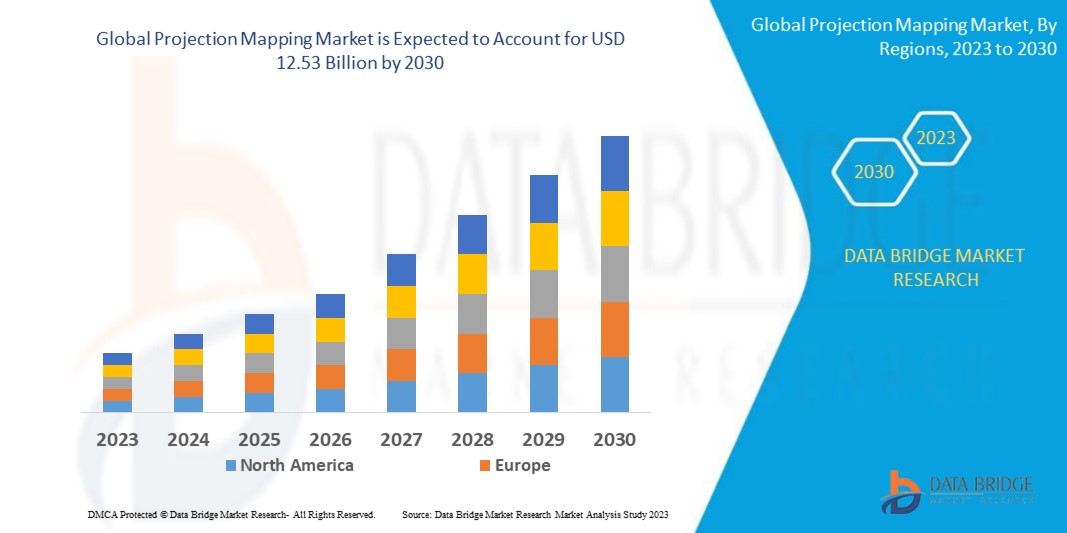
Data Bridge Market Research analyses that the global projection mapping market which was USD 2.80 billion in 2022, is expected to reach USD 12.53 billion by 2030, and is expected to undergo a CAGR of 20.50% during the forecast period of 2023 to 2030. “Short Throw” dominates the offering segment of the global projection mapping market due to advances in parallel processing, data storage, and computer power. In addition to the insights on market scenarios such as market value, growth rate, segmentation, geographical coverage, and major players, the market reports curated by the Data Bridge Market Research also include in-depth expert analysis, geographically represented company-wise production and capacity, network layouts of distributors and partners, detailed and updated price trend analysis and deficit analysis of supply chain and demand.
Projection Mapping Market Scope and Segmentation
|
Report Metric |
Details |
|
Forecast Period |
2023 to 2030 |
|
Base Year |
2022 |
|
Historic Years |
2021 (Customizable to 2015-2020) |
|
Quantitative Units |
Revenue in USD Billion, Volumes in Units, Pricing in USD |
|
Segments Covered |
Throw Distance (Short Throw, Standard Throw), Dimension (2-Dimension, 3-Dimension, 4-Dimension), Offering (Hardware, Mapping Software), Application (Events, Festival, Large Venue, Retail/ Entertainment, Others) |
|
Countries Covered |
U.S., Canada, Mexico, Brazil, Argentina, Rest of South America, Germany, Italy, U.K., France, Spain, Netherlands, Belgium, Switzerland, Turkey, Russia, Rest of Europe, Japan, China, India, South Korea, Australia, Singapore, Malaysia, Thailand, Indonesia, Philippines, Rest of Asia-Pacific, Saudi Arabia, U.A.E., South Africa, Egypt, Israel, Rest of the Middle East and Africa |
|
Market Players Covered |
Panasonic Holdings Corporation (Japan), SEIKO EPSON CORP (Japan), BenQ (Taiwan), Barco (Belgium), Christie Digital Systems USA, Inc. (U.S.), Optoma. (U.S.), Digital Projection (U.K.), Sharp NEC (Japan), Display Solutions of America, Inc. (U.S.), ViewSonic (U.S.), NuFormer (Netherlands), AV Stumpfl GmbH (Austria), Resolume (Netherlands), Lumitrix s.r.o (Czechia), Green Hippo (U.K.), garageCube (Switzerland), HeavyM (France), Pixel Rain Digital (U.S.) |
|
Market Opportunities |
|
Market Definition
The projection mapping refers to a projection technology which turns an area or object into a plausible surface for displaying video, animation or other images to be showcased. The area or object utilized for the purpose of projection could range from small indoors to massive theatrical stages or industrial buildings. This technology is extensively being used in applications such as media events, films and advertising. The process is implemented in various areas and could be carried out in 2D, 3D and 4D.
Global Projection Mapping Market Dynamics
Drivers
- High Usage of Projection Mapping
The increase in the utilization of projection mapping technology in media events globally acts as one of the major factors driving the global projection mapping market. The rise in investment for product advertising has a positive impact on the market.
- Increase in Popularity of Projection Mapping
The increase in demand of the product owing to its features such as portability, flexibility, limitless use of visual effects and the adjustability with any surface being used for projection accelerate the projection mapping market growth.
- Use in Sports and Film Theatres
The increase in the use of projection mapping technology for continuous hours, and wide use in large events such as sports and film theatres further influence the global market. The growing adoption of projection mapping in numerous industries and high customer satisfaction with the product assist in the expansion of the market. In addition, rapid urbanization, change in lifestyle, expansion of agricultural sector, surge in investments and increase in government initiatives positively impact the projection mapping market.
Opportunity
- Increasing Adoption of 4K and 8K Resolution
Adoption of 4K and 8K resolution, and use of augmented and virtual reality extend profitable opportunities to the market players in the forecast period of 2023 to 2030. Also, surge in 3D and 4D content will further expand the market.
Restraints/Challenges
- Higher Cost associated with the projection mapping
High cost associated with the projection mapping and decrease in the number of outdoor events due to the pandemic are expected to obstruct market growth. Also, complexity of projection mapping and lack of awareness and knowledge are projected to challenge the projection mapping market in the forecast period of 2023 to 2030.
- Lack of Skilled Professionals
There is a shortage of skilled professionals who can develop and implement projection mapping campaigns. This is a major challenge for businesses that want to adopt their marketing strategies.
This global projection mapping market report provides details of new recent developments, trade regulations, import-export analysis, production analysis, value chain optimization, market share, the impact of domestic and localized market players, analyses opportunities in terms of emerging revenue pockets, changes in market regulations, strategic market growth analysis, market size, category market growths, application niches and dominance, product approvals, product launches, geographic expansions, technological innovations in the market. To gain more info on the global projection mapping market contact the Data Bridge Market Research for an Analyst Brief, our team will help you make an informed market decision to achieve market growth.
Impact and Current Market Scenario of Raw Material Shortage and Shipping Delays
Data Bridge Market Research offers a high-level analysis of the market and delivers information by keeping in account the impact and current market environment of raw material shortage and shipping delays. This translates into assessing strategic possibilities, creating effective action plans, and assisting businesses in making important decisions.
Apart from the standard report, we also offer in-depth analysis of the procurement level from forecasted shipping delays, distributor mapping by region, commodity analysis, production analysis, price mapping trends, sourcing, category performance analysis, supply chain risk management solutions, advanced benchmarking, and other services for procurement and strategic support.
Expected Impact of Economic Slowdown on the Pricing and Availability of Products
When economic activity slows, industries begin to suffer. The forecasted effects of the economic downturn on the pricing and accessibility of the products are taken into account in the market insight reports and intelligence services provided by DBMR. With this, our clients can typically keep one step ahead of their competitors, project their sales and revenue, and estimate their profit and loss expenditures.
Recent Development
- In Mach 2021, Barco unveiled information about the F400-HR. This projected is the world's first truly native 4K single-chip DLP projector that can achieve resolution without the requirement for pixel stuffing
- In March 2021, Seiko Epson Corporation launched EB-PU1000 Series and EB-PU2010 laser projectors. These projectors are known to offer an output ranging from 6,000 to 10,000 lumens resulting in bright and true-to-life images
Global Projection Mapping Market Scope
The global projection mapping market is segmented on the basis of throw distance, dimension, offering, and application. The growth amongst these segments will help you analyze meager growth segments in the industries and provide the users with a valuable market overview and market insights to help them make strategic decisions for identifying core market applications.
Throw Distance
- Short Throw
- Standard Throw
Dimension
- 2-Dimension
- 3-Dimension
- 4-Dimension
Offering
- Hardware
- Mapping
- Software
Application
- Events
- Festival
- Large Venue
- Retail/Entertainment
- Others
The Global Projection Mapping Market Region Analysis/Insights
The Global Projection Mapping Market is analyzed and market size insights and trends are provided by region, throw distance, dimension, offering and application as referenced above.
The regions covered in the global projection mapping market are North America, South America, Europe, Asia-Pacific, and the Middle East and Africa. The countries covered in the Global Projection Mapping Market report are U.S., Canada, Mexico, Brazil, Argentina, the Rest of South America, Germany, Italy, U.K., France, Spain, Netherlands, Belgium, Switzerland, Turkey, Russia, Rest of Europe, Japan, China, India, South Korea, Australia, Singapore, Malaysia, Thailand, Indonesia, Philippines, Rest of Asia-Pacific, Saudi Arabia, U.A.E, South Africa, Egypt, Israel, Rest of the Middle East and Africa.
North America dominates the global projection mapping market because North America is home to some of the world's leading research universities and research institutions, which are constantly developing new AI-powered marketing technologies.
Asia-Pacific is the fastest-growing country in the global projection mapping market due to businesses in Asia-Pacific are increasingly adopting AI to improve their marketing performance. This is being driven by the region's large and growing market, as well as the increasing availability of AI-powered marketing solutions.
The region section of the report also provides individual market-impacting factors and changes in regulation in the market domestically that impact the current and future trends of the market. Data points like downstream and upstream value chain analysis, technical trends, and Porter’s five forces analysis, case studies are some of the pointers used to forecast the market scenario for individual countries. Also, the presence and availability of global brands and the challenges faced due to large or scarce competition from local and domestic brands, the impact of domestic tariffs, and trade routes are considered while providing forecast analysis of the region data.
Competitive Landscape and Global Projection Mapping Market Share Analysis
The global projection mapping market competitive landscape provides details of competitors. Details included are company overview, company financials, revenue generated, market potential, investment in research and development, new market initiatives, global presence, production sites and facilities, production capacities, company strengths and weaknesses, product launch, product width and breadth, and application dominance. The above data points provided are only related to the companies' focus related to the global projection mapping market.
Some of the major players operating in the global projection mapping market are:
- Panasonic Holdings Corporation (Japan)
- SEIKO EPSON CORP (Japan)
- BenQ (Taiwan)
- Barco (Belgium)
- Christie Digital Systems USA, Inc. (U.S.)
- Optoma. (U.S.)
- Digital Projection (U.K.)
- Sharp NEC (Japan)
- Display Solutions of America, Inc. (U.S.)
- ViewSonic (U.S.)
- NuFormer (Netherlands)
- AV Stumpfl GmbH (Austria)
- Resolume (Netherlands)
- Lumitrix s.r.o (Czechia)
- Green Hippo (U.K.)
- garageCube (Switzerland)
- HeavyM (France)
- Pixel Rain Digital (U.S.)
SKU-

- Interactive Data Analysis Dashboard
- Company Analysis Dashboard for high growth potential opportunities
- Research Analyst Access for customization & queries
- Competitor Analysis with Interactive dashboard
- Latest News, Updates & Trend analysis
- Harness the Power of Benchmark Analysis for Comprehensive Competitor Tracking
Table of Content
1 INTRODUCTION
1.1 OBJECTIVES OF THE STUDY
1.2 MARKET DEFINITION
1.3 OVERVIEW OF GLOBAL PROJECTION MAPPING MARKET
1.4 CURRENCY AND PRICING
1.5 LIMITATION
1.6 MARKETS COVERED
2 MARKET SEGMENTATION
2.1 KEY TAKEAWAYS
2.2 ARRIVING AT THE GLOBAL PROJECTION MAPPING MARKET
2.2.1 VENDOR POSITIONING GRID
2.2.2 TECHNOLOGY LIFE LINE CURVE
2.2.3 MARKET GUIDE
2.2.4 COMAPANY MARKET SHARE ANALYSIS
2.2.5 MULTIVARIATE MODELLING
2.2.6 TOP TO BOTTOM ANALYSIS
2.2.7 STANDARDS OF MEASUREMENT
2.2.8 VENDOR SHARE ANALYSIS
2.2.9 DATA POINTS FROM KEY PRIMARY INTERVIEWS
2.2.10 DATA POINTS FROM KEY SECONDARY DATABASES
2.3 GLOBAL PROJECTION MAPPING MARKET: RESEARCH SNAPSHOT
2.4 ASSUMPTIONS
3 MARKET OVERVIEW
3.1 DRIVERS
3.2 RESTRAINTS
3.3 OPPORTUNITIES
3.4 CHALLENGES
4 EXECUTIVE SUMMARY
5 PREMIUM INSIGHT
5.1 PORTERS FIVE FORCES
5.2 REGULATORY STANDARDS
5.3 TECHNOLOGICAL TRENDS
5.3.1 REAL-TIME TRACKING AND PROJECTION MAPPING
5.3.2 SPATIAL AUGMENTED REALITY
5.3.3 PROJECTION MAPPING IN 4K
5.3.4 MEDICAL IMAGE PROJECTION SYSTEMS
5.4 PATENT ANALYSIS
5.5 CASE STUDY
5.6 VALUE CHAIN ANALYSIS
5.7 COMPANY COMPARITIVE ANALYSIS
6 GLOBAL PROJECTION MAPPING MARKET, BY COMPONENTS
6.1 OVERVIEW
6.2 HARDWARE
6.2.1 PROJECTORS
6.2.1.1. BY BRIGHTNESS/LUMENS
6.2.1.1.1. LESS THAN 10,000
6.2.1.1.2. 10,001 - 20,000
6.2.1.1.3. 20,001 - 30,000
6.2.1.1.4. 30,001 - 40,000
6.2.1.1.5. 40,001 - 50,000
6.2.1.2. BY RESOLUTION
6.2.1.2.1. 2K
6.2.1.2.2. HD
6.2.1.2.3. 4K
6.2.1.2.4. UHD
6.2.1.2.5. WUXGA
6.2.1.2.6. OTHERS
6.2.1.3. BY IMAGING TECHNOLOGY
6.2.1.3.1. DLP
6.2.1.3.1.1 1DLP
6.2.1.3.1.2 3DLP
6.2.1.3.1.3 6DLP
6.2.1.3.1.4 OTHERS
6.2.1.3.2. LCD
6.2.1.4. ILLUMINATION SOURCE
6.2.1.4.1. XENON LAMP
6.2.1.4.2. LASER
6.2.1.4.3. RGB PURE LASER
6.2.2 IMAGE PROCESSORS
6.2.3 MEDIA SERVERS & PLAYERS
6.3 SOFTWARE
6.3.1 BY OPERATING SYSTEM
6.3.1.1. MAC
6.3.1.2. WINDOWS
7 GLOBAL PROJECTION MAPPING MARKET, BY PROJECTION TYPE
7.1 OVERVIEW
7.2 2D
7.3 3D
7.4 4D
8 GLOBAL PROJECTION MAPPING MARKET, BY THROW DISTANCE
8.1 OVERVIEW
8.2 STANDARD THROW
8.3 SHORT THROW
9 GLOBAL PROJECTION MAPPING MARKET, BY TYPES OF MAP PROJECTION
9.1 OVERVIEW
9.2 PLANAR, AZIMUTHAL OR ZENITHAL PROJECTION
9.2.1 GNOMONIC PROJECTION
9.2.2 STEREOGRAPHIC PROJECTION
9.2.3 ORTHOGRAPHIC PROJECTION
9.3 CONIC PROJECTION
9.3.1 CENTRAL CONICAL PROJECTION
9.3.2 SECANT CONICAL PROJECTION
9.3.3 POLYCONIC PROJECTION
9.4 CYLINDRICAL PROJECTION
9.5 MATHEMATICAL OR CONVENTIONAL PROJECTION
9.5.1 MOLLWEIDE HOMOLOGRAPHIC PROJECTION
9.5.2 SINUSOIDAL PROJECTION OR SAMSON FLAMSTEED PROJECTION
9.5.3 HOMOLOSINE PROJECTION
10 GLOBAL PROJECTION MAPPING MARKET, BY APPLICATION
10.1 OVERVIEW
10.2 BUILDINGS
10.3 STATUES
10.4 THEATRE PRODUCTIONS
10.5 THEME PARKS
10.6 MUSEUMS
10.7 CONCERTS/EVENTS
10.8 ART INSTALLATIONS
10.9 PLAYING SURFACES
11 GLOBAL PROJECTION MAPPING MARKET, BY END USER
11.1 OVERVIEW
11.2 PROFESSIONAL
11.3 AMATEUR
11.4 STUDENT
11.5 TEACHER
12 GLOBAL PROJECTION MAPPING MARKET, BY GEOGRAPHY
GLOBAL PROJECTION MAPPING MARKET, (ALL SEGMENTATION PROVIDED ABOVE IS REPRESENTED IN THIS CHAPTER BY COUNTRY)
12.1 NORTH AMERICA
12.1.1 U.S.
12.1.2 CANADA
12.1.3 MEXICO
12.2 EUROPE
12.2.1 GERMANY
12.2.2 FRANCE
12.2.3 U.K.
12.2.4 ITALY
12.2.5 SPAIN
12.2.6 RUSSIA
12.2.7 TURKEY
12.2.8 BELGIUM
12.2.9 NETHERLANDS
12.2.10 NORWAY
12.2.11 FINLAND
12.2.12 SWITZERLAND
12.2.13 DENMARK
12.2.14 SWEDEN
12.2.15 POLAND
12.2.16 REST OF EUROPE
12.3 ASIA PACIFIC
12.3.1 JAPAN
12.3.2 CHINA
12.3.3 SOUTH KOREA
12.3.4 INDIA
12.3.5 AUSTRALIA
12.3.6 NEW ZEALAND
12.3.7 SINGAPORE
12.3.8 THAILAND
12.3.9 MALAYSIA
12.3.10 INDONESIA
12.3.11 PHILIPPINES
12.3.12 TAIWAN
12.3.13 VIETNAM
12.3.14 REST OF ASIA PACIFIC
12.4 SOUTH AMERICA
12.4.1 BRAZIL
12.4.2 ARGENTINA
12.4.3 REST OF SOUTH AMERICA
12.5 MIDDLE EAST AND AFRICA
12.5.1 SOUTH AFRICA
12.5.2 EGYPT
12.5.3 SAUDI ARABIA
12.5.4 U.A.E
12.5.5 OMAN
12.5.6 BAHRAIN
12.5.7 ISRAEL
12.5.8 KUWAIT
12.5.9 QATAR
12.5.10 REST OF MIDDLE EAST AND AFRICA
12.6 KEY PRIMARY INSIGHTS: BY MAJOR COUNTRIES
13 GLOBAL PROJECTION MAPPING MARKET,COMPANY LANDSCAPE
13.1 COMPANY SHARE ANALYSIS: GLOBAL
13.2 COMPANY SHARE ANALYSIS: NORTH AMERICA
13.3 COMPANY SHARE ANALYSIS: EUROPE
13.4 COMPANY SHARE ANALYSIS: ASIA PACIFIC
13.5 MERGERS & ACQUISITIONS
13.6 NEW PRODUCT DEVELOPMENT AND APPROVALS
13.7 EXPANSIONS
13.8 REGULATORY CHANGES
13.9 PARTNERSHIP AND OTHER STRATEGIC DEVELOPMENTS
14 GLOBAL PROJECTION MAPPING MARKET, SWOT & DBMR ANALYSIS
15 GLOBAL PROJECTION MAPPING MARKET, COMPANY PROFILE
15.1 HEAVYM
15.1.1 COMPANY SNAPSHOT
15.1.2 REVENUE ANALYSIS
15.1.3 GEOGRAPHIC PRESENCE
15.1.4 PRODUCT PORTFOLIO
15.1.5 RECENT DEVELOPMENT
15.2 CHRISTIE DIGITAL SYSTEMS USA, INC
15.2.1 COMPANY SNAPSHOT
15.2.2 REVENUE ANALYSIS
15.2.3 GEOGRAPHIC PRESENCE
15.2.4 PRODUCT PORTFOLIO
15.2.5 RECENT DEVELOPMENT
15.3 BARCO
15.3.1 COMPANY SNAPSHOT
15.3.2 REVENUE ANALYSIS
15.3.3 GEOGRAPHIC PRESENCE
15.3.4 PRODUCT PORTFOLIO
15.3.5 RECENT DEVELOPMENT
15.4 QED PRODUCTIONS
15.4.1 COMPANY SNAPSHOT
15.4.2 REVENUE ANALYSIS
15.4.3 GEOGRAPHIC PRESENCE
15.4.4 PRODUCT PORTFOLIO
15.4.5 RECENT DEVELOPMENT
15.5 PANASONIC CORPORATION
15.5.1 COMPANY SNAPSHOT
15.5.2 REVENUE ANALYSIS
15.5.3 GEOGRAPHIC PRESENCE
15.5.4 PRODUCT PORTFOLIO
15.5.5 RECENT DEVELOPMENT
15.6 SEIKO EPSON CORPORATION
15.6.1 COMPANY SNAPSHOT
15.6.2 REVENUE ANALYSIS
15.6.3 GEOGRAPHIC PRESENCE
15.6.4 PRODUCT PORTFOLIO
15.6.5 RECENT DEVELOPMENT
15.7 BENQ
15.7.1 COMPANY SNAPSHOT
15.7.2 REVENUE ANALYSIS
15.7.3 GEOGRAPHIC PRESENCE
15.7.4 PRODUCT PORTFOLIO
15.7.5 RECENT DEVELOPMENT
15.8 OPTOMA CORPORATION
15.8.1 COMPANY SNAPSHOT
15.8.2 REVENUE ANALYSIS
15.8.3 GEOGRAPHIC PRESENCE
15.8.4 PRODUCT PORTFOLIO
15.8.5 RECENT DEVELOPMENT
15.9 DIGITAL PROJECTION (A DELTA ASSOCIATE COMPANY)
15.9.1 COMPANY SNAPSHOT
15.9.2 REVENUE ANALYSIS
15.9.3 GEOGRAPHIC PRESENCE
15.9.4 PRODUCT PORTFOLIO
15.9.5 RECENT DEVELOPMENT
15.1 SHARP NEC DISPLAY SOLUTIONS
15.10.1 COMPANY SNAPSHOT
15.10.2 REVENUE ANALYSIS
15.10.3 GEOGRAPHIC PRESENCE
15.10.4 PRODUCT PORTFOLIO
15.10.5 RECENT DEVELOPMENT
15.11 VIVITEK (A DELTA ELECTRONICS, INC)
15.11.1 COMPANY SNAPSHOT
15.11.2 REVENUE ANALYSIS
15.11.3 GEOGRAPHIC PRESENCE
15.11.4 PRODUCT PORTFOLIO
15.11.5 RECENT DEVELOPMENT
15.12 VIEWSONIC CORPORATION
15.12.1 COMPANY SNAPSHOT
15.12.2 REVENUE ANALYSIS
15.12.3 GEOGRAPHIC PRESENCE
15.12.4 PRODUCT PORTFOLIO
15.12.5 RECENT DEVELOPMENT
15.13 DATATON AB
15.13.1 COMPANY SNAPSHOT
15.13.2 REVENUE ANALYSIS
15.13.3 GEOGRAPHIC PRESENCE
15.13.4 PRODUCT PORTFOLIO
15.13.5 RECENT DEVELOPMENT
15.14 VIOSO GMBH
15.14.1 COMPANY SNAPSHOT
15.14.2 REVENUE ANALYSIS
15.14.3 GEOGRAPHIC PRESENCE
15.14.4 PRODUCT PORTFOLIO
15.14.5 RECENT DEVELOPMENT
15.15 PIXADOO
15.15.1 COMPANY SNAPSHOT
15.15.2 REVENUE ANALYSIS
15.15.3 GEOGRAPHIC PRESENCE
15.15.4 PRODUCT PORTFOLIO
15.15.5 RECENT DEVELOPMENT
15.16 MOTION MAPPING
15.16.1 COMPANY SNAPSHOT
15.16.2 REVENUE ANALYSIS
15.16.3 GEOGRAPHIC PRESENCE
15.16.4 PRODUCT PORTFOLIO
15.16.5 RECENT DEVELOPMENT
15.17 AV STUMPFL GMBH
15.17.1 COMPANY SNAPSHOT
15.17.2 REVENUE ANALYSIS
15.17.3 GEOGRAPHIC PRESENCE
15.17.4 PRODUCT PORTFOLIO
15.17.5 RECENT DEVELOPMENT
15.18 TVONE (GREEN HIPPO)
15.18.1 COMPANY SNAPSHOT
15.18.2 REVENUE ANALYSIS
15.18.3 GEOGRAPHIC PRESENCE
15.18.4 PRODUCT PORTFOLIO
15.18.5 RECENT DEVELOPMENT
15.19 NUFORMER
15.19.1 COMPANY SNAPSHOT
15.19.2 REVENUE ANALYSIS
15.19.3 GEOGRAPHIC PRESENCE
15.19.4 PRODUCT PORTFOLIO
15.19.5 RECENT DEVELOPMENT
15.2 LUMITRIX
15.20.1 COMPANY SNAPSHOT
15.20.2 REVENUE ANALYSIS
15.20.3 GEOGRAPHIC PRESENCE
15.20.4 PRODUCT PORTFOLIO
15.20.5 RECENT DEVELOPMENT
15.21 ADOBE
15.21.1 COMPANY SNAPSHOT
15.21.2 REVENUE ANALYSIS
15.21.3 GEOGRAPHIC PRESENCE
15.21.4 PRODUCT PORTFOLIO
15.21.5 RECENT DEVELOPMENT
NOTE: THE COMPANIES PROFILED IS NOT EXHAUSTIVE LIST AND IS AS PER OUR PREVIOUS CLIENT REQUIREMENT. WE PROFILE MORE THAN 100 COMPANIES IN OUR STUDY AND HENCE THE LIST OF COMPANIES CAN BE MODIFIED OR REPLACED ON REQUEST
16 CONCLUSION
17 QUESTIONNAIRE
18 RELATED REPORTS
19 ABOUT DATA BRIDGE MARKET RESEARCH
Global Projection Mapping Market, Supply Chain Analysis and Ecosystem Framework
To support market growth and help clients navigate the impact of geopolitical shifts, DBMR has integrated in-depth supply chain analysis into its Global Projection Mapping Market research reports. This addition empowers clients to respond effectively to global changes affecting their industries. The supply chain analysis section includes detailed insights such as Global Projection Mapping Market consumption and production by country, price trend analysis, the impact of tariffs and geopolitical developments, and import and export trends by country and HSN code. It also highlights major suppliers with data on production capacity and company profiles, as well as key importers and exporters. In addition to research, DBMR offers specialized supply chain consulting services backed by over a decade of experience, providing solutions like supplier discovery, supplier risk assessment, price trend analysis, impact evaluation of inflation and trade route changes, and comprehensive market trend analysis.
Data collection and base year analysis are done using data collection modules with large sample sizes. The stage includes obtaining market information or related data through various sources and strategies. It includes examining and planning all the data acquired from the past in advance. It likewise envelops the examination of information inconsistencies seen across different information sources. The market data is analysed and estimated using market statistical and coherent models. Also, market share analysis and key trend analysis are the major success factors in the market report. To know more, please request an analyst call or drop down your inquiry.
The key research methodology used by DBMR research team is data triangulation which involves data mining, analysis of the impact of data variables on the market and primary (industry expert) validation. Data models include Vendor Positioning Grid, Market Time Line Analysis, Market Overview and Guide, Company Positioning Grid, Patent Analysis, Pricing Analysis, Company Market Share Analysis, Standards of Measurement, Global versus Regional and Vendor Share Analysis. To know more about the research methodology, drop in an inquiry to speak to our industry experts.
Data Bridge Market Research is a leader in advanced formative research. We take pride in servicing our existing and new customers with data and analysis that match and suits their goal. The report can be customized to include price trend analysis of target brands understanding the market for additional countries (ask for the list of countries), clinical trial results data, literature review, refurbished market and product base analysis. Market analysis of target competitors can be analyzed from technology-based analysis to market portfolio strategies. We can add as many competitors that you require data about in the format and data style you are looking for. Our team of analysts can also provide you data in crude raw excel files pivot tables (Fact book) or can assist you in creating presentations from the data sets available in the report.


