
Global Public Transport Market
Market Size in USD Billion
 USD
281.80 Billion
USD
642.43 Billion
2025
2033
USD
281.80 Billion
USD
642.43 Billion
2025
2033
| 2026 - 2033 | |
| USD 281.80 Billion | |
| USD 642.43 Billion | |
| % | |
|
What is the Public Transport Market Size and Growth Rate?
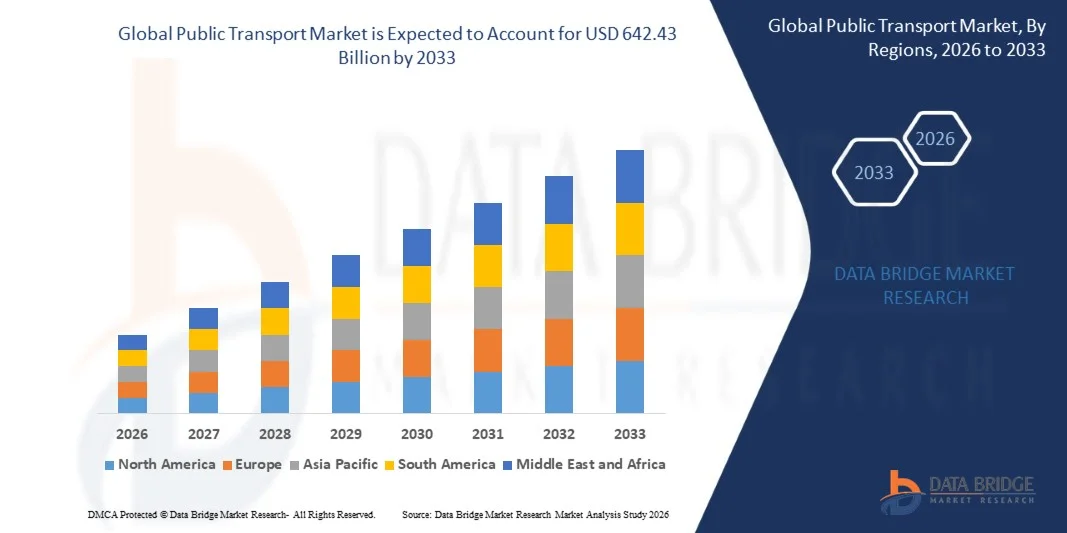
- As per Data Bridge Market Research analysis, the public transport market was valued at USD 281.80 billion in 2025 and is projected to reach USD 642.43 billion by 2033, growing at a CAGR of 10.85% from 2026 to 2033.
- The market is experiencing consistent growth driven by increasing urbanization, rising demand for efficient and sustainable transportation solutions, growing investments in public transit infrastructure, and the adoption of smart transportation technologies across cities worldwide.
- The increasing need to reduce traffic congestion, minimize carbon emissions, and improve urban mobility, combined with government initiatives supporting electric buses, metro systems, and intelligent transportation solutions, is compelling cities and transportation authorities to modernize public transit networks. Digital ticketing systems, connected mobility platforms, and sustainable transit solutions are transforming traditional public transportation into efficient, accessible, and environmentally friendly mobility systems.
Market Size & Forecast
- Global Market Value (2025): USD 281.80 Billion
- Expected Market Value (2033): USD 642.43 Billion
- Forecast CAGR (2026–2033): 10.85%
- Leading Region in 2025: North America
- Fastest Growing Region: Asia Pacific
What are the Major Takeaways of the Public Transport Market?
- North America dominated the public transportation market with the largest revenue share of 34.5% in 2025, supported by well-established public transit infrastructure, increasing investments in urban mobility solutions, and the adoption of advanced transportation technologies across the U.S. and Canada.
- Asia-Pacific is expected to be the fastest-growing region during the forecast period, registering a CAGR of 10.2% from 2026 to 2033, fueled by rapid urbanization, rising population density, expanding public transportation networks, and increasing government initiatives supporting smart and sustainable mobility solutions.
- The bus segment led the market with a 38.2% share in 2025, driven by its widespread availability, cost-effectiveness, and operational flexibility across urban, suburban, and rural transportation networks
- Underground (metro) are the fastest-growing type, projected to register a CAGR of 6.7%, reflecting the surge in urban congestion, increasing population density, and investments in mass rapid transit systems.
- The diesel segment dominated the propulsion category with a 55.60% revenue share in 2025, led by the large installed base of diesel-powered buses and transit vehicles worldwide.
- Road accounted for 60% of the market share in 2025, preferred by extensive deployment of buses, taxis, and other road-based transit services.
- The rural segment is the fastest-growing application category, with a CAGR of 6.8%, driven by increasing government initiatives to improve transportation accessibility in underserved regions.
Report Scope and Public Transport Market Segmentation
|
Attributes |
Public Transport Key Market Insights |
|
Segments Covered |
|
|
Countries Covered |
North America
Europe
Asia-Pacific
Middle East and Africa
South America
|
|
Key Market Players |
|
|
Market Opportunities |
|
|
Value Added Data Infosets |
In addition to the market insights such as market value, growth rate, market segments, geographical coverage, market players, and market scenario, the market report curated by the Data Bridge Market Research team includes in-depth expert analysis, import/export analysis, pricing analysis, production consumption analysis, and pestle analysis. |
What is the Key Trend in the Public Transport Market?
- Public transport operators are increasingly adopting smart mobility solutions, including intelligent transportation systems, digital ticketing, and real-time passenger information platforms, to improve operational efficiency and enhance commuter experience.
- For instance, in January 2025, Transport for London (TfL) introduced an update to the TfL Go app that enabled customers to access contactless and Oyster account information, view journey history, manage fares, and access real-time travel information for Tube, bus, and rail services, improving digital accessibility and passenger convenience.
- Connected transportation technologies enable operators to optimize fleet management, monitor passenger flow, and improve service reliability through data-driven decision-making.
- Transit agencies and municipalities are increasingly deploying electric buses and sustainable mobility solutions to reduce emissions, improve air quality, and support global decarbonization targets.
- For instance, in May 2024, the Metropolitan Transportation Authority (MTA) announced the delivery of 60 new zero-emission electric buses and continued investment in charging infrastructure upgrades at bus depots in collaboration with Con Edison, supporting its long-term transition toward a zero-emission bus fleet.
- As cities continue prioritizing sustainable urban mobility and digital transformation, the adoption of intelligent and electrified public transportation systems is expected to accelerate, reinforcing technology-driven transit networks as a core component of future urban mobility.
What are the Key Drivers of the Public Transport Market?
- The rapid growth of urbanization and increasing traffic congestion have significantly increased demand for efficient public transportation systems capable of providing affordable, reliable, and sustainable mobility solutions across major cities.
- For instance, in October 2024, the United Nations highlighted the continued growth of urban populations through the release of the World Urbanization Prospects: The 2024 Revision, emphasizing the need for sustainable urban planning, resilient infrastructure, and improved urban mobility solutions to support expanding cities worldwide.
- Governments, transportation authorities, and infrastructure developers are investing in metro networks, bus rapid transit systems, and smart transit infrastructure to improve connectivity and reduce dependence on private vehicles.
- For instance, in July 2025, the European Commission selected 94 transport projects to receive nearly USD 3.19 billion in EU grants under the Connecting Europe Facility (CEF), supporting sustainable and connected mobility through rail modernization, multimodal passenger hubs, digital transport solutions, and cleaner transport infrastructure across Europe.
- With cities worldwide focusing on reducing carbon emissions, improving accessibility, and enhancing urban connectivity, public transportation systems will remain essential for developing sustainable and efficient mobility ecosystems.
Which Factors are Challenging the Growth of the Next Generation Tobacco Products Market?
- Public transportation infrastructure requires significant capital investment due to the high costs associated with developing rail networks, electric bus fleets, charging infrastructure, and advanced transit management systems.
- These high investment requirements limit adoption among smaller municipalities and developing regions where funding constraints restrict large-scale public transport modernization projects.
- For instance, in April 2024, the International Transport Forum (ITF) highlighted that current investment levels for sustainable transport in the Global South remain significantly below required levels, with financing gaps limiting the expansion of sustainable transport infrastructure and the transition toward low-carbon mobility systems.
- Operational challenges, including maintenance costs, aging infrastructure, limited funding availability, and complex regulatory requirements, continue to affect the expansion and modernization of public transportation networks.
- The high capital expenditure and ongoing operational costs associated with advanced public transport systems continue to restrict market growth, particularly in cost-sensitive regions, slowing the widespread deployment of modern and sustainable mobility solutions despite increasing demand.
How is the Public Transport Market Segmented?
The public transport market is segmented on the basis of type, propulsion, mode, application, and end use.
- By Type
On the basis of type, the public transport market is segmented into bus, tram, underground (metro), regional taxi, light rail, train, and high-speed line. The bus segment dominated the market with 38.2% share in 2025, owing to its widespread availability, cost-effectiveness, and operational flexibility across urban, suburban, and rural transportation networks. Buses require comparatively lower infrastructure investment than rail-based systems, making them a preferred choice for expanding public transportation coverage. Increasing adoption of electric buses and government initiatives supporting clean mobility are further strengthening segment growth. Public transport authorities are increasingly modernizing bus fleets with smart ticketing, GPS tracking, and fleet management technologies. Expansion of bus rapid transit systems in emerging economies is also contributing to market dominance. The affordability, accessibility, and scalability of buses continue to make them the leading public transportation mode globally.
The underground (metro) segment is projected to be the fastest-growing type, expanding at an estimated CAGR of 6.7% from 2026 to 2033, driven by rising urban congestion, increasing population density, and investments in mass rapid transit systems. Metro systems provide high passenger capacity, faster commuting, and reduced dependency on private vehicles. Governments across Asia-Pacific, Europe, and the Middle East are investing heavily in metro expansion projects. Integration of automated operations, digital payment systems, and smart passenger information platforms is improving metro efficiency. Increasing focus on reducing urban emissions is encouraging cities to adopt rail-based mobility solutions. Rapid urbanization is expected to create significant opportunities for metro infrastructure development.
- By Propulsion
On the basis of propulsion, the public transport market is segmented into diesel, gasoline, electric, and others. The diesel propulsion segment dominated the market with an estimated share of 55.60% in 2025, supported by the large installed base of diesel-powered buses and transit vehicles worldwide. Diesel systems continue to be widely used due to established fuel infrastructure, operational reliability, and long-distance capability. Many developing countries continue operating diesel fleets because of lower initial acquisition costs. Existing public transport operators are upgrading diesel vehicles with improved emission-control technologies to comply with environmental standards. However, stricter emission regulations are gradually reducing dependence on conventional fuels. The segment remains dominant due to extensive global fleet penetration.
The electric propulsion segment is expected to be the fastest-growing segment with an estimated CAGR of 12.5% from 2026 to 2033, driven by increasing government efforts toward zero-emission transportation and sustainable mobility. Electric buses are gaining adoption due to lower operating costs, reduced emissions, and advancements in battery technology. Governments are introducing subsidies, incentives, and electrification targets to accelerate fleet transition. Expansion of charging infrastructure and improvements in battery range are enhancing adoption across cities. Public transportation agencies are increasingly investing in electric fleets to achieve climate targets. The growing focus on sustainable urban mobility is expected to accelerate electric propulsion adoption.
- By Mode
On the basis of mode, the public transport market is segmented into road, rail, and others. The road segment dominated the market with 60% estimated revenue share in 2025, driven by extensive deployment of buses, taxis, and other road-based transit services. Road-based transportation provides flexible routes, lower infrastructure requirements, and greater accessibility compared with rail networks. Bus systems remain the backbone of public transportation in many countries due to their affordability and operational flexibility. Growing urban mobility demand is encouraging investments in advanced bus networks and intelligent transport systems. The expansion of electric buses is further improving sustainability within road transport. The segment continues to dominate due to its ability to serve both densely populated cities and remote regions.
The rail segment is projected to be the fastest-growing mode with an estimated CAGR of 8.0% from 2026 to 2033, supported by increasing investments in metro rail, light rail, commuter rail, and high-speed rail infrastructure. Rail transportation offers high passenger capacity, energy efficiency, and lower emissions compared with road-based systems. Governments are prioritizing rail development to reduce congestion and improve urban connectivity. Expansion of high-speed rail corridors and metropolitan rail networks is creating new growth opportunities. Digital signaling, automation, and smart rail technologies are improving operational efficiency. Growing preference for sustainable mass transit solutions is accelerating rail adoption globally.
- By Application
On the basis of application, the public transport market is segmented into city and rural. The city segment dominated the market with an estimated share of 75.0% in 2025, supported by increasing urbanization, rising commuter demand, and expansion of metropolitan transportation networks. Urban areas require efficient public transportation systems to manage congestion, pollution, and increasing mobility requirements. Investments in metro systems, electric buses, and integrated transit platforms are primarily concentrated in cities. Smart city initiatives are further supporting the adoption of connected transportation solutions. Increasing demand for convenient and affordable urban mobility continues to strengthen this segment. The segment remains dominant due to the growing concentration of population in urban areas.
The rural segment is expected to grow at an estimated CAGR of 6.8% from 2026 to 2033, driven by increasing government initiatives to improve transportation accessibility in underserved regions. Rural public transport expansion supports connectivity between remote communities and urban centers. Governments are investing in regional bus networks and demand-responsive transportation services. Digital mobility platforms are improving transport availability in low-density areas. Rising focus on inclusive mobility is encouraging infrastructure development beyond major cities. The segment is expected to gain importance as transportation accessibility becomes a key policy priority.
- By End Use
On the basis of end use, the public transport market is segmented into intracity, intercity, and others. The intracity segment dominated the market with an estimated share of 65.0% in 2025, driven by increasing daily commuting requirements within metropolitan areas. Intracity systems, including buses, metros, and light rail networks, are essential for managing urban mobility challenges. Growing urban populations are increasing demand for efficient short-distance transportation solutions. Governments are investing in integrated urban transit systems to improve connectivity and reduce traffic congestion. Digital ticketing, real-time tracking, and mobility-as-a-service platforms are enhancing passenger convenience. The segment continues to dominate due to continuous demand for daily urban transportation.
The intercity segment is projected to be the fastest-growing end-use segment with an estimated CAGR of 9.0% from 2026 to 2033, supported by increasing regional connectivity requirements and expansion of long-distance public transportation networks. Growth in high-speed rail, intercity buses, and regional rail services is improving connections between cities. Economic development and increasing passenger mobility are driving demand for efficient intercity transportation. Governments are investing in transportation corridors to improve regional accessibility. Advanced scheduling systems and digital booking platforms are enhancing intercity travel experiences. The segment is expected to witness strong growth as sustainable alternatives to private vehicles gain popularity.
Which Region Holds the Largest Share of the Public Transport Market?
- North America dominated the public transportation market with the largest revenue share of 34.5% in 2025, supported by well-established public transit infrastructure, increasing investments in urban mobility solutions, and the adoption of advanced transportation technologies across the U.S. and Canada.
- The region also benefits from government initiatives focused on sustainable transportation, modernization of aging transit systems, expansion of electric bus fleets, and integration of intelligent transportation systems. Increasing adoption of digital ticketing, connected mobility platforms, and zero-emission transit solutions continues to strengthen North America’s leadership position in the global market.
U.S. Public Transport Market Insight
The U.S. public transport market is witnessing steady growth due to rising investments in transit infrastructure modernization, electric bus deployment, and smart mobility solutions. The country’s extensive urban transit networks, along with increasing government funding for public transportation upgrades, are driving demand across bus, rail, and intelligent transportation systems. In addition, growing emphasis on reducing transportation emissions and improving urban connectivity is accelerating the adoption of sustainable public transit solutions. For instance, in June 2024, the U.S. Department of Transportation announced more than USD 1.5 billion in grants through the Rebuilding American Infrastructure with Sustainability and Equity (RAISE) program to support transportation projects, including public transit improvements and mobility infrastructure upgrades.
Asia-Pacific Public Transport Market Insight
The Asia-Pacific public transport market is expected to witness rapid growth, driven by increasing urbanization, expanding metro networks, and rising investments in sustainable transportation infrastructure across countries such as China, India, and Japan. Growing passenger demand, government initiatives for smart cities, and increasing deployment of electric buses and rail-based transit systems are supporting regional market expansion. In addition, the rapid development of high-capacity urban transit networks and electrification programs is accelerating public transport adoption across emerging economies. China continued expanding its urban rail transit network, with 55 cities operating urban rail transit systems and total operational mileage exceeding 10,000 km, strengthening its position as one of the world’s largest metro markets.
Japan Public Transport Market Insight
The Japan public transport market is witnessing consistent growth due to rising investments in advanced rail infrastructure, sustainable mobility solutions, and digital transformation of transportation services. Railway operators and government agencies are increasingly adopting smart transportation technologies, including automated systems, digital ticketing, and energy-efficient transit solutions. Moreover, Japan’s strong focus on efficient urban mobility, aging population support, and low-carbon transportation is further contributing to market growth. Japan’s Ministry of Land, Infrastructure, Transport and Tourism (MLIT) continued promoting MaaS (Mobility as a Service) initiatives to integrate multiple transportation modes and improve regional mobility solutions.
China Public Transport Market Insight
The China public transport market is growing rapidly, driven by increasing urbanization, expanding high-speed rail infrastructure, and government focus on sustainable urban mobility. Growing adoption of electric buses, metro systems, and intelligent transportation platforms across major cities is significantly boosting market demand. In addition, rising investments in smart city development, transportation electrification, and large-scale rail projects are positioning China as one of the fastest-growing public transport markets globally. China’s National Railway Administration reported continued expansion of the national railway network, with high-speed railway operations reaching more than 46,000 km, supporting efficient intercity passenger transportation
U.K. Public Transport Market Insight
The U.K. public transport market is experiencing steady growth, supported by investments in rail modernization, bus electrification, and integrated mobility solutions. Increasing government focus on reducing transport emissions, improving passenger connectivity, and upgrading public transit infrastructure is contributing to market development. Furthermore, adoption of contactless payments, digital ticketing, and zero-emission buses is improving efficiency and passenger experience across the country. The U.K. government announced funding allocations to support local transport improvements, including bus service enhancements and sustainable transport infrastructure development.
Germany Public Transport Market Insight
The Germany public transport market is expanding steadily due to the country’s strong rail network, increasing investments in sustainable mobility, and government initiatives supporting public transit modernization. Transport operators are increasingly adopting electric buses, digital mobility platforms, and advanced rail technologies to improve efficiency and reduce emissions. Continuous investments in regional rail, urban transit systems, and climate-friendly transportation solutions are further driving market growth in Germany. In February 2025, the German Federal Ministry for Digital and Transport (BMDV) continued supporting climate-friendly public transport through funding programs for clean buses, providing financial support for the deployment of low-emission and zero-emission buses along with related charging infrastructure to accelerate sustainable mobility across Germany.
Which are the Top Companies in Public Transport Market?
The public transport industry is primarily led by well-established companies, including:
- Transdev Group (France)
- Keolis SA (France)
- RATP Group (France)
- SNCF Group (France)
- Deutsche Bahn AG (Germany)
- FirstGroup plc (U.K.)
- Stagecoach UK Bus (U.K.)
- National Express Group PLC (U.K.)
- Arriva Group Limited (U.K.)
- ComfortDelGro Corporation Limited (Singapore)
- MTR Corporation Limited (Hong Kong)
- Toronto Transit Commission (Canada)
- Metropolitan Transportation Authority (U.S.)
- Massachusetts Bay Transportation Authority (U.S.)
- Kapsch TrafficCom AG (Austria)
- ALSTOM SA (France)
- Siemens Mobility (Germany)
- Hitachi Rail Ltd (Japan)
- CRRC Corporation Limited (China)
- CAF Group (Spain)
What are Latest Developments in Public Transport Market?
- In December 2024, China expanded its high-speed rail network to approximately 47,000 km, strengthening the country’s position as the world’s largest high-speed railway market. The continued development of high-speed rail infrastructure is improving intercity passenger connectivity, supporting regional mobility, and enhancing the efficiency of China’s public transportation system
- In October 2023, India launched the first operational section of the Delhi–Ghaziabad–Meerut Regional Rapid Transit System (RRTS), introducing the country’s first regional rapid rail service designed to provide faster intercity connectivity. The project integrates multiple transport modes, including metro, railway, and bus networks, supporting sustainable urban and regional mobility development.
- In September 2024, the Government of India approved the PM-eBus Sewa–Payment Security Mechanism (PSM) scheme with an outlay of INR 3,435.33 crore (approximately USD 411 million) to support the procurement and operation of more than 38,000 electric buses by public transport authorities. The initiative aims to accelerate fleet electrification, reduce emissions from urban transportation, and strengthen sustainable public mobility infrastructure across Indian cities
- In July 2024, the Federal Transit Administration (FTA) awarded USD 77.5 million to the Los Angeles County Metropolitan Transportation Authority (Metro) through the Low or No Emission Grant Program to support the purchase of battery-electric buses, charging infrastructure expansion, and workforce development initiatives. The project represents a major step toward modernizing public transportation fleets and advancing zero-emission mobility solutions in the U.S.
- In November 2023, the International Finance Corporation (IFC), a member of the World Bank Group, announced an investment of up to USD 127 million to support Santiago’s electric public transport fleet in Chile. The financing will help deploy 992 electric buses for the Red Metropolitana de Movilidad system, replacing diesel buses and supporting the expansion of sustainable urban mobility solutions in Latin America. This initiative represents a major step toward reducing transport emissions and accelerating the electrification of public transportation networks.
SKU-

- Interactive Data Analysis Dashboard
- Company Analysis Dashboard for high growth potential opportunities
- Research Analyst Access for customization & queries
- Competitor Analysis with Interactive dashboard
- Latest News, Updates & Trend analysis
- Harness the Power of Benchmark Analysis for Comprehensive Competitor Tracking
Data collection and base year analysis are done using data collection modules with large sample sizes. The stage includes obtaining market information or related data through various sources and strategies. It includes examining and planning all the data acquired from the past in advance. It likewise envelops the examination of information inconsistencies seen across different information sources. The market data is analysed and estimated using market statistical and coherent models. Also, market share analysis and key trend analysis are the major success factors in the market report. To know more, please request an analyst call or drop down your inquiry.
The key research methodology used by DBMR research team is data triangulation which involves data mining, analysis of the impact of data variables on the market and primary (industry expert) validation. Data models include Vendor Positioning Grid, Market Time Line Analysis, Market Overview and Guide, Company Positioning Grid, Patent Analysis, Pricing Analysis, Company Market Share Analysis, Standards of Measurement, Global versus Regional and Vendor Share Analysis. To know more about the research methodology, drop in an inquiry to speak to our industry experts.
Data Bridge Market Research is a leader in advanced formative research. We take pride in servicing our existing and new customers with data and analysis that match and suits their goal. The report can be customized to include price trend analysis of target brands understanding the market for additional countries (ask for the list of countries), clinical trial results data, literature review, refurbished market and product base analysis. Market analysis of target competitors can be analyzed from technology-based analysis to market portfolio strategies. We can add as many competitors that you require data about in the format and data style you are looking for. Our team of analysts can also provide you data in crude raw excel files pivot tables (Fact book) or can assist you in creating presentations from the data sets available in the report.


