
Global Quinolones Market
Market Size in USD Billion
 USD
48.80 Billion
USD
69.40 Billion
2022
2030
USD
48.80 Billion
USD
69.40 Billion
2022
2030
| 2023 - 2030 | |
| USD 48.80 Billion | |
| USD 69.40 Billion | |
| % | |
|
Quinolones Market Analysis and Size
The demand for quinolones is increasing on account of US$ 56.8 billion by 2026. Growing demand for quinolones is also estimated to leadto the growth of the quinolones market share. The rise in incidence of infectious diseases globally acts as one of the primary factors enhancing the growth of quinolones market. Numerous quinolones are currently available for the treatment of animals globally which includes poultry and fish.
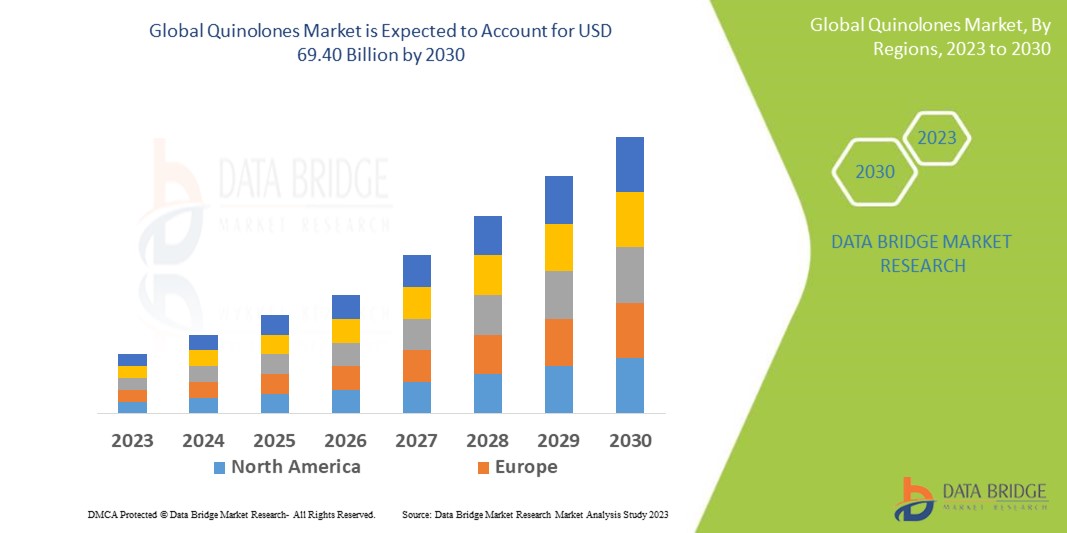
Data Bridge Market Research analyses a growth rate in the quinolones market in the forecast period 2023-2030. The expected CAGR of the quinolones market tends to be around 4.5% in the mentioned forecast period. The market value is USD 48.8 billion in 2022, and it would grow up to USD 69.40 billion by 2030. In addition to the market insights such as market value, growth rate, market segments, geographical coverage, market players, and market scenario, the market report curated by the Data Bridge Market Research team also includes in-depth expert analysis, patient epidemiology, pipeline analysis, pricing analysis, and regulatory framework.
Quinolones Market Scope and Segmentation
|
Report Metric |
Details |
|
Forecast Period |
2023 to 2030 |
|
Base Year |
2022 |
|
Historic Years |
2021 (Customizable to 2015 - 2020) |
|
Quantitative Units |
Revenue in USD Billion, Volumes in Units, Pricing in USD |
|
Segments Covered |
Disease Type (Urinary Tract Infection, Intra-Abdominal Infections, Blood Stream Infections, Clostridium Difficile Infections and Others), Pathogen Type (Gram-Positive Pathogen, Gram-Negative Pathogen), Drugs (Lomefloxacin, Gatifloxacin, Norfloxacin, Moxifloxacin, Ciprofloxacin and Others), Route of Administration (Oral, Injectable, Others), End-Users (Hospitals, Homecare, Specialty Clinics, Others), Distribution Channel (Hospital Pharmacy, Online Pharmacy, Retail Pharmacy) |
|
Countries Covered |
U.S., Canada and Mexico in North America, Germany, France, U.K., Netherlands, Switzerland, Belgium, Russia, Italy, Spain, Turkey, Rest of Europe in Europe, China, Japan, India, South Korea, Singapore, Malaysia, Australia, Thailand, Indonesia, Philippines, Rest of Asia-Pacific (APAC) in the Asia-Pacific (APAC), Saudi Arabia, U.A.E, South Africa, Egypt, Israel, Rest of Middle East and Africa (MEA) as a part of Middle East and Africa (MEA), Brazil, Argentina and Rest of South America as part of South America |
|
Market Players Covered |
GSK plc (U.K.), Novartis AG (Switzerland), Bayer AG (Germany), Merck & Co., Inc. (U.S.), Abbvie, Inc (U.S.), Pfizer Inc (U.S.), Viatris Inc. (U.S.), Lupin (India), Hikma Pharmaceuticals PLC (U.K.), Zydus Group (India), Bausch Health Companies Inc. (Canada), KYORIN Holdings, Inc (Japan), MerLion Pharmaceuticals GmbH (Germany), WOCKHARDT (India), Johnson & Johnson Private Limited (U.S.), Teva Pharmaceutical Industries Ltd.(Israel) and Sanofi (France) |
|
Market Opportunities |
|
Market Definition
A quinolone antibiotic is a broad-spectrum bactericide which has a bicyclic core structure having the chemical 4-quinolone. Quinolones are used to treat several bacterial infections in veterinary and human medicine and animal husbandry. They are classified into five distinct classes, in which one is antibiotics. Quinolones are highly effective against stomach, skin, lungs, sinuses, and urinary tract bacterial infections.
Quinolones Market Dynamics
Drivers
- Increased Awareness About Health Issues
Growing health awareness and increasing disposable income have encouraged people to drift towards healthy products, which will benefit them from the adverse health effects. Rising incidence of multidrug-resistant bacteria, raises public health concerns and also creates opportunities for medication producers. Furthermore, the European Medicines Agency's pharmacovigilance risk assessment committee has advised restricting many antibiotics by mouth, inhalation, or injection because of their long-lasting adverse effects. Thus, this expands the market growth.
Opportunities
- Growing Launch of Products
There has been launch of several products that are helpful for the market growth. For instance, in January 2018, Melinta Therapeutics, Inc. launched Baxdela. Baxdela is an oral fluoroquinolone used to treat adult patients with susceptible bacterial acute bacterial skin and skin structure infections (ABSSSI). Baxdela's introduction offers a new therapy alternative and expands the company's infection therapies space. Furthermore, KYORIN Holdings, Inc. announced that the Japanese Ministry of Health, Labor, and Welfare approved Lasvic (lascufloxacin hydrochloride), in September 2019, indicated as a first-line monotherapy for treating community-acquired respiratory and ENT infections. Lasvic's approval is a major milestone in the company's efforts to protect the increasing danger of antimicrobial resistance and provide patients with suitable treatment alternatives.
Restraints/Challenges
- Adverse Effects of Quinolones
Several side-effects are associated with the use of quinolones, because of which some of the drugs such as Tequin manufactured by Bristol-Myers Squibb have been withdrawn from the market in a very short span after their launch in 2006. As per the United States Food & Drug Administration, Tequin was discontinued because of the adverse reactions in 2.7% of more than 5,000 treated patients. Thus, the adverse effects are restraining the market growth.
This quinolones market market report provides details of new recent developments, trade regulations, import-export analysis, production analysis, value chain optimization, market share, impact of domestic and localized market players, analyses opportunities in terms of emerging revenue pockets, changes in market regulations, strategic market growth analysis, market size, category market growths, application niches and dominance, product approvals, product launches, geographic expansions, technological innovations in the market. To gain more info on the quinolones market contact Data Bridge Market Research for an Analyst Brief, our team will help you take an informed market decision to achieve market growth
Global Quinolones Market Scope
The quinolones market is segmented on the basis of disease type, pathogen type, drugs, route of administration, end users and distribution channel. The growth amongst these segments will help you analyze meagre growth segments in the industries and provide the users with a valuable market overview and market insights to help them make strategic decisions for identifying core market applications.
Disease Type
- Urinary Tract Infection
- Intra-Abdominal Infections
- Blood Stream Infections
- Clostridium Difficile Infections
- Others
Pathogen Type
- Gram-Positive Pathogen
- Gram-Negative Pathogen
Drugs
- Lomefloxacin
- Gatifloxacin
- Norfloxacin
- Moxifloxacin
- Ciprofloxacin
- Others
Route of Administration
- Oral
- Injectable
- Others
End User
- Hospitals
- Homecare
- Specialty Clinics
- Others
Distribution Channel
- Hospital Pharmacy
- Online Pharmacy
- Retail Pharmacy
Quinolones Market Regional Analysis/Insights
The quinolones market is analyzed and market size insights and trends are provided by disease type, pathogen type, drugs, route of administration, end users and distribution channel as referenced above.
The major countries covered in the quinolones market report are the U.S., Canada and Mexico in North America, Germany, France, U.K., Netherlands, Switzerland, Belgium, Russia, Italy, Spain, Turkey, Rest of Europe in Europe, China, Japan, India, South Korea, Singapore, Malaysia, Australia, Thailand, Indonesia, Philippines, Rest of Asia-Pacific (APAC) in the Asia-Pacific (APAC), Saudi Arabia, U.A.E, South Africa, Egypt, Israel, Rest of Middle East and Africa (MEA) as a part of Middle East and Africa (MEA), Brazil, Argentina and Rest of South America as part of South America.
Asia-Pacific has been witnessing the highest growth for the quinolones market throughout the forecasted period because of the increasing level of disposable income.
North America dominates the market due to the growing number of R&D activities and increasing healthcare expenditure that will boost the market's growth rate in this region.
The country section of the report also provides individual market impacting factors and changes in regulation in the market domestically that impacts the current and future trends of the market. Also, the presence and availability of global brands and their challenges faced due to large or scarce competition from local and domestic brands, impact of domestic tariffs and trade routes are considered while providing forecast analysis of the country data.
Competitive Landscape and Global Quinolones Market Share Analysis
The quinolones market competitive landscape provides details by competitor. Details included are company overview, company financials, revenue generated, market potential, investment in research and development, new market initiatives, global presence, production sites and facilities, production capacities, company strengths and weaknesses, product launch, product width and breadth, application dominance. The above data points provided are only related to the companies' focus related to quinolones market.
Key players operating in the quinolones market include:
- GSK plc (U.K.)
- Novartis AG (Switzerland)
- Bayer AG (Germany)
- Abbvie, Inc (U.S.)
- Merck & Co., Inc. (U.S.)
- Pfizer Inc (U.S.)
- Viatris Inc. (U.S.)
- Lupin (India)
- Hikma Pharmaceuticals PLC (U.K.)
- Zydus Group (India)
- Bausch Health Companies Inc. (Canada)
- KYORIN Holdings, Inc (Japan)
- MerLion Pharmaceuticals GmbH (Germany)
- WOCKHARDT (India)
- Johnson & Johnson Private Limited (U.S.)
- Teva Pharmaceutical Industries Ltd.( Israel)
- Sanofi (France)
SKU-

- Interactive Data Analysis Dashboard
- Company Analysis Dashboard for high growth potential opportunities
- Research Analyst Access for customization & queries
- Competitor Analysis with Interactive dashboard
- Latest News, Updates & Trend analysis
- Harness the Power of Benchmark Analysis for Comprehensive Competitor Tracking
Table of Content
1 INTRODUCTION
1.1 OBJECTIVES OF THE STUDY
1.2 MARKET DEFINITION
1.3 OVERVIEW OF GLOBAL QUINOLONES MARKET
1.4 CURRENCY AND PRICING
1.5 LIMITATION
1.6 MARKETS COVERED
2 MARKET SEGMENTATION
2.1 KEY TAKEAWAYS
2.2 ARRIVING AT THE GLOBAL QUINOLONES MARKET SIZE
2.2.1 VENDOR POSITIONING GRID
2.2.2 TECHNOLOGY LIFE LINE CURVE
2.2.3 TRIPOD DATA VALIDATION MODEL
2.2.4 MARKET GUIDE
2.2.5 MULTIVARIATE MODELLING
2.2.6 TOP TO BOTTOM ANALYSIS
2.2.7 CHALLENGE MATRIX
2.2.8 APPLICATION COVERAGE GRID
2.2.9 STANDARDS OF MEASUREMENT
2.2.10 VENDOR SHARE ANALYSIS
2.2.11 EPIDEMIOLOGY
2.2.12 DATA POINTS FROM KEY PRIMARY INTERVIEWS
2.2.13 DATA POINTS FROM KEY SECONDARY DATABASES
2.3 GLOBAL QUINOLONES MARKET: RESEARCH SNAPSHOT
2.4 ASSUMPTIONS
3 MARKET OVERVIEW
3.1 DRIVERS
3.2 RESTRAINTS
3.3 OPPORTUNITIES
3.4 CHALLENGES
4 EXECUTIVE SUMMARY
5 PREMIUM INSIGHTS
5.1 PESTEL ANALYSIS
5.2 PORTER’S FIVE FORCES MODEL
6 INDUSTRY INSIGHTS
6.1 PATENT ANALYSIS
6.1.1 PATENT LANDSCAPE
6.1.2 USPTO NUMBER
6.1.3 PATENT EXPIRY
6.1.4 EPIO NUMBER
6.1.5 PATENT STRENGTH AND QUALITY
6.1.6 PATENT CLAIMS
6.1.7 PATENT CITATIONS
6.1.8 PATENT LITIGATION AND LICENSING
6.1.9 FILE OF PATENT
6.1.10 PATENT RECEIVED CONTRIES
6.1.11 TECHNOLOGY BACKGROUND
6.2 DRUG TREATMENT RATE BY MATURED MARKETS
6.3 DEMOGRAPHIC TRENDS: IMPACTS ON ALL INCIDENCE RATES
6.4 PATIENT FLOW DIAGRAM
6.5 KEY PRICING STRATEGIES
6.6 KEY PATIENT ENROLLMENT STRATEGIES
6.7 INTERVIEWS WITH SPECIALIST
6.8 OTHER KOL SNAPSHOTS
7 EPIDEMIOLOGY
7.1 INCIDENCE OF ALL BY GENDER
7.2 TREATMENT RATE
7.3 MORTALITY RATE
7.4 DRUG ADHERENCE AND THERAPY SWITCH MODEL
7.5 PATIENT TREATMENT SUCCESS RATES
8 MERGERS AND ACQUISITION
8.1 LICENSING
8.2 COMMERCIALIZATION AGREEMENTS
9 REGULATORY FRAMEWORK
9.1 REGULATORY APPROVAL PROCESS
9.2 GEOGRAPHIES’ EASE OF REGULATORY APPROVAL
9.3 REGULATORY APPROVAL PATHWAYS
9.4 LICENSING AND REGISTRATION
9.5 POST-MARKETING SURVEILLANCE
9.6 GOOD MANUFACTURING PRACTICES (GMPS) GUIDELINES
10 PIPELINE ANALYSIS
10.1 CLINICAL TRIALS AND PHASE ANALYSIS
10.2 DRUG THERAPY PIPELINE
10.3 PHASE III CANDIDATES
10.4 PHASE II CANDIDATES
10.5 PHASE I CANDIDATES
10.6 OTHERS (PRE-CLINICAL AND RESEARCH)
TABLE 1 GLOBAL CLINICAL TRIAL MARKET FOR XX
Company Name Therapeutic Area
XX XX
XX XX
XX XX
XX XX
XX XX
XX XX
Sources: Press Releases, Annual Reports, SEC Filings, Investor Presentations, Other Government Sources, Analysis Based on Inputs from Secondary, Expert Interviews
TABLE 2 DISTRIBUTION OF PRODUCTS AND PROJECTS BY PHASE
Phase Number of Projects
Preclinical/Research Projects XX
Clinical Development XX
Phase I XX
Phase II XX
Phase III XX
U.S. Filed/Approved but Not Yet Marketed XX
Total XX
Sources: Press Releases, Annual Reports, SEC Filings, Investor Presentations, Other Government Sources, Analysis Based on Inputs from Secondary, Expert Interviews
TABLE 3 DISTRIBUTION OF PROJECTS BY THERAPEUTIC AREA AND PHASE
Therapeutic Area Preclinical/ Research Project
XX XX
XX XX
XX XX
XX XX
XX XX
Total Projects XX
Sources: Press Releases, Annual Reports, SEC Filings, Investor Presentations, Other Government Sources, Analysis Based on Inputs from Secondary, Expert Interviews
TABLE 4 DISTRIBUTION OF PROJECTS BY SCIENTIFIC APPROACH AND PHASE
Technology Preclinical/ Research Project
XX XX
XX XX
XX XX
XX XX
XX XX
Total Projects XX
Sources: Press Releases, Annual Reports, SEC Filings, Investor Presentations, Other Government Sources, Analysis Based on Inputs from Secondary, Expert Interviews
FIGURE 1 TOP ENTITIES BASED ON R&D GLANCE FOR XX
Sources: Press Releases, Annual Reports, SEC Filings, Investor Presentations, Other Government Sources, Analysis Based on Inputs from Secondary, Expert Interviews
11 MARKETED DRUG ANALYSIS
11.1 DRUG
11.1.1 BRAND NAME
11.1.2 GENERICS NAME
11.2 THERAPEUTIC INDICTION
11.3 PHARMACOLOGICAL CLASS OF THE DRUG
11.4 DRUG PRIMARY INDICATION
11.5 MARKET STATUS
11.6 MEDICATION TYPE
11.7 DRUG DOSAGES FORM
11.8 DOSAGES AVAILABILITY
11.9 DRUG ROUTE OF ADMINISTRATION
11.1 DOSING FREQUENCY
11.11 DRUG INSIGHT
11.12 AN OVERVIEW OF THE DRUG DEVELOPMENT ACTIVITIES SUCH AS REGULATORY MILSTONE, SAFETY DATA AND EFFICACY DATA, MARKET EXCLUSIVITY DATA.
11.12.1 FORECAST MARKET OUTLOOK
11.12.2 CROSS COMPETITION
11.12.3 THERAPEUTIC PORTFOLIO
11.12.4 CURRENT DEVELOPMENT SCENARIO
12 MARKET ACCESS
12.1 10-YEAR MARKET FORECAST
12.2 CLINICAL TRIAL RECENT UPDATES
12.3 ANNUAL NEW FDA APPROVED DRUGS
12.4 DRUGS MANUFACTURER AND DEALS
12.5 MAJOR DRUG UPTAKE
12.6 CURRENT TREATMENT PRACTICES
12.7 IMPACT OF UPCOMING THERAPY
13 R & D ANALYSIS
13.1 COMPARATIVE ANALYSIS
13.2 DRUG DEVELOPMENTAL LANDSCAPE
13.3 IN-DEPTH INSIGHTS ON REGULATORY MILESTONES
13.4 THERAPEUTIC ASSESSMENT
13.5 ASSET-BASED COLLABORATIONS AND PARTNERSHIPS
14 MARKET OVERVIEW
14.1 DRIVERS
14.2 RESTRAINTS
14.3 OPPORTUNITIES
14.4 CHALLENGES
15 GLOBAL QUINOLONES MARKET, BY TYPE
15.1 OVERVIEW
15.2 FIRST-GENERATION QUINOLONES
15.2.1 NEGRAM
15.2.2 CINOBAC
15.2.3 NALIDIXIC ACID
15.2.4 CINOXACIN
15.2.5 FLUMEQUINE
15.2.6 OXOLINIC ACID
15.2.7 PIROMIDIC ACID
15.2.8 PIPEMIDIC ACID
15.2.9 ROSOXACIN
15.2.10 OTHERS
15.3 SECOND-GENERATION QUINOLONES
15.3.1 CIPROFLOXACIN
15.3.2 FLOXIN
15.3.3 MAXAQUIN
15.3.4 LOMEFLOXACIN
15.3.5 NORFLOXACIN
15.3.6 OFLOXACIN
15.3.7 FLEROXACIN
15.3.8 PEFLOXACIN
15.3.9 RUFLOXACIN
15.3.10 OTHERS
15.4 THIRD-GENERATION QUINOLONES
15.4.1 AVELOX
15.4.2 LEVAQUIN
15.4.3 TEQUIN
15.4.4 LEVOFLOXACIN
15.4.5 SPARFLOXACIN
15.4.6 TEMAFLOXACIN
15.4.7 GREPAFLOXACIN
15.4.8 BALOFLOXACIN
15.4.9 PAZUFLOXACIN
15.4.10 TOSUFLOXACIN
15.4.11 OTHERS
15.5 FOURTH-GENERATION QUINOLONES
15.5.1 MOXIFLOXACIN
15.5.2 GEMIFLOXACIN
15.5.3 TROVAFLOXACIN
15.5.4 GATIFLOXACIN
15.5.5 CLINAFLOXACIN
15.5.6 GARENOXACIN
15.5.7 SITAFLOXACIN
15.5.8 PRULIFLOXACIN
15.5.9 FINAFLOXACIN
15.5.10 OTHERS
16 GLOBAL QUINOLONES MARKET, BY DRUGS TYPE
16.1 OVERVIEW
16.2 BRANDED
16.2.1 BAXDELA
16.2.2 CIPRO
16.2.3 TROVAN
16.2.4 PENETREX
16.2.5 LEVAQUIN
16.2.6 AVELOX
16.2.7 NEGGRAM
16.2.8 FACTIVE
16.2.9 ZAGAM
16.2.10 NOROXIN
16.2.11 TEQUIN
16.2.12 NOROXIN
16.2.13 CINOBAC
16.2.14 VIGAMOX
16.2.15 MAXAQUIN
16.2.16 PROQUIN XR
16.2.17 MOXIFLOXACIN HCL
16.2.18 OTHERS
16.3 GENERICS
16.3.1 LEVOFLOXACIN
16.3.2 CIPROFLOXACIN
16.3.3 MOXIFLOXACIN
16.3.4 GEMIFLOXACIN
16.3.5 NALIDIXIC ACID
16.3.6 NORFLOXACIN
16.3.7 OFLOXACIN
16.3.8 DELAFLOXACIN
16.3.9 SPARFLOXACIN
16.3.10 TROVAFLOXACIN
16.3.11 GATIFLOXACIN
16.3.12 CINOXACIN
16.3.13 OTHERS
17 GLOBAL QUINOLONES MARKET, BY PATHOGEN TYPE
17.1 OVERVIEW
17.2 GRAM-POSITIVE PATHOGEN
17.3 GRAM-NEGATIVE PATHOGEN
18 GLOBAL QUINOLONES MARKET, BY ROUTE OF ADMINISTRATION
18.1 OVERVIEW
18.2 ORAL
18.2.1 TABLET
18.2.2 SOLUTION
18.2.3 OTHERS
18.3 PARENTERAL
18.3.1 INTRAVENOUS
18.3.2 SUBCUTANEOUS
18.3.3 OTHERS
18.4 OTHERS
19 GLOBAL QUINOLONES MARKET, BY POPULATION TYPE
19.1 OVERVIEW
19.2 PEDIATRIC
19.2.1 MALE
19.2.2 FEMALE
19.3 ADULTS
19.3.1 MALE
19.3.2 FEMALE
19.4 GERIATRIC
19.4.1 MALE
19.4.2 FEMALE
20 GLOBAL QUINOLONES MARKET, BY PRESCRIPTION TYPE
20.1 OVERVIEW
20.2 PRESCRIPTION DRUGS
20.2.1 NORFLOX
20.2.2 ZENFLOX
20.2.3 AZOFLOX
20.2.4 PERCIN
20.2.5 MOXINOW
20.2.6 CIPROFLOXACIN
20.2.7 LEVOFLOXACIN
20.2.8 OFLOXACIN
20.2.9 FLAVORIDE
20.2.10 ZANOCIN F
20.2.11 OTHERS
20.3 OVER THE COUNTER
20.3.1 NEOSPORIN
20.3.1.1. BACITRACIN
20.3.1.2. NEOMYCIN
20.3.1.3. POLYMYXIN B
20.3.2 POLYSPORIN
20.3.2.1. BACITRACIN
20.3.2.2. POLYMYXIN B
20.3.3 TETRACYCLINE
20.3.4 OXYTETRACYCLINE
20.3.5 OTHERS
21 GLOBAL QUINOLONES MARKET, BY APPLICATIONS
21.1 OVERVIEW
21.2 KIDNEY INFECTIONS
21.2.1 FIRST-GENERATION QUINOLONES
21.2.2 SECOND-GENERATION QUINOLONES
21.2.3 THIRD-GENERATION QUINOLONES
21.2.4 FOURTH-GENERATION QUINOLONES
21.3 URINARY TRACT INFECTION
21.3.1 FIRST-GENERATION QUINOLONES
21.3.2 SECOND-GENERATION QUINOLONES
21.3.3 THIRD-GENERATION QUINOLONES
21.3.4 FOURTH-GENERATION QUINOLONES
21.4 BLOOD STREAM INFECTIONS
21.4.1 FIRST-GENERATION QUINOLONES
21.4.2 SECOND-GENERATION QUINOLONES
21.4.3 THIRD-GENERATION QUINOLONES
21.4.4 FOURTH-GENERATION QUINOLONES
21.5 INTRA-ABDOMINAL INFECTIONS
21.5.1 FIRST-GENERATION QUINOLONES
21.5.2 SECOND-GENERATION QUINOLONES
21.5.3 THIRD-GENERATION QUINOLONES
21.5.4 FOURTH-GENERATION QUINOLONES
21.6 CLOSTRIDIUM DIFFICILE INFECTIONS
21.6.1 FIRST-GENERATION QUINOLONES
21.6.2 SECOND-GENERATION QUINOLONES
21.6.3 THIRD-GENERATION QUINOLONES
21.6.4 FOURTH-GENERATION QUINOLONES
21.7 METHICILLIN-RESISTANT STAPHYLOCOCCUS AUREUS (MRSA) INFECTION
21.7.1 FIRST-GENERATION QUINOLONES
21.7.2 SECOND-GENERATION QUINOLONES
21.7.3 THIRD-GENERATION QUINOLONES
21.7.4 FOURTH-GENERATION QUINOLONES
21.8 OTHERS
22 GLOBAL QUINOLONES MARKET, BY END USER
22.1 OVERVIEW
22.2 HOSPITAL
22.2.1 PRIVATE
22.2.2 PUBLIC
22.3 SPECIALTY CLINICS
22.4 HOME HEALTHCARE
22.5 AMBULATORY SURGICAL CENTERS
22.6 OTHERS
23 GLOBAL QUINOLONES MARKET, BY DISTRIBUTION CHANNEL
23.1 OVERVIEW
23.2 DIRECT TENDER
23.3 RETAIL SALES
23.3.1 HOSPITAL PHARMACY
23.3.2 ONLINE PHARMACY
23.3.3 MEDICINE STORES
23.4 OTHERS
24 GLOBAL QUINOLONES MARKET, COMPANY LANDSCAPE
24.1 COMPANY SHARE ANALYSIS: GLOBAL
24.2 COMPANY SHARE ANALYSIS: NORTH AMERICA
24.3 COMPANY SHARE ANALYSIS: EUROPE
24.4 COMPANY SHARE ANALYSIS: ASIA-PACIFIC
24.5 MERGERS & ACQUISITIONS
24.6 NEW PRODUCT DEVELOPMENT & APPROVALS
24.7 EXPANSIONS
24.8 REGULATORY CHANGES
24.9 PARTNERSHIP AND OTHER STRATEGIC DEVELOPMENTS
25 GLOBAL QUINOLONES MARKET, BY GEOGRAPHY
GLOBAL QUINOLONES MARKET, (ALL SEGMENTATION PROVIDED ABOVE IS REPRESENTED IN THIS CHAPTER BY COUNTRY)
25.1 NORTH AMERICA
25.1.1 U.S.
25.1.2 CANADA
25.1.3 MEXICO
25.2 EUROPE
25.2.1 GERMANY
25.2.2 U.K.
25.2.3 ITALY
25.2.4 FRANCE
25.2.5 SPAIN
25.2.6 RUSSIA
25.2.7 SWITZERLAND
25.2.8 TURKEY
25.2.9 BELGIUM
25.2.10 NETHERLANDS
25.2.11 DENMARK
25.2.12 SWEDEN
25.2.13 POLAND
25.2.14 NORWAY
25.2.15 FINLAND
25.2.16 REST OF EUROPE
25.3 ASIA-PACIFIC
25.3.1 JAPAN
25.3.2 CHINA
25.3.3 SOUTH KOREA
25.3.4 INDIA
25.3.5 SINGAPORE
25.3.6 THAILAND
25.3.7 INDONESIA
25.3.8 MALAYSIA
25.3.9 PHILIPPINES
25.3.10 AUSTRALIA
25.3.11 NEW ZEALAND
25.3.12 VIETNAM
25.3.13 TAIWAN
25.3.14 REST OF ASIA-PACIFIC
25.4 SOUTH AMERICA
25.4.1 BRAZIL
25.4.2 ARGENTINA
25.4.3 REST OF SOUTH AMERICA
25.5 MIDDLE EAST AND AFRICA
25.5.1 SOUTH AFRICA
25.5.2 EGYPT
25.5.3 BAHRAIN
25.5.4 UNITED ARAB EMIRATES
25.5.5 KUWAIT
25.5.6 OMAN
25.5.7 QATAR
25.5.8 SAUDI ARABIA
25.5.9 REST OF MIDDLE EAST AND AFRICA
25.6 KEY PRIMARY INSIGHTS: BY MAJOR COUNTRIES
26 GLOBAL QUINOLONES MARKET, SWOT AND DBMR ANALYSIS
27 GLOBAL QUINOLONES MARKET, COMPANY PROFILE
27.1 BAYER INC.
27.1.1 COMPANY OVERVIEW
27.1.2 REVENUE ANALYSIS
27.1.3 GEOGRAPHIC PRESENCE
27.1.4 PRODUCT PORTFOLIO
27.1.5 RECENT DEVELOPMENTS
27.2 SANDOZ GROUP AG
27.2.1 COMPANY OVERVIEW
27.2.2 REVENUE ANALYSIS
27.2.3 GEOGRAPHIC PRESENCE
27.2.4 PRODUCT PORTFOLIO
27.2.5 RECENT DEVELOPMENTS
27.3 PHARMASCIENCE INC.
27.3.1 COMPANY OVERVIEW
27.3.2 REVENUE ANALYSIS
27.3.3 GEOGRAPHIC PRESENCE
27.3.4 PRODUCT PORTFOLIO
27.3.5 RECENT DEVELOPMENTS
27.4 TEVA PHARMACEUTICALS USA, INC.
27.4.1 COMPANY OVERVIEW
27.4.2 REVENUE ANALYSIS
27.4.3 GEOGRAPHIC PRESENCE
27.4.4 PRODUCT PORTFOLIO
27.4.5 RECENT DEVELOPMENTS
27.5 APOTEX INC.
27.5.1 COMPANY OVERVIEW
27.5.2 REVENUE ANALYSIS
27.5.3 GEOGRAPHIC PRESENCE
27.5.4 PRODUCT PORTFOLIO
27.5.5 RECENT DEVELOPMENTS
27.6 GSK PLC.
27.6.1 COMPANY OVERVIEW
27.6.2 REVENUE ANALYSIS
27.6.3 GEOGRAPHIC PRESENCE
27.6.4 PRODUCT PORTFOLIO
27.6.5 RECENT DEVELOPMENTS
27.7 SANOFI
27.7.1 COMPANY OVERVIEW
27.7.2 REVENUE ANALYSIS
27.7.3 GEOGRAPHIC PRESENCE
27.7.4 PRODUCT PORTFOLIO
27.7.5 RECENT DEVELOPMENTS
27.8 FRESENIUS KABI
27.8.1 COMPANY OVERVIEW
27.8.2 REVENUE ANALYSIS
27.8.3 GEOGRAPHIC PRESENCE
27.8.4 PRODUCT PORTFOLIO
27.8.5 RECENT DEVELOPMENTS
27.9 NEURACLE LIFESCIENCES PRIVATE LIMITED
27.9.1 COMPANY OVERVIEW
27.9.2 REVENUE ANALYSIS
27.9.3 GEOGRAPHIC PRESENCE
27.9.4 PRODUCT PORTFOLIO
27.9.5 RECENT DEVELOPMENTS
27.1 ADEN HEALTHCARE
27.10.1 COMPANY OVERVIEW
27.10.2 REVENUE ANALYSIS
27.10.3 GEOGRAPHIC PRESENCE
27.10.4 PRODUCT PORTFOLIO
27.10.5 RECENT DEVELOPMENTS
27.11 ADVACARE PHARMA
27.11.1 COMPANY OVERVIEW
27.11.2 REVENUE ANALYSIS
27.11.3 GEOGRAPHIC PRESENCE
27.11.4 PRODUCT PORTFOLIO
27.11.5 RECENT DEVELOPMENTS
27.12 WELLONA PHARMA
27.12.1 COMPANY OVERVIEW
27.12.2 REVENUE ANALYSIS
27.12.3 GEOGRAPHIC PRESENCE
27.12.4 PRODUCT PORTFOLIO
27.12.5 RECENT DEVELOPMENTS
27.13 LEXICARE PHARMA PVT. LTD.
27.13.1 COMPANY OVERVIEW
27.13.2 REVENUE ANALYSIS
27.13.3 GEOGRAPHIC PRESENCE
27.13.4 PRODUCT PORTFOLIO
27.13.5 RECENT DEVELOPMENTS
27.14 MERCK & CO., INC.
27.14.1 COMPANY OVERVIEW
27.14.2 REVENUE ANALYSIS
27.14.3 GEOGRAPHIC PRESENCE
27.14.4 PRODUCT PORTFOLIO
27.14.5 RECENT DEVELOPMENTS
27.15 GREVIS PHARMACEUTICALS PVT LTD.
27.15.1 COMPANY OVERVIEW
27.15.2 REVENUE ANALYSIS
27.15.3 GEOGRAPHIC PRESENCE
27.15.4 PRODUCT PORTFOLIO
27.15.5 RECENT DEVELOPMENTS
27.16 NOVALAB HEALTHCARE
27.16.1 COMPANY OVERVIEW
27.16.2 REVENUE ANALYSIS
27.16.3 GEOGRAPHIC PRESENCE
27.16.4 PRODUCT PORTFOLIO
27.16.5 RECENT DEVELOPMENTS
27.17 CIPLA
27.17.1 COMPANY OVERVIEW
27.17.2 REVENUE ANALYSIS
27.17.3 GEOGRAPHIC PRESENCE
27.17.4 PRODUCT PORTFOLIO
27.17.5 RECENT DEVELOPMENTS
27.18 PATHEON ITALIA S.P.A.
27.18.1 COMPANY OVERVIEW
27.18.2 REVENUE ANALYSIS
27.18.3 GEOGRAPHIC PRESENCE
27.18.4 PRODUCT PORTFOLIO
27.18.5 RECENT DEVELOPMENTS
27.19 TAJ PHARMACEUTICALS LIMITED.
27.19.1 COMPANY OVERVIEW
27.19.2 REVENUE ANALYSIS
27.19.3 GEOGRAPHIC PRESENCE
27.19.4 PRODUCT PORTFOLIO
27.19.5 RECENT DEVELOPMENTS
27.2 ABBVIE
27.20.1 COMPANY OVERVIEW
27.20.2 REVENUE ANALYSIS
27.20.3 GEOGRAPHIC PRESENCE
27.20.4 PRODUCT PORTFOLIO
27.20.5 RECENT DEVELOPMENTS
27.21 LUPIN
27.21.1 COMPANY OVERVIEW
27.21.2 REVENUE ANALYSIS
27.21.3 GEOGRAPHIC PRESENCE
27.21.4 PRODUCT PORTFOLIO
27.21.5 RECENT DEVELOPMENTS
27.22 HIKMA PHARMACEUTICALS PLC
27.22.1 COMPANY OVERVIEW
27.22.2 REVENUE ANALYSIS
27.22.3 GEOGRAPHIC PRESENCE
27.22.4 PRODUCT PORTFOLIO
27.22.5 RECENT DEVELOPMENTS
27.23 VIATRIS INC.
27.23.1 COMPANY OVERVIEW
27.23.2 REVENUE ANALYSIS
27.23.3 GEOGRAPHIC PRESENCE
27.23.4 PRODUCT PORTFOLIO
27.23.5 RECENT DEVELOPMENTS
27.24 ZYDUS GROUP.
27.24.1 COMPANY OVERVIEW
27.24.2 REVENUE ANALYSIS
27.24.3 GEOGRAPHIC PRESENCE
27.24.4 PRODUCT PORTFOLIO
27.24.5 RECENT DEVELOPMENTS
27.25 KYORIN HOLDINGS, INC.
27.25.1 COMPANY OVERVIEW
27.25.2 REVENUE ANALYSIS
27.25.3 GEOGRAPHIC PRESENCE
27.25.4 PRODUCT PORTFOLIO
27.25.5 RECENT DEVELOPMENTS
27.26 MERLION PHARMACEUTICAL GMBH
27.26.1 COMPANY OVERVIEW
27.26.2 REVENUE ANALYSIS
27.26.3 GEOGRAPHIC PRESENCE
27.26.4 PRODUCT PORTFOLIO
27.26.5 RECENT DEVELOPMENTS
27.27 WOCKHARDT
27.27.1 COMPANY OVERVIEW
27.27.2 REVENUE ANALYSIS
27.27.3 GEOGRAPHIC PRESENCE
27.27.4 PRODUCT PORTFOLIO
27.27.5 RECENT DEVELOPMENTS
27.28 PFIZER INC.
27.28.1 COMPANY OVERVIEW
27.28.2 REVENUE ANALYSIS
27.28.3 GEOGRAPHIC PRESENCE
27.28.4 PRODUCT PORTFOLIO
27.28.5 RECENT DEVELOPMENTS
NOTE: THE COMPANIES PROFILED IS NOT EXHAUSTIVE LIST AND IS AS PER OUR PREVIOUS CLIENT REQUIREMENT. WE PROFILE MORE THAN 100 COMPANIES IN OUR STUDY AND HENCE THE LIST OF COMPANIES CAN BE MODIFIED OR REPLACED ON REQUEST
28 RELATED REPORTS
29 CONCLUSION
30 QUESTIONNAIRE
31 ABOUT DATA BRIDGE MARKET RESEARCH
Data collection and base year analysis are done using data collection modules with large sample sizes. The stage includes obtaining market information or related data through various sources and strategies. It includes examining and planning all the data acquired from the past in advance. It likewise envelops the examination of information inconsistencies seen across different information sources. The market data is analysed and estimated using market statistical and coherent models. Also, market share analysis and key trend analysis are the major success factors in the market report. To know more, please request an analyst call or drop down your inquiry.
The key research methodology used by DBMR research team is data triangulation which involves data mining, analysis of the impact of data variables on the market and primary (industry expert) validation. Data models include Vendor Positioning Grid, Market Time Line Analysis, Market Overview and Guide, Company Positioning Grid, Patent Analysis, Pricing Analysis, Company Market Share Analysis, Standards of Measurement, Global versus Regional and Vendor Share Analysis. To know more about the research methodology, drop in an inquiry to speak to our industry experts.
Data Bridge Market Research is a leader in advanced formative research. We take pride in servicing our existing and new customers with data and analysis that match and suits their goal. The report can be customized to include price trend analysis of target brands understanding the market for additional countries (ask for the list of countries), clinical trial results data, literature review, refurbished market and product base analysis. Market analysis of target competitors can be analyzed from technology-based analysis to market portfolio strategies. We can add as many competitors that you require data about in the format and data style you are looking for. Our team of analysts can also provide you data in crude raw excel files pivot tables (Fact book) or can assist you in creating presentations from the data sets available in the report.


