
Global Refractories Market
Market Size in USD Billion
 USD
39.51 Billion
USD
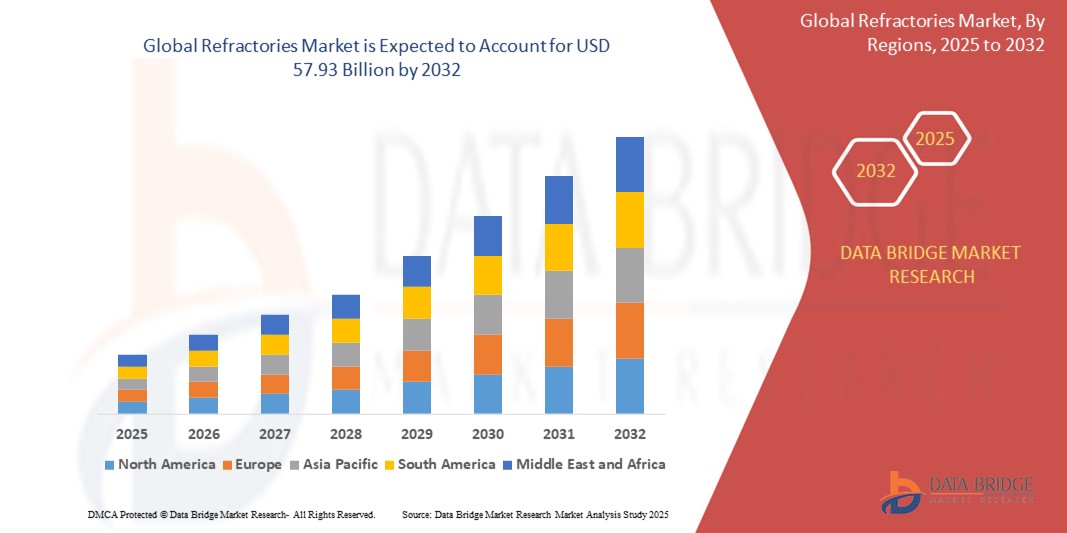
57.93 Billion
2024
2032
USD
39.51 Billion
USD
57.93 Billion
2024
2032
| 2025 - 2032 | |
| USD 39.51 Billion | |
| USD 57.93 Billion | |
| % | |
|
Refractories Market Size
- The global refractories market size was valued at USD 39.51 billion in 2024 and is expected to reach USD 57.93 billion by 2032, at a CAGR of 4.90% during the forecast period
- This growth is driven by factors such as the increasing demand from the iron and steel industry, technological advancements in refractory materials, rising investments in infrastructure development, and a growing emphasis on energy efficiency and sustainability
Refractories Market Analysis
- Refractories are made of ceramic, alumina, silica, magnesia, and other materials designed to resist the very high temperatures faced in modern manufacturing. More heat-resistant than metals, they are used to line the hot surfaces inside many industrial processes
- The refractory products generally fall under preformed shapes or unformed compositions. refractories are used to contain heat and protect processing equipment from intense temperatures
- The variety of materials such as silica, alumina, and clay among others are utilized for the manufacturing of refractories and these refractories found extensive applications in several industries such as foundries, iron, and steel, glass, among others where they are exposed to extreme chemical and temperature conditions
- Asia-Pacific is expected to dominate the refractories market with 73.5% due to advanced and robust industrial base and extensive manufacturing capabilities
- North America is expected to be the fastest growing region in the refractories market during the forecast period due to manufacturing technologies and a focus on sustainable practices are driving the growth of the refractories market
- Iron and steel segment is expected to dominate the market with a market share of due to its high-quality refractories in the steel manufacturing process, including blast furnaces, converters, and electric arc furnaces, makes this the dominant application segment
Report Scope and Refractories Market Segmentation
|
Attributes |
Refractories Key Market Insights |
|
Segments Covered |
|
|
Countries Covered |
North America
Europe
Asia-Pacific
Middle East and Africa
South America
|
|
Key Market Players |
|
|
Market Opportunities |
|
|
Value Added Data Infosets |
In addition to the insights on market scenarios such as market value, growth rate, segmentation, geographical coverage, and major players, the market reports curated by the Data Bridge Market Research also include import export analysis, production capacity overview, production consumption analysis, price trend analysis, climate change scenario, supply chain analysis, value chain analysis, raw material/consumables overview, vendor selection criteria, PESTLE Analysis, Porter Analysis, and regulatory framework. |
Refractories Market Trends
“Shift Toward Energy-Efficient and Sustainable Refractories”
- Industries such as steel and cement manufacturing are adopting advanced refractories that enhance energy efficiency. These materials help reduce heat dissipation, leading to lower energy consumption in high-temperature processes
- There's a growing emphasis on sustainability, prompting the development of eco-friendly refractories. These materials aim to minimize environmental impact while maintaining performance standards
- The industry is increasingly focusing on recycling spent refractories. This not only reduces waste but also conserves raw materials, aligning with global sustainability goals
- Innovations in refractory materials are enhancing their performance and durability. This includes the development of lightweight refractories and those with improved thermal stability
- Stricter environmental regulations are driving the adoption of sustainable refractories. Manufacturers are investing in technologies to meet these standards while ensuring product efficacy
Refractories Market Dynamics
Driver
“Industrial Expansion and Modernization”
- Rapid expansion of steel production, particularly in emerging markets such as China and India, has increased the demand for refractories. Government-led infrastructure projects and urbanization efforts continue to boost steel consumption
- Global investments in infrastructure are significant growth drivers. As countries modernize their industrial bases and expand infrastructure projects, the demand for cement, glass, and other construction materials rises, subsequently increasing the need for refractories
- The continuous expansion and modernization of various industries are significant drivers for the global refractories market demand. Industries such as steel, cement, glass, petrochemicals, and non-ferrous metals rely heavily on refractory materials
- Rapid industrialization in emerging economies is leading to increased demand for refractories to support new and upgraded facilities
- Advancements in manufacturing methods are enhancing product quality, driving wider adoption of refractories across various industries
Opportunity
“Recycling of Refractories”
- Recycling refractories offers a sustainable solution by repurposing spent materials, curbing waste, and conserving raw materials. This aligns with global sustainability goals and promotes a circular economy model
- Recycling initiatives can yield valuable secondary resources, promoting cost savings for manufacturers and reducing dependence on primary raw materials
- Governments across the world are offering tax benefits to promote the recycling of waste, further encouraging the adoption of recycled refractory materials
- Leading companies such as RHI Magnesita are investing heavily in recycling initiatives to enhance the availability of secondary raw materials for the industry
- The increasing focus on recycling and waste reduction encourages the use of recycled refractories in manufacturing processes, contributing to the overall growth of the refractories market
Restraint/Challenge
“Fluctuations in Raw Material Prices”
- The refractories industry is highly dependent on raw materials such as bauxite, magnesite, alumina, and silicon carbide.
- Fluctuations in the prices of these raw materials, driven by factors such as supply disruptions, geopolitical tensions, and changes in trade policies, pose a significant challenge for refractory manufacturers
- Dependence on limited sources for critical raw materials increases the risk of supply disruptions, particularly during geopolitical tensions or trade disputes
- Fluctuating raw material prices can impact production costs and profitability, making it difficult for manufacturers to maintain stable pricing for their customers
- Companies are implementing strategies such as strategic sourcing and price hedging to mitigate the impact of raw material price fluctuations
- Raw material price volatility can lead to market instability, affecting the overall growth and development of the refractories industry
Refractories Market Scope
The market is segmented on the basis on product type, alkalinity, form type, fusion temperature, technology, and application.
|
Segmentation |
Sub-Segmentation |
|
By Product Type |
|
|
By Alkalinity |
|
|
By Form Type |
|
|
By Fusion Temperature |
|
|
By Technology |
|
|
By Application |
|
In 2025, the iron and steel is projected to dominate the market with a largest share in application segment
The iron and steel segment is expected to dominate the refractories market with the largest share in 2025 due to its high-quality refractories in the steel manufacturing process, including blast furnaces, converters, and electric arc furnaces, makes this the dominant application segment.
The clay is expected to account for the largest share during the forecast period in product type market
In 2025, the clay segment is expected to dominate the market with the largest market share due to their versatile use, particularly in high-temperature applications in industries such as steel, cement, and glass. Their relatively low cost and good performance in the required temperature ranges make them a preferred choice.
Refractories Market Regional Analysis
“Asia-Pacific Holds the Largest Share in the Refractories Market”
- Asia Pacific holds a commanding share of over 70% in the global refractories market, driven by its robust industrial base and extensive manufacturing capabilities
- The region's dominance is fueled by the steel, cement, and glass industries, which are among the primary consumers of refractory products
- China, India, and Japan are at the forefront, with China being the largest producer of steel globally, significantly contributing to refractory demand
- Rapid urbanization and industrialization in countries such as India and China have driven substantial demand for steel and cement, boosting the need for refractories in their production processes
- Asia Pacific benefits from cost-effective production, a skilled labor force, and abundant raw materials, enhancing its attractiveness as a hub for refractory manufacturing
“North America is Projected to Register the Highest CAGR in the Refractories Market”
- North America is experiencing significant growth in the refractories market, with the U.S. holding the largest market share and Canada being the fastest-growing market in the region
- The automotive industry in North America is expanding, contributing to the increased demand for refractories
- Advancements in manufacturing technologies and a focus on sustainable practices are driving the growth of the refractories market in North America.
- Increased investments in infrastructure projects are boosting the demand for refractories in construction and heavy machinery sectors
- Companies in North America are adopting strategies such as mergers and acquisitions, facility expansion, and product innovations to strengthen their position in the refractories market
Refractories Market Share
The market competitive landscape provides details by competitor. Details included are company overview, company financials, revenue generated, market potential, investment in research and development, new market initiatives, global presence, production sites and facilities, production capacities, company strengths and weaknesses, product launch, product width and breadth, application dominance. The above data points provided are only related to the companies' focus related to market.
The Major Market Leaders Operating in the Market Are:
- Saint-Gobain Performance Ceramics & Refractories (PCR) (France)
- TYK CORPORATION (Japan)
- Coorstek (U.S.)
- Refratechnic (Germany)
- HWI (U.S.)
- AluChem (U.S.)
- ALTEO (France)
- CerCo Corporation (U.S.)
- Almatis GmbH (Germany)
- Allied Mineral Products, Inc. (U.S.)
- Magnezit Group (Russia)
- Minerals Technologies Inc. (U.S.)
- Puyang Refractories Group Co., Ltd. (China)
- Morgan Advanced Materials (U.K.)
- IFGL Refractories Ltd. (India)
- Krosaki Harima Corporation (Japan)
- SHINAGAWA REFRACTORIES CO., LTD. (Japan)
- RHI Magnesita GmbH (Austria)
- Lhoist (Belgium)
- Vesuvius (U.K.)
- Imerys (France)
Latest Developments in Global Refractories Market
- In June 2023, INTOCAST AG announced its decision to acquire EXUS Refractories S.p.A, an Italy-based company. This acquisition will help the company strengthen its portfolio of refractory products.
- In April 2023, RHI Magnesita announced its plans to acquire the U.S., India, and Europe operations of Seven Refractories, a specialist supplier of non-basic monolithic refractory with a recorded revenue of USD 110 million and PBT of USD 12 million in 2022. The company has a vast portfolio of various end-use applications across the global market. This acquisition will bring innovative product categories and technological advancements to deliver a major change in consumer offerings.
- In February 2023, Vesuvius Group announced its plans to invest USD 61 million to expand its refractory manufacturing bases across India within three to five years. These investments will bring a 35% increase in the company’s monthly production capacity with the expansion of its plant at the Taratala unit in Kolkata.
- In October 2022, Imerys announced that it would be expanding its production volume, R&D, and sustainability efforts in its manufacturing plant at Visakhapatnam, Andhra Pradesh, India. The company planned to expand its manufacturing capacity from 30,000 to 50,000 tons by 2030. It also continued to invest an additional USD 1.4 million in streamlining its operations to produce the Secar 71. This investment aimed to increase the production of calcium aluminate binder due to the increased demand for this material from the Indian refractory and construction sites.
- In September 2021, Plibrico Company, LLC announced its decision to complete the acquisition of Redline Industries, Inc., a leader in manufacturing innovative products to safeguard furnaces in high-temperature processing and promote higher energy efficiency. This acquisition was expected to support the customers with trusted refractory solutions and allowed Plibrico to expand its product portfolio in the competitive market.
SKU-

- Interactive Data Analysis Dashboard
- Company Analysis Dashboard for high growth potential opportunities
- Research Analyst Access for customization & queries
- Competitor Analysis with Interactive dashboard
- Latest News, Updates & Trend analysis
- Harness the Power of Benchmark Analysis for Comprehensive Competitor Tracking
Global Refractories Market, Supply Chain Analysis and Ecosystem Framework
To support market growth and help clients navigate the impact of geopolitical shifts, DBMR has integrated in-depth supply chain analysis into its Global Refractories Market research reports. This addition empowers clients to respond effectively to global changes affecting their industries. The supply chain analysis section includes detailed insights such as Global Refractories Market consumption and production by country, price trend analysis, the impact of tariffs and geopolitical developments, and import and export trends by country and HSN code. It also highlights major suppliers with data on production capacity and company profiles, as well as key importers and exporters. In addition to research, DBMR offers specialized supply chain consulting services backed by over a decade of experience, providing solutions like supplier discovery, supplier risk assessment, price trend analysis, impact evaluation of inflation and trade route changes, and comprehensive market trend analysis.
Data collection and base year analysis are done using data collection modules with large sample sizes. The stage includes obtaining market information or related data through various sources and strategies. It includes examining and planning all the data acquired from the past in advance. It likewise envelops the examination of information inconsistencies seen across different information sources. The market data is analysed and estimated using market statistical and coherent models. Also, market share analysis and key trend analysis are the major success factors in the market report. To know more, please request an analyst call or drop down your inquiry.
The key research methodology used by DBMR research team is data triangulation which involves data mining, analysis of the impact of data variables on the market and primary (industry expert) validation. Data models include Vendor Positioning Grid, Market Time Line Analysis, Market Overview and Guide, Company Positioning Grid, Patent Analysis, Pricing Analysis, Company Market Share Analysis, Standards of Measurement, Global versus Regional and Vendor Share Analysis. To know more about the research methodology, drop in an inquiry to speak to our industry experts.
Data Bridge Market Research is a leader in advanced formative research. We take pride in servicing our existing and new customers with data and analysis that match and suits their goal. The report can be customized to include price trend analysis of target brands understanding the market for additional countries (ask for the list of countries), clinical trial results data, literature review, refurbished market and product base analysis. Market analysis of target competitors can be analyzed from technology-based analysis to market portfolio strategies. We can add as many competitors that you require data about in the format and data style you are looking for. Our team of analysts can also provide you data in crude raw excel files pivot tables (Fact book) or can assist you in creating presentations from the data sets available in the report.


