
Global Renewable Energy Connector Market
Market Size in USD Billion
 USD
5.80 Billion
USD
13.45 Billion
2025
2033
USD
5.80 Billion
USD
13.45 Billion
2025
2033
| 2026 - 2033 | |
| USD 5.80 Billion | |
| USD 13.45 Billion | |
| % | |
|
What is the Renewable Energy Connector Market Size and Growth Rate?
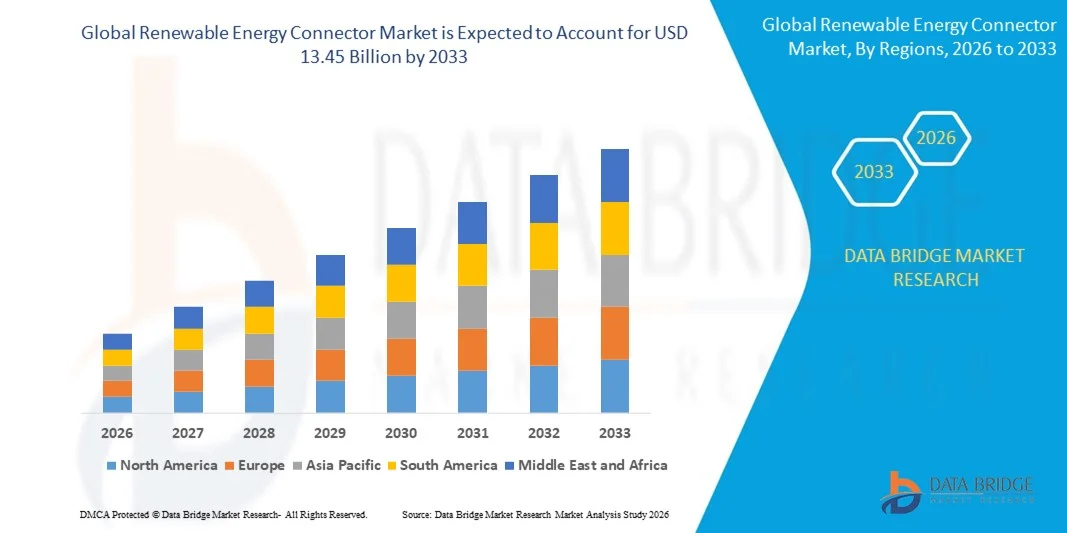
- As per Data Bridge Market Research Analysis the global Renewable Energy Connector Market size was valued at USD 5.80 billion in 2025 and is projected to reach USD 13.45 billion by 2033, growing at a CAGR of 11.09% during the forecast period.
- The market growth is primarily driven by the increasing integration of renewable energy sources, such as solar and wind, into power grids, alongside advancements in energy storage and transmission technologies, promoting efficiency and reliability in energy distribution.
- Additionally, rising government initiatives and policies supporting clean energy adoption, coupled with growing demand for sustainable and eco-friendly power solutions across industrial, commercial, and residential sectors, are fueling the widespread deployment of renewable energy connectors, thereby propelling the market’s expansion.
Market Size & Forecast
- Global Market Value (2025): USD 5.80 billion in 2025
- Expected Market Value (2033): USD 13.45 billion by 2033
- Forecast CAGR (2026–2033): 11.09%
Global Renewable Energy Connector Market Analysis
- Renewable energy connectors, enabling efficient and secure transmission of electricity from renewable sources such as solar, wind, and hydro, are increasingly critical components of modern energy infrastructure due to their ability to enhance grid stability, improve energy efficiency, and support large-scale renewable integration.
- The growing demand for renewable energy connectors is primarily driven by the global transition toward clean energy, increasing adoption of distributed energy resources, and government initiatives promoting decarbonization and sustainable energy solutions.
- Asia-Pacific dominated the Global Renewable Energy Connector Market with the largest revenue share of 35.1% in 2025, driven by early adoption of renewable energy technologies, strong investments in smart grids, and the presence of leading industry players, with the U.S. witnessing substantial growth in connector installations for solar farms, wind projects, and energy storage systems.
- North America is expected to be the fastest-growing region in the Global Renewable Energy Connector Market during the forecast period due to rapid industrialization, increasing energy demand, and growing investments in renewable energy infrastructure, particularly in countries like China and India.
- The Photovoltaic Solar segment dominated the market with the largest revenue share of 45.6% in 2025, driven by the rapid adoption of solar PV systems in residential, commercial, and utility-scale projects worldwide.
Report Scope and Global Renewable Energy Connector Market Segmentation
|
Attributes |
Renewable Energy Connector Key Market Insights |
|
Segments Covered |
|
|
Countries Covered |
North America
Europe
Asia-Pacific
Middle East and Africa
South America
|
|
Key Market Players |
|
|
Market Opportunities |
|
|
Value Added Data Infosets |
In addition to the insights on market scenarios such as market value, growth rate, segmentation, geographical coverage, and major players, the market reports curated by the Data Bridge Market Research also include in-depth expert analysis, geographically represented company-wise production and capacity, network layouts of distributors and partners, detailed and updated price trend analysis and deficit analysis of supply chain and demand. |
What is the Key Trend in the Renewable Energy Connector Market?
Enhanced Efficiency Through Smart and AI-Enabled Energy Management
- A significant and accelerating trend in the global Renewable Energy Connector Market is the growing integration of artificial intelligence (AI) and smart energy management systems. This convergence of technologies is significantly enhancing operational efficiency, predictive maintenance, and real-time monitoring of renewable energy assets.
- For instance, AI-enabled connectors can optimize power flow between solar panels, wind turbines, and energy storage systems, ensuring minimal energy loss and improved grid stability. Similarly, smart connectors with predictive algorithms can adjust energy transmission based on consumption patterns and weather forecasts, enhancing overall system performance.
- AI integration in renewable energy connectors enables features such as predictive fault detection, automated load balancing, and intelligent alerts for potential system irregularities. For example, some advanced systems can identify unusual energy fluctuations and send real-time notifications, preventing downtime and maximizing energy output.
- The seamless integration of renewable energy connectors with smart grids and centralized energy management platforms allows operators to monitor and control multiple renewable energy sources from a single interface. This facilitates optimized energy distribution, coordinated storage utilization, and improved reliability across residential, commercial, and industrial energy networks.
- This trend toward more intelligent, connected, and adaptive energy infrastructure is fundamentally reshaping expectations for renewable energy deployment. Consequently, companies such as TE Connectivity and Amphenol are developing AI-enabled connectors with predictive maintenance capabilities, automated load management, and integration with smart grid platforms for enhanced energy efficiency.
- The demand for renewable energy connectors that offer seamless AI and smart energy management integration is growing rapidly across both developed and emerging markets, as utilities and consumers increasingly prioritize efficiency, sustainability, and grid reliability.
Global Renewable Energy Connector Market Dynamics
Driver
Growing Need Due to Renewable Energy Adoption and Grid Modernization
- The increasing global emphasis on clean energy adoption, coupled with the accelerating modernization of electrical grids, is a significant driver for the heightened demand for renewable energy connectors.
- For instance, in 2025, Siemens Energy announced the deployment of advanced connector systems for large-scale solar and wind farms to enhance integration with smart grids and energy storage solutions. Such initiatives by key companies are expected to drive growth in the renewable energy connector market during the forecast period.
- As utilities, businesses, and residential consumers increasingly adopt renewable energy systems, connectors play a crucial role in ensuring reliable energy transmission, seamless integration of distributed energy resources, and efficient interconnection between generation, storage, and consumption points.
- Furthermore, the growing deployment of smart grids, microgrids, and hybrid energy systems is making renewable energy connectors an essential component of modern energy infrastructure, supporting interoperability between diverse energy sources and intelligent energy management platforms.
- The need for standardized, durable, and easy-to-install connectors for solar panels, wind turbines, and battery storage systems, alongside the drive for energy efficiency and sustainability, are key factors propelling adoption across residential, commercial, and industrial sectors.
Restraint/Challenge
Concerns Regarding Compatibility, Reliability, and Initial Investment
- Challenges surrounding connector reliability, compatibility across different renewable energy systems, and long-term durability pose significant hurdles to broader market penetration. As renewable energy connectors are critical for grid stability and continuous power flow, any failure or incompatibility can lead to operational disruptions.
- For instance, reports of connector degradation in extreme weather conditions have highlighted the need for more robust and standardized solutions, making some utilities cautious in adoption.
- Addressing these concerns through rigorous testing, adherence to international standards, and the development of more resilient and universally compatible connector solutions is crucial for building confidence among end-users. Companies such as TE Connectivity and Amphenol emphasize their high-quality, weather-resistant, and standardized connectors to assure clients of performance reliability.
- Additionally, the relatively high initial cost of advanced renewable energy connectors compared to conventional electrical components can be a barrier to adoption, particularly for small-scale solar or wind projects in developing regions. While basic connector solutions are becoming more affordable, premium connectors with features such as AI-enabled monitoring, smart grid integration, or high-current capacity often come at a higher price.
- Overcoming these challenges through enhanced durability, standardization, cost-effective production, and awareness of long-term operational benefits will be vital for sustained market growth.
Global Renewable Energy Connector Market Scope
Renewable energy connector market is segmented on the basis of types, source of energy, application and end user.
- By Type
On the basis of type, the Global Renewable Energy Connector Market is segmented into Photovoltaic Solar, Concentrated Solar Power, Wind Turbine, and Others. The Photovoltaic Solar segment dominated the market with the largest revenue share of 45.6% in 2025, driven by the rapid adoption of solar PV systems in residential, commercial, and utility-scale projects worldwide. The segment benefits from declining solar panel costs, government incentives, and increasing consumer awareness of renewable energy solutions. Photovoltaic solar connectors ensure efficient power transmission and system reliability, making them a preferred choice for new installations.
The Wind Turbine segment is expected to witness the fastest CAGR of 19.8% from 2026 to 2033, fueled by large-scale wind farm projects, technological improvements in turbine efficiency, and rising investments in offshore and onshore wind power. Increasing global emphasis on diversifying renewable energy sources is driving adoption in both developed and emerging economies.
- By Application
On the basis of application, the Global Renewable Energy Connector Market is segmented into Automotive, Construction, Transportation, and Others. The Construction segment accounted for the largest market revenue share of 42.3% in 2025, driven by the increasing integration of renewable energy systems in residential and commercial buildings, such as rooftop solar panels, energy-efficient lighting, and microgrid solutions. Demand is also supported by government mandates for green building certifications and sustainability initiatives in infrastructure projects.
The Automotive segment is expected to witness the fastest CAGR of 20.5% from 2026 to 2033, owing to the rapid adoption of electric vehicles (EVs) and charging infrastructure, which require specialized connectors for efficient energy transfer. Rising EV sales, technological advancements in battery systems, and supportive policies are encouraging the deployment of renewable energy connectors in the automotive sector, especially in regions with high EV penetration.
- By Source of Energy
On the basis of source of energy, the Global Renewable Energy Connector Market is segmented into Wind, Solar, Geothermal, Biomass, Hydropower, and Others. The Solar segment dominated the market with the largest revenue share of 46.7% in 2025, supported by widespread adoption of photovoltaic systems and declining installation costs. Solar connectors are essential for efficient energy transmission and grid integration, making them a critical component of residential, commercial, and utility-scale solar projects.
The Wind segment is projected to witness the fastest CAGR of 19.3% from 2026 to 2033, driven by significant investments in onshore and offshore wind farms and improvements in turbine capacity. Increasing government support for low-carbon energy, technological advancements in energy storage, and the growing need for diversified renewable energy portfolios are fueling demand for connectors across both wind and solar sectors.
- By End User
On the basis of end user, the Global Renewable Energy Connector Market is segmented into Residential, Commercial, and Industrial. The Commercial segment dominated the market with the largest revenue share of 44.5% in 2025, supported by large-scale adoption of renewable energy systems in office buildings, hotels, manufacturing facilities, and retail spaces. Businesses benefit from energy cost savings, sustainability mandates, and corporate social responsibility initiatives, which encourage renewable energy integration.
The Industrial segment is expected to witness the fastest CAGR of 21.0% from 2026 to 2033, driven by increased energy demand in heavy manufacturing, logistics, and process industries. Industrial applications require high-capacity, durable connectors for large-scale solar, wind, and hybrid energy installations. Rising awareness of energy efficiency, sustainability, and government incentives for industrial decarbonization are further accelerating connector adoption in this sector.
Which Region Holds the Largest Share of the Renewable Energy Connector Market?
- Asia-Pacific dominated the Global Renewable Energy Connector Market with the largest revenue share of 35.1% in 2025, driven by strong investments in renewable energy infrastructure, early adoption of smart grid technologies, and government incentives promoting clean energy deployment.
- Utilities, businesses, and residential consumers in the region increasingly prioritize efficient and reliable energy transmission, grid modernization, and integration of renewable sources, fueling demand for advanced connectors that ensure system stability and interoperability.
- This widespread adoption is further supported by high infrastructure investment, technological innovation, and a regulatory environment encouraging decarbonization and sustainable energy solutions. North America’s well-established solar, wind, and energy storage markets make it a leading hub for renewable energy connector deployment across residential, commercial, and industrial applications.
U.S. Renewable Energy Connector Market Insight
The U.S. renewable energy connector market captured the largest revenue share of 38% in North America in 2025, driven by rapid deployment of solar, wind, and energy storage projects. Utilities, commercial enterprises, and residential users are increasingly adopting advanced connectors to ensure reliable energy transmission and efficient integration of renewable sources into smart grids. Federal and state-level incentives promoting clean energy, along with the growing trend of electrification and grid modernization, are further propelling market growth. Additionally, technological advancements in connectors, including high-capacity, weather-resistant, and IoT-compatible solutions, are supporting the expansion of renewable energy infrastructure across the country.
Europe Renewable Energy Connector Market Insight
The Europe renewable energy connector market is projected to expand at a substantial CAGR throughout the forecast period, primarily driven by stringent regulations on carbon emissions, renewable energy mandates, and the push for sustainable infrastructure. Countries across Western and Northern Europe are actively integrating solar, wind, and hybrid energy systems into residential, commercial, and industrial projects. The region’s focus on smart grids and energy efficiency, along with increasing investments in renewable energy projects, is fueling demand for durable, standardized, and high-performance connectors.
U.K. Renewable Energy Connector Market Insight
The U.K. renewable energy connector market is anticipated to grow at a noteworthy CAGR during the forecast period, driven by the country’s transition to low-carbon energy sources and increasing adoption of distributed energy systems. Rising investments in offshore wind farms, solar PV installations, and energy storage projects are boosting demand for reliable connectors. Government initiatives promoting smart grid development and electrification of residential and commercial sectors are also accelerating adoption, making advanced renewable energy connectors an essential component of modern energy infrastructure.
Germany Renewable Energy Connector Market Insight
The Germany renewable energy connector market is expected to expand at a considerable CAGR during the forecast period, supported by the nation’s strong emphasis on energy transition (Energiewende) and renewable energy integration. Germany’s well-developed infrastructure, technological innovation, and focus on sustainability are driving the adoption of high-quality connectors in residential, commercial, and industrial applications. Connectors that support efficient energy transmission, smart grid compatibility, and renewable energy storage systems are particularly in demand, aligning with local consumer and regulatory expectations.
Asia-Pacific Renewable Energy Connector Market Insight
The Asia-Pacific renewable energy connector market is poised to grow at the fastest CAGR of 22% from 2026 to 2033, fueled by rapid urbanization, industrial expansion, and increasing renewable energy capacity in countries such as China, Japan, India, and South Korea. Government policies promoting green energy, combined with large-scale solar and wind projects, are driving connector adoption. The region is also becoming a key manufacturing hub for renewable energy components, improving affordability and accessibility, and supporting the adoption of advanced connectors in residential, commercial, and industrial applications.
Japan Renewable Energy Connector Market Insight
The Japan renewable energy connector market is gaining momentum due to the country’s focus on smart grid development, renewable energy integration, and disaster-resilient infrastructure. Rising adoption of solar PV systems, energy storage solutions, and distributed energy resources in residential and commercial sectors is increasing demand for reliable, high-performance connectors. Technological innovations in connector design and the integration of IoT-enabled energy management systems are further supporting market growth in Japan.
China Renewable Energy Connector Market Insight
The China renewable energy connector market accounted for the largest market revenue share in Asia-Pacific in 2025, attributed to the country’s rapid expansion of solar, wind, and energy storage projects. Government initiatives promoting renewable energy, the development of smart cities, and the availability of cost-effective connector solutions are key factors driving adoption. Domestic manufacturers are increasingly supplying standardized, high-quality connectors, facilitating widespread deployment across residential, commercial, and industrial projects, and solidifying China’s position as a major hub for renewable energy infrastructure.
Which are the Top Companies in Renewable Energy Connector Market?
The Renewable Energy Connector industry is primarily led by well-established companies, including:
- ABB Ltd. (Switzerland)
- Siemens Energy (Germany)
- Schneider Electric (France)
- Eaton Corporation (U.S.)
- Mersen (France)
- Tekmar Energy (U.S.)
- WEG S.A. (Brazil)
- Hubbell Incorporated (U.S.)
- Rittal GmbH & Co. KG (Germany)
- TE Connectivity (Switzerland)
- Harxon Corporation (China)
- Lapp Group (Germany)
- Amphenol Corporation (U.S.)
- Molex (U.S.)
- Harting Technology Group (Germany)
- Powerwell Solutions (U.S.)
- Hitachi Energy (Switzerland)
- Yazaki Corporation (Japan)
- Chint Group (China)
- Fuhrländer AG (Germany)
What are the Recent Developments in Global Renewable Energy Connector Market?
- In April 2024, ABB Ltd., a global leader in power and automation technologies, launched a strategic initiative in South Africa to enhance the reliability and efficiency of renewable energy infrastructure through its advanced connector solutions. This initiative highlights ABB’s commitment to providing robust, high-performance energy connectors tailored to local grid requirements, reinforcing its position in the rapidly growing global Renewable Energy Connector Market.
- In March 2024, Siemens Energy, a leading provider of energy solutions, introduced its next-generation high-capacity renewable energy connector for large-scale solar and wind projects in North America. Engineered for enhanced durability and seamless integration with smart grid systems, this innovation underscores Siemens Energy’s dedication to supporting reliable and efficient renewable energy transmission across diverse applications.
- In March 2024, Schneider Electric successfully deployed a smart connector system as part of the Bengaluru Green Energy Project, aimed at improving energy efficiency and grid stability in urban renewable installations. The project leverages cutting-edge connector technology to ensure resilient and optimized energy flow, emphasizing Schneider Electric’s role in advancing sustainable and intelligent energy solutions.
- In February 2024, Eaton Corporation, a global provider of power management solutions, announced a strategic partnership with the Asia Renewable Energy Association to establish a standardized renewable energy connector framework. This collaboration is designed to improve interoperability and streamline deployment across solar, wind, and hybrid projects, reinforcing Eaton’s commitment to innovation and operational efficiency in the renewable energy sector.
- In January 2024, Mersen, a leading provider of electrical protection and connection solutions, unveiled its next-generation high-voltage renewable energy connectors at the European Renewable Energy Conference 2024. The advanced connectors enable reliable integration of solar and wind energy into smart grids, highlighting Mersen’s focus on enhancing energy reliability, safety, and operational control for modern renewable energy systems.
SKU-

- Interactive Data Analysis Dashboard
- Company Analysis Dashboard for high growth potential opportunities
- Research Analyst Access for customization & queries
- Competitor Analysis with Interactive dashboard
- Latest News, Updates & Trend analysis
- Harness the Power of Benchmark Analysis for Comprehensive Competitor Tracking
Global Renewable Energy Connector Market, Supply Chain Analysis and Ecosystem Framework
To support market growth and help clients navigate the impact of geopolitical shifts, DBMR has integrated in-depth supply chain analysis into its Global Renewable Energy Connector Market research reports. This addition empowers clients to respond effectively to global changes affecting their industries. The supply chain analysis section includes detailed insights such as Global Renewable Energy Connector Market consumption and production by country, price trend analysis, the impact of tariffs and geopolitical developments, and import and export trends by country and HSN code. It also highlights major suppliers with data on production capacity and company profiles, as well as key importers and exporters. In addition to research, DBMR offers specialized supply chain consulting services backed by over a decade of experience, providing solutions like supplier discovery, supplier risk assessment, price trend analysis, impact evaluation of inflation and trade route changes, and comprehensive market trend analysis.
Data collection and base year analysis are done using data collection modules with large sample sizes. The stage includes obtaining market information or related data through various sources and strategies. It includes examining and planning all the data acquired from the past in advance. It likewise envelops the examination of information inconsistencies seen across different information sources. The market data is analysed and estimated using market statistical and coherent models. Also, market share analysis and key trend analysis are the major success factors in the market report. To know more, please request an analyst call or drop down your inquiry.
The key research methodology used by DBMR research team is data triangulation which involves data mining, analysis of the impact of data variables on the market and primary (industry expert) validation. Data models include Vendor Positioning Grid, Market Time Line Analysis, Market Overview and Guide, Company Positioning Grid, Patent Analysis, Pricing Analysis, Company Market Share Analysis, Standards of Measurement, Global versus Regional and Vendor Share Analysis. To know more about the research methodology, drop in an inquiry to speak to our industry experts.
Data Bridge Market Research is a leader in advanced formative research. We take pride in servicing our existing and new customers with data and analysis that match and suits their goal. The report can be customized to include price trend analysis of target brands understanding the market for additional countries (ask for the list of countries), clinical trial results data, literature review, refurbished market and product base analysis. Market analysis of target competitors can be analyzed from technology-based analysis to market portfolio strategies. We can add as many competitors that you require data about in the format and data style you are looking for. Our team of analysts can also provide you data in crude raw excel files pivot tables (Fact book) or can assist you in creating presentations from the data sets available in the report.


